



Abstract
Background
The maximum standardized uptake value normalized to body weight (BW) (SUVmax) is a commonly used metric in 18F-fluorodeoxyglucose (FDG) positron emission tomography (PET) imaging for assessing tumor aggressiveness and response to therapy. However, SUVmax is sensitive to changes in BW, potentially leading to inaccuracies in patients with cancer cachexia or obesity. The maximum standardized uptake value normalized to lean body mass (SULmax) has been proposed as a more reliable alternative, particularly in contexts where BW fluctuations are significant. This study aimed to evaluate the relative performance of SUVmax and SULmax in identifying high-grade transformation of chronic lymphocytic leukemia (CLL) and follicular lymphoma (FL) into more aggressive lymphomas.
Methods
We conducted a retrospective, single-center analysis of PET/computed tomography (CT) scans from patients with CLL or FL, measuring the most avid lesion using both SUVmax and SULmax. High-grade transformation was identified through pathological records within 3 months after the scan, and receiver operating characteristic curves were used to compare the diagnostic performance of SUVmax and SULmax.
Results
A total of 32 patients with CLL and 58 with FL were included. Some patients had more than one biopsy, giving a total of 43 samples for CLL and 91 samples for FL. The receiver operating curve analysis showed insufficient evidence (P=0.92) of a statistical difference between SUVmax and SULmax in predicting transformation for CLL, with an area under the curve (AUC) of 0.918 for SUVmax and 0.921 for SULmax. In FL, SULmax also showed similar performance (AUC =0.754) to SUVmax (AUC =0.745) for predicting transformation to diffuse large B-cell lymphoma, with the difference again not significant (P=0.93). When grade 3B FL was also considered to be transformed lymphoma, SUVmax was effectively equal (P=0.96) to SULmax (AUC =0.932 and 0.931, respectively). Optimal cutoffs were about 7 to 8 for both diseases using SUVmax, and 5 for CLL or transformation of FL to a higher-grade lymphoma, but 9 if grade 3B was not counted.
Conclusions
Both SUVmax and SULmax can be reliably used for assessing the transformation of CLL and FL to aggressive lymphomas on 18F-FDG PET/CT. Given SULmax’s stability with respect to weight changes, it may be more appropriate for assessing therapeutic response in patients with significant weight fluctuations. Further studies are needed to refine the use of these metrics in clinical practice.
Keywords: Standardized uptake value (SUV), positron emission tomography (PET), quantitation, lymphoma, transformation
Introduction
Positron emission tomography (PET) with 2-deoxy-2-[18F]fluoro-D-glucose (18F-FDG) is a standard part of staging and response assessment in Hodgkin and non-Hodgkin lymphomas. Standardized uptake values, normalized to (most commonly) either body weight (BW) (usually referred to simply, as SUV as BW is the most common value used for normalization by far) or lean body mass (LBM) (SUL by analogy with SUV), can provide quantitative information relevant to the underlying biology of the tumor. When transformation to high-grade lymphoma is suspected from indolent lymphomas such as low-grade follicular lymphoma (FL) or chronic lymphocytic leukemia (CLL), clinicians will often use maximum SUVs to target which lesion to biopsy or whether further work up is needed.
In practice, an SUV is a number defined for every voxel in the image. As a summary statistic for tumors, the maximum standardized uptake value (SUVmax), the most intense voxel, is usually used, mostly due to its reproducibility. Due to the relatively poor spatial resolution of a PET scan, the exact outline of a tumor can be difficult to determine, but the most intense pixel is the same every time, as it is usually far from the border of the tumor due to the blurring effect at the border of the tumor with normal tissue (which is usually less avid). It is also clinically relevant, as dedifferentiated tumors can be more avid, at least with 18F-FDG. For this reason, SUVmax is the most widely used uptake-based metric.
The formula for SUVmax involves local concentration divided by injected dose of radiotracer over patient weight, placing the weight in the numerator of the fraction. As a result, increases in BW, if other factors are stable, will increase SUVmax. Therefore, SUVmax will vary depending on patient’s BW, potentially introducing a source of bias and impacting the ability of SUVmax to predict disease transformation.
SUL has been proposed to account for changes in body mass due to adipose tissue, which has a relatively low biodistribution of 18F-FDG. The LBM, calculated from height and total BW, is substituted for the total BW in the SUV formula, producing a value that is more robust to changes in adipose tissue with time. SUL is used in some response assessment methodologies such as Positron Emission Tomography Response Criteria in Solid Tumors (PERCIST) (1). By using LBM, the SUL may be a more reproducible method of assessing disease activity. Usually, the SULmax (the brightest SUL voxel) is used in a similar fashion to SUVmax, though methodologies such as PERCIST will use other, related variables such as SULpeak (which uses a weighted average of uptake in a small volume around the highest uptake voxel).
As expected, SUV is more sensitive to BW than SUL (2,3), resulting in higher values for liver and mediastinal blood pool in heavier patients (4). One of the few studies on benign applications (vasculitis) suggests SUL may be less affected by fat and patient sex (5), and another finds it may be less affected by differences between PET-magnetic resonance (PET-MR) and PET-computed tomography (PET-CT) (6). However, studies on repeatability metrics using 18F-FDG show similar results for SUV and SUL (7,8), including derivative metrics such as SUVmax and SULpeak (9). Studies on other quantitative metrics, such as radiomics, calculations of precision, and supine versus prone imaging, show uptake variables behave similarly (10-12) and are highly correlated (8,13).
Although there is relatively little data available in lymphoma apart from a study showing SUVmax correlates better with aggressiveness (14), existing studies show both SUV and SUL are associated with response to therapy in other malignancies (15,16). Studies on breast cancer suggested SUV might be better for prognostication (17) or show a tiny advantage for differentiating benign versus malignant lesions (18) and another suggested its correlation with antigen Kiel 67 (Ki-67) may be closer (19). However, other studies on lung (20-22) and nasopharyngeal (23) cancer showed no difference. Among more recent studies, anal cancer (24) showed similarity for prognostication with a tiny advantage of SUVmax. SUVmax may be better for segmenting metabolic tumor volume (25), according to a single colon cancer study, but SUL values may be better at predicting response to therapy of gastrointestinal stromal tumors (26), recurrence of hepatocellular carcinoma after transplant (27) and assessing liver fibrosis (28).
Of course, there is no reason the same metric should be optimal (or useful) in every malignancy. Any advantage of SUV vs. SUL may be disease-specific. When used to assess for possible transformation of low-grade lymphoproliferative disease to higher-grade disease, a cutoff threshold of 5, usually using SUV, has been proposed for Richter’s transformation from CLL (29-34). A later article (one of the few to actually examine the difference between BW and LBM calculations) gives a cutoff of 5.3, but this is for LBM (SUL); the cutoff for total BW (SUV) is 9.0 (35). Yet another gives similar cutoff values of approximately 5 for both SUV and SUL (36). For FL, the value of these metrics is controversial (37), but SUVs over 10–13 are likely to indicate transformation (38,39), even if a clear cutoff is absent (40). Given the general lack of clarity as to whether SUV or SUL is more suitable for judging the presence of transformation, the current study evaluated the performance of 18F-FDG PET/CT for identifying high-grade transformation of CLL or FL, with attention to comparing the relative performance of SUV or SUL as standardization methods. We present this article in accordance with the STARD reporting checklist (available at https://qims.amegroups.com/article/view/10.21037/qims-2024-2740/rc).
Methods
We conducted a single-center, retrospective analysis of radiologic and pathologic records. We queried our imaging database, a picture archival and communication system (PACS) used for clinical imaging and covering seven hospitals in our network, for 18F-FDG PET/CT scans with the text strings ‘CLL’ and ‘follicular’ for CLL and FL, respectively, between April 2022 and August 2023 (consecutive sampling, Figure 1). The most avid lesion (which would influence the decision to biopsy) in the nodal basin used for biopsy was identified and measured using both total BW (for SUV) and LBM (for SUL) using MIM software (MIM, Cleveland, OH, USA). Calculated LBM was confirmed to follow the James equation (41), which uses height as well as BW to estimate LBM: (men); (women).
Figure 1.
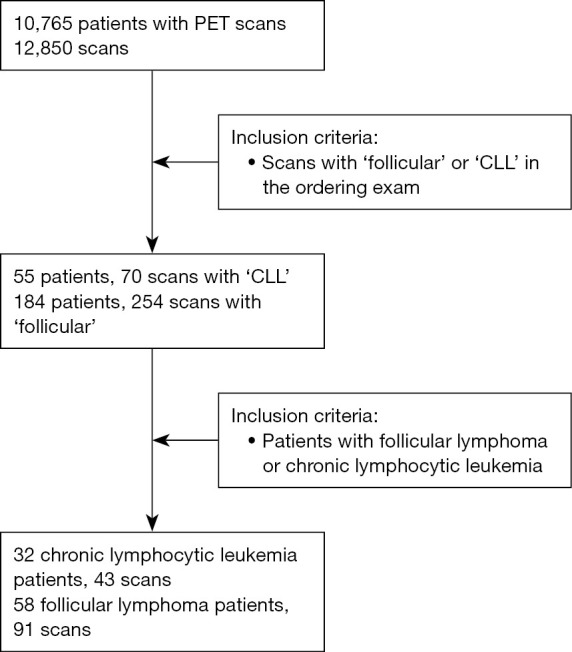
Flow of patients through study. CLL, chronic lymphocytic leukemia; PET, positron emission tomography.
Using PASS Version 20.0.8, power analysis indicated that a sample of 53 would be sufficient to find a 0.1 difference in AUC with a power of 0.8 and a P value of 0.05. The study was approved by the Institutional Review Board at the University of North Carolina (IRB #23-2003) and performed in accordance with the Declaration of Helsinki and its subsequent amendments. Informed consent was waived for this minimal-risk, retrospective analysis.
Patient records were reviewed for pathologic specimens within 3 months after a corresponding scan, with the presence of high-grade disease/transformation coded as a binary variable. Identification of diffuse large B-cell lymphoma (DLBCL), Hodgkin lymphoma, or grade 3B FL was considered a high-grade transformation. As some patients had multiple PET/CT scans and therefore multiple scan values and corresponding biopsies, a mixed-effects logistic regression model was implemented to generate predicted probabilities, modeling the binary outcome as a function of SUV or SUL. A random intercept patient term was included to account for within-patient correlations. The predicted probabilities from this mixed model were used to generate receiver operating characteristic (ROC) curves. For each outcome, we compared the area under the curve (AUC) for SUV and SUL computing standard errors for the AUC statistic using jackknifing. These analyses used SAS version 9.4 (SAS Institute, Cary, North Carolina, USA). We also completed a sensitivity analysis in which grade 3B FL was additionally counted toward the transformation outcome. Patients without a biopsy were not included.
Reconstructions methods varied across the hospitals and scanners. Of the 5 scanners used, the Siemens Biograph 20 mCT and the SOMATOM used a 3D ordered-subset expectation maximization (OSEM) reconstruction algorithm with 2 iterations and 21 subsets with time-of-flight imaging, the Siemens Biograph 128 mCT and TruePoint 40 used 4 iterations and 21 subsets with point-spread-function estimation (the Biograph also used time-of-flight), the Horizon used 4 iterations and 10 subsets with time-of-flight, the TruePoint 6 used 3 iterations and 21 subsets with point-spread-function estimation, and the Discovery Image Quotient (IQ) used a VUE (Virtual Unenhanced) Point High Definition (VPHD) reconstruction. Voxel size in all cases was 4.07 mm in-plane and 2 mm (Biograph 20), 3 mm (Biograph 128, TruePoint 40, and TruePoint 6), or 5 mm (SOMATOM) out-of-plane, except the Horizon, which was 4.11 mm in-plane and 2.5 mm out-of-plane, and the Discovery IQ, which was 2.73 mm in-plane and 3.26 mm out-of-plane.
Results
Initial searches revealed 55 patients with 70 scans (some patients had more than one scan) for the text string ‘CLL’ and 184 patients with 254 scans with the report containing the text string ‘follicular’. As the text string ‘follicular’ could refer to diseases other than FL and not all patients in either case had histology, in the final analysis a total of 32 patients [8 (25.0%) women] met criteria for inclusion for CLL and 58 (37 (63.8%) women) for FL (Table 1). Some patients had more than one scan and biopsy, giving a total of 43 samples for CLL and 91 samples for FL, which could be correlated with a given scan within 3 months. Preliminary descriptive data are provided in Table 1. The average body mass index (BMI) was 27, and values by SUVmax were 43% higher than by SULmax, on average. A graph of the relationship between the ratio of BMI and SUV/SULmax is provided in Figure 2.
Table 1. Demographic and average BMI data.
| Disease | Chronic lymphocytic leukemia | Follicular lymphoma |
|---|---|---|
| Patients | 32 | 58 |
| Gender | ||
| Female | 8 | 37 |
| Male | 24 | 21 |
| Samples | 43 | 91 |
| Race | ||
| White | 25 | 48 |
| Black | 5 | 8 |
| Other races | 2 | 2 |
| BMI (kg/m2) | 27 [18–51] | 28 [17–47] |
| Transformations | 13 (8 DLBCL, 3 BLCL, 2 HL) | 5 DLBCL, 3 grade 3B follicular |
| Age at scan (years) | 69 [41–86] | 65 [34–89] |
Data are presented as number or mean [range]. BMI, body mass index; BLCL, B-lymphoid cell line lymphoma; DLBCL, diffuse large B-cell lymphoma; HL, Hodgkin’s lymphoma.
Figure 2.
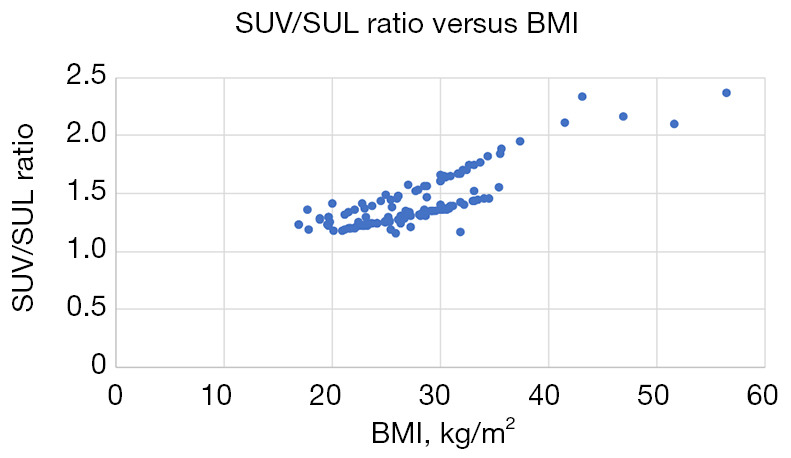
BMI plotted against the ratio of total body weight to lean body mass (the conversion factor from SUL to SUV) for the described patient cohort. The two roughly parallel curves are due to the different coefficients in the James equation for men and women. BMI, body mass index; SUL, standardized uptake value normalized to lean body mass; SUV, standardized uptake value normalized to total body weight.
Of the 134 scans, 58 used a Siemens Biograph 20 mCT, 42 used a Siemens Biograph 128 mCT, 15 used a Siemens TruePoint 40, 12 used a Siemens Biograph Horizon, 4 used a GE Discovery IQ, 2 used a Siemens TruePoint 6, and 1 used a Siemens SOMATOM Definition AS. Reconstruction details for these scanners are provided above. Scans were performed at a total of five hospitals within our hospital network (some hospitals used more than one scanner).
In the CLL group, SUVmaxes varied from 1.5 to 45.6, with a median of 3.2, a mean of 7.5, and a standard deviation of 8.7. SULmaxes varied from 1.0 to 26.2, with a median of 2.4, a mean of 5.4, and a standard deviation of 5.7. The substantially higher mean than median reflects a positively skewed distribution. In the FL group, SUVmaxes varied from 1.0 to 29.5, with a median of 8.1, a mean of 8.9, and a standard deviation of 5.2. SULmaxes varied from 0.9 to 24.2, with a median of 5.7, a mean of 6.3, and a standard deviation of 5.2. The mean is again higher than the median, though to a lesser degree.
Areas under the curve for transformation of low-grade FL or CLL to high-grade lymphoma, as well as estimated noninferiority margins, are given in Table 2. The curves themselves are given in Figures 3-5. Figure 6 shows a large SUV-SUL difference. Optimal cutoffs for the curves using Youden’s index are given in Table 3.
Table 2. Statistical results of comparison.
| Disease | SUV | SUL | P value (SUV-SUL) | Lower bound of CI for non-inferiority margin | |||
|---|---|---|---|---|---|---|---|
| AUC (95% CI) | SE | AUC (95% CI) | SE | ||||
| Follicular, transformation outcome | 0.745 (0.584–0.906) | 0.082 | 0.754 (0.542–0.965) | 1.08 | 0.93 | 0.186 | |
| Follicular, high-grade outcome (incl. grade 3B) | 0.932 (0.878–0.987) | 0.028 | 0.931 (0.873–0.989) | 0.030 | 0.96 | 0.063 | |
| Chronic lymphocytic leukemia, transformation outcome | 0.918 (0.835–1.000) | 0.043 | 0.921 (0.839–1.000) | 0.041 | 0.92 | 0.046 | |
AUC, area under the curve; CI, confidence interval; incl., including; SE, standard error; SUL, standardized uptake value normalized to lean body mass; SUV, standardized uptake value normalized to total body weight.
Figure 3.

ROC curves for the transformation of follicular lymphoma to a higher-grade lymphoma for SUV and SUL. AUC, area under the curve; ROC, receiver operating characteristic; SUL, standardized uptake value normalized to lean body mass; SUV, standardized uptake value normalized to total body weight.
Figure 4.

ROC curves for the transformation of lower grades of follicular lymphoma to grade 3B for SUV and SUL. AUC, area under the curve; ROC, receiver operating characteristic; SUL, standardized uptake value normalized to lean body mass; SUV, standardized uptake value normalized to total body weight.
Figure 5.

ROC curves for the transformation of chronic lymphocytic leukemia to higher-grade lymphoma for SUV and SUL. AUC, area under the curve; ROC, receiver operating characteristic; SUL, standardized uptake value normalized to lean body mass; SUV, standardized uptake value normalized to total body weight.
Figure 6.

SUL (left) and SUV (right) on a patient with a particularly large difference using a 10-step color map. The SUL of the axillary node is 2.7; the SUV, 7.5. SUL, standardized uptake value normalized to lean body mass; SUV, standardized uptake value normalized to total body weight.
Table 3. Optimal cutoffs for maximizing AUC-SUV and AUC-SUL.
| Disease | AUC-SUV | AUC-SUL |
|---|---|---|
| Follicular, transformation outcome | 8.13 | 9.47 |
| Follicular, high-grade outcome (incl. grade 3B) | 7.4 | 5.5 |
| CLL, transformation outcome | 7.14 | 5.45 |
AUC-SUV, area under the curve for standardized uptake value to total body weight; AUC-SUL, area under the curve for standardized uptake value normalized to lean body mass; CLL, chronic lymphocytic leukemia; incl., including.
Performance was excellent for CLL, fair to poor for FL counting only transformation to DLBCL, and good for FL including transformation to grade 3B FL.
Discussion
Overall, SULmax performed statistically identically to SUVmax in identifying high-grade transformation of CLL or FL. It is thus likely that both metrics can be used for this purpose with comparable reliability. Of note, our study was not powered to detect a difference less than 0.1 in ROC, so smaller differences in performance between the two approaches could not be excluded. However, the measured differences are so small (0.001 to 0.009) that it is likely any actual difference is relatively small. Overall, the non-inferiority of SULmax suggests that at centers that use that metric, there should be confidence in its reliability for detecting transformation to high-grade lymphomas.
SULmax’s greater reproducibility and insensitivity to changes in weight may make it more useful for assessing response to therapy within an individual, as changes in weight due to steroid use, recovery, or cancer cachexia will not affect that measure; however, a comparative assessment of longitudinal imaging in individual patients is beyond the scope of the current analysis.
A significant limitation of our study from the technical point of view is the heterogeneity of the scanners used; there is no guarantee that an SUVmax of 5 (or any other value) is truly the “same” value on two different scanners. However, as many institutions (including our own) may have multiple scanners and not be able to schedule patients on a specific instrument due to workflow issues, and patients may move between multiple institutions and thus multiple scanners as a result of care, we would argue that this actually reflects existing clinical practice and is more directly applicable than a single-institution, single-scanner study.
The relatively small size also limits the ability to do subgroup analysis; it is entirely possible that SUV or SUL might do significantly better with men or women (the equation varies by sex, as discussed below), very obese people or non-obese people (as weight is a term in the equation), or people treated with B-cell receptor signaling pathway inhibitors, which can change the utility of maximum uptake (42). However, given the small size, it is unlikely there would be any significant findings in this dataset after corrections for multiple comparisons.
We listed the most avid lesion in the appropriate nodal basin. It is possible that, as it is difficult to register the most avid lesions with the precise lesions used for biopsy in a retrospective study, the most avid node does not correspond precisely with the nodes selected for biopsy, theoretically affecting diagnostic accuracy. While the most avid nodes are usually among the largest, this is not universal and represents another limitation of the study.
There are challenges with operationalizing SULmax (or any SUL-based variable) in clinical practice. There is not a clear consensus regarding how best to calculate LBM. The most common formula is the James equation (as used in this analysis), which uses a negative quadratic term and becomes less accurate at very high BMI (43), in particular over 35 kg/m2, peaking at BMI of 43 kg/m2 for men and 37 kg/m2 for women. Other formulas addressing limitations of the James equation for BMIs over 35 kg/m2 have been suggested (43), with some researchers even suggesting nation-specific corrections for LBM (44). Sex differences may be relevant as well (45), as the James equation and most of the attempts to correct it have different coefficients by sex. There have been suggestions to calculate the LBM directly from CT (43,46-48), but this is impractical in many centers with current typical imaging software. However, we did not observe this limitation of the James equation to a significant degree in our study. SULmax also requires documentation of patient height and cannot be retrospectively calculated if height is not assessed (49), so it is important to consistently document height when using it.
It is an interesting question as to why the effect on assessment is so minuscule when total BW can differ so much, particularly given the obesity epidemic. Usually, however, the total BW will differ from LBM by less than a factor of two, which is dwarfed by the large variations in SUVmax or SULmax in our sample. Given the variety of cutoffs estimated in the literature, the relationship between SUVmax or SULmax and likelihood of transformation is likely a spectrum of probabilities rather than an absolute binary, and the important thing is to use a consistent variable. In this regard, SUL likely has the advantage, given potential changes in BW in patients over time.
Additionally, given the slight differences in performance noted in our study and elsewhere, it is worth noting whether a value in the literature uses SUVmax or SULmax (or some other variable). Many publications do not specify, with some conspicuous exceptions such as Albano et al., which gives separate cutoffs for SUVmax and SULmax (35), and extrapolation of results to other clinical contexts may therefore be problematic. These findings also suggest the need to explicitly communicate with one’s oncology colleagues as to whether SUVmax or SULmax is being used in routine clinical reads and the implications of the metrics being reported.
Conclusions
SUVmax and SULmax can be used similarly for assessment of transformation of CLL or FL to aggressive lymphomas on 18F-FDG PET/CT, although SULmax may have practical advantages. SULmax’s stability with regard to weight changes may make it more useful when assessing response to therapy in the broader context, although the additional information required to calculate SULmax may limit its applicability in some centers.
Supplementary
The article’s supplementary files as
Acknowledgments
None.
Ethical Statement: The authors are accountable for all aspects of the work in ensuring that questions related to the accuracy or integrity of any part of the work are appropriately investigated and resolved. The study was approved by the Institutional Review Board at the University of North Carolina (IRB #23-2003) and performed in accordance with the Declaration of Helsinki and its subsequent amendments. Informed consent was waived for this minimal-risk, retrospective analysis.
Footnotes
Reporting Checklist: The authors have completed the STARD reporting checklist. Available at https://qims.amegroups.com/article/view/10.21037/qims-2024-2740/rc
Funding: None.
Conflicts of Interest: All authors have completed the ICMJE uniform disclosure form (available at https://qims.amegroups.com/article/view/10.21037/qims-2024-2740/coif). N.S.G. reports grant support from Regeneron and BMS, consulting fees from Genentech, OnoPharma, Janssen, SeaGen, ADC Therapeutics, and KITe, and has participated in a data safety monitoring board or advisory board with BMS, Regeneron, and Novartis. C.E.D. reports consulting fees from ADC, Beigene and Genmab. Royalties from Springer publishing. The other authors have no conflicts of interest to declare.
Data Sharing Statement
Available at https://qims.amegroups.com/article/view/10.21037/qims-2024-2740/dss
References
- 1.Wahl RL, Jacene H, Kasamon Y, et al. From RECIST to PERCIST: Evolving Considerations for PET response criteria in solid tumors. J Nucl Med 2009;50 Suppl 1:122S-50S. 10.2967/jnumed.108.057307 [DOI] [PMC free article] [PubMed] [Google Scholar]
- 2.Kuruva M, Mittal BR, Abrar ML, et al. Multivariate analysis of various factors affecting background liver and mediastinal standardized uptake values. Indian J Nucl Med 2012;27:20-3. 10.4103/0972-3919.108835 [DOI] [PMC free article] [PubMed] [Google Scholar]
- 3.Demir Y, Sürücü E, Şengöz T, et al. Liver metabolic activity changes over time with neoadjuvant therapy in locally advanced rectal cancer. Nucl Med Commun 2016;37:116-21. 10.1097/MNM.0000000000000412 [DOI] [PubMed] [Google Scholar]
- 4.Sarikaya I, Albatineh AN, Sarikaya A. Revisiting Weight-Normalized SUV and Lean-Body-Mass-Normalized SUV in PET Studies. J Nucl Med Technol 2020;48:163-7. 10.2967/jnmt.119.233353 [DOI] [PubMed] [Google Scholar]
- 5.van Praagh GD, Nienhuis PH, de Jong DM, et al. Toward Reliable Uptake Metrics in Large Vessel Vasculitis Studies. Diagnostics (Basel) 2021;11:1986. 10.3390/diagnostics11111986 [DOI] [PMC free article] [PubMed] [Google Scholar]
- 6.Tanaka A, Sekine T, Ter Voert EEGW, et al. Reproducibility of Standardized Uptake Values Including Volume Metrics Between TOF-PET-MR and TOF-PET-CT. Front Med (Lausanne) 2022;9:796085. 10.3389/fmed.2022.796085 [DOI] [PMC free article] [PubMed] [Google Scholar]
- 7.Groshar D, Bernstine H, Goldberg N, et al. Reproducibility and repeatability of same-day two sequential FDG PET/MR and PET/CT. Cancer Imaging 2017;17:11. 10.1186/s40644-017-0113-9 [DOI] [PMC free article] [PubMed] [Google Scholar]
- 8.Humbert O, Riedinger JM, Chardin D, et al. SUV calculation in breast cancer: which normalization should be applied when using 18F-FDG PET? Q J Nucl Med Mol Imaging 2019;63:399-407. 10.23736/S1824-4785.18.03006-6 [DOI] [PubMed] [Google Scholar]
- 9.Crombé A, Gauquelin L, Nougaret S, et al. Diffusion-weighted MRI and PET/CT reproducibility in epithelial ovarian cancers during neoadjuvant chemotherapy. Diagn Interv Imaging 2021;102:629-39. 10.1016/j.diii.2021.05.007 [DOI] [PubMed] [Google Scholar]
- 10.Werner RA, Bundschuh RA, Bundschuh L, Lapa C, Yin Y, Javadi MS, Buck AK, Higuchi T, Pienta KJ, Pomper MG, Lodge MA, Gorin MA, Rowe SP. Semiquantitative Parameters in PSMA-Targeted PET Imaging with [18F]DCFPyL: Impact of Tumor Burden on Normal Organ Uptake. Mol Imaging Biol 2020;22:190-7. [DOI] [PMC free article] [PubMed] [Google Scholar]
- 11.Cui Y, Lin Y, Zhao Z, Long H, Zheng L, Lin X. Comprehensive 18F-FDG PET-based radiomics in elevating the pathological response to neoadjuvant immunochemotherapy for resectable stage III non-small-cell lung cancer: A pilot study. Front Immunol 2022;13:994917. 10.3389/fimmu.2022.994917 [DOI] [PMC free article] [PubMed] [Google Scholar]
- 12.Guo B, Hu L, Cai Q, et al. Precision of quantitative parameters of (18)F-FDG PET/CT in a rabbit VX2 tumor model. Quant Imaging Med Surg 2023;13:3816-26. 10.21037/qims-22-1079 [DOI] [PMC free article] [PubMed] [Google Scholar]
- 13.Whisenant JG, Williams JM, Kang H, et al. Quantitative Comparison of Prone and Supine PERCIST Measurements in Breast Cancer. Tomography 2020;6:170-6. 10.18383/j.tom.2020.00002 [DOI] [PMC free article] [PubMed] [Google Scholar]
- 14.Jia Q, Wang A, Liu Y, et al. Diagnostic value of baseline 18 F-FDG PET/CT and peripheral blood inflammatory markers for aggressive lymphoma in non-Hodgkin's lymphoma. Nucl Med Commun 2025;46:60-6. 10.1097/MNM.0000000000001912 [DOI] [PMC free article] [PubMed] [Google Scholar]
- 15.Aujay G, Debordeaux F, Blanc JF, et al. 18F-choline PET-computed tomography for the prediction of early treatment responses to transarterial radioembolization in patients with hepatocellular carcinoma. Nucl Med Commun 2021;42:633-8. 10.1097/MNM.0000000000001383 [DOI] [PubMed] [Google Scholar]
- 16.Kedves A, Tóth Z, Emri M, et al. Predictive Value of Diffusion, Glucose Metabolism Parameters of PET/MR in Patients With Head and Neck Squamous Cell Carcinoma Treated With Chemoradiotherapy. Front Oncol 2020;10:1484. 10.3389/fonc.2020.01484 [DOI] [PMC free article] [PubMed] [Google Scholar]
- 17.Incoronato M, Grimaldi AM, Cavaliere C, et al. Relationship between functional imaging and immunohistochemical markers and prediction of breast cancer subtype: a PET/MRI study. Eur J Nucl Med Mol Imaging 2018;45:1680-93. 10.1007/s00259-018-4010-7 [DOI] [PubMed] [Google Scholar]
- 18.Kayadibi Y, Karagoz SH, Kurt SA, et al. Diagnostic Characteristics and Clinical Relevance of Incidental Hypermetabolic Breast Lesions Detected on (18)F-FDG PET-CT: A Retrospective Evaluation. Acad Radiol 2025;32:1806-15. 10.1016/j.acra.2024.11.031 [DOI] [PubMed] [Google Scholar]
- 19.Kurt SA, Besli LU, Kayadibi Y, et al. Is there a potential biomarker in distinguishing invasive breast carcinomas with elevated Ki-67 levels among 2D-SWE, SMI, and 18F-FDG PET-CT/MRI-derived parameters?: A single-center data. J Clin Ultrasound 2023;51:148-57. 10.1002/jcu.23300 [DOI] [PubMed] [Google Scholar]
- 20.Koh YW, Lee SJ, Park SY. (18)F-fluorodeoxyglucose positron emission tomography is correlated with the pathological necrosis and decreased microvessel density in lung adenocarcinomas. Ann Nucl Med 2019;33:93-102. 10.1007/s12149-018-1309-1 [DOI] [PubMed] [Google Scholar]
- 21.Sun M, Lu D, Li X, et al. Combination of circulating tumor cells and 18F-FDG PET/CT for precision diagnosis in patients with non-small cell lung cancer. Cancer Med 2024;13:e70216. 10.1002/cam4.70216 [DOI] [PMC free article] [PubMed] [Google Scholar]
- 22.Hughes DJ, Josephides E, O'Shea R, Manickavasagar T, Horst C, Hunter S, Tanière P, Nonaka D, Van Hemelrijck M, Spicer J, Goh V, Bille A, Karapanagiotou E, Cook GJR. Predicting programmed death-ligand 1 (PD-L1) expression with fluorine-18 fluorodeoxyglucose ([18F]FDG) positron emission tomography/computed tomography (PET/CT) metabolic parameters in resectable non-small cell lung cancer. Eur Radiol 2024;34:5889-902. [DOI] [PMC free article] [PubMed] [Google Scholar]
- 23.Zhang Y, Hu Y, Zhao S, et al. The Utility of (18)F-FDG-PET-CT Metabolic Parameters in Evaluating the Primary Tumor Aggressiveness and Lymph Node Metastasis of Nasopharyngeal Carcinoma. Clin Med Insights Oncol 2024;18:11795549231225419. 10.1177/11795549231225419 [DOI] [PMC free article] [PubMed] [Google Scholar]
- 24.Zwarthoed C, Jaraudias C, Evesque L, et al. Prognostic Values of Pre- and Post-Therapeutic FDG-PET in Anal Canal Cancer: Analysis of a Prospective Study. Clin Colorectal Cancer 2025;24:256-263.e8. 10.1016/j.clcc.2025.01.006 [DOI] [PubMed] [Google Scholar]
- 25.Kido H, Kato S, Funahashi K, et al. The metabolic parameters based on volume in PET/CT are associated with clinicopathological N stage of colorectal cancer and can predict prognosis. EJNMMI Res 2021;11:87. 10.1186/s13550-021-00831-5 [DOI] [PMC free article] [PubMed] [Google Scholar]
- 26.Wu C, Wen F, Lin F, et al. Predictive performance of (18)FF-fibroblast activation protein inhibitor (FAPI)-42 positron emission tomography/computed tomography (PET/CT) in evaluating response of recurrent or metastatic gastrointestinal stromal tumors: complementary or alternative to (18)Ffluorodeoxyglucose (FDG) PET/CT? Quant Imaging Med Surg 2024;14:5333-45. 10.21037/qims-24-192 [DOI] [PMC free article] [PubMed] [Google Scholar]
- 27.Kang S, Kim JD, Choi DL, et al. Predicting the Recurrence of Hepatocellular Carcinoma after Primary Living Donor Liver Transplantation Using Metabolic Parameters Obtained from (18)F-FDG PET/CT. J Clin Med 2022;11:354. 10.3390/jcm11020354 [DOI] [PMC free article] [PubMed] [Google Scholar]
- 28.Shinzato R, Nishie A, Tamaki T, et al. Prediction of Early-stage Liver Fibrosis Using FDG-PET/CT. Anticancer Res 2023;43:4221-7. 10.21873/anticanres.16614 [DOI] [PubMed] [Google Scholar]
- 29.Bruzzi JF, Macapinlac H, Tsimberidou AM, et al. Detection of Richter's transformation of chronic lymphocytic leukemia by PET/CT. J Nucl Med 2006;47:1267-73. [PubMed] [Google Scholar]
- 30.Papajík T, Mysliveček M, Urbanová R, Buriánková E, Kapitáňová Z, Procházka V, Turcsányi P, Formánek R, Henzlová L, Flodr P, Jarošová M, Indrák K. 2-[18F]fluoro-2-deoxy-D-glucose positron emission tomography/computed tomography examination in patients with chronic lymphocytic leukemia may reveal Richter transformation. Leuk Lymphoma 2014;55:314-9. [DOI] [PubMed] [Google Scholar]
- 31.Karam M, Novak L, Cyriac J, et al. Role of fluorine-18 fluoro-deoxyglucose positron emission tomography scan in the evaluation and follow-up of patients with low-grade lymphomas. Cancer 2006;107:175-83. 10.1002/cncr.21967 [DOI] [PubMed] [Google Scholar]
- 32.Conte MJ, Bowen DA, Wiseman GA, et al. Use of positron emission tomography-computed tomography in the management of patients with chronic lymphocytic leukemia/small lymphocytic lymphoma. Leuk Lymphoma 2014;55:2079-84. 10.3109/10428194.2013.869801 [DOI] [PMC free article] [PubMed] [Google Scholar]
- 33.Wang Y, Rabe KG, Bold MS, et al. The role of 18F-FDG-PET in detecting Richter's transformation of chronic lymphocytic leukemia in patients receiving therapy with a B-cell receptor inhibitor. Haematologica 2020;105:2675-8. 10.3324/haematol.2019.240564 [DOI] [PMC free article] [PubMed] [Google Scholar]
- 34.Albano D, Rizzo A, Racca M, Muoio B, Bertagna F, Treglia G. The Diagnostic Performance of 2-[18F]FDG PET/CT in Identifying Richter Transformation in Chronic Lymphocytic Leukemia: An Updated Systematic Review and Bivariate Meta-Analysis. Cancers (Basel) 2024;16:1778. [DOI] [PMC free article] [PubMed] [Google Scholar]
- 35.Albano D, Camoni L, Rodella C, Giubbini R, Bertagna F. 2-[18F]-FDG PET/CT Role in Detecting Richter Transformation of Chronic Lymphocytic Leukemia and Predicting Overall Survival. Clin Lymphoma Myeloma Leuk 2021;21:e277-83. [DOI] [PubMed] [Google Scholar]
- 36.Albano D, Calabrò A, Dondi F, et al. 2-(18)F-FDG PET/CT Semiquantitative and Radiomics Predictive Parameters of Richter's Transformation in CLL Patients. Medicina (Kaunas) 2024;60:203. 10.3390/medicina60020203 [DOI] [PMC free article] [PubMed] [Google Scholar]
- 37.Ding CY, Sun J, Li TN, Xu W. Prognostic Value of Maximum Standard Uptake on Pretreatment 18F-FDG PET/CT Scan in Newly Diagnosed Follicular Lymphoma. Zhongguo Shi Yan Xue Ye Xue Za Zhi 2015;23:1331-5. 10.7534/j.issn.1009-2137.2015.05.020 [DOI] [PubMed] [Google Scholar]
- 38.Noy A, Schöder H, Gönen M, et al. The majority of transformed lymphomas have high standardized uptake values (SUVs) on positron emission tomography (PET) scanning similar to diffuse large B-cell lymphoma (DLBCL). Ann Oncol 2009;20:508-12. 10.1093/annonc/mdn657 [DOI] [PMC free article] [PubMed] [Google Scholar]
- 39.Schöder H, Noy A, Gönen M, et al. Intensity of 18fluorodeoxyglucose uptake in positron emission tomography distinguishes between indolent and aggressive non-Hodgkin's lymphoma. J Clin Oncol 2005;23:4643-51. 10.1200/JCO.2005.12.072 [DOI] [PubMed] [Google Scholar]
- 40.Xie M, Wang L, Jiang Q, et al. Significance of initial, interim and end-of-therapy (18)F-FDG PET/CT for predicting transformation risk in follicular lymphoma. Cancer Cell Int 2021;21:394. 10.1186/s12935-021-02094-5 [DOI] [PMC free article] [PubMed] [Google Scholar]
- 41.Fraum TJ, Fowler KJ, Crandall JP, et al. Measurement Repeatability of (18)F-FDG PET/CT Versus (18)F-FDG PET/MRI in Solid Tumors of the Pelvis. J Nucl Med 2019;60:1080-6. 10.2967/jnumed.118.218735 [DOI] [PMC free article] [PubMed] [Google Scholar]
- 42.Mato AR, Wierda WG, Davids MS, et al. Utility of positron emission tomography-computed tomography in patients with chronic lymphocytic leukemia following B-cell receptor pathway inhibitor therapy. Haematologica 2019;104:2258-64. 10.3324/haematol.2018.207068 [DOI] [PMC free article] [PubMed] [Google Scholar]
- 43.Tahari AK, Chien D, Azadi JR, et al. Optimum lean body formulation for correction of standardized uptake value in PET imaging. J Nucl Med 2014;55:1481-4. 10.2967/jnumed.113.136986 [DOI] [PMC free article] [PubMed] [Google Scholar]
- 44.Tsuchitani T, Takahashi Y, Maeda Y, et al. Investigation of appropriate semi-quantitative index for assessment of esophageal and breast cancer treatment response in Japanese patients using (18)F-FDG PET/CT findings. Hell J Nucl Med 2019;22:20-4. 10.1967/s002449910955 [DOI] [PubMed] [Google Scholar]
- 45.Keramida G, Peters AM. The appropriate whole body metric for calculating standardised uptake value and the influence of sex. Nucl Med Commun 2019;40:3-7. 10.1097/MNM.0000000000000935 [DOI] [PMC free article] [PubMed] [Google Scholar]
- 46.Kim WH, Kim CG, Kim DW. Comparison of SUVs Normalized by Lean Body Mass Determined by CT with Those Normalized by Lean Body Mass Estimated by Predictive Equations in Normal Tissues. Nucl Med Mol Imaging 2012;46:182-8. 10.1007/s13139-012-0146-8 [DOI] [PMC free article] [PubMed] [Google Scholar]
- 47.Shang J, Tan Z, Cheng Y, et al. A method for evaluation of patient-specific lean body mass from limited-coverage CT images and its application in PERCIST: comparison with predictive equation. EJNMMI Phys 2021;8:12. 10.1186/s40658-021-00358-7 [DOI] [PMC free article] [PubMed] [Google Scholar]
- 48.Riauka TA, Baracos VE, Reif R, et al. Rapid Standardized CT-Based Method to Determine Lean Body Mass SUV for PET-A Significant Improvement Over Prediction Equations. Front Oncol 2022;12:812777. 10.3389/fonc.2022.812777 [DOI] [PMC free article] [PubMed] [Google Scholar]
- 49.Tahari AK, Wahl RL. Quantitative FDG PET/CT in the community: experience from interpretation of outside oncologic PET/CT exams in referred cancer patients. J Med Imaging Radiat Oncol 2014;58:183-8. 10.1111/1754-9485.12140 [DOI] [PMC free article] [PubMed] [Google Scholar]
Associated Data
This section collects any data citations, data availability statements, or supplementary materials included in this article.
Supplementary Materials
The article’s supplementary files as
Data Availability Statement
Available at https://qims.amegroups.com/article/view/10.21037/qims-2024-2740/dss