



ABSTRACT
Background
Epileptic disorders are a heterogeneous group of neurological conditions, with many cases linked to monogenic causes, particularly in developmental and epileptic encephalopathies (DEE). Identifying pathogenic variants aids treatment, prognosis, and family planning. In France, genetic testing is coordinated through the EpiGene network.
Methods
We analyzed clinical and genetic data from 2563 epilepsy patients referred to four diagnostic labs (2016–2023). Epilepsy syndromes were classified via pre‐test questionnaires, and genotyping used various gene panels, including a 68‐gene core panel. Multivariate logistic regression assessed diagnostic rates and genotype–phenotype correlations.
Results
Overall, 27.0% of patients had pathogenic/likely pathogenic variants, mainly within the core panel (24%). SCN1A and KCNQ2 were the most frequently mutated genes. Diagnostic yield varied by syndrome, with Dravet Syndrome Spectrum (DSS) and early‐infantile DEE (EIDEE) showing the highest rates (41% and 34%, respectively). Genetic heterogeneity differed across syndromes, from DSS (predominantly SCN1A) to Infantile Epileptic Spasms Syndrome (IESS, 12%), involving ≥ 26 genes. Outside DEE, self‐limited neonatal epilepsy (SeLNE) had the highest yield (50%). Earlier seizure onset was associated with a higher likelihood of a positive molecular diagnosis, whereas intellectual disability severity and drug resistance were not independently predictive of diagnostic outcome. Genotype–phenotype correlations highlighted that objective clinical data (e.g., age of onset) can outperform syndrome labels (e.g., EIDEE) in predicting diagnosis.
Conclusion
This large cohort study refines the genetic landscape of epilepsy, informs classification challenges, and enhances genetic testing strategies, ultimately improving patient care and future research directions.
Keywords: Dravet syndrome; genetic testing; genetics, medical; Lennox Gastaut syndrome; Spasms, infantile
This cohort of 2563 patients is one of the largest published epilepsy genetic studies, achieved in a clinical routine setup. The anonymized clinical and genetic information are provided as a resource for future research. Detailed per‐syndrome and per‐gene analysis have been performed.

1. Introduction
Epileptic disorders with monogenic determinism can benefit from genetic diagnosis. The different epilepsy syndromes are typically classified based on the age of the seizure onset and the type of seizures. Among epilepsies that begin early in childhood, two groups are particularly linked to a monogenic cause: (i) Developmental and Epileptic Encephalopathies (DEE). This is a severe group of epilepsies characterized by frequent, treatment‐resistant seizures, accompanied by a deviation in developmental trajectory (resulting, to varying extents, from both the deleterious effects of recurrent seizures and the underlying etiology) (ii) Self‐limited epilepsies of neonates and infancy, which are often characterized by normal interictal EEG, and for which the developmental trajectory stays in the normal range whatever the frequency of seizures [1, 2, 3, 4]. After 2 years of age, presumed‐monogenic epilepsies usually belong to three main epilepsy syndromes: self‐limited focal epilepsies (SeLFEs), generalized epilepsy syndromes (including Idiopathic Generalized Epilepsy) and DEEs [5]. At any age, a small but significant proportion of focal epilepsies, whether linked to a structural brain anomaly or not, whether familial or not, are linked to a monogenic etiology and undergo genetic exploration. Overall, it has been estimated that 40%–80% of DEE have an underlying genetic monogenic cause [2, 6].
Identifying disease‐causing variants in these epilepsies is crucial for counseling patients and at‐risk family members regarding disease prognosis and reproductive planning. In addition, knowledge of the causative variant can help guide the choice of antiseizure medication and personalize treatment, such as prescribing sodium channel blockers (SCBs) after identifying a loss of function of KCNQ2, or a gain of function of SCN1A, SCN2A, SCN8A; or conversely avoiding SCBs after identifying a loss of function in sodium channels alpha subunits [7, 8].
Previous studies have reported cohorts of varying sample sizes utilizing multigene panel sequencing, exome, or genome analysis, but these efforts were often constrained by limited cohort sizes [9, 10, 11, 12, 13] or insufficiently detailed clinical descriptions [14, 15, 16].
In France, genetic diagnosis with Next‐generation Sequencing has been organized since 2015 by the EpiGene network, which now includes 9 hospital laboratories [17]. Four of these (Paris, Lyon, Marseille and Rennes) have collected phenotypic and genetic data associated with samples referred to them.
We here evaluate the performance of a multi‐gene panel sequencing on a large sample of patients referred for the diagnosis of a suspected genetic epilepsy. Since the vast majority of cohorts with epilepsy have been studied in a research context, the aims of this study are (i) to estimate in a real‐life series of patients referred for diagnosis the rate of pathogenic or likely pathogenic (P/LP) variants; (ii) to establish phenotype–genotype correlations based on a syndromic diagnostic approach; and (iii) to propose an appropriate diagnostic strategy for monogenic forms of epilepsy. We analyzed this cohort using a multivariate model, which is well‐suited to the diverse clinical data of our cohort, often exhibiting interdependence.
In addition, we provide here the individual data of the full cohort, as an open resource for the medical and scientific community (Table S2).
2. Patients and Methods
2.1. Patients
Patients with epilepsy referred to one of the four centers (Paris, Lyon, Marseille, and Rennes laboratories, Figure S3) between 2016 and 2023 were included. Structured clinical information was collected through the use of a standardized form, filled by the referring clinician, in which the main clinical criteria were reported, such as the age at examination, the age at first seizures, seizure frequency, seizure types, epilepsy syndromes, etc.… When the age at seizure onset was not available and the age at testing was < 12 months, the age at testing was utilized as a proxy for the age at seizure onset.
To classify patients' epilepsy, we either took into account the syndrome diagnosed or suspected by the referring clinician or, when this information was not available, we manually examined the clinical data provided by the questionnaire and/or clinical reports in order to include each patient in one of the following categories:
EIDEE (Early Infantile DEE)
DEE 3–12 m*
DEE > 12 m*
Lennox–Gastaut syndrome
Epilepsy with myoclonic atonic seizures
Infantile epileptic spasms syndrome
Dravet Syndrome spectrum (DSS)***
EE‐SWAS (Epileptic Encephalopathy with Spike Wave Activation during Sleep) or
EE‐SWAS (Landau–Kleffner syndrome)**
Self‐limited epilepsy with centrotemporal spikes
Epilepsy of infancy with migrating focal seizures
GEFS+ (Genetic Epilepsy with Febrile Seizure plus)
Progressive myoclonic epilepsies
Unspecified self‐limited epilepsy
Unspecified focal epilepsy
Intellectual disability with seizures/epilepsy
Idiopathic Generalized Epilepsy
Other****
*Since the category EIDEE (onset < 3 m) was defined by the ILAE committee [18], we introduced both categories DEE 3–12 m and DEE > 12 m for patients with DEE who could not match with well‐defined syndromes, often due to a lack of data.*
**EE‐SWAS subtype, indicated as “Landau–Kleffner” in the clinical questionnaire.
***patients reported as (i) “Dravet” or “Dravet‐like,” or (ii) the combination of “febrile seizures plus or Dravet syndrome or fever‐sensitive epilepsy” with either “DEE,” some degree of ID, or ID unknown/too young.
****Patients with no category available and who did not meet the criteria for a manually ascribed classification.
2.2. Gene Panel Screening
Gene panel sequencing was performed in university diagnosis laboratories through various methods & libraries (Supplemental Methods), with a common list of 68 genes that we named the core panel (Table S1). One center (5.4% of the cohort) performed exome sequencing, with analysis of the core panel.
Variants were analyzed with multiple bioinformatic solutions and interpreted according to the ACMG classification. Both single nucleotide and copy number variants (SNV, CNV) could be detected with the different strategies, except for one center (19.8% of the cohort) where CNV were not detected. CNVs were confirmed either by chromosome microarray, Multiplex Ligation‐dependent Probe Amplification, or by quantitative Real‐Time PCR. Both pathogenic or likely pathogenic variants reported as causal for the epilepsy were collected. When available, the parent's DNA was tested in order to study familial segregation of the variants. Of note, patients with progressive myoclonic epilepsy (PME) evocative of Unverricht‐Lundborg disease were first tested for CSTB expansion prior to sequencing.
2.3. Statistical Analyses
To measure the significant enrichment or depletion of diagnoses in each category, Welch's t‐test was performed for every category against the mean diagnostic rate of the entire cohort.
To study the association between molecular diagnosis outcome (positive or negative) and each clinical characteristic, relevant features were selected using bivariate chi‐square analysis (scipy‐1.14.0). Only features with p‐value < 0.05 were selected.
Then, a multivariate analysis was performed using logistic regression (statsmodels 0.14.1) on the relevant clinical characteristics. In this context of multiple testing, p‐values were adjusted for False Discovery Rate using the Benjamini/Hochberg procedure.
3. Results
3.1. General Characteristics of the Cohort
A gene panel was sequenced in 2563 patients with epilepsy referred to 4 laboratories between 2016 and 2023. DEE was the most frequent indication (66%, n = 1701). Other indications (34%, n = 862) are described in Table 1. Table 1 shows the rate of patients with P/LP variants as a function of the general characteristics of the studied cohort.
TABLE 1.
General characteristics of the cohort.
| Features | Molecular diagnostic rate a | Proportion of the cohort (number of cases) |
|---|---|---|
| Laboratory | ||
| Paris | 0.26 | 56.38% (n = 1445) |
| Lyon | 0.24 | 18.38% (n = 471) |
| Marseilles | 0.19 | 19.82% (n = 508) |
| Rennes | 0.19 | 5.42% (n = 139) |
| Gender | ||
| Male | 0.22 | 49.32% (n = 1264) |
| Female | 0.25 | 50.68% (n = 1299) |
| Intellectual disability | ||
| Too young or not known | 0.31 | 39.17% (n = 1004) |
| No ID | 0.17 | 14.82% (n = 380) |
| With ID | 0.20 | 47.33% (n = 1213) |
| Yes (severity not reported) | 0.21 | 3.47% (n = 89) |
| Mild | 0.17 | 8.74% (n = 224) |
| Moderate | 0.16 | 11.08% (n = 284) |
| Severe | 0.22 | 14.32% (n = 367) |
| Profound | 0.26 | 8.39% (n = 215) |
| Seizure onset | ||
| ≤ 1 m | 0.40 | 14.05% (n = 360) |
| 1–3 m | 0.30 | 10.22% (n = 262) |
| 3–12 m | 0.28 | 32.58% (n = 835) |
| 1–5 years | 0.15 | 25.36% (n = 650) |
| > 5 years | 0.09 | 11.82% (n = 303) |
| Unknown | 0.22 | 5.97% (n = 153) |
| Epilepsy characteristic | ||
| Drug‐resistant | 0.22 | 44.99% (n = 1153) |
| Drug‐sensitive | 0.24 | 37.69% (n = 966) |
| No_familial_history | 0.23 | 63.95% (n = 1639) |
Abbreviations: EIDEE, early infantile developmental epileptic encephalopathy; GEFS+, generalized epilepsy with febrile seizure plus; SeLIE, self‐limited infantile epilepsy; SeLNE, self‐limited neonatal epilepsy; SWAS, spike and wave activity during sleep.
Diagnostic rate of the core panel of 68 genes.
A total of 691 (27.0%) patients were reported with a positive molecular diagnostic (pathogenic or likely pathogenic variants (P/LP)), 476 (69%) being classified in DEE. Of note, 617/691 (90%) of diagnostics were made in a gene of the core panel (68 genes systematically sequenced in all patients – Table S1).
Among the patients with a genetic diagnosis, 0.7% (5/710) had a dual genetic diagnosis, that is, two different genetic alterations in two different genes. Our five cases with a dual genetic diagnosis had variants in KCNT1 | SCN2A.
CDKL5 | DEPDC5, KCNQ2 | PRRT2, EPM2A | PRRT2 and SCN1A | SCN2A. As expected, their phenotypes primarily aligned with the most severe of the two diseases (Table S3).
41 P/LP copy number variants (CNV) were identified, accounting for 3.4% of the patients with a genetic diagnosis. Among these, 17/41 were large recurrent microdeletions or microduplications, and 24/41 were small intragenic deletions or duplications.
Multivariate analysis performed on relevant characteristics showed that core panel yield was significantly higher in patients with early seizure onset or Dravet syndrome; it decreased in those with infantile epileptic spasm syndrome, even after adjustment for False Discovery Rate (Figure 1).
FIGURE 1.
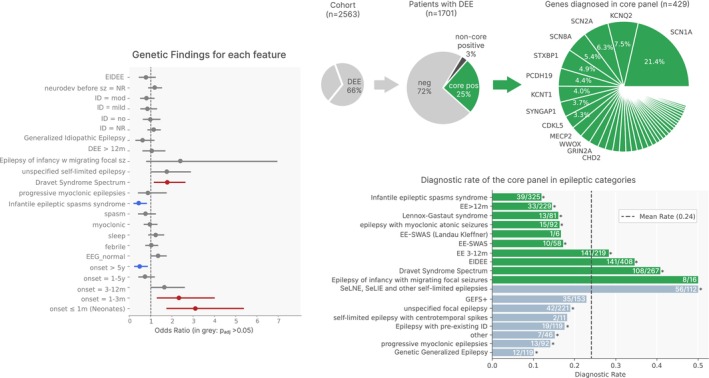
Diagnostic rates in the cohort. Left: Multivariate analysis (logistic regression) to analyze the features independently associated with an increase of molecular diagnosis. Right, top: Diagnostic yield of the core panel (“core”), and genes diagnosed in Developmental and Epileptic Encephalopathy (DEE), N.B, the dual diagnoses were not counted twice; neg, negative result; pos, positive result. Bottom: diagnostic rate of the core panel in each epileptic category. ID, intellectual disability; SWAS, spike and wave activity during sleep. The diagnostic rate of the considered syndrome is compared to that of the entire cohort, with “*” when the difference is significant.
Interestingly, several clinical features commonly associated with a high rate of positive molecular diagnosis (e.g., ID, DEE, drug‐resistance, early self‐limited epilepsy) were not significant predictors in our multivariate model, suggesting that, when the combined influence of other epilepsy features is taken into account, particularly early age of onset, these factors alone are not sufficient to predict a positive molecular diagnosis. Moreover, patients with age at seizure onset above 5 years were significantly less likely to have positive results, regardless of the syndrome.
Also, the overall multivariate model performance was low (Accuracy: 0.76, Precision: 0.57, Recall: 0.10, F1 Score: 0.16, ROC‐AUC: 0.71), stressing the difficulty of differentiating the positive and negative cases based on the available phenotype.
3.2. The Genetic Landscape of Epileptic Syndromes
3.2.1. DEE
When combining all the patients with DEE (n = 1701), the diagnostic yield of the core panel of genes was 25.0%. In most cases, the sequencing included genes outside the core panel, leading to an additional molecular diagnostic yield of 3%. Despite this sequencing heterogeneity, the top most frequently mutated genes belong to the core panel (Table S1). SCN1A was the most frequently implicated gene, representing more than 1/5 of diagnoses in patients with DEE (Figure 1).
KCNQ2 was the second most frequently identified gene in DEE. Most of the KCNQ2 variants were missense variants (88%), in good agreement with the dual phenotypic severity, haploinsufficient variants leading to self‐limited epilepsy. Only four putative Loss‐of‐Function (pLoF, i.e., nonsense, frameshift, canonical splicing variant, large deletion) KCNQ2 variants were identified in DEE cases. Of these, two were tested during their third week of life and were reported as neonatal epileptic encephalopathy. The third, who was reported with IESS and mild ID, had her first seizure at 4 months of age; interestingly, her variant was identified with a low allelic fraction in blood (5%) suggesting mosaicism. As this finding did not fully explain the phenotype, later exome sequencing revealed a pathogenic homozygous missense in SLC39A8. The last one, with an age at onset of 1 month and drug‐sensitive seizures, had a familial history (father and aunt) of neonatal seizures with mild ID; of note, the KCNQ2 pLoF variant was inherited from the affected father.
CNVs were identified in 30 cases of DEE (6.6%), including 26 deletions, 2 duplications, and 2 triplications (See 4. Discussion).
3.2.1.1. Early‐Infantile DEE and Undefined DEE of Later Onset
The combination of the three DEE syndromes (EIDEE, DEE 3‐12 m and DEE > 12 m) added up to 877, representing 34% of the entire cohort. Altogether, the diagnostic rate of the core panel of 68 genes reached 28%. As expected, earlier seizure onset was associated with a higher rate of positive molecular diagnosis.
In EIDEE, the core panel achieved a 34% diagnostic rate. The top‐3 genes were KCNQ2 (n = 30), SCN2A (n = 19), and STXBP1 (n = 11) resulting in nearly half of all diagnoses. The sequencing of genes outside the core panel, when performed, increased the diagnostic yield to +3.2%.
The core panel achieved a diagnostic rate of 28% for DEE with seizure between 3 months and 1 year of age (EE 3‐12 m). Its yield was lower for DEE starting after 1 year of age, with only 14% of positive molecular diagnoses.
3.2.1.2. Dravet Syndrome Spectrum (DSS)
DSS corresponded to patients reported as (i) “Dravet” or “Dravet‐like,” or (ii) the combination of “febrile seizures plus or Dravet syndrome or fever‐sensitive epilepsy” with either “DEE,” some degree of ID, or ID unknown/too young. DSS (n = 267, 10%) had the second highest positive diagnosis yield, with SCN1A‐altering variants in more than 75% of the cases with a positive molecular diagnosis. SCN1A was followed by PCDH19, accounting for an additional 7% rate (n = 8). The rest of the positive cases with DSS had variants in 11 different genes: 4 in GABRA1, 3 in GABRG2, 2 in CHD2, IQSEC2, and MBD5, and 1 in ALDH7A1, ATP1A3, GABRB3, SCN8A, STXBP1, or WWOX. The clinical diagnosis of DSS in the 4 patients with a molecular diagnosis in ALDH7A1, ATP1A3, STXBP1, or WWOX was unexpected, but the first three had febrile seizures, whereas the last one had hemiconvulsive seizures. All four were very young (2.5–12 m). Of note, the age at seizure onset seemed to be similar between the patients with or without a positive molecular diagnosis (Figure 2).
FIGURE 2.
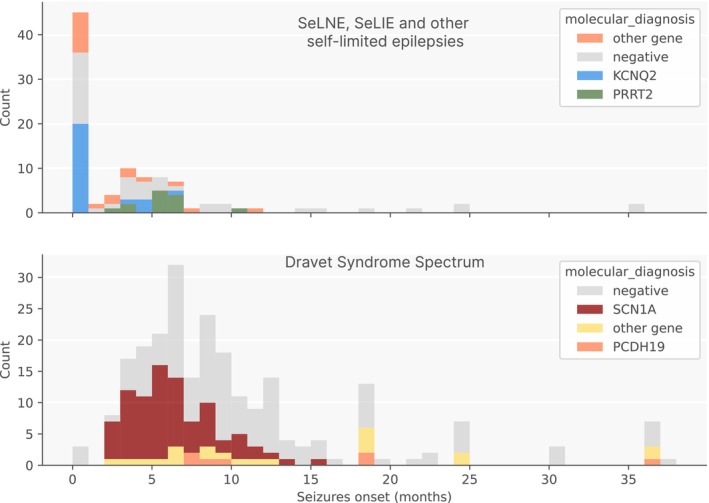
Seizure onset in self‐limited epilepsy, mostly neonatal or infantile, and Dravet Syndrome Spectrum categories.
In order to examine in greater detail the difficulties involved in classifying epilepsy syndrome, particularly DSS, we carried out pairwise comparisons (Fisher's exact test) of the four following groups (Figure 3):
DSS (patients with DSS, n = 267).
SCN1A pLoF (patients with a SCN1A predicted loss‐of‐function variant‐nonsense, frameshift, canonical splicing variant, large deletion—“pLoF” as molecular diagnosis, n = 65).
DSS Neg (Suspected Dravet spectrum patients without P/LP variant, n = 157).
GEFS+ (patients a priori suspected to have a GEFS+).
FIGURE 3.
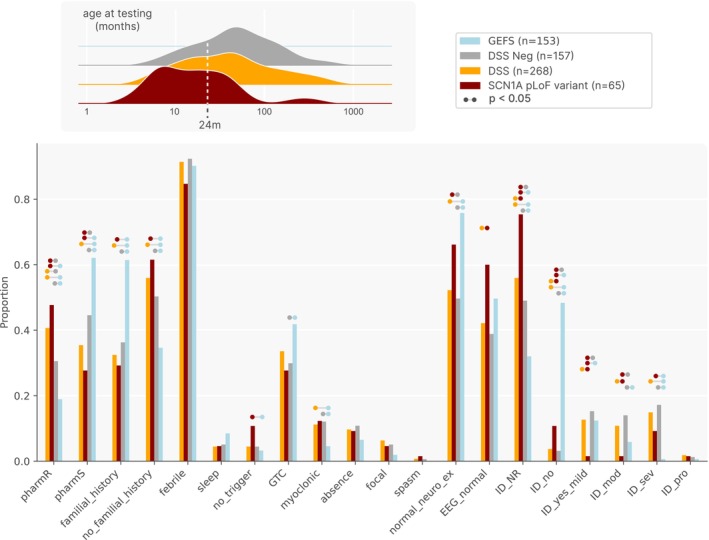
Comparison of patients having DSS with those whose molecular diagnosis was a loss‐of‐function variant in SCN1A. GTC, generalized tonic clonic; ID, intellectual disability; normal_neuro_ex, normal neurologic examination; pLoF, putative loss‐of‐function variant.
As expected, patients with GEFS+ were significantly more likely to have drug‐sensitive epilepsy, a family history, or no ID compared with the other three groups. Interestingly, the proportion of cases without ID or with not reported (“NR”) ID status was significantly higher in patients with SCN1A pLoF than in clinically diagnosed patients with DSS (p: 0.030 and 0.004, respectively). In addition, 19/65 (29%) of patients with SCN1A pLoF variants were not classified as having DSS. Nine were classified as “GEFS+” without ID or non‐reported ID since they were too young to have developed ID at the time of the sampling (Figure 3). The others were classified as DEE or Intellectual disability with seizures/epilepsy.
Overall, this analysis showed that patients with SCN1A pLoF variants were tested earlier than the patients with a DSS, and before developing ID. Since these patients developed early severe and drug‐resistant (febrile) seizures, child neurologists request molecular diagnosis before the onset of ID. This could explain why some of the youngest patients with SCN1A pLoF were not reported as DSS.
3.2.1.3. Infantile Epileptic Spasms Syndrome
The second largest clinical category was infantile epileptic spasms syndrome (IESS), encompassing 325 patients, with a low diagnostic rate of 12%. Searching for clinical factors distinguishing patients with and without molecular diagnoses, we did not find that the age at spasms onset or the degree of intellectual disability was statistically different between the two groups of patients (t‐test with p = 0.43, Mann–Whitney U test with p = 0.10). Of the 53 patients with IESS and a positive molecular diagnosis, 43 cases (81%) involved genes included in the core panel. The genetic landscape of these patients was notably heterogeneous, with pathogenic variants identified in a total of 26 different genes, of which 16 were part of the core panel. The top‐3 genes were CDKL5, STXBP1, and SCN8A in 7, 7, and 6 patients, respectively. Of note, one patient with IESS had a triplication of UBE3A and GABRB3, initially identified using the panel sequencing and further confirmed with SNP array.
arr[GRCh37] 15q11.2q13.1(24826558_28544359)x4, with duplication in neighboring regions: arr[GRCh37] 15q11.2(22784095_24826558)x3.
3.2.1.4. Epilepsy With Myoclonic‐Atonic Seizures
Epilepsy with myoclonic‐atonic seizures (EMASz) (n = 92), formerly known as Doose Syndrome, had a low diagnostic rate of 16.3% (n = 15), with about half of the disease‐causing variants identified in SYNGAP1 (7/15). This diagnostic rate is comparable to that of a previous study; although SYNGAP1 is more prevalent in our cohort [19]. Moreover, the main clinical characteristics did not differ significantly between the cases with and without a positive molecular diagnosis, except for the seizure drug‐sensitivity/resistance (test; p < 0.05, also see Figure S1). The second most frequent mutated gene was SLC6A1 (4/15).
3.2.1.5. Other DEE
Among the 16 patients with epilepsy of infancy with migrating focal seizures, eight had a diagnosis, with four of these cases involving mutations in KCNT1 (see below). In contrast, Lennox–Gastaut syndrome (n = 82), EE‐SWAS (n = 59), and EE‐SWAS_Landau–Kleffner (n = 6) had a low diagnostic rate of ~17%. In patients with Lennox–Gastaut, the core panel yielded 17% (14/82) of molecular diagnoses, without any recurring gene, except for MECP2 (n = 2). This large genetic heterogeneity was possibly related to the clinical challenge of accurately classifying Lennox–Gastaut syndrome [20].
3.2.2. Other Epilepsy Syndromes
Patients with non‐DEE epilepsy accounted for 33% of our cohort, including very diverse syndromes ranging from self‐limited epilepsy to progressive myoclonic epilepsy. Overall, the diagnostic yield of the core panel was 21%.
3.2.2.1. Self‐Limited Epilepsies
The diagnostic yield of the core panel was highest in patients with self‐limited epilepsy (n = 112), overrepresented by very early seizure onset (median = 3 months), corresponding to self‐limited neonatal or infantile epilepsy. Approximately half of the diagnosed cases exhibited disease‐causing variants within the KCNQ2 gene, followed by PRRT2 (20%). Cumulatively, P/LP variants within these two genes accounted for two thirds of the molecular diagnoses in patients with self‐limited neonatal or infantile epilepsy. As expected, KCNQ2 and PRRT2 cases differed in seizure onset, with a median of 3 days and 5 months, respectively (Figure 3).
3.2.2.2. Focal Epilepsy
Two hundred twenty‐one patients were referred with focal epilepsy, without specification of any particular epileptic syndrome. The diagnosis rate was 19%. The top four genes identified were DEPDC5 (n = 11), KCNT1 (n = 7, of these 6/7 presented with autosomal dominant nocturnal frontal lobe epilepsy), PCDH19 (n = 5), and PRRT2 (n = 4). Comparison of age at first seizure revealed a significant difference between positive and negative cases, with a much younger age observed in the positive cases (T‐statistic: 3.42, p‐value < 0.001, also see Figure S2). No significant difference in drug resistance was observed between patients with or without a molecular diagnosis. Among the 89 patients (40%) with a family history of seizures, the diagnostic rate of the core panel was high (24%) with a mode of inheritance mostly dominant. Of note, the focal nature of the seizures in relatives was most often not known. For the patients with no positive family history, the diagnostic rate was 16%.
3.2.2.3. Progressive Myoclonic Epilepsy
For the 92 patients with a clinical presentation consistent with Progressive Myoclonic Epilepsy (PME), the core‐panel sequencing was performed as a second‐tier test, following CSTB expansion analysis, when the age at onset was consistent with Unverricht‐Lundborg disease. The diagnostic rate was low (13%); no clinical characteristics could distinguish between patients with and without a positive molecular diagnosis. Half of the individuals with a molecular diagnosis (8/15) had variants in PME‐related genes (NHLRC1, n = 2; SCARB2, n = 2; KCNC1, n = 1; CSTB, n = 2, and EPM2A, n = 1). The remaining identified genes were mostly associated with DEE (ARHGEF9, FRRS1L, SCN1A, STXBP1, CACNA1A, and ATP1A3). Of note, the two individuals with CSTB variants were compound heterozygotes for an expansion and a classic variant. The first had the variant NM_000100.3:c.168 + 1G>A in trans with a dodecamer expansion. She had a phenotype concordant with PME patients with a pathogenic biallelic dodecamer expansion, without developmental or intellectual repercussions at age 19. The second had a 4.5 Mb deletion arr[GRCh37] 21q22.3[43564675_48090317]x1 encompassing the complete sequence of CSTB, in trans with a pathogenic expansion in CSTB. She presented with a much more severe PME phenotype: the age of the first seizure was 2.5 years; she had severe intellectual disability at age 15.
3.2.2.4. Genetic Generalized Epilepsy (GGE)
This category achieved the lowest diagnostic rate (12/119, 10%). Of note, three patients had a pathogenic de novo variant in SLC6A1, previously described in myoclonic‐atonic epilepsy (OMIM 616421). Two other child patients (one hemizygous, one heterozygous) had a P/LP variant in NEXMIF most often associated with intellectual developmental disorder, X‐linked 98 (OMIM 300912), but interestingly, they were both reported in patients without ID. While GGE have been typically defined without developmental delay, 35 patients (30%) had various degrees of ID [21]. However, patients with ID or abnormal development before seizure did not have a much higher diagnostic rate (15%, 7/48). Indeed, the diagnostic rate of patients without ID was 12% (11/84), with P/LP variants in 9 different genes (NEXMIF, SLC6A1, SCN1A, SCN8A, HCN1, MEF2C, GABRG2, PRRT2, and CDKL5). Interestingly, the patient carrying the LP variant NM_001323289.2(CDKL5):c.79G>T, p.(Val27Leu) was a male, exhibiting an allelic fraction of 42%, suggesting a milder phenotype related to mosaicism.
3.3. Phenotype–Genotype Correlations
A phenotype–genotype correlation analysis was performed on patients who had a P/LP variant in one of the top genes (at least 10 patients with a causative variant in the 14 first genes). The univariate analysis of each main clinical characteristic for each of the top genes was performed with Fisher's exact test. Since this analysis found expected associations (SCN1A and febrile trigger, KCNT1 and Epilepsy of infancy with migrating focal seizures, PCDH19 with female, DEPDC5 and unspecified focal epilepsy) it established additional phenotype–genotype correlations.
GRIN2A was involved in two thirds (n = 8/12) of the mutated patients with EE with spike–wave activation in sleep (EE‐SWAS), reflecting a very strong association (OR = 43.2, adjusted p = 1.10E‐9, Figure 4) as already suggested [22, 23].
FIGURE 4.
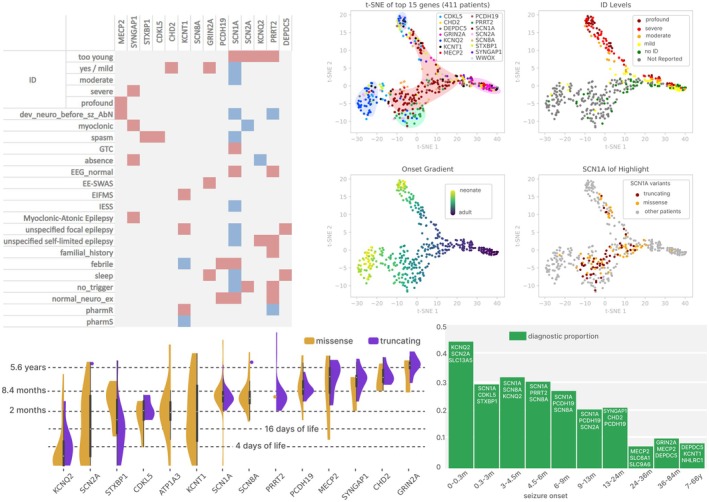
Gene‐based analysis of epileptic phenotypes. Top, left: Summary of the gene‐to‐phenotype associations for the 14 top genes. Red: Odds Ratio > 1, Blue: Odds Ratio < 1, pale gray: Not significant (adjusted p > 0.05). EEG, electroencephalography; EE‐SWAS, epileptic encephalopathy with spike–wave activation in sleep; EIMFS, epilepsy of infancy with migrating focal seizures; GTC, generalized tonic–clonic; ID, intellectual disability; IESS, Infantile Epileptic Spasms Syndrome; here, “unspecified self‐limited epilepsy” referred to the category “SeLNE, SeLIE and other self‐limited epilepsies”. Top, right: multidimensional reduction plotting by t‐distributed stochastic neighbor embedding, using only the clinical characteristics as dimensions (sex, suspected syndrome, drug‐resistance, familial history, intellectual disability degree, seizure type, onset), without using the diagnosed gene. Bottom, left: seizure onset distribution of the main genes. Bottom, right: diagnostic proportion for all syndromes for each onset bin. The top‐3 genes of each bin are displayed in white.
Spasms were only reported in 2.3% of SCN1A cases, revealing a strong inverse association between SCN1A and spasms (OR = 13.64, adjusted p = 2.54E‐07). The presence of spasms could hence orient the diagnosis toward another gene than SCN1A. Conversely, CDKL5 and STXBP1 cases showed a significant association with spasms and IESS (Figure 4).
PRRT2 was the only gene significantly enriched in cases with a familial history (OR = 3.32, adjusted p = 0.015). The variants were mostly pLoF except for one missense: NM_145239.3:c.835C>G p.(Pro279Ala). Except for one patient with a late onset (12 years), the patients had a seizure onset between 2.5 and 10 months.
In our cohort, SYNGAP1 was highly associated with myoclonic‐atonic epilepsy (MAE) (OR = 18.15, adjusted p = 2.20E‐05), emphasizing its relative specificity in this syndrome [24]. Thirty‐nine percent (7/18) of the patients with a P/LP variant in SYNGAP1 were assessed as having epilepsy with myoclonic‐atonic seizures, in contrast to a previous finding of 5.3% [24].
Epilepsy of infancy with migrating focal seizures (EIMFS) was specifically enriched with variants in KCNT1, OR = 33.09, adjusted p = 0.0022, respectively. KCNT1 was also the gene most associated with drug‐resistant epilepsy (OR = 6.04, adjusted p = 0.0021), highlighting the particular epileptic phenotype associated with KCNT1.
As expected, variants in MECP2 were statistically clustered with both a profound ID and neurodevelopmental signs before seizures [25].
When comparing the distribution of the age at first seizure across different genes, several genes displayed a tight clustering (Figure 4). For example, KCNQ2 displayed a consistent neonatal incidence of the first seizure, whereas the PRRT2 period was clustered between 2 and 10 months. GRIN2A also displayed a clustered age of the first seizure, around 5 years of age. In contrast, seizure onset was highly variable in SCN2A and KCNT1, without any visible clustering, extending from the neonatal to the adult period. No clear difference between missense and pLoF variants was observed; the visible difference for STXBP1 was not statistically significant (t‐test, p‐value: 0.90).
To test whether patients could be more accurately classified on the basis of their clinical features, we performed a dimension reduction algorithm for patients with a diagnosis in one of the 14 major genes (n = 411). Indeed, our univariate analysis might miss a phenotype‐to‐genotype association based on the combination of several features acting together, rather than a single feature alone. Our gene‐blind approach consisted of taking into account the 20 main clinical characteristics as dimensions (gender, suspected syndrome, drug resistance, family history, degree of intellectual disability, type of seizure, onset, etc.), without taking into account the responsible gene.
Multidimensional reduction plotting using t‐distributed stochastic neighbor embedding (t‐SNE) was used to visualize the phenotypic landscape of the 411 positive patients in the top genes. t‐SNE visualization demonstrated tight clustering of KCNQ2, PRRT2, and GRIN2A, suggesting a consistent phenotypic spectrum (Figure 4). Other genes displayed a large phenotypic spectrum, like SCN1A and SCN8A, both located in the middle region of the map, or SCN2A, overlapping both KCNQ2 and PRRT2 regions. However, no gene formed a pure cluster; every region showed some degree of overlap between different genes. This suggests that either the t‐SNE approach may not be fully sufficient to distinguish phenotypic clusters for each gene or that the precise gene‐phenotype relationships themselves are inherently difficult to delineate, with significant overlap across gene spectra.
4. Discussion
4.1. A Shared Experience of 4 Laboratories Over a 10‐Year Period
We provide the detailed phenotypic and genetic information of 2563 epileptic patients from a diagnostic cohort. To ensure accurate interpretation of the gene panel, detailed clinical data were meticulously collected prior to sequencing. This collection of clinical data prior to sequencing represents a significant strength of our cohort, as it captures the initial clinical observation and conclusion of the treating physician, without being influenced by the results of the subsequent molecular diagnosis. This approach reflects the real‐world clinical context in which molecular diagnoses for epilepsy are made. The recruitment of the four laboratories seems to be different from one to another in terms of distribution of syndromes but also in occurrence and severity of ID (Figure S2). It depends on multiple factors including the demography of the population catchment area and the health care network, which may slightly differ from one region to another in France. Moreover, the historical research projects of each center played a significant role in shaping recruitment efforts, particularly during the early stages of molecular diagnosis. On the other hand, the time between the first seizures and the sampling for genetic diagnosis is homogeneous between laboratories, probably reflecting the same efficiency of clinical networks across the country: a “rare epilepsy” clinical network has been set up, in association with a network of laboratories (EPIGENE).
The clinical data are crucial for accurate interpretation of molecular variants. However, for a fraction of patients, clinical data were missing. One example is the high number of patients (n = 448, 18%) presenting with DEE without being further classified in one of the established DEE categories. We hence introduce here two categories DEE 3–12 m and DEE > 12 m to account for the incomplete clinical description of epileptic patients. We acknowledge the lack of common electroclinical features, but these two groups should rather be considered as a pending intermediary classification, highlighting the need for ongoing medical investigation. This boundary at 1 year seems to mark a critical threshold, doubling the diagnostic yield from 14% (EE ≥ 12 months) to 28% (EE 3–12 months) in our cohort, consistent with previous findings [15, 16].
Similarly, in the DEE 3‐12 m group, 7 female patients were diagnosed with MECP2 variants, suggesting the presence of individuals with ID and seizures, mimicking DEE. On the other hand, the category of ID with seizures/epilepsy displayed an overlap with DEE. Indeed, in patients with ID and seizures/epilepsy, four and three patients were identified with SCN1A and CACNA1A variants, respectively. Since variants in both genes cause DEE, this shows the difficulty of distinguishing seizure‐accompanied ID from true DEE, where ID is partly attributable to uncontrolled epileptic activity [18]. In some patients, the precise sequence of ID and epilepsy can be hard to decipher.
Another example of the difficulty to classify epilepsy at an early stage is that 8.6% of the patients had focal epilepsy but were not further classified in any epileptic syndrome. The large clinical diversity of this group (sporadic, familial history, with or without intellectual or neurodevelopmental disorder) reflects the wide spectrum of etiologies associated with focal epilepsy. Accordingly, the genes involved ranged from self‐limited epilepsy (DEPDC5, PRRT2, NPRL3) to DEE (PCDH19, KCNT1).
An example of confusing evidence physicians can face in their clinical diagnosis is the familial history of seizure. This information is often very relevant to guide both clinicians and biologists toward a genetic etiology, but as seizure is not rare in the general population, it can be misleading in some cases. Indeed, 71/381 (18%) patients with de novo variant had a familial history of seizure, suggesting a significant proportion of seizures originating from independent causes in the same family.
Another surprising result was that 29% (19/65) of patients with SCN1A pLoF variants were not clinically diagnosed as DSS. Most of them (11/19) were too young to diagnose ID (age at testing < 2 years). Conversely, several patients suspected of having a DSS turned out to have a molecular diagnosis in genes typically associated with different phenotypes. This is probably due to the frequent occurrence of febrile seizures outside of the DS/GEFS+ spectrum. Indeed, a febrile trigger was observed in 30% of the DEE, whereas Dravet Syndrome Spectrum represented only 10% of the DEE.
Infantile epileptic spasms syndrome represented the second largest clinical category (325 patients) and achieved one of the lowest diagnostic rates, core_panel = 12%. This contrasted with the findings of [26], who reported 42% of genetic diagnostics (n = 52). This significant discrepancy could not be fully explained by genes missing from our core_panel (e.g., TSC1‐2, NF1); indeed, the rate of genetic diagnosis in our cohort is very close to the rate of 12.9% recently found in a Chinese cohort of 541 patients with infantile spasms, using exome sequencing [27]. Rather, this discrepancy could be explained by the high proportion of aneuploidy in the prospective cohort of [26]: six trisomy 21 and one trisomy 13, adding up to 31% of the genetic findings. In fact, in France, such patients would be unlikely to have been referred for epileptic gene panel sequencing within our network.
Interestingly, another study also found a high diagnostic rate (36%) in a cohort of 44 patients with infantile spasms, using exome sequencing [11]. In this context, the majority of the genetic findings (10/16) were outside the 68 genes of our core_panel. This high diagnostic yield could be explained by the recruitment methodology, as their cohort was mostly composed of patients with a severe phenotype. Indeed, in our cohort, IESS cases are often referred to at a very young onset, before any developmental delay or intellectual disability could be evidenced.
4.2. Identifying the Particularities of Panel Interpretation
We would like to point out the problems of interpretation posed by some of the genes on the panel. Patients with variants in PRRT2 represented 30/2563 (1.17%) cases, with the majority (22/30) associated with the recurrent frameshift variant: hg38‐16‐29813694‐G‐GC, NM_145239.3:c.649dup, NP_660282.2:p.(Arg217ProfsTer8). This variant adds a single C nucleotide to a stretch of nine consecutive C nucleotides, making it technically challenging to accurately detect through capture and PCR‐based enrichment sequencing. This difficulty is highlighted by the discordant frequency of the variant observed in gnomADv4 exome versus genome populations [28]: the variant is seven times more frequent in the gnomAD exome data, with over 900 individuals identified as heterozygous in that group. In our cohort, the proportion of this recurrent variant was very similar to the ratio previously found by [9] (13/17), in accordance with a literature review of 1444 published cases [29]. Another particular diagnosis involving PRRT2 was the recurrent 16p11.2 heterozygous microdeletion (OMIM 611913) [30]. This CNV deleting the whole sequence PRRT2 was found in four patients with epilepsy in our cohort.
Our cohort includes two patients with 15q11‐q13 triplications, involving mosaic supernumerary marker chromosome 15 (SMC15), carrying two extra copies of UBE3A and GABRB3. Both patients presented with severe ID and drug‐resistant epilepsy, concordant with previous reports [31]. The first was an adult patient in their 30s at testing. His epilepsy began at age 14 years with partial seizures associated with loss of awareness along with nocturnal tonic seizures. EEG found generalized spike‐and‐wave. Upon identification of a triplication signal of the genes UBE3A and GABRB3 on the panel sequencing, fluorescent in situ hybridization and chromosomal microarray identified a large 10 Mb breakpoint 1–4 triplication associated with a mosaic SMC15. The second patient was an infant described with IESS, progressive myoclonic epilepsy, and neutropenia. She experienced spasms, myoclonia, and tonic seizure. Chromosomal microarray, fluorescent in situ hybridization, and karyotype identified a mosaic SMC15, triplicating the region of 4 Mb between breakpoint 2 and 3. The parental origin of this SMC15 is typically maternal [31], but methylation‐specific analysis was not performed.
Another multigenic copy number variant is the 2q24.3 region. In our cohort, two patients with Dravet Syndrome had a heterozygous 2q24.3 deletion encompassing both SCN1A and SCN2A. Moreover, another patient with EIDEE had a 2q24.3 microduplication (6.6 Mb). Of note, this latter patient was a toddler with profound intellectual disability, concordantly with previous findings [32].
The rate of multiple diagnosis is higher for cohorts with exome sequencing (~5%) than in our cohort (0.7%) [33, 34].
Our cohort includes heterogeneous methods for CNV detection, with a dedicated CNV detection only performed for Paris, Lyon, and Rennes (80% of the cohort). The majority of CNV (24/41) were intragenic small deletions or duplications, representing a diagnostic yield of 0.9% in our cohort. Such variants, especially the 9 single exon deletions or duplications, are typically difficult to identify on capture‐based sequencing. In this regard, panel sequencing, with higher coverage than exome sequencing, offers a significant advantage due to its ability to more reliably detect these challenging copy number variations. The remaining 17/41 patients had large recurrent microdeletions or duplications, accounting for 0.06% of the cohort.
4.3. Toward a New Strategy of Molecular Diagnosis: From Panel to Genome?
The core panel of 68 genes enables a genetic diagnosis to be made in 24% of patients tested. However, a limitation of using targeted NGS instead of exome or genome is that it may miss pathogenic variants in genes not included in the panel, potentially leading to underdiagnosis. Analysis of 32 additional genes only increases this rate by 3%; but the sequencing of whole exome is likely to improve the diagnostic yield. This raises the question of exome sequencing as a replacement for an extensive panel. The choice between panel and exome sequencing involves more factors than the diagnostic rate. For example, panel sequencing is cost‐effective, more flexible to implement, and usually faster to interpret than exome or genome sequencing. As CNVs have been identified as particularly responsible for epilepsy (associated with the SCN1A, KCNQ2 and PRRT2 genes), we need to ensure that the exome technology used is as sensitive as the panel in detecting them. The ability to analyze large series of patient exomes with sufficient read depth is a major prerequisite for achieving this sensitivity.
As the demand for genetic diagnosis increases year after year, it is necessary to identify the most appropriate strategy. Genome analysis (with “short‐read” technology today) can be a solution, as already applied for patients with intellectual disability [35]. Indeed, PCR‐free genome sequencing allows better coverage in GC‐rich regions compared to PCR‐enriched sequencing (e.g., panel, exome). However, there are currently only 2 genome centers in France, dedicated to both rare diseases and cancers. If all genetic diagnoses of epilepsy are directed to them, they run the risk of becoming overcrowded. Moreover, the genetic heterogeneity of epilepsy is less important than for ID. For example, in epilepsy, 20% of molecular diagnoses can be achieved with the sequencing of only 10 genes. In a second stage, cases without positive results can be reconsidered, and a fraction of them sent to one of the genome centers. This strategy is currently recommended by the EPIGENE Network of French genetic laboratories [17].
We are now entering the era of emergency diagnosis for DEEs, particularly with requests from neonatal intensive care units to adjust the follow‐up of newborns. This means that laboratories have to deliver a diagnosis in less than a week. Short‐read sequencing (panel, exome or genome) is based on high‐throughput techniques not originally designed for emergency use. The advent of long‐read sequencing can respond to this type of urgent diagnosis on a small number of samples [36, 37].
In conclusion, we present a large real‐life cohort of patients with epilepsy, describing the various challenges of classifying epilepsy thanks to our pre‐sequencing data collection. Whatever the technique of gene screening, a large proportion of patients remained without a positive genetic diagnosis. Efforts to identify new genes or genetic mechanisms of epilepsy must continue.
Author Contributions
É.L.: conceptualization. L.A., C.N., P.M., M.F., L.V.: data curation. P.M., F.R., C.N., L.A., C.M., D.V., S.A., S.T., K.L., I.G.‐A., M.C., V.N., B.H., S.J., D.D., M.‐L.J., H.M., B.D.‐P. L.P., C.D., S.O., A.B., W.C., M.F., F.D., N.C., D.S., M.E., V.d.P., E.P., A.‐L.P., C.R., C.S., G.R., C.A., H.M., R.S., S.N., J.P., É.B., V.F., A.‐M.G., S.J., B.D., N.V., A.L., C.H.‐L.C., L.V., M.F., M.M., G.L.: investigation. J.‐M.S.A.: writing – original draft. É.L., G.L., S.A., L.V., L.A., C.M., J.P.: writing – review and editing.
Ethics Statement
Results of genetic analyses are registered in a declared diagnosis database (CNIL certificate n°1412729). The patients or the parents of participants < 18 years signed an informed consent for the genetic diagnosis of epilepsy as well as for prospective research related to their disease. DNA samples are stored in the biological collection n°DC2009‐957.
Conflicts of Interest
The authors declare no conflicts of interest.
Supporting information
Appendix S1: ene70324‐sup‐0001‐AppendixS1.docx.
Appendix S2: ene70324‐sup‐0002‐AppendixS2.xlsx.
Acknowledgements
The authors would like to thank Dr. Denis Graber for his help and contribution in recruiting patients. The authors warmly thank all the patients and their families who are involved in this study.
de Sainte Agathe J.‐M., Monin P., Riccardi F., et al., “The Clinical and Genetic Landscape of a French Multicenter Cohort of 2563 Epilepsy Patients Referred for Genetic Diagnosis,” European Journal of Neurology 32, no. 8 (2025): e70324, 10.1111/ene.70324.
Pauline Monin, Florence Riccardi, Caroline Nava, Lionel Arnaud, Mathieu Milh, and Gaëtan Lesca have contributed equally.
Data Availability Statement
The data that supports the findings of this study are available in the Appendices S1 and S2 of this article.
References
- 1. Scheffer I. E., Berkovic S., Capovilla G., et al., “ ilae Classification of the Epilepsies: Position Paper of the ilae Commission for Classification and Terminology,” Epilepsia 58, no. 4 (2017): 512–521. [DOI] [PMC free article] [PubMed] [Google Scholar]
- 2. Scheffer I. E., Zuberi S., Mefford H. C., Guerrini R., and McTague A., “Developmental and Epileptic Encephalopathies,” Nature Reviews Disease Primers 10, no. 1 (2024): 61. [DOI] [PubMed] [Google Scholar]
- 3. Guerrini R., Conti V., Mantegazza M., Balestrini S., Galanopoulou A. S., and Benfenati F., “Developmental and Epileptic Encephalopathies: From Genetic Heterogeneity to Phenotypic Continuum,” Physiological Reviews 103, no. 1 (2023): 433–513. [DOI] [PMC free article] [PubMed] [Google Scholar]
- 4. Millevert C., Weckhuysen S., and For the ILAE Genetics Commission , “ILAE Genetic Literacy Series: Self‐Limited Familial Epilepsy Syndromes With Onset in Neonatal Age and Infancy,” Epileptic Disorders 25, no. 4 (2023): 445–453. [DOI] [PubMed] [Google Scholar]
- 5. Specchio N., Wirrell E. C., Scheffer I. E., et al., “International League Against Epilepsy Classification and Definition of Epilepsy Syndromes With Onset in Childhood: Position Paper by the ILAE Task Force on Nosology and Definitions,” Epilepsia 63, no. 6 (2022): 1398–1442. [DOI] [PubMed] [Google Scholar]
- 6. Perucca P., Bahlo M., and Berkovic S. F., “The Genetics of Epilepsy,” Annual Review of Genomics and Human Genetics 21, no. 1 (2020): 205–230. [DOI] [PubMed] [Google Scholar]
- 7. Kuersten M., Tacke M., Gerstl L., Hoelz H., Stülpnagel C., and Borggraefe I., “Antiepileptic Therapy Approaches in KCNQ2 Related Epilepsy: A Systematic Review,” European Journal of Medical Genetics 63, no. 1 (2020): 103628. [DOI] [PubMed] [Google Scholar]
- 8. Musto E., Gardella E., and Møller R. S., “Recent Advances in Treatment of Epilepsy‐Related Sodium Channelopathies,” European Journal of Paediatric Neurology 24 (2020): 123–128. [DOI] [PubMed] [Google Scholar]
- 9. Symonds J. D., Zuberi S. M., Stewart K., et al., “Incidence and Phenotypes of Childhood‐Onset Genetic Epilepsies: A Prospective Population‐Based National Cohort,” Brain 142, no. 8 (2019): 2303–2318. [DOI] [PMC free article] [PubMed] [Google Scholar]
- 10. Yang L., Kong Y., Dong X., et al., “Clinical and Genetic Spectrum of a Large Cohort of Children With Epilepsy in China,” Genetics in Medicine 21, no. 3 (2019): 564–571. [DOI] [PMC free article] [PubMed] [Google Scholar]
- 11. Rochtus A., Olson H. E., Smith L., et al., “Genetic Diagnoses in Epilepsy: The Impact of Dynamic Exome Analysis in a Pediatric Cohort,” Epilepsia 61, no. 2 (2020): 249–258. [DOI] [PMC free article] [PubMed] [Google Scholar]
- 12. Yao R., Zhou Y., Tang J., et al., “Genetic Diagnosis Spectrum and Multigenic Burden of Exome‐Level Rare Variants in a Childhood Epilepsy Cohort,” Frontiers in Genetics 12 (2021): 782419. [DOI] [PMC free article] [PubMed] [Google Scholar]
- 13. Chuan Z., Ruikun C., Qian L., et al., “Genetic and Phenotype Analysis of a Chinese Cohort of Infants and Children With Epilepsy,” Frontiers in Genetics 13 (2022): 869210. [DOI] [PMC free article] [PubMed] [Google Scholar]
- 14. Lindy A. S., Stosser M. B., Butler E., et al., “Diagnostic Outcomes for Genetic Testing of 70 Genes in 8565 Patients With Epilepsy and Neurodevelopmental Disorders,” Epilepsia 59, no. 5 (2018): 1062–1071. [DOI] [PubMed] [Google Scholar]
- 15. Truty R., Patil N., Sankar R., et al., “Possible Precision Medicine Implications From Genetic Testing Using Combined Detection of Sequence and Intragenic Copy Number Variants in a Large Cohort With Childhood Epilepsy,” Epilepsia Open 4, no. 3 (2019): 397–408. [DOI] [PMC free article] [PubMed] [Google Scholar]
- 16. McKnight D., Bristow S. L., Truty R. M., et al., “Multigene Panel Testing in a Large Cohort of Adults With Epilepsy: Diagnostic Yield and Clinically Actionable Genetic Findings,” Neurology: Genetics 8, no. 1 (2022): e650. [DOI] [PMC free article] [PubMed] [Google Scholar]
- 17. Arnaud L., Abi Warde M.‐T., Barcia G., et al., “The EPIGENE Network: A French Initiative to Harmonize and Improve the Nationwide Diagnosis of Monogenic Epilepsies,” European Journal of Medical Genetics 65, no. 3 (2022): 104445. [DOI] [PubMed] [Google Scholar]
- 18. Zuberi S. M., Wirrell E., Yozawitz E., et al., “ILAE Classification and Definition of Epilepsy Syndromes With Onset in Neonates and Infants: Position Statement by the ILAE Task Force on Nosology and Definitions,” Epilepsia 63, no. 6 (2022): 1349–1397. [DOI] [PubMed] [Google Scholar]
- 19. Tang S., Addis L., Smith A., et al., “Phenotypic and Genetic Spectrum of Epilepsy With Myoclonic Atonic Seizures,” Epilepsia 61, no. 5 (2020): 995–1007. [DOI] [PubMed] [Google Scholar]
- 20. Nightscales R., Chen Z., Barnard S., et al., “Applying the ILAE Diagnostic Criteria for Lennox–Gastaut Syndrome in the Real‐World Setting: A Multicenter Retrospective Cohort Study,” Epilepsia Open 9, no. 2 (2024): 602–612. [DOI] [PMC free article] [PubMed] [Google Scholar]
- 21. Hirsch E., French J., Scheffer I. E., et al., “ILAE Definition of the Idiopathic Generalized Epilepsy Syndromes: Position Statement by the ILAE Task Force on Nosology and Definitions,” Epilepsia 63, no. 6 (2022): 1475–1499. [DOI] [PubMed] [Google Scholar]
- 22. Lesca G., Rudolf G., Bruneau N., et al., “GRIN2A Mutations in Acquired Epileptic Aphasia and Related Childhood Focal Epilepsies and Encephalopathies With Speech and Language Dysfunction,” Nature Genetics 45, no. 9 (2013): 1061–1066. [DOI] [PubMed] [Google Scholar]
- 23. Freibauer A. E., RamachandranNair R., Jain P., Jones K. C., and Whitney R., “The Genetic Landscape of Developmental and Epileptic Encephalopathy With Spike‐and‐Wave Activation in Sleep,” Seizure‐European Journal of Epilepsy 110 (2023): 119–125. [DOI] [PubMed] [Google Scholar]
- 24. Vlaskamp D. R. M., Shaw B. J., Burgess R., et al., “SYNGAP1 Encephalopathy: A Distinctive Generalized Developmental and Epileptic Encephalopathy,” Neurology 92, no. 2 (2019): e96–e107. [DOI] [PMC free article] [PubMed] [Google Scholar]
- 25. Gold W. A., Krishnarajy R., Ellaway C., and Christodoulou J., “Rett Syndrome: A Genetic Update and Clinical Review Focusing on Comorbidities,” ACS Chemical Neuroscience 9, no. 2 (2018): 167–176. [DOI] [PubMed] [Google Scholar]
- 26. Symonds J. D., Elliott K. S., Shetty J., et al., “Early Childhood Epilepsies: Epidemiology, Classification, Aetiology, and Socio‐Economic Determinants,” Brain 144, no. 9 (2021): 2879–2891. [DOI] [PMC free article] [PubMed] [Google Scholar]
- 27. Peng P., Kessi M., Mao L., et al., “Etiologic Classification of 541 Infantile Spasms Cases: A Cohort Study,” Frontiers in Pediatrics 10 (2022): 774828. [DOI] [PMC free article] [PubMed] [Google Scholar]
- 28. Chen S., Francioli L. C., Goodrich J. K., et al., “A Genomic Mutational Constraint Map Using Variation in 76,156 Human Genomes,” Nature 625, no. 7993 (2024): 92–100. [DOI] [PMC free article] [PubMed] [Google Scholar]
- 29. Ebrahimi‐Fakhari D., Saffari A., Westenberger A., and Klein C., “The Evolving Spectrum of PRRT2‐Associated Paroxysmal Diseases,” Brain: A Journal of Neurology 138 (2015): 3476–3495. [DOI] [PubMed] [Google Scholar]
- 30. Vlaskamp D. R. M., Callenbach P. M. C., Rump P., et al., “PRRT2‐Related Phenotypes in Patients With a 16p11.2 Deletion,” European Journal of Medical Genetics 62, no. 4 (2019): 265–269. [DOI] [PubMed] [Google Scholar]
- 31. Kleefstra T., De Leeuw N., Wolf R., et al., “Phenotypic Spectrum of 20 Novel Patients With Molecularly Defined Supernumerary Marker Chromosomes 15 and a Review of the Literature,” American Journal of Medical Genetics. Part A 152A, no. 9 (2010): 2221–2229. [DOI] [PubMed] [Google Scholar]
- 32. Goeggel Simonetti B., Rieubland C., Courage C., et al., “Duplication of the Sodium Channel Gene Cluster on 2q24 in Children With Early Onset Epilepsy,” Epilepsia 53, no. 12 (2012): 2128–2134. [DOI] [PubMed] [Google Scholar]
- 33. Posey J. E., Harel T., Liu P., et al., “Resolution of Disease Phenotypes Resulting From Multilocus Genomic Variation,” New England Journal of Medicine 376, no. 1 (2017): 21–31. [DOI] [PMC free article] [PubMed] [Google Scholar]
- 34. Spedicati B., Morgan A., Pianigiani G., et al., “Challenging Occam's Razor: Dual Molecular Diagnoses Explain Entangled Clinical Pictures,” Genes 13, no. 11 (2022): 2023. [DOI] [PMC free article] [PubMed] [Google Scholar]
- 35. Binquet C., Lejeune C., Faivre L., et al., “Genome Sequencing for Genetics Diagnosis of Patients With Intellectual Disability: The DEFIDIAG Study,” Frontiers in Genetics 12 (2021): 766964. [DOI] [PMC free article] [PubMed] [Google Scholar]
- 36. Gorzynski J. E., Goenka S. D., Shafin K., et al., “Ultrarapid Nanopore Genome Sequencing in a Critical Care Setting,” New England Journal of Medicine 386, no. 7 (2022): 700–702. [DOI] [PubMed] [Google Scholar]
- 37. Zalusky M. P. G., Gustafson J. A., Bohaczuk S. C., et al., “3‐Hour Genome Sequencing and Targeted Analysis to Rapidly Assess Genetic Risk,” Genetics in Medicine Open 2 (2024): 101833. [DOI] [PMC free article] [PubMed] [Google Scholar]
Associated Data
This section collects any data citations, data availability statements, or supplementary materials included in this article.
Supplementary Materials
Appendix S1: ene70324‐sup‐0001‐AppendixS1.docx.
Appendix S2: ene70324‐sup‐0002‐AppendixS2.xlsx.
Data Availability Statement
The data that supports the findings of this study are available in the Appendices S1 and S2 of this article.