

Abstract
Background: Calcific aortic valve disease (CAVD) is a prevalent heart valve disease. The ratio of two apolipoproteins with distinct functions, Apolipoprotein B/Apolipoprotein A1 (APOB/APOA1), has been proposed as a novel assessment index for the evaluation of cardiovascular diseases. The aim of this article is to discuss the role of lipid parameters such as APOB/APOA1 in CAVD and the risk factors for CAVD, to develop a predictive model for CAVD, and to evaluate the sensitivity and specificity of this model.
Method: Patients who initially presented to the Department of Cardiology of the Second Affiliated Hospital of Dalian Medical University between 1 January 2023 and 31 December 2023 were retrospectively identified and included in the study. Patients were divided into an aortic valve calcification group (111 cases) and a control group (201 cases) based on computed tomography (CT) findings. The clinical data, laboratory examination results, and chest CT images of the patients were collected and analyzed. A variety of statistical methods were used to analyze risk factors for CAVD, to construct a CAVD prediction model, and to assess its sensitivity and specificity.
Results: Lipid parameters APOA1, APOB/APOA1, cumulative low-density lipoprotein (LDL) exposure, and non–high-density lipoprotein/high-density lipoprotein (non-HDL/HDL) were significantly associated with aortic valve calcification. Age, history of diabetes, diastolic blood pressure (DBP), APOB/APOA1, Cystatin C (Cys-c), and neutrophil-to-lymphocyte ratio (NLR) are identified as independent risk factors for CAVD, and the combined model achieved an AUC of 0.796 for CAVD prediction, corresponding to a sensitivity of 0.769 and a specificity of 0.755.
Conclusion: The lipid parameters APOA1, APOB/APOA1, cumulative LDL exposure, and non-HDL/HDL have been demonstrated to be associated with aortic valve calcification. Furthermore, APOB/APOA1 can be used for the prediction of CAVD, and the combination of APOB/APOA1 with age, history of diabetes, DBP, Cys-c, and NLR has better prediction performance for CAVD.
Keywords: APOB/APOA1, calcific aortic valve disease, prediction model
1. Introduction
CAVD is a prevalent form of valvular heart disease, ranking as the third most common cardiovascular disorder after coronary heart disease and hypertension [1]. According to the Global Burden of Disease Study 2019 [2], which assessed trends in the global burden of cardiovascular disease from 1990 to 2019, it shows that heart valve disease accounts for about 2.5% of deaths from cardiovascular disease of different causes, and that globally, the prevalence and age-standardized prevalence of CAVD have risen steadily in the last three decades; it has risen from approximately 4.6 to 11.6 cases per 100,000 people and is clinically important because ventricular outflow tract obstruction due to severe calcification can lead to left ventricular dysfunction requiring surgical or transcatheter valve replacement [3], which poses a serious personal and global economic and medical burden.
The early presentation of CAVD is atherosclerosis of the aortic valve leaflets, with a prevalence of calcification or sclerosis of the aortic valve of 20%–30% in individuals over the age of 65 and 48% in those over the age of 85 [4]. Severe calcification of the aortic valve in advanced stages results in the development of aortic stenosis, which in turn leads to obstruction of the left ventricular outflow tract. This, in turn, leads to heart failure, for which surgical valve replacement is the only effective treatment. Liu Li [5] found that the prevalence of valvular calcification was 13.4% in a random sample of the elderly population in Beijing, 7.7% in those aged 60 years or older, 16.1% in those aged 70 years or older, and 25.7% in those aged 80 to 89 years.
The notion that CAVD is merely a passive degenerative change associated with age has long been a widely held view. Recent studies [6] have provided new insights into the pathogenesis of calcific aortic stenosis, indicating that it is an active progressive disease influenced by multiple risk factors. Epidemiological studies [7, 8] have demonstrated a strong correlation among age, dyslipidemia, and diabetes mellitus and the development of calcific aortic stenosis. Histopathological studies [9–14] have revealed that calcific aortic stenosis involves inflammation, abnormal lipid metabolism, matrix remodeling, and calcification.
CAVD shares numerous similarities with atherosclerosis, both in terms of risk factors and pathological changes. Indeed, it has been postulated that CAVD represents an additional manifestation of atherosclerosis [15]. Lipids play a significant role in the pathogenesis of CAVD. While the majority of lipid management guidelines identify LDL as the causative lipid component and have demonstrated that LDL reduction can reduce the risk of cardiovascular events, attempts have been made to block or slow the progression of CAVD with statin therapy. The results of a study [16] in animal models have indicated that hypercholesterolemia can result in the development of aortic valve sclerosis and hemodynamic changes. Additionally, a randomized clinical trial [17] has suggested that lowering blood lipids may potentially slow the progression of valve calcification and stenosis; however, despite these findings, large-scale, prospective, controlled trials have not consistently demonstrated that statins are effective in ameliorating the progression and progression of calcific aortic stenosis [18–21]. Thus, the role of lipids in CAVD is controversial, and other components of lipids may also be involved in the formation of CAVD.
Previous studies usually focused on traditional indicators such as LDL, but they reflected only the promoting effects of atherosclerosis, and the effects of each component of the lipid profile on atherosclerosis were different, whereas APOB/APOA1, as a novel lipid parameter, took into account both promoting and inhibiting effects of atherosclerosis in the lipid profile and better reflected the trend of the effects of the lipid profile on atherosclerosis. APOB was recognized as a risk-predicting biomarker in a large sample size study [22], which revealed that APOB is responsible for the transportation of a vast array of potentially atherogenic cholesterol, including very LDL, intermediate-density lipoprotein, and LDL; conversely, HDL is transported by APOA1 [23]. In the context of various lipid abnormalities, a multitude of factors influence the balance between proatherogenic and antiatherogenic lipoprotein particles. The most utilized indicators in the clinical assessment of lipids encompass total cholesterol (TC), triglyceride (TG), LDL, and HDL. The management of dyslipidemia continues to present significant challenges, as residual cardiovascular risk persists even after LDL levels attain a target standard. This suggests that other components of lipids, in addition to LDL, may also play a role in the development of cardiovascular disease [24, 25]. Searching for new lipid parameters associated with cardiovascular risk may help prevent disease, and therefore, a series of nontraditional lipid parameters have been derived from lipids, including cumulative exposure to LDL [26], APOB/APOA1, non-HDL, residual cholesterol, and atherogenic index of plasma (AIP) [27], which are all important factors in the development of cardiovascular disease.
Therefore, the objective of this study is threefold: firstly, to examine the risk factors associated with CAVD; secondly, to investigate the correlation between lipids and their derived parameters (such as LDL and APOB/APOA1 ratio) and CAVD; and thirdly, to construct a multifactorial prediction model including APOB/APOA1 and evaluate its clinical application value.
2. Methods
2.1. Study Design
This is a retrospective cohort study, in which patients who first visited the Department of Cardiology of the Second Hospital of Dalian Medical University between 1 January 2023 and 31 December 2023 are being retrospectively collected. All patients underwent a comprehensive chest CT scan upon admission. We defined aortic valve calcification as CT values ≥ 130 Hu in the aortic valve region, and 312 patients were ultimately included in the study after the exclusion of individuals with comorbidities such as pregnancy, severe hepatic and renal insufficiency, hematological diseases, tumors, autoimmune disorders, inflammatory diseases, hyperthyroidism, hypothyroidism, rheumatic heart disease, cardiomyopathy, dilated cardiomyopathy, and myocarditis. Independently predicted long-term oral lipid-lowering medications, such as statins, were excluded.
Statistical simulation study [28] showed that according to the method of event per variable (EPV), the general EPV is at least 10–15. With the final inclusion of six independent variables in this study, each independent variable should have 60–90 patients with CAVD, and the incidence of CAVD is about 30%, so the number of inclusion is 200–300. The number of sample cases included in this study was 312, which meets the sample size requirement.
Agatston established a minimum threshold of CT for calcified areas at 130 Hu, defining the area with CT values exceeding this threshold as calcified. This was further divided into 111 cases in the calcified group and 201 cases in the control group based on the presence or absence of aortic valve calcification in CT. The general information of the two groups was also collected, including gender. The general data, including gender, age, height, weight, body mass index (BMI), body surface area (BSA), history of hypertension, history of diabetes, and history of coronary heart disease, were collected from the two groups. The results of blood tests, including those pertaining to lipids, were collated from the patients. Thereafter, lipid-derived parameters were calculated, along with the Agatston calcification score (details are shown in Table 1). The correlation between aortic valve calcification and lipids and their derived parameters was investigated by comparing the differences in lipids and their derived parameters between the two groups. A CAVD prediction model was constructed using Spearman's correlation analysis, binary logistic regression, and the ROC curve, and the model was evaluated for sensitivity and specificity. This study was approved by the Ethics Committee of the Second Affiliated Hospital of Dalian Medical University and exempt from signing an informed consent form (Ethics Number KY2025-110-01).
Table 1.
Calculation method of Agatston calcification score.
| A g a t s t o n calcification score = ∑ area of calcification in each CT cross − section∗coefficient corresponding tothemaximum CT value ofthe calcified plaque | Maximum CT value | Modulus |
|---|---|---|
| Calculate the area of calcification in each cross-section Calcification score of the cross − section = plaque area∗coefficient corresponding to maximum CT value Agatston calcification score = sum of calcification integrals for each cross-section |
130–199 | 1 |
| 200–299 | 2 | |
| 300–399 | 3 | |
| ≥ 400 | 4 |
2.2. Statistical Analyses
The statistical analysis of the obtained data was conducted using the SPSS 26.0 software package. The count data were expressed by a constitutive ratio, and a X2 test was employed. The measurement data were tested for normality using a S-W test and a Q-Q plot. If they conformed to normality, they were expressed by the mean ± standard deviation (X ± SD). If the data did not conform to normality, they were expressed by M (Q25, Q75), and the nonparametric test was used. If the data conformed to normal distribution and met the chi-square, an independent sample t-test analysis was conducted. If the data met the normal distribution but did not meet the chi-square, an t′ − test was performed. The correlation between aortic valve calcification and factors was analyzed using Spearman's correlation analysis and one-way logistic regression analysis. Binary multifactorial regression analysis (stepwise method) was performed for factors with p value less than 0.05. Indicators with p value less than 0.05 were included in the analyses and plotted on a ROC graph. Forest plots were drawn using R software to visualize CVD risk factors. Calibration curves were plotted using R software and Hollingshead–Luce tests were performed to assess the validity of the predictive models. A statistically significant difference was observed when p value is less than 0.05.
3. Results
1. The difference in age, history of diabetes mellitus, and DBP was statistically significant in the calcification group compared to the control group, while the difference in smoking, alcohol consumption, history of hypertension, history of coronary heart disease, height, weight, BMI, BSA, and systolic blood pressure (SBP) was not statistically significant (details are shown in Table 2).
2. Compared to the control group, the differences in APOA1 (1.34 ± 0.24 vs. 1.40 ± 0.22), APOB/APOA1 (0.68 ± 0.23 vs. 0.62 ± 0.17), cumulative exposure to LDL (201.29 ± 55.00 vs. 171.63 ± 49.05), and non-HDL/HDL (3.71 ± 1.48 vs. 3.37 ± 1.119) were statistically significant in patients in the calcification group. In addition, the differences in blood glucose, glycated hemoglobin A1c (HbA1c), urea, Cys-c, sodium, chlorine, calcium, neutrophil percentage (NEUT%), lymphocyte percentage (LY%), NLR, and d-dimer were statistically significant (details are shown in Table 3 and Figures 1 and 2).
3. Spearman correlation results showed that aortic valve calcification was correlated with age, history of coronary heart disease, history of diabetes mellitus, DBP, blood glucose, HbA1c, cumulative LDL exposure, APOA1, APOB/APOA1, non-HDL/HDL, Cys-c, LDH, sodium, chlorine, calcium, NEUT%, LY%, NLR, and d-dimer.
The Agatston score for aortic valve calcification was correlated with age, history of coronary artery disease, history of diabetes mellitus, DBP, blood glucose, HbA1c, cumulative LDL exposure, non-HDL/HDL, APOB/APOA1, urea, Cys-c, LDH, sodium, chlorine, NEUT%, LY%, NLR, and D-dimer (details are shown in Table 4).
4. The results of univariate logistic regression showed that aortic valve calcification was associated with age, history of diabetes mellitus, DBP, blood glucose, HbA1c, cumulative LDL exposure, APOA1, APOB/APOA1, non-HDL/HDL, urea, Cys-c, sodium, chloride, calcium, NEUT%, LY%, NLR, and D-dimer (details are shown in Table 5).
5. The factors associated with aortic valve calcification were subjected to binary logistic regression; whether before or after the exclusion of confounding factors, the results demonstrated that age, history of diabetes mellitus, DBP, APOB/APOA1, Cys-c, and NLR were independent risk factors for aortic valve calcification (details are shown in Table 6 and Figure 3).
6. The ROC analysis included the variables age, history of diabetes, DBP, APOB/APOA1, Cys-c, and NLR. The areas under the curve for these variables were 0.679, 0.600, 0.641, 0.583, 0.645, and 0.647; the area under the curve for the combined prediction of aortic valve calcification by the above indexes was 0.796, and the maximum Uden index of this prediction model was 0.522, corresponding to a sensitivity of 0.769 and a specificity of 0.754 (details are shown in Table 7 and Figure 4).
7. The results of the calibration curve show that the calibration curve of the predicted incidence rate and the measured incidence rate curve are both close to the ideal reference line, and the p value of the H-L test is greater than 0.05, which indicates that there is no significant difference between the model and the expected model, suggesting that the efficacy of the model is good (details are shown in Figure 5).
Table 2.
Comparison of baseline information between patients in CAVD and control groups.
| Item |
Calcification group
N = 111 |
Control group
N = 201 |
Test value ( t/t′/X2) | p |
|---|---|---|---|---|
| Male (n, %) | (70, 63.1%) | (109, 54.2%) | 2.282 | 0.131 |
| Smoking (n, %) | (44, 39.6%) | (88, 43.8%) | 0.502 | 0.478 |
| Drinking (n, %) | (21, 18.9%) | (33, 16.4%) | 0.313 | 0.576 |
| Hypertensive (n, %) | (76, 68.5%) | (125, 62.2%) | 1.230 | 0.267 |
| Diabetes (n, %) | (49, 44.1%) | (48, 24.0%)∗∗∗ | 13.497 | < 0.001 |
| Coronary heart disease (n, %) | (67, 60.4%) | (100, 49.8%) | 3.236 | 0.072 |
| Age (year) | 68.09 ± 9.20 | 60.97 ± 11.06∗∗∗ | −5.773 | < 0.001 |
| Height (m) | 1.66 ± 0.13 | 1.67 ± 0.08 | 0.414 | 0.679 |
| Weight (kg) | 72.04 ± 13.97 | 73.23 ± 13.41 | 0.741 | 0.459 |
| BMI (kg/m2) | 27.03 ± 14.04 | 26.27 ± 3.83 | −0.718 | 0.473 |
| BSA (m2) | 1.78 ± 0.22 | 1.80 ± 0.21 | 0.735 | 0.463 |
| SBP (mmHg) | 136.69 ± 20.05 | 138.55 ± 18.64 | 0.819 | 0.414 |
| DBP (mmHg) | 81.59 ± 12.47 | 86.68 ± 11.73∗∗∗ | 3.591 | < 0.001 |
Abbreviations: BMI, body mass index; BSA, body surface area; DBP, diastolic blood pressure; SBP, systolic blood pressure.
∗p < 0.05, ∗∗p < 0.01, ∗∗∗p < 0.001: statistically significant difference.
Table 3.
Comparison of laboratory findings between patients in CAVD and control groups.
| Item |
Calcification group
N = 111 |
Control group
N = 201 |
Test value ( t/t′/X2) | p |
|---|---|---|---|---|
| Blood glucose (mmol/L) | 6.66 ± 2.72 | 5.88 ± 1.71∗∗ | −2.739 | 0.007 |
| HbA1c (mmol/L) | 6.82 ± 1.66 | 6.24 ± 1.22∗∗ | −3.243 | 0.001 |
| TC (mmol/L) | 4.76 ± 0.95 | 4.63 ± 0.80 | −1.244 | 0.215 |
| TG (mmol/L) | 1.51 ± 0.81 | 1.49 ± 0.57 | −0.328 | 0.743 |
| HDL (mmol/L) | 1.07 ± 0.28 | 1.11 ± 0.27 | 1.458 | 0.146 |
| LDL (mmol/L) | 2.97 ± 0.77 | 2.82 ± 0.66 | −1.771 | 0.078 |
| Cumulative LDL exposure (mmol/L·year) | 201.29 ± 55.00 | 171.63 ± 49.05∗∗∗ | −4.894 | < 0.001 |
| APOA1 (mmol/L) | 1.34 ± 0.24 | 1.40 ± 0.22∗ | 2.042 | 0.042 |
| APOB (mmol/L) | 0.88 ± 0.22 | 0.84 ± 0.18 | −1.914 | 0.057 |
| APOB/APOA1 | 0.68 ± 0.23 | 0.62 ± 0.17∗∗ | −2.878 | 0.004 |
| Non-HDL (mmol/L) | 3.69 ± 0.93 | 3.52 ± 0.80 | −1.718 | 0.087 |
| Non-HDL/HDL | 3.71 ± 1.48 | 3.37 ± 1.19∗ | −2.252 | 0.025 |
| Residual cholesterol (mmol/L) | 0.73 ± 0.29 | 0.70 ± 0.27 | −0.815 | 0.416 |
| AIP | 0.12 ± 0.26 | 0.11 ± 0.24 | −0.408 | 0.683 |
| Urea (mmol/L) | 6.11 ± 1.81 | 5.71 ± 1.37∗ | −2.038 | 0.043 |
| Creatinine (mmol/L) | 69.53 ± 14.16 | 66.73 ± 14.62 | −1.626 | 0.105 |
| UA (mmol/L) | 352.21 ± 88.47 | 339.83 ± 86.00 | −1.205 | 0.229 |
| Cys-c (mmol/L) | 1.11 ± 0.23 | 1.01 ± 0.16∗∗∗ | −4.274 | < 0.001 |
| ALP (U/L) | 78.78 ± 26.79 | 75.73 ± 20.62 | −1.120 | 0.263 |
| LDH (mmol/L) | 221.79 ± 146.11 | 196.39 ± 93.15 | −1.654 | 0.100 |
| Potassium (mmol/L) | 3.97 ± 0.37 | 3.96 ± 0.31 | −0.473 | 0.636 |
| Sodium (mmol/L) | 141.33 ± 2.99 | 142.09 ± 2.20∗ | 2.339 | 0.020 |
| Chlorine (mmol/L) | 106.32 ± 2.78 | 107.06 ± 2.14∗ | 2.429 | 0.016 |
| Calcium (mmol/L) | 2.22 ± 0.13 | 2.26 ± 0.12∗ | 2.599 | 0.010 |
| WBC (×109/L) | 6.51 ± 1.88 | 6.46 ± 1.85 | −0.196 | 0.845 |
| NEUT% | 66.01 ± 8.15 | 62.31 ± 8.59∗∗∗ | −3.694 | < 0.001 |
| LY% | 25.00 ± 7.43 | 29.15 ± 7.35∗∗∗ | 4.735 | < 0.001 |
| NLR | 3.03 ± 1.47 | 2.36 ± 0.93∗∗∗ | −4.906 | < 0.001 |
| d-Dimer (μg/mL) | 0.64 ± 0.31 | 0.57 ± 0.22∗ | −2.488 | 0.013 |
Abbreviations: AIP, atherogenic index of plasma; ALP, alkaline phosphatase; APOA1, Apolipoprotein A1; APOB, Apolipoprotein B; Cys-c, Cystatin C; HbA1c, glycated hemoglobin A1c; HDL, high-density lipoprotein; LDH, lactate dehydrogenase; LDL, low-density lipoprotein; LY%, lymphocyte percentage; NEUT%, neutrophil percentage; NLR, neutrophil-to-lymphocyte ratio; non-HDL, non–high-density lipoprotein; TC, total cholesterol; TG, triglyceride; UA, uric acid; WBC, white blood cell.
∗p < 0.05, ∗∗p < 0.01, ∗∗∗p < 0.001: statistically significant difference.
Figure 1.

Box plots comparing each general lipid parameter in the CAVD group and the control group. Note: ∗p < 0.05, ∗∗p < 0.01; compared to the control group, the difference was statistically significant.
Figure 2.

Box plots comparing APOB/APOA1 in the CAVD group and the control group. Note: ∗p < 0.05,∗∗p < 0.01; compared to the control group, the difference was statistically significant.
Table 4.
Correlation analysis of aortic valve calcification and Agatston score with various factors.
| Item | Aortic valve calcification | Agatston score | ||
|---|---|---|---|---|
| Correlation coefficient | p | Correlation coefficient | p | |
| Sex | 0.086 | 0.066 | 0.091 | 0.055 |
| Age | 0.313∗∗∗ | < 0.001 | 0.332∗∗∗ | < 0.001 |
| Height | 0.027 | 0.319 | 0.024 | 0.334 |
| Weight | −0.013 | 0.407 | −0.027 | 0.320 |
| BMI | −0.037 | 0.259 | −0.053 | 0.176 |
| BSA | 0.004 | 0.472 | −0.006 | 0.457 |
| Smoking | −0.040 | 0.240 | −0.051 | 0.185 |
| Drinking | 0.032 | 0.289 | 0.038 | 0.255 |
| Coronary heart disease | 0.102∗ | 0.036 | 0.110∗ | 0.027 |
| Hypertensive | 0.063 | 0.134 | 0.057 | 0.160 |
| Diabetes | 0.208∗∗∗ | < 0.001 | 0.210∗∗∗ | < 0.001 |
| SBP | −0.063 | 0.133 | −0.042 | 0.228 |
| DBP | −0.223∗∗∗ | < 0.001 | −0.220∗∗∗ | < 0.001 |
| Blood glucose | 0.126∗ | 0.013 | 0.111∗ | 0.025 |
| HbA1c | 0.159∗∗ | 0.003 | 0.154∗∗ | 0.003 |
| TC | 0.048 | 0.199 | 0.060 | 0.145 |
| TG | −0.064 | 0.131 | −0.060 | 0.145 |
| HDL | −0.084 | 0.068 | −0.075 | 0.094 |
| LDL | 0.070 | 0.108 | 0.078 | 0.086 |
| Cumulative LDL exposure | 0.257∗∗∗ | < 0.001 | 0.275∗∗∗ | < 0.001 |
| APOA1 | −0.112∗ | 0.024 | −0.093 | 0.051 |
| APOB | 0.078 | 0.084 | 0.087 | 0.064 |
| APOB/APOA1 | 0.139∗∗ | 0.007 | 0.135∗∗ | 0.009 |
| Non-HDL | 0.074 | 0.098 | 0.083 | 0.071 |
| Non-HDL/HDL | 0.114∗ | 0.022 | 0.112∗ | 0.024 |
| Residual cholesterol | 0.045 | 0.216 | 0.060 | 0.146 |
| AIP | −0.003 | 0.478 | −0.009 | 0.437 |
| Urea | 0.091 | 0.054 | 0.106∗ | 0.031 |
| Creatinine | 0.090 | 0.056 | 0.082 | 0.075 |
| UA | 0.063 | 0.133 | 0.050 | 0.188 |
| Cys-c | 0.242∗∗∗ | < 0.001 | 0.234∗∗∗ | < 0.001 |
| ALP | 0.033 | 0.283 | 0.025 | 0.332 |
| LDH | 0.114∗ | 0.022 | 0.107∗ | 0.030 |
| Potassium | 0.013 | 0.408 | 0.031 | 0.295 |
| Sodium | −0.101∗ | 0.038 | 0.099∗ | 0.041 |
| Chlorine | −0.130∗ | 0.011 | −0.138∗∗ | 0.008 |
| Calcium | −0.113∗ | 0.024 | −0.088 | 0.062 |
| WBC | 0.007 | 0.453 | −0.007 | 0.453 |
| NEUT% | 0.194∗∗∗ | < 0.001 | 0.218∗∗∗ | < 0.001 |
| LY% | −0.250∗∗∗ | < 0.001 | −0.268∗∗∗ | < 0.001 |
| NLR | 0.241∗∗∗ | < 0.001 | 0.262∗∗∗ | < 0.001 |
| d-Dimer | 0.100∗ | 0.040 | 0.102∗ | 0.037 |
Abbreviations: AIP, atherogenic index of plasma; ALP, alkaline phosphatase; APOA1, Apolipoprotein A1; APOB, Apolipoprotein B; BMI, body mass index; BSA, body surface area; Cys-c, Cystatin C; DBP, diastolic blood pressure; HbA1c, glycated hemoglobin A1c; HDL, high-density lipoprotein; LDH, lactate dehydrogenase; LDL, low-density lipoprotein; LY%, lymphocyte percentage; NEUT%, neutrophil percentage; NLR, neutrophil-to-lymphocyte ratio; non-HDL, non–high-density lipoprotein; SBP, systolic blood pressure; TC, total cholesterol; TG, triglyceride; UA, uric acid; WBC, white blood cell.
∗p < 0.05, ∗∗p < 0.01, ∗∗∗p < 0.001: statistically significant difference.
Table 5.
One-way regression analysis of aortic valve calcification with various factors.
| Item | B | p | OR | 95% CI | |
|---|---|---|---|---|---|
| Lower limits | Upper limits | ||||
| Sex | 0.365 | 0.132 | 1.441 | 0.896 | 2.317 |
| Age | 0.074∗∗∗ | < 0.001 | 1.076 | 1.047 | 1.107 |
| Height | −0.473 | 0.679 | 0.623 | 0.066 | 5.873 |
| Weight | −0.006 | 0.458 | 0.994 | 0.977 | 1.010 |
| BMI | 0.009 | 0.495 | 1.009 | 0.983 | 1.036 |
| BSA | −0.416 | 0.462 | 0.660 | 0.218 | 1.997 |
| Smoking | −0.170 | 0.479 | 0.843 | 0.526 | 1.351 |
| Drinking | 0.172 | 0.576 | 1.188 | 0.649 | 2.173 |
| CHD | 0.430 | 0.073 | 1.538 | 0.961 | 2.461 |
| Hypertensive | 0.278 | 0.268 | 1.320 | 0.808 | 2.158 |
| Diabetes | 0.897∗∗∗ | < 0.001 | 2.452 | 1.496 | 4.018 |
| SBP | −0.005 | 0.413 | 0.995 | 0.983 | 1.007 |
| DBP | −0.036∗∗ | 0.001 | 0.965 | 0.945 | 0.985 |
| Blood glucose | 0.164∗∗ | 0.003 | 1.179 | 1.056 | 1.315 |
| HbA1c | 0.285∗∗ | 0.001 | 1.330 | 1.125 | 1.573 |
| TC | 1.172 | 0.215 | 1.187 | 0.905 | 1.557 |
| TG | 0.058 | 0.742 | 1.060 | 0.749 | 1.502 |
| HDL | −0.653 | 0.147 | 0.520 | 0.215 | 1.258 |
| LDL | 0.300 | 0.080 | 1.349 | 0.965 | 1.887 |
| Cumulative LDL exposure | 0.011∗∗∗ | < 0.001 | 1.011 | 1.006 | 1.017 |
| APOA1 | −1.085∗ | 0.043 | 0.338 | 0.118 | 1.969 |
| APOB | 1.160 | 0.060 | 3.191 | 0.954 | 10.679 |
| APOB/APOA1 | 1.749∗∗ | 0.006 | 5.747 | 1.644 | 20.087 |
| Non-HDL | 0.239 | 0.089 | 1.270 | 0.965 | 1.671 |
| Non-HDL/HDL | 0.202∗ | 0.029 | 1.224 | 1.021 | 1.466 |
| Residual cholesterol | 0.350 | 0.415 | 1.418 | 0.612 | 3.286 |
| AIP | 0.199 | 0.682 | 1.221 | 0.470 | 3.170 |
| Urea | 0.168∗ | 0.030 | 1.182 | 1.017 | 1.375 |
| Creatinine | 0.013 | 0.106 | 1.013 | 0.997 | 1.029 |
| UA | 0.002 | 0.229 | 1.002 | 0.999 | 1.004 |
| Cys-c | 3.031∗∗∗ | < 0.001 | 20.720 | 5.118 | 83.877 |
| ALP | 0.006 | 0.265 | 1.006 | 0.996 | 1.016 |
| LDH | 0.002 | 0.081 | 1.002 | 1.000 | 1.004 |
| Potassium | 0.169 | 0.635 | 1.184 | 0.589 | 2.379 |
| Sodium | −0.120∗ | 0.014 | 0.887 | 0.806 | 0.976 |
| Chlorine | −0.130∗ | 0.011 | 0.878 | 0.795 | 0.970 |
| Calcium | −2.656∗ | 0.011 | 0.070 | 0.009 | 0.542 |
| WBC | 0.013 | 0.844 | 1.013 | 0.893 | 1.148 |
| NEUT% | 0.053∗∗∗ | < 0.001 | 1.054 | 1.024 | 1.086 |
| LY% | −0.078∗∗∗ | < 0.001 | 0.925 | 0.893 | 0.957 |
| NLR | 0.503∗∗∗ | < 0.001 | 1.654 | 1.322 | 2.069 |
| d-Dimer | 1.132∗ | 0.018 | 3.102 | 1.210 | 7.955 |
Abbreviations: AIP, atherogenic index of plasma; ALP, alkaline phosphatase; APOA1, Apolipoprotein A1; APOB, Apolipoprotein B; BMI, body mass index; BSA, body surface area; Cys-c, Cystatin C; DBP, diastolic blood pressure; HbA1c, glycated hemoglobin A1c; HDL, high-density lipoprotein; LDH, lactate dehydrogenase; LDL, low-density lipoprotein; LY%, lymphocyte percentage; NEUT%, neutrophil percentage; NLR, neutrophil-to-lymphocyte ratio; non-HDL, non–high-density lipoprotein; SBP, systolic blood pressure; TC, total cholesterol; TG, triglyceride; UA, uric acid; WBC, white blood cell.
∗p < 0.05, ∗∗p < 0.01, ∗∗∗p < 0.001: statistically significant difference.
Table 6.
Binary logistic regression analysis of aortic valve calcification.
| Item | Before excluding confounding factors | After excluding confounding factors | ||||
|---|---|---|---|---|---|---|
| B | p | B | p | OR | 95% CI | |
| Age | 0.058 | 0.001∗∗ | 0.058 | 0.001∗∗ | 1.060 | 1.025–1.096 |
| Diabetes | 0.835 | 0.005∗∗ | 0.779 | 0.008∗∗ | 2.180 | 1.216–3.905 |
| DBP | −0.034 | 0.007∗∗ | −0.032 | 0.010∗ | 0.968 | 0.945–0.992 |
| APOB/APOA1 | 1.827 | 0.026∗ | 1.713 | 0.034∗ | 5.544 | 1.139–26.984 |
| Cys-c | 1.673 | 0.032∗ | 1.732 | 0.026∗ | 5.652 | 1.227–26.035 |
| NLR | 0.464 | < 0.001∗∗∗ | 0.464 | < 0.001∗∗∗ | 1.590 | 1.232–2.053 |
Abbreviations: APOB/APOA1, Apolipoprotein B/Apolipoprotein A1; Cys-c, Cystatin C; DBP, diastolic blood pressure; NLR, neutrophil-to-lymphocyte ratio.
∗p < 0.05, ∗∗p < 0.01, ∗∗∗p < 0.001: statistically significant difference.
Figure 3.

Forest map of CAVD risk factors. Note: DBP, diastolic blood pressure; APOB/APOA1, Apolipoprotein B/Apolipoprotein A1; Cys-c, cystatin C; NLR, neutrophil-to-lymphocyte ratio.
Table 7.
ROC curves for aortic valve calcification and various risk factors.
| Item | AUC | 95% CI | p | |
|---|---|---|---|---|
| Lower limits | Upper limits | |||
| Combine model | 0.796 | 0.743 | 0.850 | < 0.001 |
| Age | 0.679 | 0.616 | 0.742 | < 0.001 |
| Diabetes | 0.600 | 0.532 | 0.668 | 0.004 |
| DBP | 0.641 | 0.575 | 0.707 | < 0.001 |
| APOB/APOA1 | 0.583 | 0.516 | 0.649 | 0.018 |
| Cys-c | 0.645 | 0.578 | 0.712 | < 0.001 |
| NLR | 0.647 | 0.582 | 0.712 | < 0.001 |
Note: Statistically significant difference: p < 0.05.
Abbreviations: APOB/APOA1, Apolipoprotein B/Apolipoprotein A1; Cys-c, Cystatin C; DBP, diastolic blood pressure; NLR, neutrophil-to-lymphocyte ratio.
Figure 4.
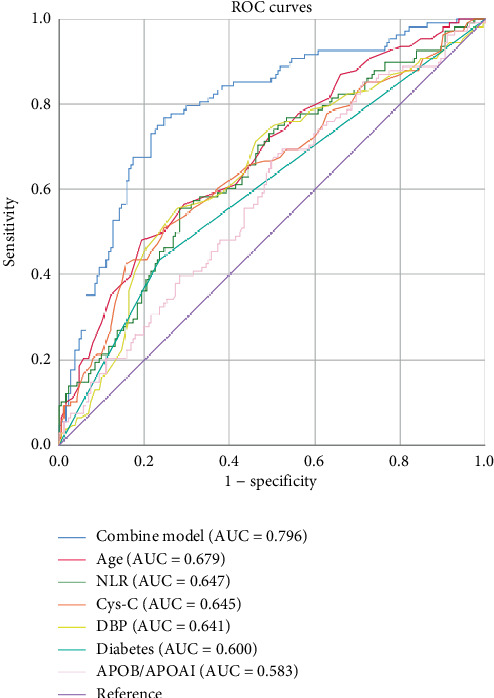
ROC curves for aortic valve calcification and various risk factors.
Figure 5.

CAVD prediction model calibration curve. Note: Apparent, calibration curve for predicted incidence; bias-corrected, measured incidence curve; ideal, ideal reference line.
4. Discussion
Globally, there is a clear transition in the incidence of cardiovascular disease from the young to the old, with an exponential increase with age [29]. CAVD is a common cardiovascular disease, and a large-scale survey demonstrated that the prevalence of aortic stenosis was approximately 0.4% in individuals younger than 45 years of age, 1.5% in those aged 65 years and older, and 3.4% in those aged 75 years and older [30]. As in previous studies, the results of the present study showed that the mean age of the aortic valve calcification group was significantly higher than that of the control group, suggesting an increase in the occurrence of CAVD with increasing age.
Studies have clearly classified CAVD pathology into lipid deposition (early stage), inflammatory fibrosis (middle stage), and calcification (late stage), with the rate of progression positively correlating with the baseline lipid level and the number of risk factors, such as hypertension and diabetes mellitus. The rabbit model on a high cholesterol diet showed that lipid deposition in the valve appeared within 3 months, the inflammatory response intensified within 6–12 months, and calcified plaque formed within 18–24 months, which corresponds to 15–20 years in humans when scaled to the life span of the species [6]. A study explored the relationship between LDL and aortic valve calcification by integrating data from multiple community-based cohorts, which included a total of 6942 patients, and found that for every 1 mmol/L increase in LDL, there was a 28% increase in the risk of developing CAVD [31]. But a study analyzing valve tissue from 102 patients with aortic stenosis found that an elevated proportion of small, dense LDL particles was significantly associated with intervalvular oxidative LDL deposition, inflammatory response, and stenosis progression, even when total LDL levels were normal. Thus, single LDL is not a good predictor of aortic valve disease [32]. It has also been suggested that an elevated APOB/APOA1 ratio in patients with metabolic syndrome independently predicts the risk of aortic valve calcification, even when LDL is normal [33], which suggested the combination of APOB/APOA1 with hypertension, diabetes, and hyperlipidemia is a valid predictor of CAVD.
Prior research has demonstrated that the APOB/APOA1 is a risk factor for cardiovascular disease and is associated with an unfavorable prognosis for cardiovascular disease [34, 35]. APOB and APOA1 levels are predictors of cardiovascular events and all-cause mortality in patients with chronic kidney disease [36]. APOB/APOA1, as a novel lipid parameter, shows a unique clinical value in the field of cardiovascular disease. The APOB/APOA1 has significant advantages over traditional lipid markers, and its core value is reflected in the accurate reflection of atherosclerosis mechanisms and the improvement of clinical predictive efficacy. APOB, as the main apolipoprotein of atherogenic lipoproteins such as LDL, intermediate-density lipoprotein, and very low-density lipoprotein, directly corresponds to the number of atherogenic particles in the circulation, whereas APOA1 is the core component of HDL that plays an antiatherosclerotic role. APOB/APOA1 can assess the pathophysiological status of lipoprotein metabolism in a dynamic and balanced manner, which compensates for the limitation that LDL only reflects cholesterol content and ignores particle heterogeneity [37]. A change in any of these indices leads to an imbalance in the APOB/APOA1 [38, 39].
A comprehensive exploration of the underlying mechanisms and their application to clinical practice is of paramount importance in enhancing the early recognition and diagnosis of cardiovascular diseases, thus providing a novel direction for the diagnosis and treatment of cardiovascular diseases.
In this study, we found APOB/APOA1 can be used for the prediction of CAVD. APOB acts as a ligand for the surface receptor of LDL, transports cholesterol from the liver to the periphery, and induces platelet activation, degranulation, and adhesion release to promote the inflammatory response; alternatively, natural polymorphic APOB danger-associated Signaling 1 has been found to efficiently activate platelets and promote platelet–leukocyte interactions, which plays an important role in the promotion of inflammatory response by APOB [40]. APOA1 is the main protein component in HDL, which can inhibit platelet activation, reduce clot strength and stability by inhibiting thromboxane A2 release, and bind with HDL receptor, which not only promotes reverse cholesterol transport and prevents cholesterol from being deposited abnormally and damaging the vascular endothelium but also activates the activity of inducible nitric oxide synthase, thus maintaining endothelial cell integrity and acting as a protective agent [41, 42]. APOB drives inflammatory activation via nuclear factor kappa-light-chain-enhancer of activated B-cell (NF-κB) signaling, whereas APOA1 exerts protective effects through ATP-binding cassette transporter A1 (ABCA1)–dependent cholesterol efflux and nod-like receptor family pyrin domain Containing 3 (NLRP3) inflammasome inhibition [43–46]. While the NLR ratio reflects the level of systemic inflammation, the APOB/APOA1 and NLR were significantly higher in the aortic valve calcification group than in the control group, which suggests that the APOB/APOA1 is an indicator of the balance between lipid and inflammatory responses in patients with aortic valve calcification. A high APOB/APOA1 suggests that the balance between “promotion” and “inhibition” is disrupted, which may explain the increased risk of aortic valve calcification with an elevated APOB/APOA1.
Moreover, the results of a study encompassing 17,745 participants, with a follow-up period of 19.8 years, indicated that an increase of 30% in the APOB/APOA1 ratio was associated with a 30% rise in the risk of aortic valve stenosis [47]. A study of 159 patients with aortic stenosis, followed over a period of 2 years, revealed that stenosis progressed at a rate of 3.4 times faster in patients with APOB/APOA1 ratios ≥ 0.62 than in those with low ratios [48]. Some studies have confirmed the general risk prediction value of APOB/APOA1 in global populations and the superiority of APOB/APOA1 over HDL or LDL assays alone for early risk identification, which provides strong support for early risk identification in cardiovascular disease [49]. The findings of the present study demonstrated that while the area under the ROC curve (AUC = 0.583) of a solitary APOB/APOA1 indicator was comparatively constrained (see Table 7), its correlation with CAVD is still better than other lipid parameters, such as HDL and LDL. In addition, the effectiveness of its amalgamated model with other indicators was satisfactory for the prediction of CAVD (AUC of the amalgamated model = 0.796, sensitivity = 0.769, and specificity = 0.754). The results of a randomized, double-blind, placebo-controlled trial [50] demonstrated that an abnormal APOB/APOA1 (> 0.7) significantly improved the predictive power of traditional cardiovascular disease risk models [51, 52] and the results of our study are similar to those of this study. In patients with CAVD, an elevated APOB/APOA1 may promote inflammation via lipid deposition and osteogenic differentiation of the VIC through the modulation of pathways such as the Wnt pathway [47].
These findings support the use of the APOB/APOA1 in combination with other risk indicators in clinical practice to assess CAVD risk, especially in populations where traditional indicators are insufficient for a comprehensive assessment of risk, and whereby clinicians can stratify their patients and develop personalized preventive programs, such as lifestyle modification and initiation of pharmacological interventions, to reduce the incidence of cardiovascular events.
Despite the encouraging application prospects of the APOB/APOA1, further study is required on this front. Firstly, large-scale, multicenter prospective studies should be conducted to clarify the optimal threshold values of the APOB/APOA1 in different populations (different ages, genders, and races), so as to improve its accuracy and usefulness in clinical diagnosis. Secondly, the combination of the APOB/APOA1 with other parameters should be explored to further improve its predictive ability for CAVD risk [53]. In addition, combining multiomics studies to explore the specific signaling pathways and key factors involved in the APOB/APOA1 affecting valve calcification will help to investigate therapeutic agents targeting these pathways and key factors, thereby slowing down the progression of CAVD.
This study also found that CAVD is associated with the following factors: diabetes, blood pressure, and Cys-c.
The prevalence of diabetes is increasing year by year, and there are now more than 150 million people with diabetes globally. Diabetes is associated with the development of several cardiovascular diseases. Diabetes mellitus is also associated with vascular calcification, which has a complex pathological mechanism involving synergistic effects of metabolic disorders, inflammatory responses, and abnormal cellular functions at multiple levels [54, 55]. Wang et al.'s study identified diabetes mellitus as risk factors for calcific heart valve disease through the analysis of their medical history [56]. Cheng's study finds that diabetes is associated with the development of degenerative heart valve disease [57]. In conjunction with the results of this study, it is illustrated that diabetes mellitus is positively associated with calcific aortic valve lesions and is a risk factor for the development of calcific aortic valve lesions.
Blood pressure is strongly associated with the development and prognosis of many cardiovascular diseases [58, 59]. A Mendelian randomization study [60] showed that both diastolic and systolic blood pressures were significantly associated with several cardiovascular diseases, including myocardial infarction, increasing the risk of these diseases. Zhang et al.'s study found that low DBP is a risk factor for diastolic insufficiency of the heart [61]. Similar results were found in the study by Chen et al. [62]. In terms of pathological changes, a decrease in DBP results in a slowing of blood flow at the aortic valve, increasing the likelihood of stagnation. This promotes contact between blood components and the aortic valve, allowing for reactions with the valve. This results in the promotion of aortic valve calcification, which in turn leads to incomplete valve closure and the regurgitation of some ventricular blood during diastole. This further contributes to the reduction in DBP. The results of Iwata et al.'s study indicated that DBP was negatively correlated with aortic valve calcification [63]. In conjunction with the results of this study, DBP was negatively correlated with CAVD, suggesting that elevated DBP inhibits aortic valve calcification.
Cys-c is a class of low molecular weight nonglycosylated proteins and a member of the human cysteine protease inhibitor superfamily [64]. Cys-c is widely distributed in human tissue cells and blood, and the kidney is the only metabolic pathway for Cys-c, which is filtered in the glomerulus and reabsorbed and catabolized in the proximal tubule. Some studies have confirmed that Cys-c is more accurate and sensitive to the early and slight changes in glomerular filtration rate and can be used to assess the early stage of renal function impairment [65]. In recent years, Cys-c has been found to be valuable in the prediction of cardiovascular disease, with one study suggesting that Cys-c is independently associated with coronary artery calcification [66]. Elevated Cys-c is associated with coronary atherosclerotic plaque formation in Vakili et al.'s study [67]. Cho et al.'s study finds Cys-c to be a valid marker for predicting cardiovascular disease progression or new onset [68]. Cys-c may induce osteoblast-like cell differentiation and promote vascular calcification by upregulating the expression of osteogenesis-related genes (Runx2 and osteocalcin) [69]. In this study, Cys-c was found to be positively associated with CAVD and is a risk factor for aortic valve calcification.
In conclusion, this study clarifies the correlation between lipids and cardiovascular disease, although the predictive value of a single APOB/APOA1 indicator for CAVD is relatively limited, but still statistically significant; it correlates better with CAVD than traditional lipid parameters, and the APOB/APOA1 ratio together with age, history of diabetes mellitus, DBP, Cys-c, and NLR constitutes a good predictive efficacy for CAVD in a combined model.
5. Conclusions
The lipid parameters APOA1, APOB/APOA1, cumulative LDL exposure, and non-HDL/HDL have been demonstrated to be associated with aortic valve calcification. Furthermore, APOB/APOA1 can be used for the prediction of CAVD, and the combination of APOB/APOA1 with age, history of diabetes, DBP, Cys-c, and NLR has better prediction performance for CAVD.
5.1. Limitations and Prospects
It must be acknowledged that the present study is a single-center, small-sample, retrospective study, which may have resulted in the observed results being affected by other vascular calcifications. Consequently, it would be beneficial for future multicenter, large sample, prospective, follow-up studies to be conducted in order to confirm these findings.
Nomenclature
- AIP
atherogenic index of plasma
- ALP
alkaline phosphatase
- APOA1
Apolipoprotein A1
- APOB
Apolipoprotein B
- BMI
body mass index
- BSA
body surface area
- CAVD
calcific aortic valve disease
- CT
computed tomography
- Cys-c
Cystatin C
- DBP
diastolic blood pressure
- HbA1c
glycated hemoglobin A1c
- HDL
high-density lipoprotein
- LDH
lactate dehydrogenase
- LDL
low-density lipoprotein
- LY%
lymphocyte percentage
- NEUT%
neutrophil percentage
- NLR
neutrophil-to-lymphocyte ratio
- SBP
systolic blood pressure
- TC
total cholesterol
- TG
triglyceride
- UA
uric acid
- WBC
white blood cell
Data Availability Statement
The data that support the findings of this study are available from the corresponding author upon reasonable request.
Ethics Statement
Ethics approval has been approved by the Second Hospital of Dalian Medical University.
Consent
The authors have nothing to report.
Disclosure
The authors confirm that the manuscript has been read and approved for publication by all of the named authors. This paper is already published in the preprint given in [70].
Conflicts of Interest
The authors declare no conflicts of interest.
Author Contributions
Yuxing Wang: methodology, investigation, software, formal analysis, data curation, writing—original draft preparation, writing—review and editing; Ming Yu: methodology, software, formal analysis; Song Yang: investigation, data curation; Jiajie Mei: formal analysis; Zhenzhu Liu: formal analysis; Zhaohong Geng: formal analysis; Wenli Xie: formal analysis; Lijiao Zhang: formal analysis; Hongyan Wang: supervision; Nan Niu: supervision, resources; Peng Qu: project administration, supervision
Funding
No funding was received for this manuscript.
References
- 1.Osnabrugge R. L., Mylotte D., Head S. J., et al. Aortic Stenosis in the Elderly. Journal of the American College of Cardiology . 2013;62(11):1002–1012. doi: 10.1016/j.jacc.2013.05.015. [DOI] [PubMed] [Google Scholar]
- 2.Roth G. A., Mensah G. A., Johnson C. O., et al. Global Burden of Cardiovascular Diseases and Risk Factors, 1990-2019: Update From the GBD 2019 Study. Journal of the American College of Cardiology . 2020;76(25):2982–3021. doi: 10.1016/j.jacc.2020.11.010. [DOI] [PMC free article] [PubMed] [Google Scholar]
- 3.Sasakawa Y., Okamoto N., Fujii M., Kato J., Yuzawa Y., Inaguma D. Factors Associated With Aortic Valve Stenosis in Japanese Patients With End-Stage Kidney Disease. BMC Nephrology . 2022;23(1):p. 129. doi: 10.1186/s12882-022-02758-y. [DOI] [PMC free article] [PubMed] [Google Scholar]
- 4.Otto C. M., Lind B. K., Kitzman D. W., Gersh B. J., Siscovick D. S. Association of Aortic-Valve Sclerosis With Cardiovascular Mortality and Morbidity in the Elderly. New England Journal of Medicine . 1999;341(3):142–147. doi: 10.1056/NEJM199907153410302. [DOI] [PubMed] [Google Scholar]
- 5.Liu L., Zhao Y. S., Wang S. W., et al. An Epidemiological Study on degenerated Heart valvular diseases among military Elderly Population in Beijing. Chinese Journal of Epidemiology . 2006;27(10):836–839. doi: 10.3760/j.issn:0254-6450.2006.10.003. [DOI] [PubMed] [Google Scholar]
- 6.Rajamannan N. M., Evans F. J., Aikawa E., et al. Calcific Aortic Valve Disease: Not Simply a Degenerative Process. Circulation . 2011;124(16):1783–1791. doi: 10.1161/CIRCULATIONAHA.110.006767. [DOI] [PMC free article] [PubMed] [Google Scholar]
- 7.Nkomo V. T., Gardin J. M., Skelton T. N., Gottdiener J. S., Scott C. G., Enriquez-Sarano M. Burden of Valvular Heart Diseases: A Population-Based Study. Lancet . 2006;368(9540):1005–1011. doi: 10.1016/S0140-6736(06)69208-8. [DOI] [PubMed] [Google Scholar]
- 8.Eveborn G. W., Schirmer H., Lunde P., Heggelund G., Hansen J. B., Rasmussen K. Assessment of Risk Factors for Developing Incident Aortic Stenosis: The Tromsø Study. European Journal of Epidemiology . 2014;29(8):567–575. doi: 10.1007/s10654-014-9936-x. [DOI] [PubMed] [Google Scholar]
- 9.Roderburg C., Loosen S. H., Luedde T., Kostev K., Luedde M. Diabetes Mellitus Is Associated With an Increased Incidence of Aortic Valve Stenosis. Diabetes & Vascular Disease Research . 2021;18(5) doi: 10.1177/14791641211033819.14791641211033819 [DOI] [PMC free article] [PubMed] [Google Scholar]
- 10.Lindman B. R., Clavel M. A., Mathieu P., et al. Calcific Aortic Stenosis. Nature Reviews. Disease Primers . 2016;2(1) doi: 10.1038/nrdp.2016.6.16006 [DOI] [PMC free article] [PubMed] [Google Scholar]
- 11.de Oliveira Sá M. P. B., Cavalcanti L. R. P., Perazzo Á. M., et al. Calcific Aortic Valve Stenosis and Atherosclerotic Calcification. Current Atherosclerosis Reports . 2020;22(2) doi: 10.1007/s11883-020-0821-7. [DOI] [PubMed] [Google Scholar]
- 12.Jian B., Jones P. L., Li Q., Mohler E. R., 3rd, Schoen F. J., Levy R. J. Matrix Metalloproteinase-2 Is Associated With Tenascin-C in Calcific Aortic Stenosis. American Journal of Pathology . 2001;159(1):321–327. doi: 10.1016/S0002-9440(10)61698-7. [DOI] [PMC free article] [PubMed] [Google Scholar]
- 13.Carità P., Coppola G., Novo G., et al. Aortic Stenosis: Insights on Pathogenesis and Clinical Implications. Journal of Geriatric Cardiology . 2016;13(6):489–498. doi: 10.11909/j.issn.1671-5411.2016.06.001. [DOI] [PMC free article] [PubMed] [Google Scholar]
- 14.Nsaibia M. J., Devendran A., Goubaa E., Bouitbir J., Capoulade R., Bouchareb R. Implication of Lipids in Calcified Aortic Valve Pathogenesis: Why Did Statins Fail? Journal of Clinical Medicine . 2022;11(12):p. 3331. doi: 10.3390/jcm11123331. [DOI] [PMC free article] [PubMed] [Google Scholar]
- 15.Goody P. R., Hosen M. R., Christmann D., et al. Aortic Valve Stenosis. Arteriosclerosis, Thrombosis, and Vascular Biology . 2020;40(4):885–900. doi: 10.1161/ATVBAHA.119.313067. [DOI] [PubMed] [Google Scholar]
- 16.Sider K. L., Zhu C., Kwong A. V., Mirzaei Z., de Langé C. F., Simmons C. A. Evaluation of a Porcine Model of Early Aortic Valve Sclerosis. Cardiovascular Pathology . 2014;23(5):289–297. doi: 10.1016/j.carpath.2014.05.004. [DOI] [PubMed] [Google Scholar]
- 17.Evangelista A., Galian-Gay L., Guala A., et al. Atorvastatin Effect on Aortic Dilatation and Valvular Calcification Progression in Bicuspid Aortic Valve (BICATOR): A Randomized Clinical Trial. Circulation . 2024;149(25):1938–1948. doi: 10.1161/CIRCULATIONAHA.123.067537. [DOI] [PubMed] [Google Scholar]
- 18.Cowell S. J., Newby D. E., Prescott R. J., et al. A Randomized Trial of Intensive Lipid-Lowering Therapy in Calcific Aortic Stenosis. New England Journal of Medicine . 2005;352(23):2389–2397. doi: 10.1056/NEJMoa043876. [DOI] [PubMed] [Google Scholar]
- 19.Rossebø A. B., Pedersen T. R., Boman K., et al. Intensive Lipid Lowering With Simvastatin and Ezetimibe in Aortic Stenosis. New England Journal of Medicine . 2008;359(13):1343–1356. doi: 10.1056/NEJMoa0804602. [DOI] [PubMed] [Google Scholar]
- 20.Chan K. L., Teo K., Dumesnil J. G., Ni A., Tam J., ASTRONOMER Investigators Effect of Lipid Lowering With Rosuvastatin on Progression of Aortic Stenosis. Circulation . 2010;121(2):306–314. doi: 10.1161/CIRCULATIONAHA.109.900027. [DOI] [PubMed] [Google Scholar]
- 21.Moura L. M., Ramos S. F., Zamorano J. L., et al. Rosuvastatin Affecting Aortic Valve Endothelium to Slow the Progression of Aortic Stenosis. Journal of the American College of Cardiology . 2007;49(5):554–561. doi: 10.1016/j.jacc.2006.07.072. [DOI] [PMC free article] [PubMed] [Google Scholar]
- 22.Lawler P. R., Akinkuolie A. O., Chu A. Y., et al. Atherogenic Lipoprotein Determinants of Cardiovascular Disease and Residual Risk Among Individuals With Low Low-Density Lipoprotein Cholesterol. Journal of the American Heart Association . 2017;6(7) doi: 10.1161/JAHA.117.005549.e005549 [DOI] [PMC free article] [PubMed] [Google Scholar]
- 23.Cho K. H. Structural and Functional Changes of Reconstituted High-Density Lipoprotein (HDL) by Incorporation of α-Synuclein: A Potent Antioxidant and Anti-Glycation Activity of α-Synuclein and apoA-I in HDL at High Molar Ratio of α-Synuclein. Molecules . 2021;26(24):p. 7485. doi: 10.3390/molecules26247485. [DOI] [PMC free article] [PubMed] [Google Scholar]
- 24.Alagona P., Jr., Ahmad T. A. Cardiovascular Disease Risk Assessment and Prevention. Medical Clinics of North America . 2015;99(4):711–731. doi: 10.1016/j.mcna.2015.02.003. [DOI] [PubMed] [Google Scholar]
- 25.Otto C. M., Nishimura R. A., Bonow R. O., et al. 2020 ACC/AHA Guideline for the Management of Patients With Valvular Heart Disease: Executive Summary: A Report of the American College of Cardiology/American Heart Association Joint Committee on Clinical Practice Guidelines. Circulation . 2021;143(5):e35–e71. doi: 10.1161/CIR.0000000000000932. [DOI] [PubMed] [Google Scholar]
- 26.Gupta K., Hinkamp C., Andrews T., et al. Highlights of Cardiovascular Disease Prevention Studies Presented at the 2023 European Society of Cardiology Congress. Current Atherosclerosis Reports . 2023;25(12):965–978. doi: 10.1007/s11883-023-01164-5. [DOI] [PubMed] [Google Scholar]
- 27.Yin B., Wu Z., Xia Y., Xiao S., Chen L., Li Y. Non-Linear Association of Atherogenic Index of Plasma With Insulin Resistance and Type 2 Diabetes: A Cross-Sectional Study. Cardiovascular Diabetology . 2023;22(1):p. 157. doi: 10.1186/s12933-023-01886-5. [DOI] [PMC free article] [PubMed] [Google Scholar]
- 28.Gao Y. X., Zhang J. X. Sample Size Determination for Logistic Regression Analysis. Evidence-Based Medicine . 2018;18(2):122–124. doi: 10.12019/j.issn.1671-5144.2018.02.015. [DOI] [Google Scholar]
- 29.Shu S., Yang Y., Sun B., et al. Alerting Trends in Epidemiology for Calcific Aortic Valve Disease, 1990-2019: An Age-Period-Cohort Analysis for the Global Burden of Disease Study 2019. European Heart Journal - Quality of Care and Clinical Outcomes . 2023;9(5):459–473. doi: 10.1093/ehjqcco/qcad018. [DOI] [PMC free article] [PubMed] [Google Scholar]
- 30.Yang Y., Wang Z., Chen Z., et al. Current Status and Etiology of Valvular Heart Disease in China: A Population-Based Survey. BMC Cardiovascular Disorders . 2021;21(1):p. 339. doi: 10.1186/s12872-021-02154-8. [DOI] [PMC free article] [PubMed] [Google Scholar]
- 31.George T., Kevin L., Schulz Christina A., et al. Abstract 47: Genetically Elevated Low-Density Lipoprotein Cholesterol Is Associated With Aortic Valve Calcification and Incident Aortic Stenosis. Circulation . 2014;129(supplement_1):A47–A47. doi: 10.1161/circ.129.suppl_1.47. [DOI] [Google Scholar]
- 32.Dania M., Philippe P., Jean-Pierre D., et al. Association Between Plasma LDL Particle Size, Valvular Accumulation of Oxidized LDL, and Inflammation in Patients With Aortic Stenosis. Arteriosclerosis, Thrombosis, and Vascular Biology . 2008;28(1):187–193. doi: 10.1161/ATVBAHA.107.154989. [DOI] [PubMed] [Google Scholar]
- 33.Jing F., Mao Y., Guo J., et al. The Value of Apolipoprotein B/Apolipoprotein A1 Ratio for Metabolic Syndrome Diagnosis in a Chinese Population: A Cross-Sectional Study. Lipids in Health and Disease . 2014;13(1):p. 81. doi: 10.1186/1476-511X-13-81. [DOI] [PMC free article] [PubMed] [Google Scholar]
- 34.Hua R., Li Y., Li W., Wei Z., Yuan Z., Zhou J. Apolipoprotein B/A1 Ratio Is Associated With Severity of Coronary Artery Stenosis in CAD Patients but Not in Non-CAD Patients Undergoing Percutaneous Coronary Intervention. Disease Markers . 2021;2021(1) doi: 10.1155/2021/8959019.8959019 [DOI] [PMC free article] [PubMed] [Google Scholar]
- 35.Liu D., Zhang Y., Wang C., Zuo H. Association of the ApoB/ApoA-I Ratio With Stroke Risk: Findings From the China Health and Nutrition Survey (CHNS) Nutrition, Metabolism and Cardiovascular Diseases . 2022;32(1):203–209. doi: 10.1016/j.numecd.2021.09.033. [DOI] [PubMed] [Google Scholar]
- 36.Wentao H., Shaomin L., Peijia L., Xun L. Study on the Association of Lipid Levels With Prognosis of Cardiovascular Events and All-Cause Mortality in Patients With Different CKD Stages. New Medicine . 2020;51(6):439–444. doi: 10.3969/j.issn.0253-9802.2020.06.007. [DOI] [Google Scholar]
- 37.Carnevale Schianca G. P., Pedrazzoli R., Onolfo S., et al. ApoB/ApoA-I Ratio Is Better Than LDL-C in Detecting Cardiovascular Risk. Nutrition, Metabolism and Cardiovascular Diseases . 2011;21(6):406–411. doi: 10.1016/j.numecd.2009.11.002. [DOI] [PubMed] [Google Scholar]
- 38.Calling S., Johansson S. E., Wolff M., Sundquist J., Sundquist K. Total Cholesterol/HDL-C Ratio Versus Non-HDL-C as Predictors for Ischemic Heart Disease: A 17-Year Follow-Up Study of Women in Southern Sweden. BMC Cardiovascular Disorders . 2021;21(1):p. 163. doi: 10.1186/s12872-021-01971-1. [DOI] [PMC free article] [PubMed] [Google Scholar]
- 39.Goswami B., Rajappa M., Mallika V., Kumar S., Shukla D. K. Apo-B/Apo-AI Ratio: A Better Discriminator of Coronary Artery Disease Risk Than Other Conventional Lipid Ratios in Indian Patients With Acute Myocardial Infarction. Acta Cardiologica . 2008;63(6):749–755. doi: 10.2143/AC.63.6.2033393. [DOI] [PubMed] [Google Scholar]
- 40.Assinger A., Wang Y., Butler L. M., et al. Apolipoprotein B100 Danger-Associated Signal 1 (ApoBDS-1) Triggers Platelet Activation and Boosts Platelet-Leukocyte Proinflammatory Responses. Thrombosis and Haemostasis . 2014;112(8):332–341. doi: 10.1160/TH13-12-1026. [DOI] [PubMed] [Google Scholar]
- 41.Jones W. L., Ramos C. R., Banerjee A., et al. Apolipoprotein A-I, Elevated in Trauma Patients, Inhibits Platelet Activation and Decreases Clot Strength. Platelets . 2022;33(8):1119–1131. doi: 10.1080/09537104.2022.2078488. [DOI] [PMC free article] [PubMed] [Google Scholar]
- 42.García-Ortega A., Mañas E., López-Reyes R., et al. Obstructive Sleep Apnoea and Venous Thromboembolism: Pathophysiological Links and Clinical Implications. European Respiratory Journal . 2019;53(2) doi: 10.1183/13993003.00893-2018.1800893 [DOI] [PubMed] [Google Scholar]
- 43.Wu J., Wang Y., Li H., Tan W., Chen X., Ye S. Serum Apolipoprotein B-to-Apolipoprotein A1 Ratio Is Independently Associated With Disease Severity in Patients With Acute Pancreatitis. Scientific Reports . 2019;9(1):p. 7764. doi: 10.1038/s41598-019-44244-w. [DOI] [PMC free article] [PubMed] [Google Scholar]
- 44.Li J., Liu J., Yu Y., Liu Y., Guan X. NF-κB/ABCA1 Pathway Aggravates Ox-LDL-Induced Cell Pyroptosis by Activation of NLRP3 Inflammasomes in THP-1-Derived Macrophages. Molecular Biology Reports . 2022;49(7):6161–6171. doi: 10.1007/s11033-022-07408-y. [DOI] [PubMed] [Google Scholar]
- 45.Thompson P. A., Gauthier K. C., Varley A. W., Kitchens R. L. ABCA1 Promotes the Efflux of Bacterial LPS From Macrophages and Accelerates Recovery From LPS-Induced Tolerance. Journal of Lipid Research . 2010;51(9):2672–2685. doi: 10.1194/jlr.M007435. [DOI] [PMC free article] [PubMed] [Google Scholar]
- 46.Smith J. D. Apolipoprotein A-I and Its Mimetics for the Treatment of Atherosclerosis. Current Opinion in Investigational Drugs . 2010;11(9):989–996. [PMC free article] [PubMed] [Google Scholar]
- 47.Zheng K. H., Arsenault B. J., Kaiser Y., et al. ApoB/ApoA-I Ratio and Lp(a) Associations With Aortic Valve Stenosis Incidence: Insights From the EPIC-Norfolk Prospective Population Study. Journal of the American Heart Association . 2019;8(16) doi: 10.1161/JAHA.119.013020.e013020 [DOI] [PMC free article] [PubMed] [Google Scholar]
- 48.Tastet L., Capoulade R., Shen M., et al. ApoB/ApoA-I Ratio Is Associated With Faster Hemodynamic Progression of Aortic Stenosis: Results From the PROGRESSA (Metabolic Determinants of the Progression of Aortic Stenosis) Study. Journal of the American Heart Association . 2018;7(4) doi: 10.1161/JAHA.117.007980.e007980 [DOI] [PMC free article] [PubMed] [Google Scholar]
- 49.Anand S. S., Islam S., Rosengren A., et al. Risk Factors for Myocardial Infarction in Women and Men: Insights From the INTERHEART Study. European Heart Journal . 2008;29(7):932–940. doi: 10.1093/eurheartj/ehn018. [DOI] [PubMed] [Google Scholar]
- 50.Ridker P. M., Pradhan A., MacFadyen J. G., Libby P., Glynn R. J. Cardiovascular Benefits and Diabetes Risks of Statin Therapy in Primary Prevention: An Analysis From the JUPITER Trial. Lancet . 2012;380(9841):565–571. doi: 10.1016/S0140-6736(12)61190-8. [DOI] [PMC free article] [PubMed] [Google Scholar]
- 51.Sierra-Johnson J., Fisher R. M., Romero-Corral A., et al. Concentration of Apolipoprotein B Is Comparable With the Apolipoprotein B/Apolipoprotein A-I Ratio and Better Than Routine Clinical Lipid Measurements in Predicting Coronary Heart Disease Mortality: Findings From a Multi-Ethnic US Population. European Heart Journal . 2008;30(6):710–717. doi: 10.1093/eurheartj/ehn347. [DOI] [PMC free article] [PubMed] [Google Scholar]
- 52.Walldius G., de Faire U., Alfredsson L., et al. Long-Term Risk of a Major Cardiovascular Event by ApoB, ApoA-1, and the ApoB/ApoA-1 Ratio-Experience From the Swedish AMORIS Cohort: A Cohort Study. PLOS Medicine . 2021;18(12) doi: 10.1371/journal.pmed.1003853.e1003853 [DOI] [PMC free article] [PubMed] [Google Scholar]
- 53.Öhman M., Öhman M. L., Wållberg-Jonsson S. The ApoB/ApoA1 Ratio Predicts Future Cardiovascular Events in Patients With Rheumatoid Arthritis. Scandinavian Journal of Rheumatology . 2014;43(4):259–264. doi: 10.3109/03009742.2013.877158. [DOI] [PubMed] [Google Scholar]
- 54.Kampoli A. M., Tousoulis D., Briasoulis A., Latsios G., Papageorgiou N., Stefanadis C. Potential Pathogenic Inflammatory Mechanisms of Endothelial Dysfunction Induced by Type 2 Diabetes Mellitus. Current Pharmaceutical Design . 2011;17(37):4147–4158. doi: 10.2174/138161211798764825. [DOI] [PubMed] [Google Scholar]
- 55.Lin X., He S. Q., Shan S. K., et al. Endothelial Cells Derived Extracellular Vesicles Promote Diabetic Arterial Calcification Via circ_0008362/miR-1251-5p/Runx2 Axial. Cardiovascular Diabetology . 2024;23(1):p. 369. doi: 10.1186/s12933-024-02440-7. [DOI] [PMC free article] [PubMed] [Google Scholar]
- 56.Xue W., Tian H., Bin D. Analysis of Risk Factors Associated With Degenerative Valvular Heart Disease in the Elderly. Disease Monitoring and Control . 2009;3(7):417–418+396. [Google Scholar]
- 57.Cheng N. Echocardiographic Imaging Characteristics and Associated Risk Factors in Elderly Patients With Degenerative Heart Valve Disease. Chinese Journal of Gerontology . 2019;39(24):5920–5922. doi: 10.3969/j.issn.1005-9202.2019.24.006. [DOI] [Google Scholar]
- 58.Juraschek S. P., Hu J. R., Cluett J. L., et al. Orthostatic Hypotension, Hypertension Treatment, and Cardiovascular Disease. JAMA . 2023;330(15):1459–1471. doi: 10.1001/jama.2023.18497. [DOI] [PMC free article] [PubMed] [Google Scholar]
- 59.He J., Ouyang N., Guo X., et al. Effectiveness of a Non-Physician Community Health-Care Provider-Led Intensive Blood Pressure Intervention Versus Usual Care on Cardiovascular Disease (CRHCP): An Open-Label, Blinded-Endpoint, Cluster-Randomised Trial. Lancet . 2023;401(10380):928–938. doi: 10.1016/S0140-6736(22)02603-4. [DOI] [PubMed] [Google Scholar]
- 60.Richardson T. G., Sanderson E., Elsworth B., Tilling K., Davey S. G. Use of Genetic Variation to Separate the Effects of Early and Later Life Adiposity on Disease Risk: Mendelian Randomisation Study. BMJ . 2020;369(369) doi: 10.1136/bmj.m1203.m1203 [DOI] [PMC free article] [PubMed] [Google Scholar]
- 61.Zhang T. T., Zhang X. Y., Zhao Z. W., Sun G., Niu Y. M., Lin J. Effect of Low Diastolic Blood Pressure on Diastolic Function in Elderly Patients With Primary Hypertension. Journal of China Pharmaceutical University . 2016;45(6):514–517. doi: 10.12007/j.issn.0258-4646.2016.06.009. [DOI] [Google Scholar]
- 62.Chen Y. M., Wu Y. T., Cao D. Y., Pei Z. Y., Dong L., Yao Y. Q. Correlation of Diastolic Blood Pressure and Blood Pressure Trough Ratio With Left Ventricular Diastolic Function in Elderly Patients. Medical Recapitulate . 2013;19(18):3395–3397. doi: 10.3969/j.issn.1006-2084.2013.18.045. [DOI] [Google Scholar]
- 63.Iwata S., Russo C., Jin Z., et al. Higher Ambulatory Blood Pressure Is Associated With Aortic Valve Calcification in the Elderly. Hypertension . 2013;61(1):55–60. doi: 10.1161/HYPERTENSIONAHA.112.202697. [DOI] [PMC free article] [PubMed] [Google Scholar]
- 64.Angelidis C., Deftereos S., Giannopoulos G., et al. Cystatin C: An Emerging Biomarker in Cardiovascular Disease. Current Topics in Medicinal Chemistry . 2013;13(2):164–179. doi: 10.2174/1568026611313020006. [DOI] [PubMed] [Google Scholar]
- 65.Horio M., Imai E., Yasuda Y., Watanabe T., Matsuo S. GFR Estimation Using Standardized Serum Cystatin C in Japan. American Journal of Kidney Diseases . 2013;61(2):197–203. doi: 10.1053/j.ajkd.2012.07.007. [DOI] [PubMed] [Google Scholar]
- 66.Hou F. J., Wang Z. Z., Wang Y. P., et al. Correlation Study Between Cystatin C and Coronary Artery Calcification. Cardiovascular Research . 2016;14(1):29–32. doi: 10.3969/j.issn.1672-5301.2016.01.008. [DOI] [Google Scholar]
- 67.Vakili H., Mohamadian A., Naderian M., Khaheshi I. Cystatin C May Not Be a Precious Predictor for Coronary Artery Disease and Its Severity: An Area of Uncertainty. Acta Bio-Medica . 2018;89(2):209–213. doi: 10.23750/abm.v89i2.5495. [DOI] [PMC free article] [PubMed] [Google Scholar]
- 68.Cho Y. K., Kang Y. M., Yoo J. H., et al. The Impact of Non-Alcoholic Fatty Liver Disease and Metabolic Syndrome on the Progression of Coronary Artery Calcification. Scientific Reports . 2018;8(1) doi: 10.1038/s41598-018-30465-y.12004 [DOI] [PMC free article] [PubMed] [Google Scholar]
- 69.Wang L., Han Q., Xie D. Diagnostic Value of Combined Serum Cystatin C, Homocysteine, and Triglyceride/High-Density Lipoprotein Cholesterol Ratio for Coronary Heart Disease in the Elderly. Journal of Experimental & Clinical Medicine . 2021;20(9):931–934. doi: 10.3969/j.issn.1671-4695.2021.09.010. [DOI] [Google Scholar]
- 70.Value of APOB/APOA1 Ratio in Prediction of Calcific Aortic Valve Disease in Reference Section in the Final Updated Main Manuscript Word Document. https://assets-eu.researchsquare.com/files/rs-5364924/v1/11f503f9-19db-4369-b617-7f56009e180e.pdf?c=1733178927 .
Associated Data
This section collects any data citations, data availability statements, or supplementary materials included in this article.
Data Availability Statement
The data that support the findings of this study are available from the corresponding author upon reasonable request.