

Abstract
Alprazolam benzodiazepine misuse is increasingly a public health concern, evidenced by rising cases of overdose and toxicity. Timely and accurate diagnosis is crucial for effective emergency room treatment. This study investigates the use of Fourier Transform Infrared (FTIR) spectroscopy as a rapid diagnostic tool for assessing alprazolam toxicity using saliva samples. Saliva samples were collected from 30 individuals, including healthy subjects and patients with confirmed alprazolam poisoning. FTIR spectroscopy in the form of Attenuated Total Reflectance (ATR) was used to study the spectral profiles of the samples. Statistical analyses, such as Gaussian peak fitting and Receiver Operating Characteristic (ROC) tests, were carried out to assess the diagnostic ability of the found spectral features. The designed protocol was subsequently applied to 55 additional saliva samples obtained from emergency room patients with suspected alprazolam poisoning, some of whom may have also used other drugs, but without confirmed multi-drug toxicity. Spectral differences between the two groups were evident, particularly in the 1200–1400 cm⁻¹ and 3000–3600 cm⁻¹ regions. ROC analysis demonstrated high diagnostic accuracy, differentiating healthy subjects from poisoned ones with 90% classification accuracy at 1200–1400 cm⁻¹ and perfect separation with 100% sensitivity and specificity at 3000–3600 cm⁻¹. A Fisher’s exact test confirmed the diagnostic utility of this method for identifying alprazolam-poisoned individuals, yielding a p-value of less than 0.0002. The results affirm FTIR spectroscopy’s potential as a precise, non-invasive diagnostic tool for alprazolam intoxication. Its ability to quickly distinguish between toxic and non-toxic levels is crucial for improving patient care in emergencies. Moreover, its application was effective even in cases with potential co-medication, provided that alprazolam was the primary suspected agent. FTIR spectroscopy is an effective method for diagnosing alprazolam toxicity in saliva samples, offering a quick, efficient, and non-invasive alternative to traditional techniques. This study opens the door for further research on FTIR in toxicological screening, with the potential to transform clinical practices in drug overdose management.
Keywords: Alprazolam toxicity, FTIR spectroscopy, Toxicology, Saliva analysis, Diagnosis
Subject terms: Diagnostic markers, Optical spectroscopy, Infrared spectroscopy
Introduction
From 2010 to 2020, global benzodiazepine (BZD) use varied significantly by region, influenced by differing healthcare systems. A study by one research team comparing figures from 2015 to 2019 across 74 countries found high levels of benzodiazepine use in high-income countries. Within Europe, prevalence of use was highly variable between countries, with France identified as having very high rates of use. The United States also demonstrated a high usage of benzodiazepines, especially among adult population, that highlights a national concern of prescription misuse. In addition, the five Nordic countries—Denmark, Finland, Iceland, Norway, and Sweden—were reviewed, revealing variations in the use of hypnotics and anxiolytics, including benzodiazepines, with increases observed across several countries and age groups. In China, a study conducted between 2011 and 2018 reported increased benzodiazepine use, especially among the elderly and psychiatric patients. Factors such as drug prescribing practices, access to medical care, public perceptions of mental disorders, and the availability of alternative medications likely contribute significantly to the regional variation in benzodiazepine prescriptions.
Hospital reports of past decades at Loqhman Hakim Hospital show that the majority of cases of poisoning are due to drug overdose. Benzodiazepines, in particular, have posed a considerable challenge for toxicology experts in recent years. Despite their high efficacy and prescription-only status, a substantial percentage of these drugs are misused. Alprazolam serves as a clear example of such substances1–3. Benzodiazepine poisoning, more so with alprazolam, present complications similar to opioids. However, management and treatment procedures of the two classes of drugs are very different. However, the management and treatment strategies for these two categories differ significantly. For instance, alprazolam toxicity can lead to central nervous system (CNS) or respiratory depression, which might be erroneously attributed to opioid overdose. It is crucial to accurately diagnose and promptly administer the appropriate treatment to mitigate these effects. Mismanagement of the treatment process can result in severe, sometimes irreversible, complications. In certain cases, these adverse effects can be fatal. Therefore, timely and precise intervention is essential to prevent long-term damage and improve patient outcomes4,5. Understanding these distinctions and implementing the correct therapeutic approach is imperative to avoid misdiagnosis and ensure effective patient care. FTIR Spectroscopy is a powerful analytical technique known for its rapid, accurate, and efficient diagnostic capabilities. In recent years, it has gained significant traction in the field of biology due to its ability to provide detailed molecular information. This technique is particularly valuable in scenarios requiring swift diagnostics, such as emergency cases of drug poisoning. A notable variant of FTIR is Attenuated Total Reflectance-Fourier Transform Infrared (ATR-FTIR) Spectroscopy. ATR-FTIR enhances the versatility of traditional FTIR by allowing direct analysis of solid or liquid samples without extensive preparation. This method involves measuring the changes that occur when an infrared beam is reflected internally within a crystal in contact with the sample. The resulting spectra provide detailed insights into the molecular composition and structure of the sample, making ATR-FTIR a crucial tool in biological research and clinical diagnostics6,7. In the context of complex matrices, the comparative analysis of spectra derived from infrared light can yield significant insights. This approach is particularly valuable in identifying and characterizing the molecular components within intricate biological samples. By comparing the spectral data, researchers can discern subtle differences in molecular structures, interactions, and concentrations, which are crucial for understanding the biochemical composition and dynamics of the sample8,9.
Saliva analysis offers a promising avenue for non-invasive diagnostics, particularly in monitoring drug intake and metabolic changes. The ease of collection and the ability to reflect real-time physiological conditions make saliva an ideal candidate for such studies. By leveraging techniques like FTIR and ATR-FTIR spectroscopy, researchers can obtain detailed molecular fingerprints of saliva samples, facilitating the detection of specific biomarkers and enhancing our understanding of various biological processes10,11. This study aims to analyze saliva samples for spectral features associated with biological changes indicative of alprazolam poisoning, rather than quantifying the drug itself. Physicians can quickly detect alprazolam poisoning using a simple saliva sample within minutes.
Methods
Sample collection
In this study, suspected cases of alprazolam poisoning were collected from patients at Loqhman Hakim Hospital in Tehran. There has been taken 100 samples at the time of admission in the emergency room. We have taken 85 of them randomly with some inclusion and exclusion criteria to train our model for identifying significant peaks and their relative importance. Finally, we employed 5 normal and 50 patients’ samples on other drugs to challenge the discriminative capability of the system towards distinguishing alprazolam toxicity from other toxicities of BZD. This blind testing aimed at ascertaining the capability of the system in distinguishing patients with alprazolam toxicity from patients on therapeutic doses of drugs like metformin. Group 1 consisted of healthy individuals who had no active viral or bacterial infections in the past two weeks, no benzodiazepine intake during the same period, and no underlying diseases or chronic drug use. These individuals also tested negative for benzodiazepines and were confirmed to be healthy based on blood samples tested at hospital laboratory. Exclusion criteria for this group included recent alcohol consumption within the past 24 h or smoking within the past week.
Group 2 comprised patients who were poisoned with alprazolam. These patients presented at the hospital with symptoms of alprazolam poisoning, which was confirmed through hospital laboratory tests using the Vitrotek diagnostic kit (Tehran, Iran) and clinical evidence observed by a medical toxicologist. The primary inclusion criterion for this group was the absence of underlying diseases or the simultaneous use of other drugs or narcotics. Patients were excluded if they had an active viral or bacterial infection or if they were intoxicated with other drugs.
These two groups served as samples for spectral pattern recognition to identify their distinguishing features. Additional saliva samples from individuals with varying histories of Alprazolam and other medication use were analyzed to assess the effectiveness of the criteria in identifying those poisoned by Alprazolam.
To prepare the saliva samples, participants refrained from consuming any food or drink for 45 min and rinsed their oral cavity with water for 15 min prior to sampling. A nurse with specialized training, stationed in the emergency room, was responsible for collecting the samples, ensuring strict supervision of the sampling method. The collected samples were stored in a refrigerator at a temperature of 3–4 °C until spectrometry analysis. Additionally, blood and urine samples from poisoned patients were collected within a 30-minute after hospital admission and sent to the hospital laboratory for blood factor analysis and benzodiazepine detection. Saliva samples, used exclusively for FTIR analysis, were collected in sterile microtubes without any additives or preservatives to maintain the spectral integrity of the samples. Blood and urine were drawn only to confirm in the hospital laboratory and not for spectroscopy. The nurse explained the project, sampling methods, potential consequences, and compensation (if applicable) to all patients and/or their legal guardians, adhering to university ethical guidelines. Informed consent, confirming voluntary and informed participation, was then obtained from all subjects and/or their legal guardians. This study adhered to ethical principles as determined by the ethics committee of Shahid Beheshti University of Medical Sciences and was approved under the code of ethics (IR.SBMU.RETECH.REC.1402.279).
FTIR spectroscopy
Spectroscopy of the samples was conducted within 48 h of collection using the RAYLEIGH FTIR model WQF-510 (Beijing Beifen-Ruili Analytical Instrument Co., Beijing, China). The accessories utilized in the analysis were from Pike Technology, specifically the MIRAcle single-reflective ATR device (Pike Technologies, Madison, WI, USA). The use of ATR accessories significantly minimized the need for extensive sample preparation steps. Once the samples were removed from the refrigerator and equilibrated to room temperature, they were stirred to ensure homogeneity. Subsequently, 50 µl of each sample were placed on the crystal of the device. A resolution of 4 cm⁻¹ was selected for the spectroscopy of all samples, and 50 scans were performed on each sample.
Nitrogen-cooled detectors play a vital role in FTIR spectroscopy and, more generally, in the attempt to enhance sensitivity and signal-to-noise ratios in spectral measurements. In operation, this detector works by cooling the sensing element with a flow of nitrogen gas and thereby reducing thermal noise; it is capable of detecting the weaker signals of infrared radiation.
To ensure representative spectra and minimize variability, the instrument was recalibrated between each saliva sample. Each triplicate saliva sample (n = 3) was assessed by FTIR within 5 min of deposition on the ATR holder, with three measurements taken per sample. These methods ensured reproducible, stable spectral peaks, reduced measurement error, and facilitated the identification of subtle differences between poisoned and healthy samples. Collectively, the methods did contribute to allowing reproducible, stable spectral peaks to be quantified, minimizing the measurement error and allowing small differences in spectra between poisoned and healthy samples to be diagnostic.
Data analysis
The experimental spectra were initially converted to Excel format using Essential FTIR software. Subsequent statistical analyses were performed using Origin Pro 2022 software. The data were normalized to a range between 0 and 1 to reduce peak intensity variations due to differences in saliva concentration among individuals. Such normalization enabled more appropriate comparisons regarding the intensity among the two groups. Before conducting any further manipulations to the spectral data, the 2300–2400 cm⁻¹ region, which is essentially associated with nitrogen bands, was not investigated due to potential interference.
Subsequently, baseline correction was applied to the data. Following this, peak deconvolution was performed using the Gaussian function being selected.
Spectral area comparisons were conducted on the averaged spectra of groups 1 and 2 to identify the most discriminative regions. Consequently, two intervals, 1200–1400 cm-1 and 3000–3600 cm-11, were analyzed for diagnostic purposes. Peak calculations within these intervals were performed, and the data were grouped in 10-wavelength intervals. Statistical analysis using student t-tests was conducted to compare the groups in pairs using Prism version 9.5.1 software. The precision and accuracy of intensity values from identified peaks in these two regions were compared using Receiver Operating Characteristic (ROC) analysis for discrimination of poisoned vs. healthy samples in a group of well-known samples.
To evaluate whether ROC analysis results can act as diagnostic criteria for acute alprazolam consumption in unknown samples, a ROC table was constructed from groups 1 and 2, applying a new decision threshold based on internal validation of AUC divergence. The unknown saliva sample was processed using the method described above. The toxicity threshold was empirically determined by stepwise addition of unknown sample to groups 1 and 2. Cutoffs of 10% AUC decrease (1200–1400 cm⁻¹) or 12% (3000–3600 cm⁻¹), based on spectral regions with maximum standard deviation, were used and validated across 55 samples.
This procedure was applied to other anonymous saliva samples to determine whether they contained alprazolam, either alone or with other drugs. The results were then compared to the hospital laboratory outcomes for these samples.
In order to determine whether observed differences between groups were statistically significant, we used contingency tables and Fisher’s exact test. Contingency tables were utilized to present the frequency distribution of categorical variables over different groups. The Fisher’s exact test was used to assess whether the distribution of categorical outcomes differed significantly between groups, using a significance threshold of p < 0.05. Fisher’s exact test was utilized to identify whether statistically significant relationships were present among groups concerning observed frequencies since the sample size was not large for group comparisons. This statistical analysis allowed us to critically assess whether the observed category differences were statistically significant. The raw data for the results of this research are available on reasonable request to the corresponding author.
Results
In this study, the spectra obtained from the saliva samples from two distinct groups were analyzed: a healthy group not using benzodiazepine medications and individuals intoxicated by an excessive dose of alprazolam. The healthy group had been free of illness for a minimum of two weeks and had no history of benzodiazepine or other narcotic drug usage. Those affected by alprazolam toxicity had ingested doses surpassing the therapeutic range, experiencing adverse effects and pharmacological manifestations associated with toxic levels of the drug. Common symptoms observed in cases of alprazolam or benzodiazepine toxicity include confusion, drowsiness, and respiratory depression, which can lead to severe complications if prompt medical intervention is not initiated to manage the poisoning symptoms. The primary objective of this investigation was to ascertain whether differences in the spectra reflecting carbohydrates and their associated functional groups could effectively distinguish between these two cohorts. To prevent misdiagnosis of alprazolam poisoning and minimize post-hospital discharge complications, it is imperative to establish a method for differentiating alprazolam poisoning from other potential conditions. The main question of this research was whether the differences between the saliva spectra of these two groups can discriminate them meaningfully or not.
Demographic Results
The demographic characteristics of the study participants, including gender, age, drugs used, drug dosage, and duration of use, are summarized in Table 1. The mean age of the poisoned participants was 29.85 ± 11.02 years, with 73% being female. Based on a representative subset of data (n = 15), the median age was 28 years and the interquartile range (IQR) was 23–38 years.
Table 1.
Demographic information of participants.
| Demographic Categories | Value (%) |
|---|---|
| Gender | |
| Female | 73.3 |
| Male | 26.7 |
| Age (Years) | |
| Under 18 | 2.2 |
| 18–24 | 13.3 |
| 25–34 | 35.5 |
| 35–44 | 33.3 |
| 45–54 | 15.5 |
| Drug History | Negative |
| Addiction History | Negative |
| Approximate Consumed Dose (Mean ± SD, mg) | 11.36 ± 6.5 |
| Consumption Time (hours) | 4.86 ± 4.79 |
| Number of Days of Hospitalization (Days) | 1.29 ± 0.59 |
| Severity of Poisoning | |
| Intense | 6.67 |
| Medium | 0 |
| Mild | 93.3 |
Severity of alprazolam poisoning was categorized into three levels: mild, moderate, and severe. Mild cases included symptoms like drowsiness or dizziness with stable vital signs. Moderate cases involved slurred speech or mild respiratory depression without the need for assisted ventilation. Severe cases were characterized by loss of consciousness or significant respiratory depression requiring ICU admission or intubation. This classification was used for stratification and is reflected in Table 1.
Understanding the types of drugs used and the duration of their use is crucial, as these factors can influence the length of stay in a poison control center. This duration can vary from hours to days across different age groups, depending on the prescribed drugs, the doses received, and any untreated underlying conditions. While fatalities from benzodiazepine use are rare, they are possible. In rare instances, toxic levels of benzodiazepines may result in sudden death.
Spectroscopic Results
FTIR spectroscopy emerges as a rapid, precise, and cost-effective technique for analyzing the mid-infrared spectra of chemical samples, and is recently widely employed in the examination of biological samples and complex matrices.
In the research conducted by Marini et al. (2022), the focus was on the identification and quantification of alprazolam in alcoholic beverages using near-infrared (NIR) spectroscopy. The study employed partial least squares (PLS) regression as an analytical method to quantify the results. Notably, during the validation phase, the predictive accuracy consistently exceeded 90%. This approach demonstrates the efficacy of NIR spectroscopy coupled with chemometric techniques for detecting and quantifying alprazolam in complex matrices such as alcoholic drinks. The robustness of PLS regression in achieving accurate predictions underscores its suitability for practical applications in forensic and analytical chemistry12.
The utilization of saliva as a biological fluid in diagnostic approaches is gaining attraction. Employing saliva samples offers significant advantages for both patients and healthcare professionals, as saliva collection is non-invasive and demands less training compared to the collection of blood and plasma samples. Because many salivary constituents are filtered from blood plasma, saliva can reflect systemic drug levels and has been increasingly used as a non-invasive surrogate for monitoring blood concentrations in toxicological and pharmacokinetic studies13,14. Saliva samples have emerged as a valuable bio-fluid for diagnostic purposes in numerous studies. Researchers have explored their utility in diagnosing a wide range of conditions including cancer detection, diabetes monitoring, and COVID-19 screening15–17.
In a 2020 study, researchers explored the impact of different saliva sample preparation methods on spectroscopy. Notably, they focused on the wavelength range of 1200–1400 cm⁻¹, which exhibits strong absorption bands. These absorption features were consistently observed across various sample preparation techniques and are believed to hold diagnostic significance18.
In this research, the mid-IR range (400–4000 cm⁻¹) was divided into delineated regions. While previous research associates these with biological functional groups, our goal was to see what regions would discriminate between healthy and poisoned individuals19,20. however those details were not of the interest of this study at this discriminative stage. Focus of this study was to find a simple, rapid, and accurate technique of differentiation between two groups’ spectra. Looking at different regions in this study has shown that the spectral regions between 1200 and 1400 cm⁻¹ and 3000–3600 cm⁻¹ may serve as indicators for the separation of these two groups of samples.
Figure 1 illustrates the collective peaks of saliva within the mid-IR range across two distinct groups of healthy individuals and poisoned individuals in this study. Each point of the spectra is presented as mean ± SE of all points for that wavelength in that group.
Fig. 1.

Comparative IR spectral analysis of alprazolam-exposed individuals versus healthy volunteers (400–4000 cm⁻¹). The spectra (Mean as solid lines ± SE as shadow around each line) reveal distinct alterations in molecular vibrations and functional group signatures, highlighting key biochemical disruptions induced by alprazolam toxicity in the affected group. Notable shifts in peak positions, intensities, and band broadening reflect changes in bond dynamics and conformational rearrangements, providing spectroscopic evidence of alprazolam’s metabolic impact.
Figure 2 is a stepwise representation of mathematical process applied on these spectra for both groups of poisoned and healthy samples. Normalization of peaks between 0 and 1% of absorbance was carried out to eliminate the differences that arise due to the individual variations between the subjects. Intensity of normalized-pure water spectra was subtracted from these spectra to reduce the interfering effect of water that is present in saliva at a dominant percentage. Baseline correction was then applied to the spectra using spectral region-to-region method. In the peak picking, several criteria are considered while using the OriginPro software. Threshold height is an important parameter employed in data analysis to mark prominent peaks on intensity value plots, say in spectroscopy or signal processing. As a particular value—most often a percentage of the data’s maximum intensity—this threshold enables scientists to mask less dominant peaks and highlight the most dominant features. By setting a cutoff (15% of the highest value), only peaks higher than this are considered significant, reducing the chances of false positives and helping to simplify the interpretation of results.
Fig. 2.
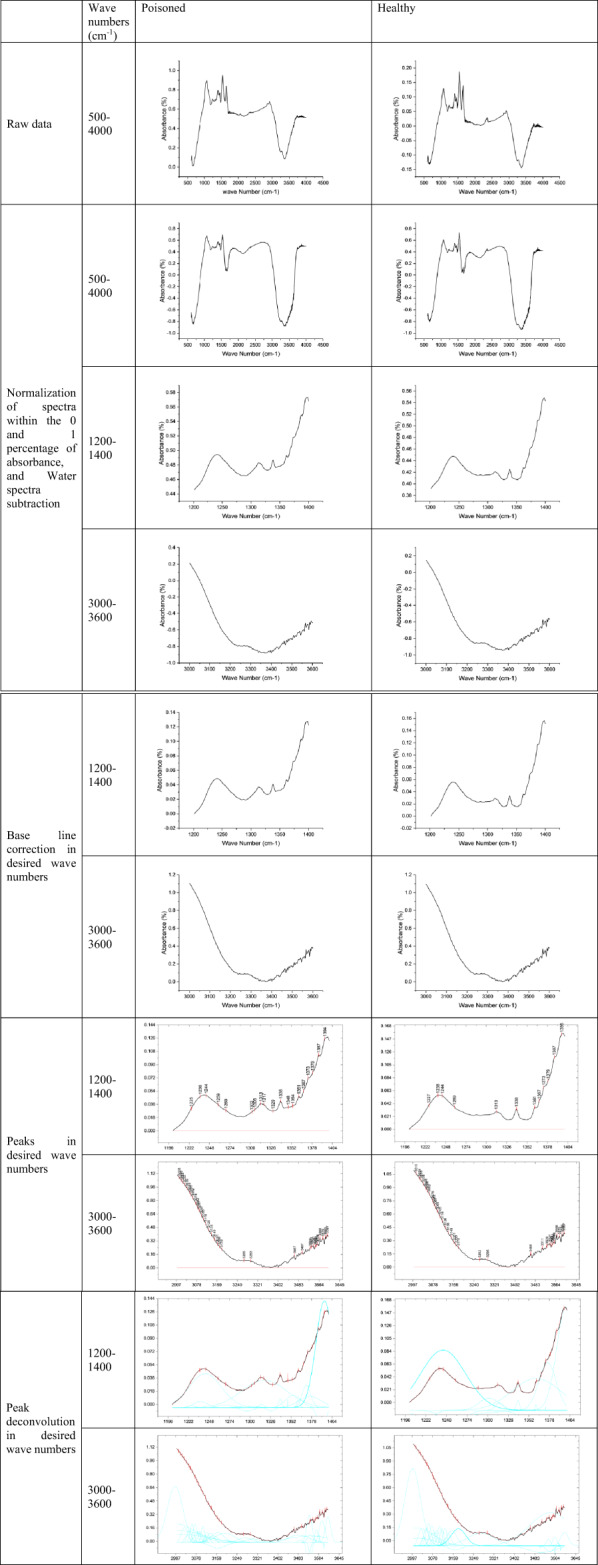
Stepwise spectral processing workflow for FTIR analysis of saliva samples from healthy and alprazolam-poisoned individuals. The pipeline includes (1) raw spectral acquisition, (2) normalization (Min-Max normalization), (3) baseline correction, (4) peak picking, (5) peak extraction (deconvolution). Critical spectral regions were identified, and differential peaks were quantified to distinguish drug-induced biochemical alterations from healthy baselines.
For the obscured peaks or less-than-obvious peaks in the graph, the second derivative method was used. This helps to identify peaks from noises with a better and more meaningful resolution. Intensities of all of the identified peaks were statistically measured to find the discriminative peaks between the two groups. Deconvolution was then carried out on these regions of spectra to extrapolate peaks underlying the whole spectra using the discriminating wavenumbers while those were selected as the fixed peaks in calculations. Intensities of the resulted deconvolution-extrapolated peaks were used for the comparison purposes between the two groups of healthy and poisoned individuals.
In the analysis of biological compounds such as carbohydrates, lipids, proteins, and genetic material, the 3000 to 3600 cm⁻¹ range corresponds to the stretching vibrations of hydrogen-bonded OH groups in carbohydrates. These peaks are indicative of the presence of sugars in samples. Additionally, the 1200 to 1400 cm⁻¹ range represents the C–O–C stretching vibrations in carbohydrates, particularly in glycosidic linkages. This region provides information about the carbohydrate structure. While not the main focus of this study, the spectral data from saliva FTIR differences during alprazolam poisoning could significantly enhance our understanding of the drug’s biochemical effects in affected individuals.
Validity of Method
Following baseline correction and peak deconvolution analysis, ROC and t-tests were conducted for these two intervals across both two groups: healthy individuals and poisoned. To do so, intensities of all recognized peaks within the range of 3000–3600 cm⁻¹ and 1200–1400 cm⁻¹ in the spectra of healthy individuals were assumed as the group of data for the healthy group. Similarly, intensities of the same peaks in the same regions of the spectra of poisoned persons were assumed as the group of data for the poisoned group. ROC and t-tests were applied to both of these datasets in order to test their statistical discrimination against each other. Multiple t-tests for the comparison of poisoned and healthy groups’ peak intensities at 1200–1400 cm⁻¹ yielded a statistically significant difference (p < 0.0001). Similarly, multiple t-tests across the range 3000–3600 cm⁻¹ were also discovered to possess a very significant group difference (p < 0.0001). Figures 3 and 4, along with Tables 2 and 3, present the results of the statistical analyses on the diagnostic value of group differences.
Fig. 3.
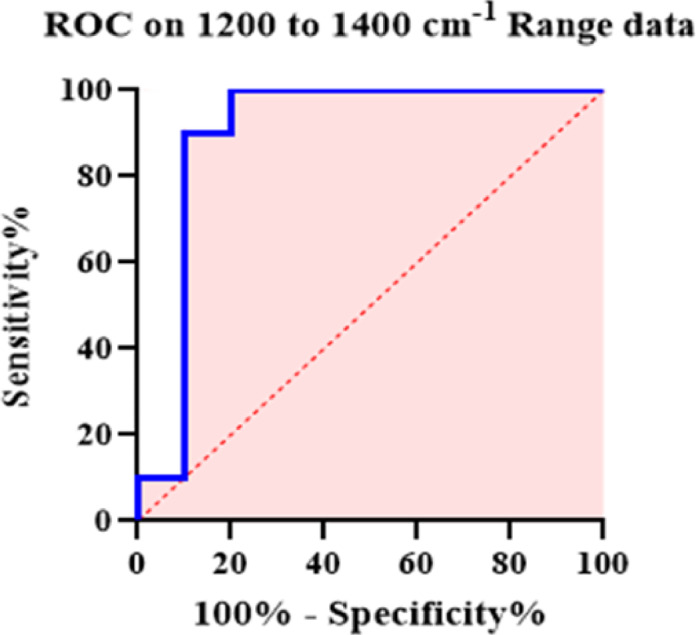
Receiver Operating Characteristic (ROC) analysis of FTIR spectral intensities (1200–1400 cm⁻¹) to assess diagnostic significance of peak differences between healthy and alprazolam-poisoned saliva samples. The ROC curve assessed biomarker peak sensitivity and specificity, with an area-under-curve (AUC) of 90% indicating high predictive accuracy.
Fig. 4.

Receiver Operating Characteristic (ROC) analysis of FTIR spectral intensities (3000–3600 cm⁻¹) to assess diagnostic significance of peak differences between healthy and alprazolam-poisoned saliva samples. The ROC curve assessed biomarker peak sensitivity and specificity, with an area-under-curve (AUC) of 100% indicating high predictive accuracy.
Table 2.
ROC curve results for spectral differences in the 1200–1400 cm⁻¹ and 3000–3600 cm⁻¹ regions between healthy and poisoned groups.
| 1200–1400 cm−1 | |
|---|---|
| AUC | 0.9000 |
| Std. Error | 0.08695 |
| 95% confidence interval | 0.7296 to 1.000 |
| P value | 0.0025 |
| 3000–3600 cm−1 | |
|---|---|
| AUC | 1.000 |
| Std. Error | 0.000 |
| 95% confidence interval | 1.000 to 1.000 |
| P value | < 0.0001 |
Table 3.
Comparison of FTIR-based classification with hospital laboratory results in 55 validation samples.
| Samples | Number of Samples | Consumed medication | Matched results between FTIR and hospital laboratory in two regions | |
|---|---|---|---|---|
| 1200–1400 cm−1 | 3000–3600 cm−1 | |||
| Healthy | 5 |
Metformin Levothyroxine Propranolol |
4 | 5 |
| Poisoned | 50 |
Chlordiazepoxide Clonazepam |
48 | 49 |
ROC analysis on the 30 approved healthy or poisoned samples demonstrated 100% sensitivity and specificity for the region of 3000–3600 cm⁻¹, and 90% classification accuracy for the region of 1200–1400 cm⁻¹, indicating strong diagnostic value for distinguishing poisoned from healthy individuals using this method (Table 2). These two data groups, representing healthy and poisoned individuals, serve as reference data for identifying poisoning in unknown samples.
Using this approach, we have examined the classification of saliva spectra from 400 additional collected samples into either the healthy or poisoned groups to predict their possible toxicity with alprazolam using this technique, as follows: saliva spectra of any under-examination individual were taken and processed as mentioned above and illustrated in Fig. 2. The resulting group of intensities in either the 3000–3600 cm⁻¹ or 1200–1400 cm⁻¹ region for the individual was added to the healthy group dataset. The spectral regions were chosen based on the highest standard deviation observed between healthy and poisoned reference groups. Our results have shown that a threshold of 12% reduction in AUC (area under the curve) for the region of 3000–3600 cm⁻¹ may indicate poisoning. Similarly, a 10% reduction in AUC for the region of 1200–1400 cm⁻¹ after the addition of an unknown sample to the healthy dataset suggests classification into the poisoned group. Reductions below these thresholds may suggest a non-poisoned individual. In case of discordant results between the two spectral regions, we classified the case as uncertain and further tested it by adding the data to the poisoned reference group. A reduction of ≥ 23% in AUC for 3000–3600 cm⁻¹ or ≥ 18% in AUC for 1200–1400 cm⁻¹ in this case would confirm a poisoned status. A total of 55 saliva samples, collected from individuals who had also taken various other medications, were tested using this protocol, and the results demonstrating its precision and diagnostic accuracy are shown in Table 3. In order to further assess the validity of our FTIR-diagnostic technique, 55 blinded saliva samples of whose clinical status (alprazolam-poisoning vs. healthy) had already been determined by hospital diagnosis were analyzed. Classification results by spectral analysis were then compared with confirmed clinical data. The technique yielded 96% sensitivity, 80% specificity, 94.5% accuracy, and 98% precision (positive predictive value). These findings demonstrate great concordance between our analytical method and clinical diagnosis in favor of the use of FTIR spectroscopy for rapid, non-invasive screening for alprazolam toxicity (Table 3).
The Fisher’s exact test revealed a statistically significant difference between the two groups, with a p-value of 0.0002 for the 1200–1400 cm⁻¹ region and less than 0.0001 for the 3000–3600 cm⁻¹ region, as presented in Table 4. The two-tailed test confirmed that the probability of observing such a difference under the null hypothesis was extremely low, as indicated by the p-values being well below the predefined significance threshold of 0.05. This result supports a statistically significant association between the categorical variables under comparison.
Table 4.
Results of fisher’s exact test for categorical association between spectral region and poisoning status.
| 1200–1400 cm−1 | Test | Fisher’s exact test |
| P value | 0.0002 | |
| P value summary | *** | |
| One- or two-sided | Two-sided | |
| 3000–3600 cm−1 | Test | Fisher’s exact test |
| P value | < 0.0001 | |
| P value summary | **** | |
| One- or two-sided | Two-sided |
Discussion
In this research work, we have shown the applicability of ATR-FTIR spectroscopy as an excellent and rapid analytical technique for diagnosis of alprazolam toxicity. Since salivary constituents are derived from blood plasma in body, saliva may mirror systemic drug levels and has come to be utilized more and more as a non-invasive alternative for the determination of blood levels in toxicologic and pharmacokinetic research. The spectral variations of saliva from normal subjects and victims of alprazolam poisoning were remarkable, especially between the wavenumber ranges 1200–1400 cm⁻¹ and 3000–3600 cm⁻¹. These results not only mirror the biochemical alterations that occur after alprazolam intake but also highlight the significance of prompt and precise diagnostic techniques in clinical toxicology.
A student t-test showed a statistically significant difference in peak intensities between the healthy and poisoned saliva samples (p < 0.0001), confirming spectral separation between the groups. ROC analysis for the evaluation of the discriminative power of these findings on the groups of confirmed healthy or poisoned samples showed high diagnostic performance, making FTIR spectroscopy a valid tool for differentiation between poisoned and non-poisoned subjects. Peak intensities in the 3000–3600 cm-¹ and 1200–1400 cm-¹ regions were sequentially added to the healthy and poisoned data groups to evaluate changes in ROC AUC values. The percentage decrease in AUC was then used to infer the potential toxicity of the saliva sample. Its approach is preferable because it avoids invasive sample collection, delivers rapid results, requires no sample preparation, and prioritizes immediate response situations.
As shown in Table 4, the classification outcomes based on ROC deviation thresholds were statistically validated using Fisher’s exact test. Further studies are ongoing to explore the potential of saliva analysis in differentiating alprazolam toxicity from other benzodiazepine overdoses. Preliminary data reveals a distinct FTIR-ATR peak in poisoned saliva within two key regions. For example, in the 1200–1400 cm-¹ region, alprazolam exhibits a sharp peak that is absent in other benzodiazepines. Similarly, benzodiazepines present a characteristic peak in poisoned individuals in the 3000–3600 cm-¹ region that shifts about 100 cm-¹ further in alprazolam poisoning (data not shown). Relevance of this work lies beyond the realm of alprazolam poisoning, since the protocols established here can be readily applied to other chemical detection and medical situations. Furthermore, this technique proved its diagnostic values when samples contaminated with other drugs on top of alprazolam poisoning. When FTIR spectroscopy is incorporated into standard tests for toxicity, healthcare providers will be better able to treat overdoses of drugs, ultimately meaning improved outcomes for patients.
In general, the application of FTIR spectroscopy is a promising development in toxicology with the potential for more effective and precise diagnostic techniques in the diagnosis of drug poisonings. It would be wise for future research to investigate its application on more substances and how it can be applied in different clinical presentations.
Author contributions
A.M. was the main clinical resident contributor and performed sampling from the patients. S.S. supervised the clinical part of this project. K.F. analyzed the results. S.A. and G.F. performed the FTIR spectroscopy. F.H.S. designed the whole project and supervised the laboratory and calculation parts. All authors reviewed the manuscript.
Data availability
The raw data for the results of this research are available on reasonable request to the corresponding author, Farshad H.Shirazi, Department of Toxicology and Pharmacology, School of Pharmacy, Shahid Beheshti University of Medical Sciences, Tehran, Iran. Access could be requested by emailing the corresponding author.
Competing interests
The authors declare no competing interests. The corresponding author, Farshad H. Shirazi, on behalf of all authors, hereby certifies that no financial or personal competing interests that could have appeared to have an effect on the work described in this paper exist.
Footnotes
Publisher’s note
Springer Nature remains neutral with regard to jurisdictional claims in published maps and institutional affiliations.
References
- 1.Ait-Daoud, N., Hamby, A. S., Sharma, S. & Blevins, D. A review of alprazolam use, misuse, and withdrawal. J. Addict. Med. 12, 4–10, (2018). 10.1097/ADM.0000000000000350 [DOI] [PMC free article] [PubMed]
- 2.Alinejad, S., Zamani, N., Abdollahi, M. & Mehrpour, O. A narrative review of acute adult poisoning in Iran. Iran. J. Med. Sci.42, 327–346 (2017). [PMC free article] [PubMed] [Google Scholar]
- 3.Baker, M. J. et al. Using fourier transform IR spectroscopy to analyze biological materials. Nat. Protoc.9, 1771–1791. 10.1038/nprot.2014.110 (2014). [DOI] [PMC free article] [PubMed] [Google Scholar]
- 4.Banaye Yazdipour, A. et al. The trend of top five types of poisonings in hospitalized patients based on ICD-10 in the Northeast of Iran during 2012–2018: A cross‐sectional study. Health Sci. Rep.5, e587. 10.1002/hsr2.587 (2022). [DOI] [PMC free article] [PubMed] [Google Scholar]
- 5.Barauna, V. G. et al. Ultrarapid on-site detection of SARS-CoV-2 infection using simple ATR-FTIR spectroscopy and an analysis algorithm: high sensitivity and specificity. Anal. Chem.93, 2950–2958. 10.1021/acs.analchem.0c04608 (2021). [DOI] [PubMed] [Google Scholar]
- 6.Bel’skaya, L. V. & Sarf, E. A. Biochemical composition and characteristics of salivary FTIR spectra: correlation analysis. J. Mol. Liq. 341, 117380. 10.1016/j.molliq.2021.117380 (2021). [Google Scholar]
- 7.Brunetti, P. et al. Designer benzodiazepines: A review of toxicology and public health risks. Pharmaceuticals14, 560. 10.3390/ph14060560 (2021). [DOI] [PMC free article] [PubMed] [Google Scholar]
- 8.Delrue, C. et al. Unlocking the diagnostic potential of saliva: A comprehensive review of infrared spectroscopy and its applications in salivary analysis. J. Pers. Med.13, 907. 10.3390/jpm13060907 (2023). [DOI] [PMC free article] [PubMed] [Google Scholar]
- 9.Fadlelmoula, A. et al. Fourier transform infrared (FTIR) spectroscopy to analyse human blood over the last 20 years: A review towards lab-on-a-chip devices. Micromachines13, 187. 10.3390/mi13020187 (2022). [DOI] [PMC free article] [PubMed] [Google Scholar]
- 10.Ferreira, I. C. C. et al. Attenuated total reflection-Fourier transform infrared (ATR-FTIR) spectroscopy analysis of saliva for breast cancer diagnosis. J. Oncol. 4343590, (2020). 10.1155/2020/4343590 (2020). [DOI] [PMC free article] [PubMed]
- 11.Kassem, A. et al. Applications of fourier Transform-Infrared spectroscopy in microbial cell biology and environmental microbiology: advances, challenges, and future perspectives. Front. Microbiol.14, 1304081. 10.3389/fmicb.2023.1304081 (2023). [DOI] [PMC free article] [PubMed] [Google Scholar]
- 12.Naseri, K. et al. Pharmaceutical toxicity is a common pattern of inpatient acute poisonings in Birjand city, East of Iran. Sci. Rep.13, 1312. 10.1038/s41598-023-28353-1 (2023). [DOI] [PMC free article] [PubMed] [Google Scholar]
- 13.Ni, D. et al. Towards personalised saliva spectral fingerprints: comparison of mid infrared spectra of dried and whole saliva samples. Spectrochim Acta Mol. Biomol. Spectrosc.253, 119569. 10.1016/j.saa.2021.119569 (2021). [DOI] [PubMed] [Google Scholar]
- 14.Nogueira, M. S. et al. FTIR spectroscopy as a point of care diagnostic tool for diabetes and periodontitis: A saliva analysis approach. Photodiagn Photodyn Ther.40, 103036. 10.1016/j.pdpdt.2022.103036 (2022). [DOI] [PubMed] [Google Scholar]
- 15.Paikra, S. K. & Mishra, M. Analysis of biomolecular dynamics under Fourier Transform Infrared spectroscopy. In Optical Spectroscopic and Microscopic Techniques, Sahoo, H. (ed.), 215–241, (2022). 10.1007/978-981-16-4550-1_10
- 16.Paschotto, D. R. et al. Saliva Preparation method exploration for ATR-FTIR spectroscopy: towards bio-fluid based disease diagnosis. Anal. Sci.36, 1059–1064. 10.2116/analsci.20P029 (2020). [DOI] [PubMed] [Google Scholar]
- 17.Pupeza, I. et al. Field-resolved infrared spectroscopy of biological systems. Nature577, 52–59. 10.1038/s41586-019-1850-7 (2020). [DOI] [PubMed] [Google Scholar]
- 18.Scappaticci, C. et al. Detection and quantification of Alprazolam added to long drinks by near infrared spectroscopy and chemometrics. Molecules27, 6420. 10.3390/molecules27196420 (2022). [DOI] [PMC free article] [PubMed] [Google Scholar]
- 19.Su, K. Y. & Lee, W. L. Fourier transform infrared spectroscopy as a cancer screening and diagnostic tool: A review and prospects. Cancers12 (115). 10.3390/cancers12010115 (2020). [DOI] [PMC free article] [PubMed]
- 20.Zohdi, V. et al. Importance of tissue Preparation methods in FTIR micro-spectroscopical analysis of biological tissues: ‘traps for new users’. PLoS One. 10, e0116491. 10.1371/journal.pone.0116491 (2015). [DOI] [PMC free article] [PubMed] [Google Scholar]
Associated Data
This section collects any data citations, data availability statements, or supplementary materials included in this article.
Data Availability Statement
The raw data for the results of this research are available on reasonable request to the corresponding author, Farshad H.Shirazi, Department of Toxicology and Pharmacology, School of Pharmacy, Shahid Beheshti University of Medical Sciences, Tehran, Iran. Access could be requested by emailing the corresponding author.