

Abstract
Background
There is a dismal prognosis for idiopathic pulmonary fibrosis (IPF), a progressive interstitial lung disease. During acute exacerbations, the survival outcomes are significantly worse. This study aimed to evaluate the efficacy of high-resolution computed tomography (HRCT)-based radiomics in predicting mortality in patients experiencing acute exacerbation of idiopathic pulmonary fibrosis (AE-IPF).
Methods
From April 2012 to February 2023, 146 AE-IPF patients were retrospectively enrolled at West China Hospital of Sichuan University and divided at random in a 7:3 ratio between a training set (n=102) and an inside validation set (n=44). Chest HRCT was used to obtain radiomics characteristics. A nomogram that combined the radiomics risk score with specific clinical characteristics was produced by logistic regression classifiers, which also generated radiomics and clinical models. The C-index, area under the receiver operating characteristic curves, and decision curves were used to evaluate the predictive performance of the models. The nomogram-derived risk score was used to categorize patients into high-risk and low-risk categories for the training and validation datasets. The log-rank test and Kaplan-Meier curves were utilized in survival analysis.
Results
All-cause mortality occurred in 72.6% of patients over a median follow-up of 17 months. The nomogram predicted 1-year overall survival (OS) with the area under the curve (AUC) of 0.739 and 0.717 for the training and validation datasets, respectively. The nomogram surpassed both clinical and radiomics models in predicting 3-year OS, with higher AUC values in training and validation datasets (0.789 vs. 0.750). High-risk patients had noticeably shorter OS than low-risk patients in both datasets [hazard ratio (HR) =2.958, 95% confidence interval (CI): 1.833–4.744, log-rank P<0.001; HR =2.547, 95% CI: 1.255–5.171, P=0.01].
Conclusions
The radiomics-based nomogram can predict the mortality of patients with AE-IPF.
Keywords: Radiomics, computed tomography (CT), acute exacerbation, idiopathic pulmonary fibrosis (IPF), prognosis
Introduction
The interstitial lung disease (ILD) known as idiopathic pulmonary fibrosis (IPF) is typified by progressive, persistent fibrosis that has no known cause (1,2). IPF commonly occurs in the elderly population and is characterized by symptoms including progressive dyspnea, declining lung function, and ultimately respiratory failure (3,4). IPF patients typically have a dismal prognosis, with a median survival of just 2–4 years following diagnosis. Ultimately, the majority of patients succumb to respiratory failure (5-7). Acute exacerbation of idiopathic pulmonary fibrosis (AE-IPF), which has been characterized by a sudden and rapid decline in respiratory function with no identifiable cause in IPF patients (8), often leads to a sudden deterioration in dyspnea and lung function, resulting in these fatalities (9,10). According to the study conducted by Song et al., the 1- and 5-year survival rates of AE-IPF from the initial diagnosis were 56.2% and 18.4%, respectively (11). Currently, the precise etiology and prognostic indicators of poor outcomes in AE-IPF remain largely uncertain, underscoring the pressing need for a rapid prognosis assessment in AE-IPF.
Previous studies have identified potential correlations between clinical symptoms, serological tests, radiological findings, and prognosis in AE-IPF patients. These factors include age (12), lung function (13) as well as serum levels of biomarkers such as Krebs von den Lungen-6 (KL-6) (14) and C-reactive protein (CRP) (11,15). High-resolution computed tomography (HRCT) is widely considered the gold standard for radiological evaluation of AE-IPF, as it provides specific changes that are crucial for assessing treatment efficacy and predicting prognosis (16-18). In a study by Akira et al., the overall extent and patterns of these abnormalities on HRCT were found to be associated with survival in AE-IPF. Newly observed parenchymal abnormalities on HRCT in patients with AE-IPF were separated into three categories: diffuse, multifocal, and peripheral (19). According to the 2018 IPF guideline, baseline HRCT patterns were categorized as usual interstitial pneumonia (UIP), probable UIP, indeterminate for UIP and alternative diagnosis patterns (2). The inconsistent classification and staging of these images persist as significant challenges to diagnostic accuracy for non-ILD-specialized clinicians and imaging professionals in interpreting CT images.
Radiomics is a cutting-edge imaging method that extracts a variety of quantitative information from medical images, using computer-aided quantification. These characteristics are used to create a radiomic signature, which serves as an image-based biomarker with the potential to predict clinical symptoms and outcomes in various diseases (20,21).
Currently, there is a lack of studies that have integrated clinical manifestations and radiomics data to predict the prognosis of AE-IPF. Consequently, this study’s objective was to generate a predictive model through investigating clinical and/or radiomics variables in patients experiencing AE-IPF, and to evaluate its efficacy in predicting mortality in this population. We present this article in accordance with the TRIPOD reporting checklist (available at https://jtd.amegroups.com/article/view/10.21037/jtd-2025-194/rc).
Methods
This study was conducted in accordance with the Declaration of Helsinki and its subsequent amendments. This study was approved by the ethics committee of West China Hospital of Sichuan University (No. 2021-1764, date: 02/09/2022), and the retroactive duration of the study allowed for the waiver of the informed consent requirement.
Study population
The AE-IPF patients who underwent CT examination from April 2012 to February 2023 were retrospectively collected. The 2016 AE-IPF International Working Group report criteria have been applied to determine the diagnosis of AE-IPF (22). The following were the prerequisites: (I) fibrosing ILD on a prior HRCT; (II) sudden deterioration or onset of dyspnoea, usually within 30 days; (III) new bilateral consolidation and/or ground-glass opacity on top of an HRCT background pattern that is consistent with fibrosing ILD; (IV) decline that cannot be entirely accounted for by fluid overload or heart failure. Our study’s inclusion criteria were as follows: (I) patients with a clinical and imaging diagnosis of IPF with acute exacerbations; (II) the availability of HRCT with slices of less than 1.5 mm. Exclusion criteria: (I) image quality inadequate for analysis; (II) lack of HRCT images; (III) patients combined with lung cancer, and (IV) moderate to large-sized pleural effusion. Besides, massive pneumomediastinum should also be excluded.
A pulmonologist and a radiologist with expertise in chest imaging verified all of the diagnoses. Ultimately, in this study, 146 AE-IPF patients were recruited. These individuals were contained in the training dataset (n=102) and the validation dataset (n=44) following the ratio of 3:1 by using random numbers. Figure 1 displays the patient enrollment flowchart.
Figure 1.
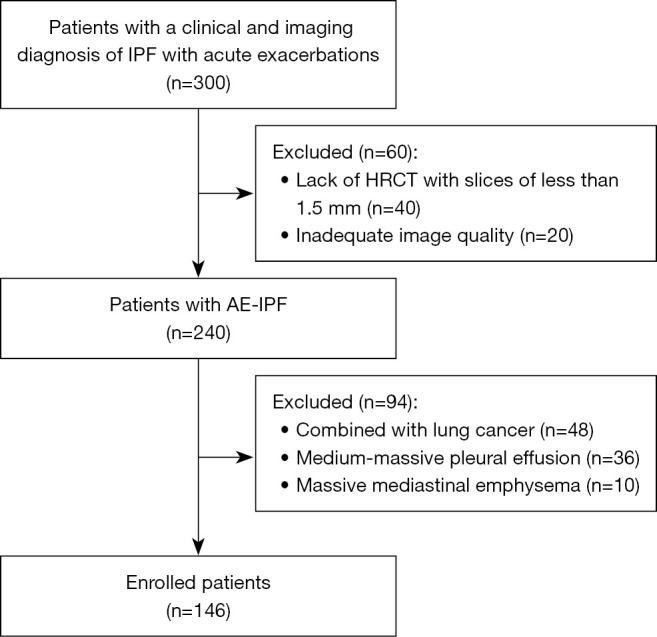
The organizational chart shows the selection of patients for the final study population. AE-IPF, acute exacerbation of idiopathic pulmonary fibrosis; HRCT, high-resolution computed tomography.
HRCT scan
HRCT scans were performed in the axial plane using slices from a multidetector CT scanner whose slices were 1 mm thick, specifically the Siemens Somatom Definition (Siemens Healthcare, Erlangen, Germany) and GE Revolution (General Electric, HealthCare, USA). Image reconstruction employed convolution kernels such as I70f, B10f, B30f, B80f, and B31f. All patients underwent HRCT imaging while supine and at full inspiration.
Data collection
On the primary day of admission, all laboratory and clinical data were gathered and stored in the electronic medical records. The following information was taken out of the medical records: (I) basic demographic information, such as age, gender, and body mass index (BMI); (II) history of smoking and history of therapy; (III) clinical symptoms; (IV) pulmonary function test results, including forced vital capacity (FVC), forced expiratory volume in one second (FEV1), FEV1/FVC and diffusion capacity of the lung for carbon monoxide (DLCO); (V) laboratory data at acute exacerbation onset, including serum C-reactive protein; (VI) treatment details and outcomes. The clinical endpoints were defined as all-cause mortality. The interval between the HRCT examination and the patient’s death was defined as the time to death. Meanwhile, the image features were also collected, including HRCT patterns, the overall CT extent during acute exacerbations, and the main pulmonary artery/aorta (mPA/AO) ratio. UIP patterns or probable UIP patterns on HRCT at the time of AE were recorded. The overall CT extent during acute exacerbations were consumed as widespread, multifocal, and peripheral parenchymal opacification (predominantly ground-glass opacity but sometimes consolidation) (19). Studies have revealed that the mPA/AO ratio on chest CT at the time of IPF’s initial diagnosis has prognostic significance (23). As a result, the mPA/AO ratio should also be documented.
Region of interest (ROI) segmentation
3D Slicer, an open-source program, was implemented to segment the three-dimensional ROI (Version 5.0.2). ROI was applied to the bilateral lung areas, which included the five lobes and the associated vascular and bronchial bundles (Figure 2). Three months later, the same radiologist selected the patients to be segmented to determine the correlation coefficient between observers. Although the radiologist was oblivious to clinical data, they were aware of the AE-IPF diagnosis.
Figure 2.

The three steps that make up the ROI segmentation procedure: CT image stacking, ROI segmentation, and 3D ROI reconstruction. 3D, three dimensional; CT, computed tomography; ROI, region of interest.
Radiomics features extraction and selection
The open-source PyRadiomics package was employed to extract the radiomics features (version 3.0.1), which renders up a flexible open-source computational framework that makes it possible to systematically extract multi-dimensional radiomic features from datasets related to medical imaging. datasets (24), in compliance with the image biomarker standardization initiative’s recommendations. Additionally, the Wavelet filters were employed to acquire specific image characteristics. Eventually, each ROI yielded 851 radiomics features, comprising 675 second-order texture features, 162 first-order features, and 14 form features.
Thirty patients were chosen at random and relabeled to evaluate the intra-observer and inter-observer reliabilities in order to ensure that the radiomics features are reproducible. The only radiomics traits that were deemed stable and kept for further examination were those with an intraclass correlation coefficient (ICC) higher than 0.75. The significance test (Mann-Whitney U test) and the redundancy test (Pearson’s correlation test) were then used for selecting the radiomics features. Subsequently, regression analysis using the least absolute shrinkage and selection operator (LASSO) was used to reduce computing complexity and prevent overfitting. Under the ideal penalty parameter tuning carried out by ten-fold cross-validation in the training dataset, the most significant radiomics characteristics were chosen.
Model development and validation
Based on the selected radiomics features and clinical factors, the clinical model and the radiomics model were developed using the logistic regression (LR) classifier, respectively. For the radiomics model, each patient’s radiomics score (Radscore) was calculated using the following method, which combined specific features with their associated weights:
| [1] |
Additionally, the following formula was used to determine the radiomics risk-score (Radriskscore):
| [2] |
To generate a predictive model which is more customized, a nomogram was constructed by incorporating the Radriskscore and the selected clinical factors.
While the receiver operating characteristics (ROC) and area under the curve (AUC) measured the models’ capacity to forecast the overall survival (OS) at 1 and 3 years, the performance of the clinical model, the radiomics model, and the C-index evaluated the nomogram for patient survival analysis. Moreover, in accordance with the greatest Youden index, the detailed sensitivity, specificity, positive predictive value (PPV), and negative predictive value (NPV) were also computed under the ideal threshold.
Calibration and decision curve analysis
The Hosmer-Lemeshow test was used to assess the consistency between the actual rate and the anticipated bad prognosis likelihood. Using the 1,000 bootstrapping resamples method, a calibration curve was established to visually represent the calibration study. Additionally, decision curve analysis (DCA), was applied to estimate the net benefits over a range of threshold probabilities in order to assess and compare the clinical usefulness of the nomogram, the radiomics model, and the clinical model.
Survival analysis
OS data for patients with AE-IPF were recorded. Patients in the training and validation datasets were categorized as high- or low-risk based on the nomogram’s risk score. The Kaplan-Meier survival analysis and the log-rank test were used to assess the possible relationship between OS and the anticipated risk score determined by the nomogram.
Statistical analysis
For statistical analysis, SPSS software (version 23.0) and the MedCalc application (version 18.0) were adopted. The AUCs of several models were compared using Delong’s test. The heatmap of selected features was displayed using HemI program (version 1.0). The calibration curve and the decision curve were plotted using the R language and the “rms” package (version 6.2) and “rmda” package (version 1.6), respectively. A two-sided P value less than 0.05 was considered statistically significant.
Results
Patient characteristics
A total of 146 AE-IPF patients were included in this study. The training set comprised 102 patients (mean age: 68.9±9.3 years; 87 males), while the validation set included 44 patients (mean age: 66.7±9.7 years; 35 males). Table S1 displays the comprehensive clinical and demographic data for these patients. There was no discernible difference between the training and validation datasets in terms of the prevalence of poor prognosis (57.8% vs. 65.9%, P=0.36). There were no notable variations in the UIP pattern (P=0.55), AE type (P=0.96), and the mPA/AO ratio (P=0.63) between the training and validation datasets regarding prognosis.
Selection of the radiomics features
Following the results of the significance, redundancy, and feature reliability tests, 67 radiomics features were maintained and the optimal log(lambda) sequence was used to further select two first-order features and five second-order texture features using LASSO regression analysis (Figure 3). Figure 4 presents the heatmap of these chosen important radiomics properties.
Figure 3.

LASSO regression for feature selection in radiomics. (A) Using the 10-fold cross-validation method to fine-tune parameter lambda selection. (B) The ideal log(lambda) sequence was plotted against the coefficient profile plot. LASSO, least absolute shrinkage and selection operator.
Figure 4.

Heatmap of the selected radiomic features. Each row represented a radiomic feature, and each column corresponded to one patient (separately grouped for the good prognosis and poor prognosis).
Construction of the nomogram
As shown in Figure 5, the radiomics risk-score (Radriskscore) and the chosen clinical criteria were combined to create an easier-to-use nomogram.
Figure 5.

The nomogram, incorporating Radriskscore, UIP pattern, AE type, and PA/AO ratio, was built in the training dataset. AE, acute exacerbation; PA/AO, pulmonary artery/aorta; UIP, usual interstitial pneumonia.
Comparison for model performance
The models’ ability to predict the 1- and the 3-year OS in the training and validation datasets was evaluated and compared using ROC analysis (Figure 6). The clinical model, radiomics model, and nomogram each had AUCs of 0.692 [95% confidence interval (CI): 0.593–0.780], 0.717 (95% CI: 0.619–0.802), and 0.739 (95% CI: 0.643–0.821) for predicting 1-year OS in the training dataset, and 0.682 (95% CI: 0.524–0.814), 0.712 (95% CI: 0.556–0.838), and 0.717 (95% CI: 0.561–0.842) for the validation dataset. Though the differences were not statistically significant, the nomogram generally outperformed the radiomics and clinical models (P=0.21 vs. the clinical model and P=0.46 vs. the radiomics model in the training dataset; P=0.61 vs. the clinical model and P=0.94 vs. the radiomics model in the validation dataset).
Figure 6.

The training and validation datasets’ ROC analysis of the clinical model, radiomics model, and nomogram for predicting 1- (A,B) and 3-year OS (C,D). AUC, area under the curve; OS, overall survival; ROC, receiver operating characteristic.
Similar outcomes were obtained when predicting the 3-year OS. The nomogram’s AUC (training dataset, 0.789, 95% CI: 0.697–0.864; validation dataset, 0.750, 95% CI: 0.597–0.868) was higher than that of the clinical model (training dataset, 0.735, 95% CI: 0.638–0.817; validation dataset, 0.616, 95% CI: 0.457–0.758) and radiomics model (training dataset, 0.740, 95% CI: 0.643–0.822; validation dataset, 0.742, 95% CI: 0.588–0.862). The training and validation datasets did not, however, differ statistically significantly (P=0.11 vs. the clinical model and P=0.08 vs. the radiomics model in the training dataset; P=0.07 vs. the clinical model and P=0.87 vs. the radiomics model in the validation dataset).
Tables 1,2 provide a summary of the thorough examination of each model’s sensitivity, specificity, PPV, and NPV for predicting the 1- and the 3-year OS in the training and validation datasets.
Table 1. Model performance for predicting 1-year OS in the training and validation datasets.
| Dataset | Model | AUC (95% CI) | P value | SEN | SPE | PPV | NPV |
|---|---|---|---|---|---|---|---|
| Training | Clinical | 0.692 (0.593–0.780) | 0.21 | 65.1% | 71.2% | 62.2% | 73.7% |
| Radiomics | 0.717 (0.619–0.802) | 0.46 | 55.8% | 86.4% | 75.0% | 72.9% | |
| Nomogram | 0.739 (0.643–0.821) | Reference | 81.4% | 64.4% | 62.5% | 82.6% | |
| Validation | Clinical | 0.682 (0.524–0.814) | 0.61 | 62.5% | 75.0% | 58.8% | 77.8% |
| Radiomics | 0.712 (0.556–0.838) | 0.94 | 75.0% | 67.9% | 57.1% | 82.6% | |
| Nomogram | 0.717 (0.561–0.842) | Reference | 68.8% | 67.9% | 55.0% | 79.2% |
AUC, area under the curve; CI, confidence interval; NPV, negative predictive value; OS, overall survival; SEN, sensitivity; SPE, specificity; PPV, positive predictive value.
Table 2. Summary of model performance for predicting 3-year OS in the training and validation datasets.
| Dataset | Model | AUC (95% CI) | P value | SEN | SPE | PPV | NPV |
|---|---|---|---|---|---|---|---|
| Training | Clinical | 0.735 (0.638–0.817) | 0.11 | 65.6% | 76.3% | 82.4% | 56.9% |
| Radiomics | 0.740 (0.643–0.822) | 0.08 | 60.9% | 89.5% | 90.7% | 57.6% | |
| Nomogram | 0.789 (0.697–0.864) | Reference | 75.0% | 79.0% | 85.7% | 65.2% | |
| Validation | Clinical | 0.616 (0.457–0.758) | 0.07 | 46.9% | 83.3% | 88.2% | 37.0% |
| Radiomics | 0.742 (0.588–0.862) | 0.87 | 62.5% | 91.7% | 95.2% | 47.8% | |
| Nomogram | 0.750 (0.597–0.868) | Reference | 65.6% | 75.0% | 87.5% | 45.0% |
AUC, area under the curve; CI, confidence interval; NPV, negative predictive value; OS, overall survival; SEN, sensitivity; SPE, specificity; PPV, positive predictive value.
Evaluation of clinical utilities
There was a good correlation between the actual rate and the expected poor prognosis probability. The non-significant statistic of the Hosmer-Lemeshow test for the clinical model, radiomics model, and nomogram for the 1- and 3-year OS endpoint, respectively, showed no appreciable deviation from an ideal match.
Figure 7 illustrates the DCA for the prediction models in the validation dataset. Over the majority range of threshold probabilities, the nomogram and the radiomics model both demonstrated greater net benefits than the clinical model.
Figure 7.

Decision curve analysis of the predictive models in the training dataset (A,C) and validation dataset (B,D). The gray line and black line represented situations in which all patients and no patients underwent treatment for AE-IPF, respectively. AE-IPF, acute exacerbation of idiopathic pulmonary fibrosis.
Survival analysis
In the training dataset, the clinical model, radiomics model, and nomogram’s C-index values were 0.705 (95% CI: 0.606–0.791), 0.728 (95% CI: 0.631–0.812), and 0.759 (95% CI: 0.664–0.838); in the validation dataset, they were 0.729 (95% CI: 0.470–0.769), 0.692 (95% CI: 0.535–0.822), and 0.746 (95% CI: 0.592–0.865).
The relationship between the nomogram’s projected risk and the patient’s OS was also evaluated in both training and validation datasets. Patients in the high-risk group had a significantly shorter OS than those in the low-risk group, according to the Kaplan-Meier curves in the training dataset [hazard ratio (HR) =2.958, 95% CI: 1.833–4.744, log-rank P<0.001] and the validation dataset (HR =2.547, 95% CI: 1.255–5.171, log-rank P=0.01) (Figure 8). These results suggested that the nomogram could predict the mortality in patients experiencing AE-IPF.
Figure 8.

Kaplan-Meier survival curves of overall survival according to the risk score predicted by the nomogram in the training dataset (A) and the validation dataset (B). CI, confidence interval.
Discussion
The following is a summary of our investigation’s main findings: (I) the nomogram demonstrated the potential to predict mortality in AE-IPF patients. Among the three investigated models (radiomics, clinical model, and nomogram), the nomogram, which is mainly based on radiomics risk-score, displayed superior performance and provided unique and independent biological insights for AE-IPF. (II) The HRCT patterns, the overall CT extent during acute exacerbations, and the mPA/AO ratio were identified as independent predictors for AE-IPF. (III) In both training datasets, the Kaplan-Meier curves showed that patients in the high-risk group had a noticeably shorter OS than those in the low-risk group (HR =2.958, 95% CI: 1.833–4.744, log-rank P<0.001) and the validation dataset (HR =2.547, 95% CI: 1.255–5.171, log-rank P=0.01).
This study represents a pioneering effort to assess the relationship between segmentation methods and the performance of radiomics analysis, as well as developing a mortality prediction model for AE-IPF. Due to significant variability in individual radiological and physiological characteristics, accurate prognostic evaluation in IPF is challenging. We hypothesized that radiological alterations could serve as indicators of survival. The AE-IPF mortality was significantly predicted by the radiomics analysis, which concentrated on bilateral lung assessments. The nomogram demonstrated the best performance, achieving AUCs of 0.739 (95% CI: 0.643–0.821) in the training dataset and 0.717 (95% CI: 0.561–0.842) in the validation dataset for predicting the 1-year OS. Furthermore, the nomogram achieved higher AUC values (training dataset: 0.789, 95% CI: 0.697–0.864; validation dataset: 0.750, 95% CI: 0.597–0.868) in predicting the 3-year OS compared to the clinical model and the radiomics model.
Our research identified HRCT patterns, the overall CT extent during acute exacerbations, and the mPA/AO ratio as independent predictors of AE-IPF. The nomogram which incorporated the independent predictors validated the previously mentioned research findings. Evidence suggests that patients with probable UIP may have better survival rates compared to those with typical UIP, as a result of the presence of honeycombing in almost all patients classified as definite UIP, compared with very few in the possible UIP category (25,26). Additionally, advanced fibrosis has a distinct demarcation adjacent to normal lung parenchyma in the UIP pattern (27). The diffuse pattern’s early stage is represented by the multifocal pattern. It takes a while for the diffuse pattern to emerge from the peripheral pattern. Patients with a diffuse pattern have worse survival outcomes than those with peripheral or multifocal patterns, since the peripheral pattern is primarily linked to organizing pneumonia (OP) or numerous fibroblastic foci, whilst the diffuse pattern is linked to diffuse alveolar damage (DAD). Churg et al. discovered three microscopic patterns of acute lung injury in acute exacerbations of UIP: DAD, OP, and a pattern with several large fibroblastic foci on the surface of pre-existing fibrosis. They observed that patients with substantial fibroblastic foci or OP as the acute pattern typically have better outcomes than those with DAD (28). Therefore, the prognosis of AE-IPF patients can be linked to the CT patterns and extent. Furthermore, due to it is linked to elevated right ventricular pressure, a greater mPA/AO ratio is linked to a worse prognosis in patients with IPF (23). An elevated right ventricular pressure is a recognized indication of pulmonary artery pressure (29), patients with IPF frequently develop pulmonary hypertension (PH), which is associated with a higher risk of death and a worse prognosis (30).
Previous studies have investigated the prognosis of IPF. Jacob et al. found that the quantitative and computer-derived CT variables like are better predictors of mortality in IPF, furthermore. CALIPER, a computer algorithm, when stratified using CALIPER variables and the composite physiological index (CPI), a strong mortality signal was observed (31). Suzuki et al. demonstrated the importance of assessing the gender-age-physiology (GAP) index in conjunction with BMI measurements at the initiation of antifibrotic therapy (AFT) for predicting outcomes in patients with IPF (32). Regarding AE-IPF, higher HRCT fibrosis and ground-glass opacity (GGO) levels are independent predictors of AE-IPF, according to Hirano et al. HRCT abnormalities can also predict the development of AE-IPF in two distinct ethnic cohorts (33). Radiomics analysis of medical images presents considerable promise in delivering prognostic insights. These images do more than display structural information; they also uncover underlying pathophysiology, positioning them as critical data sources for prognosis assessment (34,35). Recent research suggests that integrating clinical factors with imaging modalities may enhance the prediction of early-stage progression in AE-IPF (36). Our nomogram based on radiomics signatures, which incorporates independent predictors, is the first and most extensive study to develop a radiomics-based model for AE-IPF mortality prediction. Furthermore, prior studies have shown that, in comparison to conventional clinical and laboratory data, the CT extent and patterns exhibit a stronger predictive value for patient survival (19). This is also the strength of our research.
Undoubtedly, this study still has certain drawbacks. First off, the study had a limited sample size and a retrospective methodology. Moreover, the research was conducted at a single center. Secondly, certain biological markers that are important predictors or prognostic factors for AE-IPF, such as KL-6 and the ratio of partial pressure of oxygen to fraction of inspiratory oxygen, were not fully examined (37). Apart from this, radiomics characteristics can be influenced by different CT acquisition and reconstruction parameters (38). Therefore, in our research, we did image preprocessing before radiomics analysis to reduce the impact.
Conclusions
In conclusion, the nomogram that integrates radiomic signatures with independent factors could effectively predict mortality in patients with AE-IPF. The prognostic factors identified, in conjunction with our mortality prediction model, hold significant promise for enhancing the management of individuals affected by AE-IPF.
Supplementary
The article’s supplementary files as
Acknowledgments
We are grateful to the patients for their contributions to this study.
Ethical Statement: The authors are accountable for all aspects of the work in ensuring that questions related to the accuracy or integrity of any part of the work are appropriately investigated and resolved. This study was conducted in accordance with the Declaration of Helsinki and its subsequent amendments. This study was approved by the ethics committee of West China Hospital of Sichuan University (No. 2021-1764, date: 02/09/2022), and the retroactive duration of the study allowed for the waiver of the informed consent requirement.
Footnotes
Reporting Checklist: The authors have completed the TRIPOD reporting checklist. Available at https://jtd.amegroups.com/article/view/10.21037/jtd-2025-194/rc
Funding: This study was supported by grants from the National Key Technologies R&D Program of China (Nos. 2021YFC2500700 and 2016YFC0901100), the National Natural Science Foundation of China (No. 81601462), and the Key Research & Development Project of Science and Technology of Sichuan Province (No. 2021YFS0142).
Conflicts of Interest: All authors have completed the ICMJE uniform disclosure form (available at https://jtd.amegroups.com/article/view/10.21037/jtd-2025-194/coif). The authors have no conflicts of interest to declare.
Data Sharing Statement
Available at https://jtd.amegroups.com/article/view/10.21037/jtd-2025-194/dss
References
- 1.Lederer DJ, Martinez FJ. Idiopathic Pulmonary Fibrosis. N Engl J Med 2018;378:1811-23. 10.1056/NEJMra1705751 [DOI] [PubMed] [Google Scholar]
- 2.Raghu G, Remy-Jardin M, Richeldi L, et al. Idiopathic Pulmonary Fibrosis (an Update) and Progressive Pulmonary Fibrosis in Adults: An Official ATS/ERS/JRS/ALAT Clinical Practice Guideline. Am J Respir Crit Care Med 2022;205:e18-47. 10.1164/rccm.202202-0399ST [DOI] [PMC free article] [PubMed] [Google Scholar]
- 3.Raghu G, Collard HR, Egan JJ, et al. An official ATS/ERS/JRS/ALAT statement: idiopathic pulmonary fibrosis: evidence-based guidelines for diagnosis and management. Am J Respir Crit Care Med 2011;183:788-824. 10.1164/rccm.2009-040GL [DOI] [PMC free article] [PubMed] [Google Scholar]
- 4.Podolanczuk AJ, Thomson CC, Remy-Jardin M, et al. Idiopathic pulmonary fibrosis: state of the art for 2023. Eur Respir J 2023;61:2200957. 10.1183/13993003.00957-2022 [DOI] [PubMed] [Google Scholar]
- 5.Ley B, Ryerson CJ, Vittinghoff E, et al. A multidimensional index and staging system for idiopathic pulmonary fibrosis. Ann Intern Med 2012;156:684-91. 10.7326/0003-4819-156-10-201205150-00004 [DOI] [PubMed] [Google Scholar]
- 6.American Thoracic Society. European Respiratory Society . American Thoracic Society/European Respiratory Society International Multidisciplinary Consensus Classification of the Idiopathic Interstitial Pneumonias. This joint statement of the American Thoracic Society (ATS), and the European Respiratory Society (ERS) was adopted by the ATS board of directors, June 2001 and by the ERS Executive Committee, June 2001. Am J Respir Crit Care Med 2002;165:277-304. 10.1164/ajrccm.165.2.ats01 [DOI] [PubMed] [Google Scholar]
- 7.Kim DS, Collard HR, King TE, Jr. Classification and natural history of the idiopathic interstitial pneumonias. Proc Am Thorac Soc 2006;3:285-92. 10.1513/pats.200601-005TK [DOI] [PMC free article] [PubMed] [Google Scholar]
- 8.Collard HR, Moore BB, Flaherty KR, et al. Acute exacerbations of idiopathic pulmonary fibrosis. Am J Respir Crit Care Med 2007;176:636-43. 10.1164/rccm.200703-463PP [DOI] [PMC free article] [PubMed] [Google Scholar]
- 9.Hutchinson JP, McKeever TM, Fogarty AW, et al. Increasing global mortality from idiopathic pulmonary fibrosis in the twenty-first century. Ann Am Thorac Soc 2014;11:1176-85. 10.1513/AnnalsATS.201404-145OC [DOI] [PubMed] [Google Scholar]
- 10.King TE, Jr, Albera C, Bradford WZ, et al. All-cause mortality rate in patients with idiopathic pulmonary fibrosis. Implications for the design and execution of clinical trials. Am J Respir Crit Care Med 2014;189:825-31. 10.1164/rccm.201311-1951OC [DOI] [PubMed] [Google Scholar]
- 11.Song JW, Hong SB, Lim CM, et al. Acute exacerbation of idiopathic pulmonary fibrosis: incidence, risk factors and outcome. Eur Respir J 2011;37:356-63. 10.1183/09031936.00159709 [DOI] [PubMed] [Google Scholar]
- 12.King TE, Jr, Tooze JA, Schwarz MI, et al. Predicting survival in idiopathic pulmonary fibrosis: scoring system and survival model. Am J Respir Crit Care Med 2001;164:1171-81. 10.1164/ajrccm.164.7.2003140 [DOI] [PubMed] [Google Scholar]
- 13.Zappala CJ, Latsi PI, Nicholson AG, et al. Marginal decline in forced vital capacity is associated with a poor outcome in idiopathic pulmonary fibrosis. Eur Respir J 2010;35:830-6. 10.1183/09031936.00155108 [DOI] [PubMed] [Google Scholar]
- 14.Yokoyama A, Kondo K, Nakajima M, et al. Prognostic value of circulating KL-6 in idiopathic pulmonary fibrosis. Respirology 2006;11:164-8. 10.1111/j.1440-1843.2006.00834.x [DOI] [PubMed] [Google Scholar]
- 15.Zhuang Y, Zhou Y, Qiu X, et al. Incidence and impact of extra-pulmonary organ failures on hospital mortality in acute exacerbation of idiopathic pulmonary fibrosis. Sci Rep 2020;10:10742. 10.1038/s41598-020-67598-y [DOI] [PMC free article] [PubMed] [Google Scholar]
- 16.Iwasawa T, Asakura A, Sakai F, et al. Assessment of prognosis of patients with idiopathic pulmonary fibrosis by computer-aided analysis of CT images. J Thorac Imaging 2009;24:216-22. 10.1097/RTI.0b013e3181a6527d [DOI] [PubMed] [Google Scholar]
- 17.Hunninghake GW, Lynch DA, Galvin JR, et al. Radiologic findings are strongly associated with a pathologic diagnosis of usual interstitial pneumonia. Chest 2003;124:1215-23. 10.1378/chest.124.4.1215 [DOI] [PubMed] [Google Scholar]
- 18.Lynch DA, Godwin JD, Safrin S, et al. High-resolution computed tomography in idiopathic pulmonary fibrosis: diagnosis and prognosis. Am J Respir Crit Care Med 2005;172:488-93. 10.1164/rccm.200412-1756OC [DOI] [PubMed] [Google Scholar]
- 19.Akira M, Kozuka T, Yamamoto S, et al. Computed tomography findings in acute exacerbation of idiopathic pulmonary fibrosis. Am J Respir Crit Care Med 2008;178:372-8. 10.1164/rccm.200709-1365OC [DOI] [PubMed] [Google Scholar]
- 20.Kerr KF, Brown MD, Zhu K, et al. Assessing the Clinical Impact of Risk Prediction Models With Decision Curves: Guidance for Correct Interpretation and Appropriate Use. J Clin Oncol 2016;34:2534-40. 10.1200/JCO.2015.65.5654 [DOI] [PMC free article] [PubMed] [Google Scholar]
- 21.Hozumi H, Fujisawa T, Nakashima R, et al. Comprehensive assessment of myositis-specific autoantibodies in polymyositis/dermatomyositis-associated interstitial lung disease. Respir Med 2016;121:91-9. 10.1016/j.rmed.2016.10.019 [DOI] [PubMed] [Google Scholar]
- 22.Collard HR, Ryerson CJ, Corte TJ, et al. Acute Exacerbation of Idiopathic Pulmonary Fibrosis. An International Working Group Report. Am J Respir Crit Care Med 2016;194:265-75. 10.1164/rccm.201604-0801CI [DOI] [PubMed] [Google Scholar]
- 23.Choi JS, Lee SH, Leem AY, et al. Prognostic impact of the ratio of the main pulmonary artery to that of the aorta on chest computed tomography in patients with idiopathic pulmonary fibrosis. BMC Pulm Med 2019;19:81. 10.1186/s12890-019-0843-5 [DOI] [PMC free article] [PubMed] [Google Scholar]
- 24.van Griethuysen JJM, Fedorov A, Parmar C, et al. Computational Radiomics System to Decode the Radiographic Phenotype. Cancer Res 2017;77:e104-7. 10.1158/0008-5472.CAN-17-0339 [DOI] [PMC free article] [PubMed] [Google Scholar]
- 25.Salisbury ML, Tolle LB, Xia M, et al. Possible UIP pattern on high-resolution computed tomography is associated with better survival than definite UIP in IPF patients. Respir Med 2017;131:229-35. 10.1016/j.rmed.2017.08.025 [DOI] [PMC free article] [PubMed] [Google Scholar]
- 26.Fukihara J, Kondoh Y, Brown KK, et al. Probable usual interstitial pneumonia pattern on chest CT: is it sufficient for a diagnosis of idiopathic pulmonary fibrosis? Eur Respir J 2020;55:1802465. 10.1183/13993003.02465-2018 [DOI] [PubMed] [Google Scholar]
- 27.Muri J, Durcová B, Slivka R, et al. Idiopathic Pulmonary Fibrosis: Review of Current Knowledge. Physiol Res 2024;73:487-97. 10.33549/physiolres.935322 [DOI] [PMC free article] [PubMed] [Google Scholar]
- 28.Churg A, Müller NL, Silva CI, et al. Acute exacerbation (acute lung injury of unknown cause) in UIP and other forms of fibrotic interstitial pneumonias. Am J Surg Pathol 2007;31:277-84. 10.1097/01.pas.0000213341.70852.9d [DOI] [PubMed] [Google Scholar]
- 29.Greiner S, Jud A, Aurich M, et al. Reliability of noninvasive assessment of systolic pulmonary artery pressure by Doppler echocardiography compared to right heart catheterization: analysis in a large patient population. J Am Heart Assoc 2014;3:e001103. 10.1161/JAHA.114.001103 [DOI] [PMC free article] [PubMed] [Google Scholar]
- 30.Fell CD, Martinez FJ. The impact of pulmonary arterial hypertension on idiopathic pulmonary fibrosis. Chest 2007;131:641-3. 10.1378/chest.07-0057 [DOI] [PubMed] [Google Scholar]
- 31.Jacob J, Bartholmai BJ, Rajagopalan S, et al. Mortality prediction in idiopathic pulmonary fibrosis: evaluation of computer-based CT analysis with conventional severity measures. Eur Respir J 2017;49:1601011. 10.1183/13993003.01011-2016 [DOI] [PubMed] [Google Scholar]
- 32.Suzuki Y, Mori K, Aono Y, et al. Combined assessment of the GAP index and body mass index at antifibrotic therapy initiation for prognosis of idiopathic pulmonary fibrosis. Sci Rep 2021;11:18579. 10.1038/s41598-021-98161-y [DOI] [PMC free article] [PubMed] [Google Scholar]
- 33.Hirano C, Ohshimo S, Horimasu Y, et al. Baseline High-Resolution CT Findings Predict Acute Exacerbation of Idiopathic Pulmonary Fibrosis: German and Japanese Cohort Study. J Clin Med 2019;8:2069. 10.3390/jcm8122069 [DOI] [PMC free article] [PubMed] [Google Scholar]
- 34.Gillies RJ, Kinahan PE, Hricak H. Radiomics: Images Are More than Pictures, They Are Data. Radiology 2016;278:563-77. 10.1148/radiol.2015151169 [DOI] [PMC free article] [PubMed] [Google Scholar]
- 35.Lambin P, Leijenaar RTH, Deist TM, et al. Radiomics: the bridge between medical imaging and personalized medicine. Nat Rev Clin Oncol 2017;14:749-62. 10.1038/nrclinonc.2017.141 [DOI] [PubMed] [Google Scholar]
- 36.Luo X, Xiang F. Acute exacerbation of idiopathic pulmonary fibrosis a narrative review primary focus on treatments. J Thorac Dis 2024;16:4727-41. 10.21037/jtd-23-1565 [DOI] [PMC free article] [PubMed] [Google Scholar]
- 37.Kishaba T, Tamaki H, Shimaoka Y, et al. Staging of acute exacerbation in patients with idiopathic pulmonary fibrosis. Lung 2014;192:141-9. 10.1007/s00408-013-9530-0 [DOI] [PubMed] [Google Scholar]
- 38.Ibrahim A, Refaee T, Primakov S, et al. The Effects of In-Plane Spatial Resolution on CT-Based Radiomic Features' Stability with and without ComBat Harmonization. Cancers (Basel) 2021;13:1848. 10.3390/cancers13081848 [DOI] [PMC free article] [PubMed] [Google Scholar]