

Abstract
Introduction
Few models have predicted readmission following open ventral hernia repair (VHR), and none have assessed fairness. Fairness evaluation assesses whether predictive performance is similar across demographic groups, ensuring that biases are not propagated. Therefore, we generated an interpretable machine learning model to predict readmission following open VHR while assessing fairness.
Methods
NSQIP (2018–2021) was queried for open VHR. We developed an XGBoost model to predict unplanned readmissions within 30 days of surgery with fivefold cross-validation. Performance and fairness were assessed by demographic groups: gender (female vs. male), ethnicity (Hispanic vs. non-Hispanic), and race (non-White vs. White). We identified influential features within demographic groups using SHapley Additive exPlanations (SHAP).
Results
59,482 patients were included with a readmission rate of 5.5%. The model had an AUC of 0.72 and a Brier score of 0.16. Fairness metrics revealed minimal performance differences between demographic groups. SHAP revealed that influential factors were similar across demographic groups and included days from operation to discharge, morbidity probability, and operative time.
Conclusion
Using interpretable machine learning, we identified unique predictors for unplanned readmission following open VHR. Fairness metrics revealed minimal differences in performance between demographic groups. SHAP showed similar influential factors across demographic groups. Future surgical machine learning models should similarly assess models using fairness metrics and interpretation of predictions.
Keywords: Risk prediction, Fairness, Algorithmic bias, Interpretable machine learning
Introduction
The Centers for Medicare and Medicaid Services Hospital Readmission Reduction Program has drawn increased attention to unplanned hospital readmissions [1]. Many researchers have focused on readmission following open ventral hernia repair (VHR) as this is a common procedure with a 30-day readmission rate of 5–13% [2–4]. Previous studies have identified risk factors for readmission following open VHR [5–9], and two studies have created models to predict readmissions using multivariate logistic regression [3, 4]. However, these models were impacted by biased feature selection as predictors were selected through univariable analysis [10]. Machine learning offers potential advantages over these models by capturing non-linear relationships and handling large numbers of predictors [11–13]. Hassan et al. applied machine learning to predict 30-day readmissions following open VHR and found superior predictive performance compared to traditional statistical models [14]. However, this study was limited to 725 patients at a single center and included patients with concomitant oncologic resections, limiting its generalizability.
A lack of fairness evaluation is another limitation of these open VHR readmission models. The rise of machine learning has highlighted the need for fair predictive models. Fairness evaluation helps prevent sociodemographic biases that may be reflected in data from being propagated in predictions. Recent guidelines for predictive models, including the Transparent Reporting of a multivariable prediction model for Individual Prognosis or Diagnosis (TRIPOD + AI) and the Prediction model Risk of Bias ASsessment Tool (PROBAST + AI), emphasize the need for fairness evaluation across demographic groups, including sex, race, and ethnicity [10, 15]. However, few surgical predictive models assess fairness. Given these limitations of prior studies, we generated an interpretable machine learning model to predict unplanned readmission following open VHR while assessing model fairness.
Methods
We followed the TRIPOD + AI guidelines (Supplemental Content). This study did not have patient or public involvement or a published protocol. We developed and internally validated a predictive model using the 2018–2021 American College of Surgeons National Surgical Quality Improvement Program (NSQIP) Participant Use Data File (PUF). NSQIP PUF is a national deidentified database and was thus exempt from the Institutional Review Board. The number of participating centers ranged from 685 in 2021 to 722 in 2018. The centers are not identifiable. NSQIP was queried for adult patients (18–89 years old) who underwent initial or recurrent open ventral hernia repairs for reducible or incarcerated hernias using Current Procedural Terminology (CPT) codes 49560, 49561, 49565, and 49566. Repairs with (49568) and without mesh were included. Concurrent procedures for exploratory laparotomy (49000), enterolysis (44005), omentectomy (49255), enterorrhaphy (44602), closure enterostomy (44620), enterectomy (44120), panniculectomy (15830), and component separation (15734) were identified. Patients with concomitant procedures besides these were excluded. Patients were also excluded if they left against medical advice, died during admission, or were transferred to an acute care hospital. NSQIP tracks readmissions for 30 days from the day of surgery rather than discharge. This introduces an immortal person time bias for 30-day readmissions [16]. To minimize this bias, we followed prior literature and excluded patients with a length of stay from surgery to discharge greater than 10 days [4, 17]. Patients with unknown lengths of stay were also excluded. Figure 1 outlines inclusion/exclusion of patients. Complications were captured if they occurred during index admission. Whether these complications were present at the time of surgery was also captured. We performed Chi-square and Mann–Whitney U tests to compare patients who were readmitted to those who were not. A p < 0.05 was considered significant. Data preprocessing and univariable analysis were completed using STATA, Version 17 (StataCorp, College Station, TX).
Fig. 1.
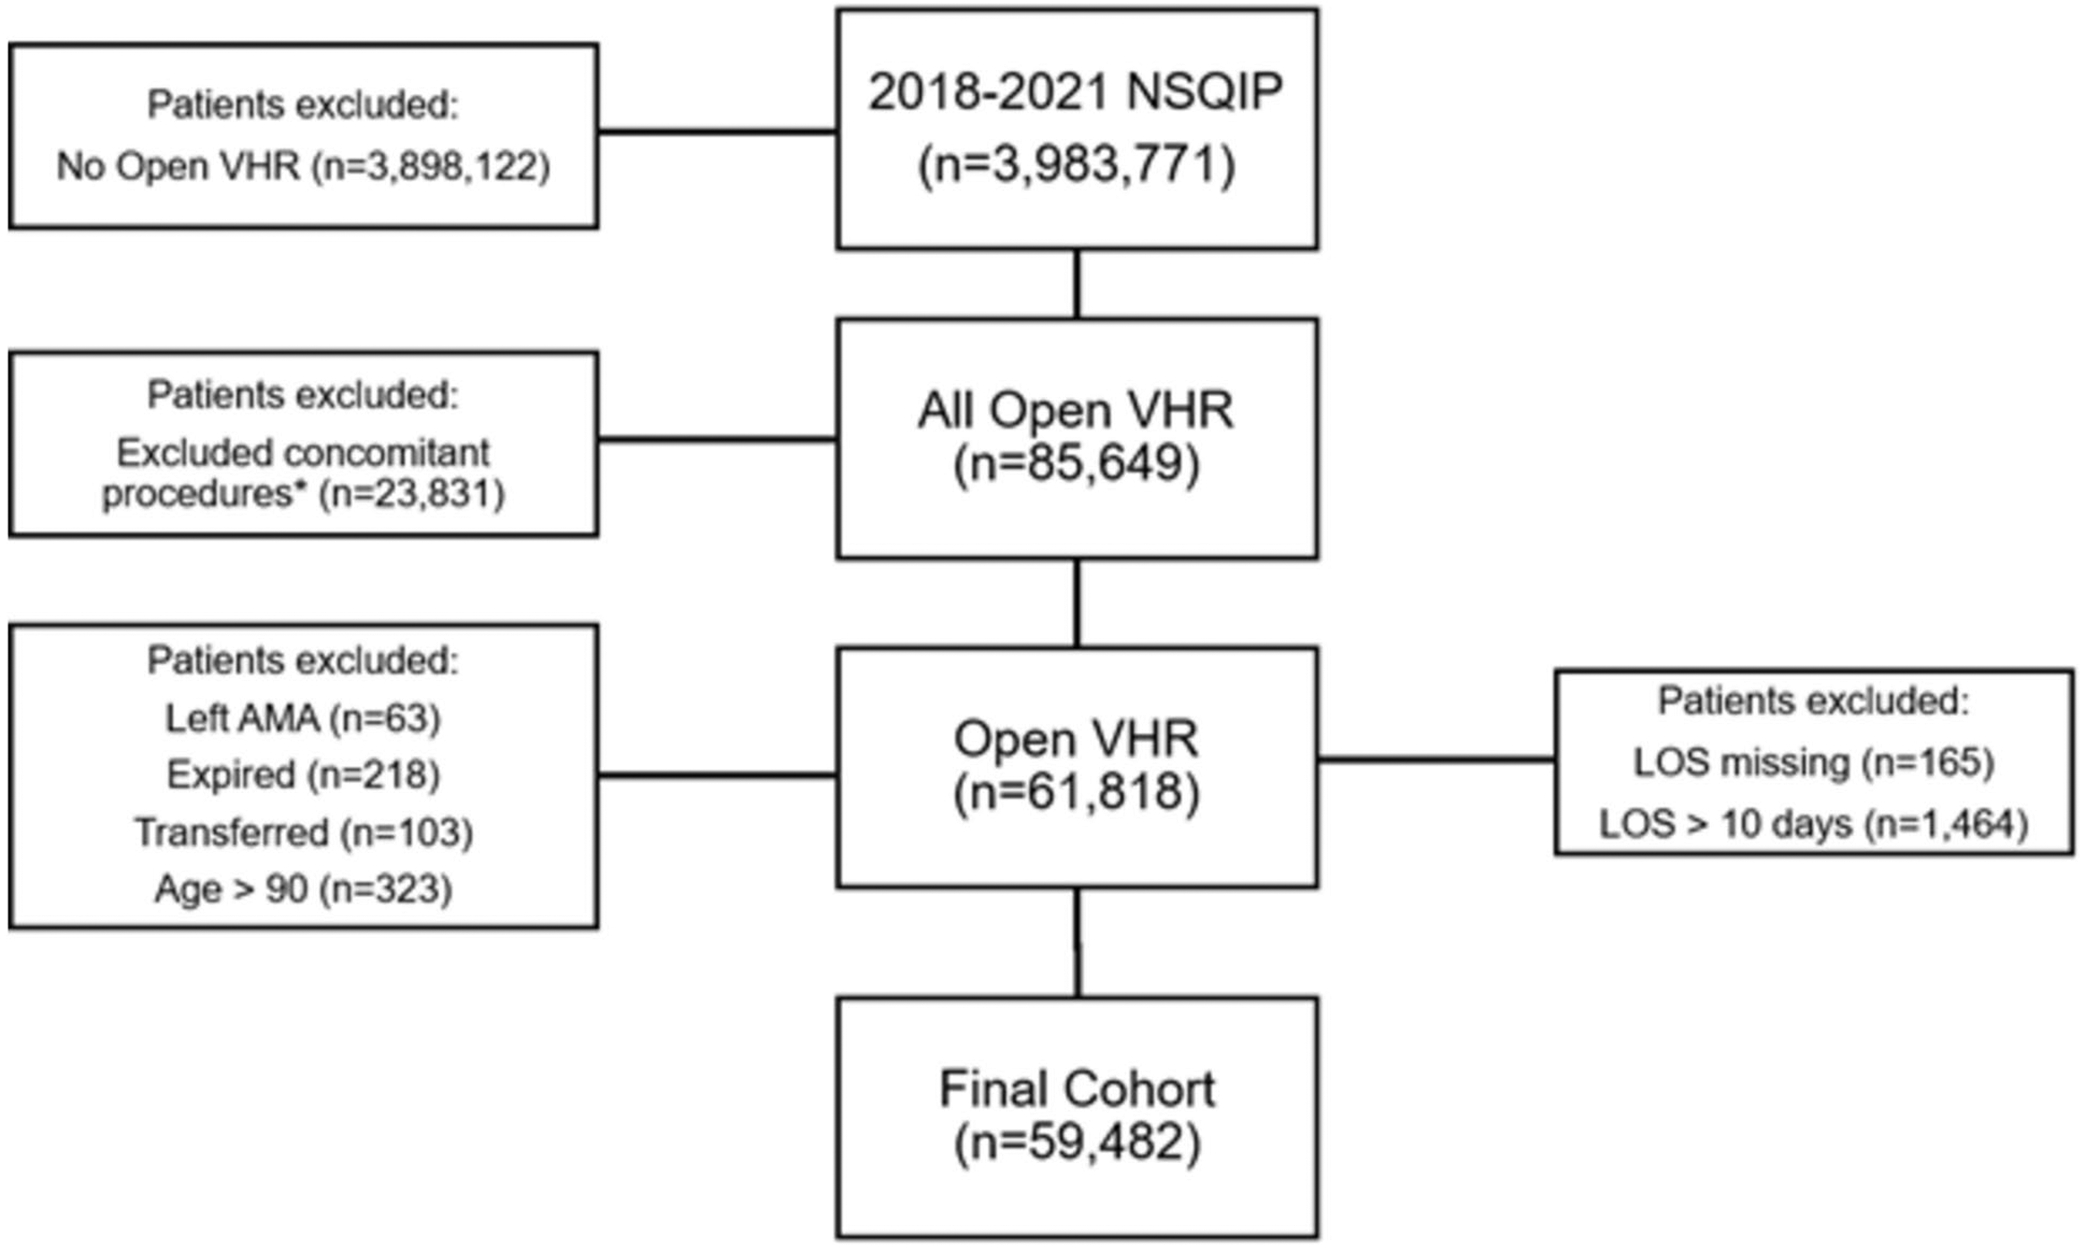
Cohort selection. *Any procedures except initial or recurrent open ventral hernia repairs for reducible or incarcerated hernias with or without mesh, exploratory laparotomy, enterolysis, omentectomy, enterorrhaphy, closure enterostomy, enterectomy, panniculectomy, or component separation. NSQIP National Surgical Quality Improvement Program, VHR ventral hernia repair, AMA against medical advice, LOS length of stay
We generated an XGBoost model to predict unplanned readmissions using variables known at the time of initial discharge. XGBoost was chosen as it captures non-linear relationships, handles large numbers of features, and can be efficiently interpreted. We used a fivefold cross-validation with 60/20/20 train/validation/test splits. L1 and L2 regularization were incorporated for feature selection. We used XGBoost’s default handling of missing values, which learns the optimal direction for missing values at each split in the decision tree [18]. We addressed class imbalance by weighting the loss function inversely proportional to the class frequency and assessed calibration with Brier score. Performance metrics were calculated at the F1-maximizing threshold. Lift analysis compared the model’s performance to random prediction, and concentration curve analysis illustrated the performance. The model was then interpreted with SHapley Additive exPlanations (SHAP) which determines each feature’s average marginal contribution on each prediction [19]. SHAP is derived from the game theory concept, Shapley Values, and quantifies how each feature impacts the predicted log odds of each prediction relative to the model’s baseline prediction. The mean absolute SHAP value was then calculated for each feature to determine the most influential features across all predictions. SHAP dependency plots revealed the directional impact that each feature value had on the predicted log odds of readmission.
Differences in performance metrics were assessed across gender (female vs. male), ethnicity (Hispanic vs. non-Hispanic), and race (non-White vs. White). Patients with a missing value for a demographic variable were excluded from the fairness evaluation for that variable. Fairness metrics were calculated, including statistical parity difference (difference in readmission prediction rate), equal opportunity difference (difference in recalls), average odds difference (average differences in true and false positive rates), and disparate impact (ratio of readmission prediction rates) [20]. Male, non-Hispanic, and White were considered the privileged groups for fairness calculations. Influential factors for each demographic group were interpreted with SHAP. Modeling, evaluation, and interpretation were performed in R Studio Statistical Analysis software (Version 2023.03.0 Build 386) with the ‘xgboost’ (version 1.7.5.1) package. Our code has been made publicly available [21].
Results
Cohort and univariable analysis
The cohort included 59,482 patients—3280 (5.5%) with unplanned readmissions within 30 days of surgery. Patients were predominantly White (83.5%), non-Hispanic (89.2%), and female (55.6%). Most hernias were initial reducible (53.1%) followed by initial incarcerated (27.7%), recurrent reducible (12.2%), and recurrent incarcerated (7.3%). Readmitted patients were more likely to have recurrent reducible and recurrent incarcerated hernias and less likely to have initial reducible hernias (all p < 0.01). Readmitted patients were more likely to have diabetes, chronic obstructive pulmonary disease, ascites, heart failure, hypertension, renal failure, disseminated cancer, and bleeding disorders (all p < 0.01). Readmitted patients were also more likely to smoke and be functionally dependent (both p < 0.01). There were no differences in race, ethnicity, or gender (Table 1).
Table 1.
Demographics and pre-operative factors
| Total (n = 59,482) | No unplanned readmission (n = 56,202) | Unplanned readmission (n = 3280) | p-value | Percent missing | |
|---|---|---|---|---|---|
| Age | 58 (47–68) | 58 (47–68) | 60 (50–69) | < 0.01 | 0.0% |
| Height, inches | 66 (63–69) | 66 (63–69) | 65 (62–69) | < 0.01 | 1.5% |
| Weight, pounds | 196 (166–231) | 196 (165–230) | 203 (170–240) | < 0.01 | 0.9% |
| Race | 0.52 | 16.9% | |||
| Non-white | 8144 (16.5%) | 7670 (16.4%) | 474 (16.9%) | ||
| White | 41,299 (83.5%) | 38,969 (83.6%) | 2330 (83.1%) | ||
| Hispanic | 0.49 | 14.5% | |||
| No | 45,367 (89.2%) | 42,764 (89.2%) | 2603 (89.6%) | ||
| Yes | 5466 (10.8%) | 5165 (10.8%) | 301 (10.4%) | ||
| Admission status | < 0.01 | 0% | |||
| Inpatient | 25,710 (43.2%) | 23,370 (41.6%) | 2340 (71.3%) | ||
| Outpatient | 33,772 (56.8%) | 32,832 (58.4%) | 940 (28.7%) | ||
| Gender | 0.2 | 0% | |||
| Female | 33,099 (55.6%) | 31,216 (55.5%) | 1883 (57.4%) | ||
| Male | 26,378 (44.3%) | 24,981 (44.4%) | 1397 (42.6%) | ||
| Non-binary | 4 (0.0%) | 4 (0.0%) | 0 (0.0%) | ||
| Origin Status | < 0.01 | 0.2% | |||
| Acute care hospital transfer | 635 (1.1%) | 561 (1.0%) | 74 (2.3%) | ||
| Home | 57,726 (97.3%) | 54,633 (97.4%) | 3093 (94.5%) | ||
| Chronic/intermediate care | 136 (0.2%) | 116 (0.2%) | 20 (0.6%) | ||
| Outside ED | 670 (1.1%) | 599 (1.1%) | 71 (2.2%) | ||
| Other | 181 (0.3%) | 165 (0.3%) | 16 (0.5%) | ||
| Initial reducible hernia | 31,573 (53.1%) | 30,084 (53.5%) | 1489 (45.4%) | < 0.01 | 0.0% |
| Initial incarcerated hernia | 16,491 (27.7%) | 15,602 (27.8%) | 889 (27.1%) | < 0.01 | 0.0% |
| Recurrent reducible hernia | 7284 (12.2%) | 6752 (12.0%) | 532 (16.2%) | < 0.01 | 0.0% |
| Recurrent incarcerated hernia | 4337 (7.3%) | 3955 (7.0%) | 382 (11.6%) | < 0.01 | 0.0% |
| Diabetes | < 0.01 | 0.0% | |||
| Insulin | 3373 (5.7%) | 3041 (5.4%) | 332 (10.1%) | ||
| Non-insulin | 7161 (12.0%) | 6701 (11.9%) | 460 (14.0%) | ||
| Smoker within one year | 10,023 (16.9%) | 9352 (16.6%) | 671 (20.5%) | < 0.01 | 0.0% |
| Functional health status | < 0.01 | 0.6% | |||
| Independent | 58,425 (98.8%) | 55,264 (98.9%) | 3161 (96.8%) | ||
| Partially dependent | 638 (1.1%) | 543 (1.0%) | 95 (2.9%) | ||
| Totally dependent | 61 (0.1%) | 52 (0.1%) | 9 (0.3%) | ||
| Ventilator dependent | 23 (0.0%) | 21 (0.0%) | 2 (0.1%) | 0.5 | 0.0% |
| History of severe COPD | 3000 (5.0%) | 2706 (4.8%) | 294 (9.0%) | < 0.01 | 0.0% |
| Ascites | 402 (0.7%) | 327 (0.6%) | 75 (2.3%) | < 0.01 | 0.0% |
| Heart failure | 683 (1.1%) | 594 (1.1%) | 89 (2.7%) | < 0.01 | 0.0% |
| Hypertension | 28,809 (48.4%) | 26,910 (47.9%) | 1899 (57.9%) | < 0.01 | 0.0% |
| Preop dialysis | 586 (1.0%) | 510 (0.9%) | 76 (2.3%) | < 0.01 | 0.0% |
| Disseminated cancer | 495 (0.8%) | 422 (0.8%) | 73 (2.2%) | < 0.01 | 0.0% |
| Immunosuppressive therapy | 3209 (5.4%) | 2940 (5.2%) | 269 (8.2%) | < 0.01 | 0.0% |
| Bleeding disorders | 1846 (3.1%) | 1643 (2.9%) | 203 (6.2%) | < 0.01 | 0.0% |
| Pre-operative transfusion | 52 (0.1%) | 41 (0.1%) | 11 (0.3%) | < 0.01 | 0.0% |
| Systemic sepsis | < 0.01 | 0.0% | |||
| SIRS | 1593 (2.7%) | 1418 (2.5%) | 175 (5.3%) | ||
| Sepsis | 287 (0.5%) | 245 (0.4%) | 42 (1.3%) | ||
| Septic shock | 24 (0.0%) | 19 (0.0%) | 5 (0.2%) | ||
| Days from admission to operation | 0 (0–0) | 0 (0–0) | 0 (0–0) | < 0.01 | 0.0% |
| Superficial SSI PATOS | 11 (0.0%) | 11 (0.0%) | 0 (0.0%) | 0.42 | 0.0% |
| Deep SSI PATOS | 7 (0.0%) | 7 (0.0%) | 0 (0.0%) | 0.52 | 0.0% |
| Organ/space SSI PATOS | 26 (0.0%) | 21 (0.0%) | 5 (0.2%) | < 0.01 | 0.0% |
| Pneumonia PATOS | 29 (0.0%) | 20 (0.0%) | 9 (0.3%) | < 0.01 | 0.0% |
| Mechanical ventilation PATOS | 3 (0.0%) | 2 (0.0%) | 1 (0.0%) | 0.04 | 0.0% |
| UTI PATOS | 32 (0.1%) | 30 (0.1%) | 2 (0.1%) | 0.86 | 0.0% |
| Sepsis PATOS | 130 (0.2%) | 109 (0.2%) | 21 (0.6%) | < 0.01 | 0.0% |
| Septic shock PATOS | 20 (0.0%) | 16 (0.0%) | 4 (0.1%) | < 0.01 | 0.0% |
| ASA Class | 3 (2–3) | 3 (2–3) | 3 (2–3) | < 0.01 | 0.2% |
| NSQIP mortality probability | 0.0009 (0.0003–0.0024) | 0.0009 (0.0003–0.0023) | 0.0020 (0.0008–0.0051) | < 0.01 | 0.0% |
| NSQIP morbidity probability | 0.0559 (0.0380–0.0853) | 0.0547 (0.0375–0.0829) | 0.0833 (0.0565–0.1246) | < 0.01 | 0.0% |
| Pre-operative serum sodium | 139 (138–141) | 139 (138–141) | 139 (137–141) | < 0.01 | 23.6% |
| Pre-operative BUN | 15 (12–20) | 15 (12–20) | 15 (12–21) | 0.12 | 27.2% |
| Pre-operative serum creatinine | 0.9 (0.7–1.1) | 0.9 (0.7–1.1) | 0.9 (0.7–1.1) | < 0.01 | 22.8% |
| Pre-operative serum albumin | 4.1 (3.8–4.4) | 4.1 (3.8–4.4) | 4 (3.6–4.3) | < 0.01 | 50.0% |
| Pre-operative total bilirubin | 0.5 (0.4–0.7) | 0.5 (0.4–0.7) | 0.5 (0.4–0.8) | 0.05 | 49.3% |
| Pre-operative SGOT | 21 (17–28) | 21 (17–28) | 22 (17–30) | < 0.01 | 50.2% |
| Pre-operative alkaline phosphatase | 80 (64–99) | 79 (64–99) | 85 (68–108) | < 0.01 | 49.3% |
| Pre-operative WBC count | 7.2 (5.8–9.1) | 7.2 (5.8–9.0) | 7.6 (5.9–9.7) | < 0.01 | 25.1% |
| Pre-operative hematocrit | 41.1 (38.0–44.1) | 41.2 (38.1–44.2) | 40.4 (37.0–43.8) | < 0.01 | 23.8% |
| Pre-operative platelet count | 243 (200–292) | 243 (200–292) | 242 (193–294) | 0.04 | 25.2% |
| Pre-operative PTT | 29.5 (27.0–32.4) | 29.4 (27.0–32.4) | 30.0 (27.0–33.4) | < 0.01 | 82.2% |
| Pre-operative INR | 1.0 (1.0–1.1) | 1 (1.0–1.1) | 1.1 (1.0–1.2) | < 0.01 | 74.5% |
All displayed as n (%) or median (interquartile range)
ED emergency department, COPD chronic obstructive pulmonary disease, SIRS systemic inflammatory response syndrome, SSI surgical site infection, PATOS present at time of surgery, UTI urinary tract infection, ASA American Society of Anesthesiologists, NSQIP National Surgical Quality Improvement Program, BUN blood urea nitrogen, SGOT serum glutamic-oxaloacetic transaminase, WBC white blood cell, PTT partial thromboplastin time, INR international normalized ratio
Mesh was placed in 49% of patients, and 6.1% of patients had a component separation. Readmitted patients had higher rates of all concomitant procedures (all p < 0.01). There was no difference in the use of mesh. Operative times were greater in readmitted patients (111 [68–173] vs. 70 [41–121 min], p < 0.01). Post-operative complications prior to discharge were more common in readmitted patients including sepsis, septic shock, organ/space surgical site infection (SSI), dehiscence, pneumonia, reintubation, pulmonary embolism, failure to wean ventilator, renal failure, myocardial infarction, bleeding requiring transfusion, deep vein thrombosis, reoperation, and Clostridium difficile (all p < 0.01). Readmitted patients had longer index lengths of stay (3 [1–5] vs. 1 [0–3], p < 0.01) and were less likely to be discharged home after initial surgery (94.5 vs 98.0%, p < 0.01, Table 2).
Table 2.
Operative and post-operative factors
| Total (n = 59,482) | No unplanned readmission (n = 56,202) | Unplanned readmission (n = 3280) | p-value | Percent missing | |
|---|---|---|---|---|---|
| Mesh | 29,121 (49.0%) | 27,520 (49.0%) | 1601 (48.8%) | 0.86 | 0.0% |
| Exploratory laparotomy | 876 (1.5%) | 774 (1.4%) | 102 (3.1%) | < 0.01 | 0.0% |
| Enterolysis | 1920 (3.2%) | 1686 (3.0%) | 234 (7.1%) | < 0.01 | 0.0% |
| Omentectomy | 257 (0.4%) | 229 (0.4%) | 28 (0.9%) | < 0.01 | 0.0% |
| Enterorrhaphy | 103 (0.2%) | 89 (0.2%) | 14 (0.4%) | < 0.01 | 0.0% |
| Closure enterostomy | 214 (0.4%) | 190 (0.3%) | 24 (0.7%) | < 0.01 | 0.0% |
| Enterectomy | 1050 (1.8%) | 902 (1.6%) | 148 (4.5%) | < 0.01 | 0.0% |
| Component separation | 3635 (6.1%) | 3289 (5.9%) | 346 (10.5%) | < 0.01 | 0.0% |
| Panniculectomy | 708 (1.2%) | 635 (1.1%) | 73 (2.2%) | < 0.01 | 0.0% |
| Principal anesthesia technique | < 0.01 | 0.0% | |||
| Epidural | 58 (0.1%) | 56 (0.1%) | 2 (0.1%) | ||
| General | 57,412 (96.5%) | 54,178 (96.4%) | 3234 (98.6%) | ||
| Local | 61 (0.1%) | 56 (0.1%) | 5 (0.2%) | ||
| Monitored anesthesia care | 1664 (2.8%) | 1639 (2.9%) | 25 (0.8%) | ||
| Other | 43 (0.1%) | 41 (0.1%) | 2 (0.1%) | ||
| Regional | 27 (0.0%) | 25 (0.0%) | 2 (0.1%) | ||
| Spinal | 212 (0.4%) | 203 (0.4%) | 9 (0.3%) | ||
| Work relative value unit | 11.9 (11.9–15.4) | 11.9 (11.9–15.4) | 12.4 (11.9–15.4) | < 0.01 | 0.0% |
| Total operation time, minutes | 72 (42–125) | 70 (41–121) | 111 (68–173) | < 0.01 | 0.0% |
| Complications | |||||
| Shock | 37 (0.1%) | 30 (0.1%) | 7 (0.2%) | < 0.01 | 0.0% |
| Sepsis | 164 (0.3%) | 138 (0.2%) | 26 (0.8%) | < 0.01 | 0.0% |
| Superficial SSI | 109 (0.2%) | 106 (0.2%) | 3 (0.1%) | 0.21 | 0.0% |
| Deep SSI | 15 (0.0%) | 13 (0.0%) | 2 (0.1%) | 0.18 | 0.0% |
| Organ space infection | 42 (0.1%) | 31 (0.1%) | 11 (0.3%) | < 0.01 | 0.0% |
| Dehiscence | 34 (0.1%) | 27 (0.0%) | 7 (0.2%) | < 0.01 | 0.0% |
| Pneumonia | 195 (0.3%) | 163 (0.3%) | 32 (1.0%) | < 0.01 | 0.0% |
| Reintubation | 62 (0.1%) | 50 (0.1%) | 12 (0.4%) | < 0.01 | 0.0% |
| Pulmonary embolism | 57 (0.1%) | 49 (0.1%) | 8 (0.2%) | < 0.01 | 0.0% |
| Failure to wean ventilator | 48 (0.1%) | 39 (0.1%) | 9 (0.3%) | < 0.01 | 0.0% |
| Dialysis | 21 (0.0%) | 19 (0.0%) | 2 (0.1%) | 0.42 | 0.0% |
| Urinary tract infection | 89 (0.1%) | 80 (0.1%) | 9 (0.3%) | 0.06 | 0.0% |
| Stroke | 8 (0.0%) | 8 (0.0%) | 0 (0.0%) | 0.49 | 0.0% |
| Cardiac arrest | 7 (0.0%) | 7 (0.0%) | 0 (0.0%) | 0.52 | 0.0% |
| Myocardial infarction | 55 (0.1%) | 43 (0.1%) | 12 (0.4%) | < 0.01 | 0.0% |
| Blood transfusion | 436 (0.7%) | 365 (0.6%) | 71 (2.2%) | < 0.01 | 0.0% |
| Deep vein thrombosis | 41 (0.1%) | 33 (0.1%) | 8 (0.2%) | < 0.01 | 0.0% |
| Reoperation | 290 (0.5%) | 256 (0.5%) | 34 (1.0%) | < 0.01 | 0.0% |
| Clostridium difficile | 41 (0.1%) | 34 (0.1%) | 7 (0.2%) | < 0.01 | 0.0% |
| Operation to discharge, days | 1 (0–3) | 1 (0–3) | 3 (1–5) | < 0.01 | 0.0% |
All displayed as n (%) or median (interquartile range)
SSI surgical site infection
Model performance, fairness, and interpretation
Performance metrics are reported at the F1-maximizing threshold of the test sets for the overall cohort and each demographic group (Table 3). The range of metrics across all test folds is included in the Supplemental File. Lift and concentration curve analyses compared model performance to random prediction and showed that the quarter of patients with the highest predicted probability of readmission were twice as likely to be readmitted compared to the overall cohort, and this quarter of patients included 50% of all readmissions (Supplemental File). Fairness metrics revealed minimal bias with race having the least disparity in performance and sex having the most disparity. Notably, race had the least difference in actual readmission rate, while sex had the greatest difference (Table 4).
Table 3.
Group statistics and model metrics at the F1-maximizing threshold
| Overall | Female | Male | Hispanic | non-Hispanic | White | non-White | |
|---|---|---|---|---|---|---|---|
| Actual outcome rate | 0.055 | 0.057 | 0.053 | 0.055 | 0.057 | 0.058 | 0.056 |
| Positive prediction rate | 0.164 | 0.177 | 0.146 | 0.145 | 0.179 | 0.179 | 0.174 |
| Accuracy | 0.823 | 0.813 | 0.835 | 0.846 | 0.809 | 0.808 | 0.814 |
| Specificity | 0.849 | 0.837 | 0.864 | 0.871 | 0.834 | 0.834 | 0.840 |
| Recall | 0.376 | 0.416 | 0.323 | 0.419 | 0.390 | 0.390 | 0.394 |
| Precision | 0.127 | 0.133 | 0.117 | 0.159 | 0.125 | 0.127 | 0.128 |
| F1 score | 0.190 | 0.202 | 0.172 | 0.230 | 0.190 | 0.192 | 0.193 |
| AUC | 0.717 | 0.721 | 0.712 | 0.745 | 0.711 | 0.718 | 0.715 |
| Brier score | 0.157 | 0.162 | 0.150 | 0.145 | 0.164 | 0.159 | 0.162 |
Actual outcome rate—proportion of patients who had a readmission. Positive prediction rate—proportion of patients who were predicted to have a readmission. Accuracy—proportion of predictions that were correct. Specificity—proportion of non-readmitted patients predicted correctly. Recall—proportion of actual readmissions captured by the model. Precision—proportion of predicted readmissions who had a readmission. F1 score—harmonic mean of precision and recall. AUC—area under the receiver operating characteristics curve. Brier score—mean squared difference between predicted probabilities and actual outcomes
Table 4.
Fairness metrics
| SPD | EOD | AOD | DI | |
|---|---|---|---|---|
| Sex | −0.031 | −0.093 | −0.033 | 1.212 |
| Ethnicity | 0.034 | −0.028 | −0.032 | 0.812 |
| Race | 0.005 | −0.004 | −0.005 | 0.971 |
SPD statistical parity difference, EOD equal opportunity difference, AOD average odds difference, DI disparate impact
SHAP revealed days from operation to discharge (0.40), NSQIP morbidity probability (0.28), operative time (0.26), NSQIP mortality probability (0.15), age (0.08), pre-operative blood urea nitrogen (BUN) (0.07), admission status (0.06), work relative value units (0.06), pre-operative hematocrit (0.06), and weight (0.06) as most influential in overall predictions. SHAP dependence plots visualized individual SHAP values relative to variable values, showing how changes in variable values tended to impact SHAP values (Supplemental Content). Minimal differences existed among demographic groups’ most influential factors (Table 5). All demographic variables had mean absolute SHAP values less than or equal to 0.02 across all demographic groups, indicating minimal impact on predictions (Supplemental File).
Table 5.
Top mean absolute SHAP values
| Overall | Male | Female | Hispanic | non-Hispanic | White | non-White | |
|---|---|---|---|---|---|---|---|
| OR to DC, days | 0.40 | 0.41 | 0.39 | 0.41 | 0.39 | 0.41 | 0.39 |
| NSQIP morbidity probability | 0.28 | 0.27 | 0.29 | 0.31 | 0.28 | 0.30 | 0.28 |
| Operative time | 0.26 | 0.27 | 0.25 | 0.25 | 0.25 | 0.24 | 0.25 |
| NSQIP mortality probability | 0.15 | 0.14 | 0.16 | 0.19 | 0.14 | 0.18 | 0.14 |
| Age, years | 0.08 | 0.07 | 0.08 | 0.07 | 0.08 | 0.08 | 0.08 |
| Preop BUN | 0.07 | 0.07 | 0.07 | 0.06 | 0.07 | 0.07 | 0.07 |
| Admission status | 0.06 | 0.07 | 0.06 | 0.07 | 0.06 | 0.06 | 0.07 |
| Work RVU | 0.06 | 0.06 | 0.07 | 0.07 | 0.06 | 0.07 | 0.06 |
| Preop HCT | 0.06 | 0.06 | 0.06 | 0.06 | 0.06 | 0.06 | 0.06 |
| Weight, pounds | 0.06 | 0.06 | 0.06 | 0.05 | 0.06 | 0.06 | 0.06 |
| Preop WBC count | 0.06 | 0.06 | 0.06 | 0.06 | 0.06 | 0.06 | 0.06 |
| Preop sodium | 0.06 | 0.06 | 0.06 | 0.06 | 0.06 | 0.06 | 0.06 |
OR operating room, DC discharge, NSQIP National Surgical Quality Improvement Program, BUN blood urea nitrogen, RVU relative value unit, HCT hematocrit, WBC white blood cell
Discussion
We generated an interpretable machine learning model to predict unplanned readmission within 30 days of open VHR and assessed model fairness through fairness metrics and prediction interpretation. We found similar performance across demographic groups, as indicated by statistical parity, equal opportunity, and average odds differences near 0 and disparate impacts near 1. SHAP revealed similar influential factors across demographic groups with demographic variables having minimal influence. To our knowledge, this is the first study to assess model fairness for readmissions following open VHR and the first surgical predictive model to use SHAP for fairness evaluation.
Prior studies have identified readmission risk factors following open VHR, and many of our most influential factors, including length of stay, operative time, inpatient status, weight, and comorbidity burden, are consistent with this literature [4, 5, 22]. Our work is unique from these prior studies as we included factors not previously considered, such as pre-operative lab values. This inclusion added predictive value as pre-operative BUN and hematocrit were two of the most influential factors in our predictions. Due to missingness, traditional statistical models often cannot use these variables since many patients do not have pre-operative labs [23]. The ability of XGBoost to handle missingness is one advantage compared to traditional statistical models [18]. We found that low and high values for BUN and hematocrit tended to have higher SHAP values, meaning these values contributed to higher predicted log odds of readmission. These values likely reflect clinical conditions such as chronic diseases, malnutrition, and dehydration, which could contribute to an increased risk of readmission.
Two prior studies used NSQIP and traditional statistical models to predict readmissions following open VHR. However, their cohort selection and primary outcome differ from our study. Nelson et al. included patients who underwent concomitant cholecystectomy, appendectomy, revision colostomy, total abdominal hysterectomy, and oophorectomy [3]. Additionally, they did not exclude patients who were not at risk for readmission, such as patients who died prior to discharge, were transferred to another hospital, or were admitted more than 30 days following surgery. Our cohort more closely resembles Baltodano et al., who properly excluded patients who were not at risk for readmission and patients who were admitted for more than 10 days [4]. They excluded patients with concomitant procedures except component separation, enterolysis, and panniculectomy. In contrast, we additionally included concomitant bowel procedures since these could be a result of intraoperative complications from open VHR. Baltodano et al. defined their outcome as “complication leading to unplanned readmission within 30 days of VHR.” Therefore, they did not include post-operative complications as risk factors to avoid data leakage. However, their inclusion of length of stay as a predictor causes data leakage. Patients with longer lengths of stay because of complications will have the outcome leaked through the length of stay predictor. Finally, both Nelson et al. and Baltodano et al. selected predictors through univariable analysis, a source of feature selection bias [10]. Our study eliminated these preprocessing and model training biases.
Patient risk factors may interact in complex, non-linear relationships that are inadequately modeled by traditional statistical models, which assume linear relationships. Machine learning models can capture these complex relationships and may provide superior predictive performance [11, 12]. Hassan et al. illustrated this by showing the superior performance of machine learning models in predicting outcomes after open VHR compared to multivariate logistic regression [14]. However, their study was limited to 725 patients at a single center and included patients with concomitant oncologic resections, which may limit generalizability. Additionally, their study lacked fairness evaluation. They interpreted their models with permutation feature importance and accumulated local effect analysis, providing a global interpretation of the model. In contrast, our use of SHAP provides local interpretations of individual predictions, thereby allowing interpretation of predictions for each demographic group.
Few surgical predictive models evaluate fairness. Allen et al. applied the four-fifths guideline from the US Employment Office as a fairness criterion for accuracy, recall, and F1 score in a model predicting outcomes following total shoulder arthroplasty [24]. While a novel application, the four-fifths guideline is used for employment selection rates, which is not analogous to these performance metrics. A more appropriate application of the four-fifths guideline would be for the rates of positive predictions, which is reflected by the disparate impact [20]. Similarly, Davoudi et al. used the four-fifths guideline to determine bias in a single-center model for predicting acute post-operative pain following orthopedic surgery [25]. They attempted to reweigh the prediction models for demographic fairness metrics that fell outside the four-fifths guideline but found that limiting the bias of a metric for one demographic group introduced new biases in other metrics and/or demographic groups. The demographic variables that were biased had significantly different outcome rates between groups, while the attributes that were not biased had similar outcome rates.
Previous literature has mathematically shown that for groups with different outcome rates, equal predictive error types and calibrations, i.e., how well predictions match actual outcomes, cannot both be achieved [26]. Therefore, desired results for all fairness metrics may be mutually exclusive when outcome rates differ, as Davoudi et al. experienced [24, 26]. Our model benefited from relatively similar outcome rates across our demographic groups, which is reflected in the minimal influence of demographic variables on the predictions. Despite these minimal differences, our results still reflect the impact that outcome rates can have on fairness metrics. Gender had the greatest difference in outcome rates and the worst fairness metrics, while race had the least difference in outcome rates and the best fairness metrics.
When outcome rates differ, researchers should consider why. Models are ultimately beholden to the quality and the biases of data. While differences in performance metrics and influential factors between groups can be identified, discerning the cause of different outcome rates is often difficult. Differences in outcome rates can be caused by demographic factors that are important for a model to learn, but differences may also be rooted in discrimination. Some researchers have suggested omitting demographic variables from predictive models [27]. Others have disagreed, highlighting several problems with this approach that may harm minority groups [26, 28]. First, patterns in the data may correlate with demographic groups and could still lead to bias. For example, software that predicted the likelihood of criminal re-offense predicted a higher likelihood of re-offense for Black individuals, even though race was excluded from the model [29]. Second, when demographic variables do add predictive value, excluding demographics may negatively impact minority groups since model training and predictions will be skewed to the majority group [26]. Finally, differences do not always imply discrimination. McCradden et al. have suggested that differences in outcome rates by demographic groups could sometimes reflect a causative relationship [28].
Not all prediction contexts are the same. Prediction decisions may or may not have competing interests, and researchers should understand this contextual difference. For example, a model that recommends whether a patient should be prescribed a medication differs from a model that predicts which patients should receive a limited resource. Paulus and Kent have argued that demographics are often excluded from predictive models that have no competing interests given concerns about including demographics in models that do have competing interests [30]. When no competing interests are present, demographics should be included if they add predictive value. Dong Wong-Kang et al. attempted to optimize equal opportunity difference and disparate impact for race in four models predicting complications after bariatric surgery by omitting race, oversampling the minority group, and undersampling the majority group [31]. While omitting race and oversampling the minority group worsened fairness metrics, undersampling the majority group improved the equal opportunity difference in two models and the disparate impact in two models. However, the true positive rate decreased for both the majority and minority groups in three models and the majority group in the fourth model. Since predicting post-operative complications presumably has no competing interests, improving fairness metrics at the cost of predictive performance for all patients benefits no one. In contrast, readmission models like ours may have competing interests if post-discharge resources are limited and distributed based on readmission predictions. These instances require discussions of trade-offs in fairness metrics and predictive performance.
Fairness is inherently subjective and cannot be determined with one cutoff or metric. Differences in the context of prediction decisions and the possible causal relationships between predictors and the outcome should prevent a one-size-fits-all approach to the development and evaluation of fair predictive models. Metrics that may be considered fair in one context may not be in other contexts [32]. Fairness requires a comprehensive evaluation of performance differences and an interpretation of the model and the predictions. Only then can stakeholders discuss how to define and ensure fairness.
Unfortunately, limitations in available data often prevent fairness evaluation. In a review of publicly available critical care databases, Fong et al. found that most data lacked the information needed to ensure fairness in model development [33]. Similarly, we lacked important demographic variables such as insurance status and income, which have been associated with 30-day readmissions following hernia repair [2]. Additionally, some of our cohort had missing values for ethnicity (14.5%) and race (16.9%). While these patients were excluded from the fairness evaluation, knowing their demographics could improve the overall model. Several other limitations of this study should also be considered. An inadequate number of patients within demographic groups limits the ability to create fair predictive models. To ensure an adequate number of patients for each group, we classified patients by male and female, Hispanic and non-Hispanic, and White and non-White. However, this approach may ignore important differences among specific races or combinations of demographics. Additionally, our cohort only included patients admitted for less than or equal to 10 days to limit an immortal time bias. Therefore, our results and conclusions cannot be applied to patients with lengths of stay greater than 10 days. Other limitations of NSQIP include the inability to capture readmissions to different institutions as well as the absence of important predictors such as hernia size. Despite these limitations, this study uses a national database to illustrate how fairness can be evaluated in interpretable machine learning models while identifying unique predictors for readmission following open VHR. Future research should build upon our work by predicting 30-day readmission from the day of discharge, allowing inclusion of patients with lengths of stay greater than 10 days, and should also incorporate additional predictors such as hernia size. Finally, external validation must be performed before clinical application, and fairness should be continually assessed. Readmission prediction models can potentially guide post-discharge care decisions following open VHR. However, their readiness for application is currently limited not by technology, but by access to granular and comprehensive data.
Conclusion
Our interpretable machine learning model for readmission after open VHR identified unique predictors and improved upon prior models in generalizability, feature selection, and fairness evaluation. Demographic groups had minimal differences in predictive performance. Interpretation with SHAP provided insights into the predictors most influential for individual patients and demographic groups. Few differences existed in the most influential factors across demographic groups, and none included demographic variables. Future surgical machine learning models should similarly assess fairness through fairness metrics and prediction interpretations.
Supplementary Material
The online version contains supplementary material available at https://doi.org/10.1007/s00464-025-11927-7.
Funding
Research reported in this publication was supported by the Ruth L. Kirschstein Institutional National Research Service Award of the National Institutes of Health under award number T32GM144274 which funds Dr. Zander’s fellowship. The content is solely the responsibility of the authors and does not necessarily represent the official views of the National Institutes of Health.
Footnotes
Disclosures Dr. Joseph Sujka is a consultant for Intuitive, Medtronic, and Enterra Medical. Drs. Tyler Zander, Melissa Kendall, Rachel Wolansky, Emily Grimsley, Rajavi Parikh, and Paul Kuo have no conflicts of interest or financial ties to disclose.
Meeting presentation: Presented as a poster on March 12–15, 2025 at the Society of American Gastrointestinal and Endoscopic Surgeons Annual Meeting in Long Beach, CA.
References
- 1.Mehtsun WT, Papanicolas I, Zheng J, Orav EJ, Lillemoe KD, Jha AK (2018) National trends in readmission following inpatient surgery in the hospital readmissions reduction program era. Ann Surg 267(4):599–605 [DOI] [PubMed] [Google Scholar]
- 2.Feimster JW, Whitehurst BD, Reid AJ, Scaife S, Mellinger JD (2022) Association of socioeconomic status with 30- and 90-day readmission following open and laparoscopic hernia repair: a nationwide readmissions database analysis. Surg Endosc 36(7):5424–5430 [DOI] [PubMed] [Google Scholar]
- 3.Nelson JA, Fischer J, Chung CC, Wink J, Wes A, Serletti JM, Kovach S (2015) Readmission following ventral hernia repair: a model derived from the ACS-NSQIP datasets. Hernia 19(1):125–133 [DOI] [PubMed] [Google Scholar]
- 4.Baltodano PA, Webb-Vargas Y, Soares KC, Hicks CW, Cooney CM, Cornell P, Burce KK, Pawlik TM, Eckhauser FE (2016) A validated, risk assessment tool for predicting readmission after open ventral hernia repair. Hernia 20(1):119–129 [DOI] [PubMed] [Google Scholar]
- 5.Nguyen MT, Li LT, Hicks SC, Davila JA, Suliburk JW, Leong M, Kao LS, Berger DH, Liang MK (2013) Readmission following open ventral hernia repair: incidence, indications, and predictors. Am J Surg 206(6):942–948 [DOI] [PubMed] [Google Scholar]
- 6.Blatnik JA, Harth KC, Aeder MI, Rosen MJ (2011) Thirty-day readmission after ventral hernia repair: predictable or preventable? Surg Endosc 25(5):1446–1451 [DOI] [PubMed] [Google Scholar]
- 7.Lovecchio F, Farmer R, Souza J, Khavanin N, Dumanian GA, Kim JY (2014) Risk factors for 30-day readmission in patients undergoing ventral hernia repair. Surgery 155(4):702–710 [DOI] [PubMed] [Google Scholar]
- 8.Helgstrand F, Rosenberg J, Kehlet H, Bisgaard T (2011) Nationwide analysis of prolonged hospital stay and readmission after elective ventral hernia repair. Dan Med Bull 58(10):A4322. [PubMed] [Google Scholar]
- 9.Helgstrand F, Rosenberg J, Kehlet H, Jorgensen LN, Bisgaard T (2013) Nationwide prospective study of outcomes after elective incisional hernia repair. J Am Coll Surg 216(2):217–228 [DOI] [PubMed] [Google Scholar]
- 10.Wolff RF, Moons KGM, Riley RD, Whiting PF, Westwood M, Collins GS, Reitsma JB, Kleijnen J, Mallett S (2019) PROBAST: a tool to assess the risk of bias and applicability of prediction model studies. Ann Intern Med 170(1):51. [DOI] [PubMed] [Google Scholar]
- 11.Hassan AM, Rajesh A, Asaad M, Nelson JA, Coert JH, Mehrara BJ, Butler CE (2023) Artificial intelligence and machine learning in prediction of surgical complications: current state, applications, and implications. Am Surg 89(1):25–30 [DOI] [PMC free article] [PubMed] [Google Scholar]
- 12.Loftus TJ, Tighe PJ, Filiberto AC, Efron PA, Brakenridge SC, Mohr AM, Rashidi P, Upchurch GR Jr, Bihorac A (2020) Artificial intelligence and surgical decision-making. JAMA Surg 155(2):148–158 [DOI] [PMC free article] [PubMed] [Google Scholar]
- 13.Liu Y, Ko CY, Hall BL, Cohen ME (2023) American College of Surgeons NSQIP risk calculator accuracy using a machine learning algorithm compared with regression. J Am Coll Surg 236(5):1024–1030 [DOI] [PubMed] [Google Scholar]
- 14.Hassan AM, Lu SC, Asaad M, Liu J, Offodile AC 2nd, Sidey-Gibbons C, Butler CE (2022) Novel machine learning approach for the prediction of hernia recurrence, surgical complication, and 30-day readmission after abdominal wall reconstruction. J Am Coll Surg 234(5):918–927 [DOI] [PubMed] [Google Scholar]
- 15.Collins GS, Moons KGM, Dhiman P, Riley RD, Beam AL, Van Calster B, Ghassemi M, Liu X, Reitsma JB, van Smeden M, Boulesteix AL, Camaradou JC, Celi LA, Denaxas S, Denniston AK, Glocker B, Golub RM, Harvey H, Heinze G, Hoffman MM, Kengne AP, Lam E, Lee N, Loder EW, Maier-Hein L, Mateen BA, McCradden MD, Oakden-Rayner L, Ordish J, Parnell R, Rose S, Singh K, Wynants L, Logullo P (2024) TRIPOD+AI statement: updated guidance for reporting clinical prediction models that use regression or machine learning methods. BMJ 385:e078378. [DOI] [PMC free article] [PubMed] [Google Scholar]
- 16.Zander T, Kendall MA, Wolansky RL, Sujka J, Kuo PC (2024) Immortal time bias with NSQIP readmission. J Am Coll Surg 240:234. [DOI] [PMC free article] [PubMed] [Google Scholar]
- 17.Lucas DJ, Haider A, Haut E, Dodson R, Wolfgang CL, Ahuja N, Sweeney J, Pawlik TM (2013) Assessing readmission after general, vascular, and thoracic surgery using ACS-NSQIP. Ann Surg 258(3):430–439 [DOI] [PMC free article] [PubMed] [Google Scholar]
- 18.Chen T, Guestrin C (2016) XGBoost: a scalable tree boosting system. In: Presented at: Proceedings of the 22nd ACM SIGKDD international conference on knowledge discovery and data mining; San Francisco, California, USA. https://arxiv.org/abs/1603.02754. Accessed 19 Nov 2024. [Google Scholar]
- 19.Lundberg SM, Lee S-I (2017) A unified approach to interpreting model predictions. In: Presented at Proceedings of the 31st international conference on neural information processing systems; Long Beach, California, USA. https://arxiv.org/abs/1705.07874. Accessed 19 Nov 2024. [Google Scholar]
- 20.Chakraborty J, Majumder S, Menzies T (2021) Bias in machine learning software: why? how? what to do? Presented at Proceedings of the 29th ACM joint meeting on european software engineering conference and symposium on the foundations of software engineering. https://arxiv.org/abs/2105.12195. Accessed 19 Nov 2024. [Google Scholar]
- 21.Zander T (2025) Hernia. https://github.com/tlzander/Hernia. Accessed 15 Jan 2025.
- 22.Henriksen NA, Bisgaard T, Helgstrand F, Danish Hernia D (2020) Smoking and obesity are associated with increased readmission after elective repair of small primary ventral hernias: a nationwide database study. Surgery 168(3):527–531 [DOI] [PubMed] [Google Scholar]
- 23.American College of Surgeons (2022) ACS NSQIP 2021 PUF user guide. https://www.facs.org/media/tjcd1biq/nsqip_puf_userguide_2021_20221102120632.pdf. Accessed 11 Nov 2024.
- 24.Allen C, Kumar V, Elwell J, Overman S, Schoch BS, Aibinder W, Parsons M, Watling J, Ko JK, Gobbato B, Throckmorton T, Routman H, Roche CP (2024) Evaluating the fairness and accuracy of machine learning-based predictions of clinical outcomes after anatomic and reverse total shoulder arthroplasty. J Shoulder Elbow Surg 33(4):888–899 [DOI] [PubMed] [Google Scholar]
- 25.Davoudi A, Sajdeya R, Ison R, Hagen J, Rashidi P, Price CC, Tighe PJ (2022) Fairness in the prediction of acute postoperative pain using machine learning models. Front Digit Health 4:970281. [DOI] [PMC free article] [PubMed] [Google Scholar]
- 26.Paulus JK, Kent DM (2020) Predictably unequal: understanding and addressing concerns that algorithmic clinical prediction may increase health disparities. NPJ Digit Med 3:99. [DOI] [PMC free article] [PubMed] [Google Scholar]
- 27.Vyas DA, Eisenstein LG, Jones DS (2020) Hidden in plain sight—reconsidering the use of race correction in clinical algorithms. N Engl J Med 383(9):874–882 [DOI] [PubMed] [Google Scholar]
- 28.McCradden MD, Joshi S, Mazwi M, Anderson JA (2020) Ethical limitations of algorithmic fairness solutions in health care machine learning. Lancet Digit Health 2(5):e221–e223 [DOI] [PubMed] [Google Scholar]
- 29.Dressel J, Farid H (2018) The accuracy, fairness, and limits of predicting recidivism. Sci Adv 4(1):eaao5580. [DOI] [PMC free article] [PubMed] [Google Scholar]
- 30.Paulus JK, Kent DM (2017) Race and ethnicity: a part of the equation for personalized clinical decision making? Circ Cardiovasc Qual Outcomes 10(7):e003823. [DOI] [PMC free article] [PubMed] [Google Scholar]
- 31.Kang DW, Zhou S, Torres R, Chowdhury A, Niranjan S, Rogers A, Shen C (2024) Predicting serious postoperative complications and evaluating racial fairness in machine learning algorithms for metabolic and bariatric surgery. Surg Obes Relat Dis 20(11):1056–1064 [DOI] [PubMed] [Google Scholar]
- 32.Chen RJ, Wang JJ, Williamson DFK, Chen TY, Lipkova J, Lu MY, Sahai S, Mahmood F (2023) Algorithmic fairness in artificial intelligence for medicine and healthcare. Nat Biomed Eng 7(6):719–742 [DOI] [PMC free article] [PubMed] [Google Scholar]
- 33.Fong N, Langnas E, Law T, Reddy M, Lipnick M, Pirracchio R (2023) Availability of information needed to evaluate algorithmic fairness—a systematic review of publicly accessible critical care databases. Anaesth Crit Care Pain Med 42(5):101248. [DOI] [PubMed] [Google Scholar]
Associated Data
This section collects any data citations, data availability statements, or supplementary materials included in this article.