

Abstract
Clinical diagnosis of syndromes benefits strongly from objective facial phenotyping. This study introduces a novel approach to enhance clinical diagnosis through the development and exploration of a low-dimensional metric space referred to as the clinical face phenotypic space (CFPS). As a facial matching tool for clinical genetics, such CFPS can enhance clinical diagnosis. It helps to interpret facial dysmorphisms of a subject by placing them within the space of known dysmorphisms. In this paper, a triplet loss-based autoencoder developed by geometric deep learning (GDL) is trained using multi-task learning, which combines supervised and unsupervised learning approaches. Experiments are designed to illustrate the following properties of CFPSs that can aid clinicians in narrowing down their search space: a CFPS can 1) classify syndromes accurately, 2) generalize to novel syndromes, and 3) preserve the relatedness of genetic diseases, meaning that clusters of phenotypically similar disorders reflect functional relationships between genes. The proposed model consists of three main components: an encoder based on GDL optimizing distances between groups of individuals in the CFPS, a decoder enhancing classification by reconstructing faces, and a singular value decomposition layer maintaining orthogonality and optimal variance distribution across dimensions. This allows for the selection of an optimal number of CFPS dimensions as well as improving the classification capacity of the CFPS, which outperforms the linear metric learning baseline in both syndrome classification and generalization to novel syndromes. We further proved the usefulness of each component of the proposed framework, highlighting their individual impact. From a clinical perspective, the unique combination of these properties in a single CFPS results in a powerful tool that can be incorporated into current clinical practices to assess facial dysmorphism.
INDEX TERMS: 3D shape analysis, clinical genetics, computer-aided diagnosis, deep phenotyping, geometric deep learning, precision public health
I. INTRODUCTION
Human genetic syndromes are rare and diverse and thus, diagnosing them can be a challenging and complex process [1]. Changes in the anatomical structure of the craniofacial region are common in patients with genetic diseases, affecting between 30 and 40% of the patients with this type of condition [2], meaning that a preliminary diagnosis can be performed by analyzing the patient’s facial phenotypical clues. However, this task presents complexities and challenges. First, the spectrum of possible conditions is wide. While some have highly distinguishable facial traits, others share identical or have only subtle dysmorphic clues, which can lead to an incorrect diagnosis. Additionally, individuals may exhibit varying levels of severity, leading to differences in their observable characteristics [3]. Lastly, other causes of facial variation such as differences in age, ethnicity or familial phenotypes further complicate the dysmorphological assessment [4]. Taking an individual’s ethnic background and familial facial features into account is necessary to reliably detect and recognize outlier phenotypes, but this can be challenging even for experienced clinicians [5]. Overall, the broad spectrum of possible conditions and high phenotypic variability result in subjective diagnoses, which are highly dependent on the clinician’s level of expertise [6].
To combat these issues, deep learning (DL) approaches have been proposed for the syndrome classification task based on facial phenotypical clues. DL models are known for their ability to learn complex tasks. In the case of genetic syndrome classification, they also provide a more objective way of performing the diagnosis [6], removing the subjectivity imposed by the clinician’s level of expertise. While it has already been shown that artificial intelligence (AI) systems can outperform clinicians by a large margin in the syndrome classification task [7], these models are not flawless. As such, the final diagnosis can benefit from the combined use of clinicians’ expertise and AI tools that efficiently narrow down the disease spectrum that the clinician has to analyze [7], facilitating their task.
A pivotal advancement in the study of genetic syndromes was the introduction of the Clinical Face Phenotype Space (CFPS) by Ferry et al. [8]. Utilizing metric learning techniques, CFPS models facial dysmorphisms in a lower-dimensional latent space, offering a novel approach to understanding these complex syndromes. The CFPS is characterized by three main properties. Firstly, it quantifies phenotypic similarity, grouping patients’ faces based on diagnostically relevant features. Secondly, its ability to generalize allows it to encapsulate dysmorphic syndromes beyond those used in its initial training, making it a versatile tool for exploring and categorizing both known and novel syndromes [9]. Lastly, it reflects the underlying genetic relationships by grouping phenotypically similar disorders, thereby mirroring the functional relationships among their genes [9]. This space not only facilitates rapid comparative analysis among individuals but also aids in proposing hypothetical clinical and molecular diagnoses, thereby streamlining genome wide NGS analyses and guiding targeted sequencing in clinical diagnostics [10].
However, constructing a CFPS is not without challenges. The overlapping features of different syndromes, as well as the significant phenotypic variation within each syndrome, make it difficult to encode facial shapes accurately [11], [12], [13], [14], [15]. For instance, hypertelorism is a feature shared by both Apert and Wolf-Hirschhorn syndromes [16], [17]. To address these challenges, our proposed model incorporates a supervised metric learner based on a triplet loss function. This component is designed to optimize the CFPS by learning to discriminate between groups while recognizing within-group similarities.
Yet, focusing solely on discriminatory aspects may over-look general facial topology. To counter this, we integrate unsupervised dimensionality reduction techniques, such as autoencoders, with the metric learning encoder. This combination aims to preserve facial topology within the CFPS, ensuring that it captures both diagnostically relevant features and general facial variations. This dual approach allows the model to effectively represent both specific syndromic features and more general patient-to-patient variations, essential for encoding patients with unseen syndromes.
Moreover, our model’s decoder is capable of reconstructing a face from a sampled embedding in the CFPS. However, without a structured approach during the training of this encoder-decoder, reliable sampling from the latent space remains a challenge. To enhance this capability, we introduce a third component: a singular value decomposition (SVD) layer. This layer, first proposed by Nauwelaers et al. [18], imposes orthogonality and optimizes variance distribution across the dimensions of the latent space, enhancing the model’s ability to handle non-linearity and an easier determination of dimensionality.
It should be highlighted that the unique combination of syndrome classification, facial reconstruction and generalizability to novel faces can result in a very powerful tool from a clinical perspective. Including these properties in a single system leads to the centralization of very important capabilities, such as suggesting possible diagnoses, lump or split individuals based on facial (dis)similarity, and providing insight into what facial features are remarkable, considering the different sources and patterns of background facial variation. As these three properties are incorporated into the proposed algorithm, we expect it to be recognized as a powerful diagnosis tool to help clinicians in their decision-making process.
II. STATE-OF-THE-ART
When dealing with facial images of patients that can present a genetic syndrome, three types of classification are possible [2]. In syndromic vs asyndromic classification [19], the goal is to identify whether the patient has a genetic condition or not. In one vs all classification [6], [20], [21], a certain condition is fixed and the patient is classified as having it or not, resulting in a binary classification task. In these circumstances, the unaffected class may incorporate both syndromic and asyndromic patients. Finally, in multiclass classification [1], [2], [19], [20], [21], [22], a diagnosis between a group of possible syndromes is chosen. Depending on the established goal, the asyndromic label may be considered or not.
A. SYNDROMIC VS ASYNDROMIC CLASSIFICATION
Although interesting, the study of syndromic vs asyndromic classification has not been widely addressed by the DL community. However, Hallgrimsson et al. [19] analyzed syndromic vs asyndromic classification of a parametric model on 3D facial images, achieving 86.7% and 72% accuracy for asyndromic and syndromic patients, respectively. To the extent of our knowledge, no such analysis has been performed using DL models.
B. ONE VS ALL CLASSIFICATION
When DeepGestalt [20], one of the most effective models for multiclass syndrome classification, was first proposed, its performance was also examined in one vs all classification. DeepGestalt is constituted of several deep convolutional neural networks (DCNNs), each of which is responsible for analyzing a different facial crop of the 2D input image and producing a softmax vector with the considered classes’ probabilities. The vectors of all the DCNNs are then considered together to obtain a final ranked list of the considered genetic syndromes (top- classification) or, in the case of one vs all classification, the predicted label for the input image. Due to the low amount of data available to train this model, the authors trained the DCNNs on the face recognition task, for which extensive data is available. Then, their last layers were substituted by output layers with sizes corresponding to the considered number of classes and fine-tuning was performed on the much smaller genetic syndrome dataset. Gurovich et al. [20] performed two different experiments using DeepGestalt to identify patients with Cornelia de Lange syndrome and Angelman syndrome. While this method achieved competitive results, outperforming the considered state-of-the-art (SOTA) references, the considered test sets were extremely small, raising some doubts regarding the obtained results’ generalization to the clinical context. To overcome this gap, experiments with bigger datasets should be conducted.
Mahdi et al. [21] considered 14 classes (13 syndromes and controls). The proposed framework consists of a set of geometric encoders based on spiral convolutions and trained with a triplet-based loss. Each of them receives as input a specific segment of the 3D mesh corresponding to a face and represents it in a metric space with lower dimensionality. The resultant embeddings are then concatenated and LDA is used to determine the predicted label. Apart from multiclass classification, one vs all classification was also performed by training different sets of encoders for each of the considered labels. The performance improved for most syndromes when compared with the multiclass framework, which is not unexpected, as each classifier is more focused on a specific syndrome and, thus, learns better its specific features. However, the verified improvements were of only a few percentual points in the majority of the analyzed scenarios, which does not justify the utilization of an approach that requires having a network trained for each syndrome, thus increasing the training time and memory consumption.
C. MULTICLASS CLASSIFICATION
While multiclass classification is the most challenging task, performing it can highly reduce the memory cost associated with syndrome classification systems, as performing one vs all classification requires the usage of a different model for each of the considered labels. The complexity of multiclass classification is determined by several factors, including the number of considered classes and the set of possible labels, as distinguishing between conditions with similar phenotypic traits is harder than between syndromes with high phenotypic separability.
Kumov et al. [2] performed the classification for 8 syndromes, without considering control patients, on both 2D images and 3D projections generated from 2D frontal images. When comparing different classification methods, LDA presented the highest performance in both scenarios. Besides, the usage of PCA before LDA proved to be beneficial both when geometric and DL-extracted features were considered. While geometric features benefited mostly from PCA when 99% of the variation was maintained, DL-extracted features’ best performance was achieved when only 95% of the variation was maintained, proving the importance of dimensionality reduction techniques to mitigate the amount of noisy information of the features used to perform syndrome classification.
Apart from one vs all classification, DeepGestalt’s [20] main purpose was performing multiclass classification. In this scenario, the model was trained to distinguish between 216 syndromes by changing the last layers of the DCNNs trained on the face recognition task by output layers with 216 values, which were then fine-tuned on the genetic syndrome dataset. When such a great amount of classes is considered, the top-1 accuracy of the system might underestimate its value. While this metric’s value may not be as high as desired, any help that the system provides in ranking the syndromes can be extremely useful. By considering the top- accuracy instead, a list of the more probable syndromes can be presented to the clinician, highly narrowing down the analyzed syndrome spectrum. In this study, the top-10 accuracy was determined, achieving values over 89% for the two considered test datasets. Further developments of DeepGestalt led the company Facial Dysmorphology Novel Analysis (FDNA) to introduce Face2Gene, a mobile phone app for syndrome classification that is nowadays the most popular 2D classification tool among clinicians. Currently, the program allows the detection of about 300 syndromes and is backed by a training dataset with over 20,000 patients [21], [22]. Since clinicians can input patient faces for diagnosis, this training dataset is always growing, resulting in an effective DL-based tool with high contributions to the medical community in the field of genetic syndrome diagnosis [23].
Hsieh et al. [22] overcame some of the limitations associated with DeepGestalt by removing its classification layer and projecting the extracted embeddings into a 320-D CFPS. This model was trained on the 299 syndromes that can be identified using DeepGestalt. The obtained latent space was then used to perform syndrome classification using a KNN approach based on cosine similarity. While DeepGestalt cannot be applied to syndromes not present in its training set without model retraining, the proposed architecture, named GestaltMatcher, can be applied to any syndrome, regardless of its presence in the original training set. Besides, the usage of a CFPS allows GestaltMatcher to quantify the similarity between distinct patients, which can be useful not only to measure the phenotypical similarities of individuals with the same disorder but also to understand what facial clues distinguish different syndromes. Hence, while DeepGestalt was designed for diagnostic purposes, GestaltMatcher can also be used for research purposes. While the proposed method was not able to outperform DeepGestalt on the set of 299 frequent syndromes, its performance only decreased slightly when considering almost four times the number of original syndromes by including rare diseases not present in the original training set, proving this method’s capacity to performe syndrome clustering in the CFPS. Besides, GestaltMatcher performed better on syndromes that are easier to identify through phenotypic information according to human clinicians, proving that the obtained CPFS encodes relevant phenotypical features.
Hallgrimsson et al. [19] used 3D facial images to perform multiclass syndrome classification within 397 classes (396 syndromes and controls). The proposed DL model correctly classified 96% of the unaffected subjects, which is unsurprising as they constitute the majority of the training dataset. The affected subjects were classified with the correct syndrome for 48.8% of the samples, which is still remarkable taking into consideration the size of the considered syndrome spectrum. Regarding top-10 accuracy, the correct disease was listed for 87.2% of the syndromic subjects, highlighting the usefulness of this metric. While misclassifications mainly pointed to the unaffected label, excluding this label led to poorer performance in general, due to the high percentage of samples associated with this category. However, the models’ performance on syndromic patients increased since most of the previous misclassifications resulted from confusion with healthy individuals. These results indicate that a strategy coupling syndromic vs asyndromic classification and syndrome classification without the control label could result in a globally improved performance. While requiring training two different models, thus increasing the computational complexity and memory costs associated with the developed framework, these disadvantages might be surpassed if the global performance on syndromic samples increases significantly, revealing a research direction that is worth exploring.
Bannister et al. [1] trained an interpretable architecture on 48 classes (47 syndromes and controls). In clinical scenarios, interpretability is of the utmost importance, since clinicians are not comfortable with using black-box models as reference tools for their decisions. To improve interpretability, the proposed model takes into consideration not only the input image and the syndrome label but also sex and age information. The capacity to learn these demographic characteristics is relevant since distinct syndromes affect men and women of different age ranges in different ways, allowing the model to better understand important factors such as the sex prevalence of each genetic syndrome. Besides, interpretability is also boosted by using an invertible model that can generate facial images, allowing it to answer questions such as why a certain patient was classified as having a syndrome instead of another. This allows the clinicians to analyze the machine’s way of thinking and rethink their initial diagnosis accordingly. The proposed model reached 71% accuracy on the multiclass classification task. However, unaffected subjects were correctly identified 92% of the time, meaning that several syndromes were associated with low accuracies.
Mahdi et al. [21] also used the framework mentioned in the previous section to perform syndrome classification. In this case, only one set of encoders (one for each segment) was trained to generate the final prediction. This approach outperformed the considered baseline (PCA followed by LDA) in all the analyzed situations while presenting a novel contribution to model interpretability in the area of syndrome classification, as it allowed for the analysis of the relevance of the considered facial segments to the final classification of each sample.
III. MATERIALS AND METHODS
A. DATA
The 3D facial images utilized in this project were sourced from three primary collections:
The FaceBase repository,1 specifically the project “Developing 3D Craniofacial Morphometry Data and Tools to Transform Dysmorphology, FB00000861”. These images were collected from patient support groups in the USA, Canada, and the UK [19], [24].
The Health Department of Western Australia. This dataset comprises images collected between 2009 and 2018, primarily through Genetic Services of Western Australia and additionally at Australian hospitals and patient support groups [25].
The legacy 3D dysmorphology dataset of Peter Hammond, hosted at KU Leuven, Belgium. This collection includes patients from support groups across the United States, UK, and Italy, spanning from 2002 to 2013. Diagnoses were reported by families and/or clinical geneticists [3].
From these sources, groups with a minimum of 10 individuals were selected for inclusion in the study. The distribution of the data is approximately 59%, 40%, and less than 1% from the first, second, and third sources, respectively. The dataset comprises 3,496 3D facial images, representing 52 different syndromes and a control group of 100 individuals unrelated to the patients with known genetic syndromes. Detailed demographic characteristics of the dataset are presented in Table 1.
TABLE 1.
Data demographics: Syndrome group name, sample size (N), mean and standard deviation of age (M±SD), the sex ratio (female/(male+female)), and the category.
| Name | Size | Age Range | Sex Ratio | Category | Name | Size | Age Range | Sex Ratio | Category |
|---|---|---|---|---|---|---|---|---|---|
| Williams | 221 | 17.57 ± 13.9 | 0.46 | A | BBS | 87 | 26.33 ± 14.78 | 0.48 | C |
| 22qll_2 Del | 180 | 10.74 ± 6.03 | 0.49 | A | Neurofibromatosis | 85 | 20.18 ± 18.01 | 0.54 | C |
| Wolf Hirschhom | 155 | 11.03 ± 9.42 | 0.57 | A | Loeys Dietz | 84 | 25.38 ± 17.15 | 0.57 | C |
| Smith Magenis | 129 | 14.32 ± 9.09 | 0.55 | A | Joubert | 75 | 10.57 ± 8.58 | 0.48 | C |
| Down | 117 | 21.64 ± 11.14 | 0.49 | A | Ectodermal Dysplasia | 71 | 15.09 ± 15.32 | 0.28 | C |
| Prader Willi | 96 | 19.34 ± 13.24 | 0.51 | A | Rett | 70 | 13.32 ± 10.54 | 0.89 | C |
| Fragile X | 77 | 17.65 ± 12.56 | 0.3 | A | Cardiofaciocutaneous | 59 | 12.21 ± 8.55 | 0.53 | C |
| Achondroplasia | 70 | 22.62 ± 18.34 | 0.59 | A | Klinefelter | 57 | 22.91 ± 14.58 | 0 | C |
| Rubinstein Taybi | 63 | 13.54 ± 11.73 | 0.52 | A | Mucopolysaccharidosis | 57 | 21.51 ± 13.51 | 0.47 | C |
| Costello | 58 | 12.39 ± 9.24 | 0.66 | A | Alstrom | 52 | 21.28 ± 9.4 | 0.54 | C |
| Cohen | 33 | 18.27 ± 10.46 | 0.52 | A | Fibrodysplasia Ossificans Progressiva | 50 | 21.81 ± 12.37 | 0.56 | C |
| Pitt Hopkins | 29 | 8.53 ± 5.7 | 0.62 | A | Fabry | 48 | 32.37 ± 16.53 | 0.44 | C |
| Pallister Killian | 23 | 9.59 ± 7.19 | 0.26 | A | Sotos | 45 | 17.92 ± 12.22 | 0.49 | C |
| Crouzon | 22 | 10.22 ± 6.27 | 0.55 | A | Russell Silver | 44 | 10.18 ± 10.32 | 0.34 | C |
| Smith Lemli Opitz | 19 | 11.75 ± 7.05 | 0.32 | A | Cockayne | 41 | 12.15 ± 7.37 | 0.44 | C |
| Apert | 13 | 14.55 ± 10.73 | 0.62 | A | Pseudoachondroplasia | 35 | 28.06 ± 20.53 | 0.51 | C |
| Coffin Lowry | 12 | 13.76 ± 9.16 | 0.08 | A | Osteogenesis Imperfecta | 31 | 16.72 ± 14.61 | 0.68 | C |
| Cornelia de Lange | 183 | 12.1 ± 9.14 | 0.54 | B | lp36 Del | 29 | 8.82 ± 7.83 | 0.62 | C |
| Noonan | 155 | 14.06 ± 12.51 | 0.45 | B | Trisomy 18 | 27 | 8.79 ± 8.71 | 0.85 | C |
| Angelman | 106 | 9.97 ± 7.57 | 0.47 | B | Beckwith Wiedemann | 26 | 9.68 ± 6.66 | 0.42 | C |
| Stickler | 45 | 22.31 ± 17.45 | 0.62 | B | FED CLP | 20 | 23.24 ± 17.71 | 0.65 | C |
| Treacher Collins | 39 | 18.48 ± 13.5 | 0.49 | B | Vander Woude | 16 | 10.16 ± 4.75 | 0.56 | C |
| Kabuki | 37 | 12.09 ± 6.62 | 0.65 | B | Goltz | 14 | 9.4 ± 5.03 | 0.86 | C |
| Coffin Siris | 16 | 12.08 ± 9.65 | 0.63 | B | Rhizo Chondro Punct | 13 | 7.57 ± 5.53 | 0.69 | C |
| 5p Del Cri du Chat | 96 | 14.62 ± 12.91 | 0.58 | C | Zellweger Syndrome | 11 | 7.33 ± 9.49 | 0.09 | C |
| Marfan | 153 | 26.34 ± 16.85 | 0.58 | C | Controls | 100 | 30.94 ± 11.64 | 0.72 | CONTROL |
| Turner | 102 | 24.25 ± 19.03 | 0.98 | C |
Based on clinical assessment of the available images, two clinical experts (co-authors HP and MV) categorized the syndromic groups into three categories:
Genetic conditions diagnosable by typical facial characteristics, which are genetically homogeneous (caused by a single gene or recurrent chromosomal anomaly).
Genetic conditions diagnosable by typical facial characteristics but genetically heterogeneous (multiple genes associated with the clinical condition).
Conditions usually not diagnosed based on facial features, where facial features are not typically characteristic of the condition.
For syndromes in categories A and B, facial features generally direct clinicians towards a molecular diagnosis. However, the genetic heterogeneity in category B can introduce variability in the phenotype-genotype correlation. Category C encompasses syndromes typically diagnosed based on clinical symptoms other than facial features. Although a distinctive facial gestalt is not a primary diagnostic criterion for these syndromes, it is not definitively absent.
This study received ethical approval from the ethical review board of KU Leuven and University Hospitals Gasthuisberg, Leuven (Approval Numbers: S56392, S60568).
B. PREPROCESSING
For pre-processing, after cleaning the raw image by removing hair and ears, a 3D face template was non-rigidly registered to each face using Meshmonk [26]. Each 3D face shape is therefore described as a manifold triangle mesh , where is a 8, 321 × 3 dimensional matrix, containing 8,321 3D vertices defining the mesh geometry, and are set of edges and faces which define the mesh topology. and are fixed since all our meshes have the same topology as the template.
C. PIPELINE DESIGN
This section outlines the design of our computational pipeline for learning a Clinical Face Phenotype Space (CFPS). Our approach begins with a baseline method using Linear Discriminant Analysis (LDA), a well-established supervised linear metric learner and classifier. Beyond this, we propose a more advanced, multi-component metric learner based on geometric deep models, comprising the following elements:
A triplet-loss encoder, which is a supervised deep-metric learner. It consists of three identical encoder networks, trained with triplets of data including an anchor , a positive , and a negative sample . In each triplet, the anchor and positive samples belong to the same class, while the anchor and negative samples are from different classes. The network outputs lower-dimensional embeddings for each element of the triplet: .
A decoder that reconstructs the 3D facial meshes from these embeddings: .
An SVD layer to ensure orthogonal dimensions and optimal variance distribution across different CFPS dimensions.
These components are gradually integrated to form our Triplet-based Singular Geometric Autoencoder (TB-SGAE), which utilizes spiral-based geometric architectures. Figure 1 illustrates the main components of this model. In the following sections, we begin with a description of the baseline method. We then methodically detail each component, explaining their individual development and how they integrate to enhance the TB-SGAE, and lastly, we provide the details of our spiral-based geometric autoencoder architecture.
FIGURE 1.

The complete model consists of three main components: a triplet-based encoder, a singular value decomposition (SVD) layer, and a decoder. Projection function for geometric model (alternatively for baseline) projects a facial mesh f into a facial embedding in the CFPS. A facial mesh is reconstructed from the embedding e with decoding function . Note that the reconstruction is not possible within the baseline and TB-GAE. Classification from the embedding space into syndrome groups is performed by a classification function g, which in this work constitutes a balanced K-nearest-neighbor classifier.
1). CFPS BASED ON LINEAR DISCRIMINANT ANALYSIS (LDA)
Linear Discriminant Analysis (LDA) is utilized to maximize the between-class scatter while minimizing the within-class scatter for facial data. Due to the high dimensionality of our densely sampled meshes, we applied Principal Component Analysis (PCA) to reduce dimensions and mitigate overfitting in LDA. The first 100 dimensions, preserving 99.16% of data variation, were then used for LDA. We constructed the lower-dimensional space projection using Fisher’s criterion , where is the projection matrix. The projected embedding for a facial shape in CFPS is calculated as:
| (1) |
The maximum number of dimensions for LDA was set to the number of classes minus one (52).
2). TRIPLET-BASED GEOMETRIC ENCODER (TB-GE)
Our Triplet-Based Geometric Encoder (TB-GE) employs spiral convolutional operators for mapping 3D facial meshes to a CFPS. It ensures that the feature representations of patients within the same syndrome group are positioned closer compared to those from different groups. The encoder, denoted as , maps an input mesh to a low-dimensional embedding in CFPS:
| (2) |
The triplet-loss function for training the TB-GE is defined as:
| (3) |
where is the margin between positive and negative samples, set to 0.2 as per Schroff et al. [27].
3). GEOMETRIC DECODER
The geometric decoder (GD) function reconstructs a facial mesh from an embedding :
| (4) |
The Triplet-Based Geometric Autoencoder (TB-GAE) is formulated as:
| (5) |
The reconstruction loss for 3D facial shapes is the mean absolute error between vertices of the input shape and the reconstructed output , averaged over the dataset:
| (6) |
The final loss function for training the TB-GAE combines reconstruction and triplet losses:
| (7) |
where balances the two loss components and is set to 0.1 to ensure equal contribution of both losses.
4). SVD LAYER: DECORRELATION OF CFPS DIMENSIONS
To achieve orthogonal dimensions in CFPS, Singular Value Decomposition (SVD) is applied to the embeddings set . Here, is a diagonal matrix of singular values, and contain left and right singular vectors, respectively. The projection function is defined as:
| (8) |
The decoder and autoencoder functions, incorporating the SVD layer, are redefined as:
| (9) |
| (10) |
This SVD layer aids in selecting the optimal number of dimensions for CFPS, enhancing the model’s capacity for face reconstruction.
5). SPIRAL-BASED ARCHITECTURE
We used geometric deep learning to learn directly from the 3D facial meshes and efficiently leverage the underlying geometry by using spiral convolution operators [28]. The architecture of our geometric autoencoder is illustrated in Fig. 2. The spiral convolutional (Sconv) layer in this figure consists of first, convolving spirals on vertices of the mesh in the current layer, and second, down or up-sampling the current mesh to obtain input for the next layer. Each Sconv layer is followed by an exponential linear unit (ELU). A spiral convolution is a filter consisting of learned weights , which is applied to a sequence of neighborhood vertices. That means,
| (11) |
where is the input representation of vertex , the output representation, and the -th neighbor of in the spiral [29]. The sequence was defined as a spiral around a central vertex, starting in an arbitrary direction and then proceeding in a counterclockwise direction until a fixed length was reached. In a geometric encoder based on spiral convolutions, aside from the convolution operator, a pooling operator for meshes must be incorporated. Established mesh decimation techniques used in many geometric deep learning methods reduce the number of vertices such that a good approximation of the original shape remains, but they result in irregularly sampled meshes at different steps of resolution. In contrast, we used a 3D mesh down and up-sampling scheme that retains the property of equidistant mesh sampling as defined in [30]. Starting from five initial points, the refinement is done with loop subdivision by splitting each triangular face of the mesh into four smaller triangles by connecting the midpoints of the edges. The last up-sampled mesh has 8,321 vertices and an average resolution of 2 mm, meaning that the average edge length is 2mm. For our geometric encoder, the five highest levels of resolution (shown in Fig. 2) are kept, and their output is passed through the fully connected layers of our encoder. In-house experiments showed that other sampling schemes are equally effective and can be used instead. The number of spirals in each layer was chosen empirically based on the previous and related works [30], as well as in other in-house projects where similar facial data structures are used. The length of the spiral filters was set to 19 for the first two layers with the highest resolution, and a length of 6 was chosen for the following layers with lower resolution. These choices were made such that for higher resolution meshes two-ring neighbors (=19 vertices) and for lower resolution meshes one-ring neighbors (=6 vertices) are covered by a spiral filter. Larger spiral lengths were initially tested for the first layers in a geometric autoencoder and no significant improvement in reconstruction performance was observed. A shorter spiral length, covering one-ring neighbors (9 vertices), was also tested for the first layers, and the difference in performance was not significant. Therefore, to decrease the computation cost, one can choose a spiral length of nine over 16. Since we have a fixed topology enforced on all faces, the spirals were determined only once, on the template mesh.
FIGURE 2.

The architecture of a singular geometric autoencoder (SGAE) with a singular value decomposition (SVD) layer. contains right singular vectors of the SVD. Once trained, the geometric encoder constitutes the projection function , and the geometric decoder constitutes the decoding function .
6). CLASSIFICATION
In this study, we performed a one vs all classification of syndromes, where a specific syndrome is preselected, and patients are classified as either having or not having that condition, constituting a binary classification or a syndrome identification task [6], [20], [21]. We also conducted a syndrome identification task, answering the question: Given a patient, which syndrome class is most likely? To do this, a multiclass classification was implemented using a balanced K-nearest neighbor (KNN) classifier with . This classifier was employed on the projection of individual profiles into the CFPSs, derived from the DL models (TB-SGAE, TB-GAE, and TB-SGE) and baseline (as per Equations 10 and 1).
The standard KNN algorithm calculates distances between a test image and all samples in the training set, selecting the K nearest neighbors to determine the most common label. A balanced KNN variant assigns varying weights to each training sample. This weighting counters the bias towards overrepresented classes in the dataset, similar to what was proposed by Tan et al. [31]. Specifically, the weight assigned to a sample is inversely related to the frequency of its class in the dataset, ensuring a more equitable representation of underrepresented classes in the prediction process:
| (12) |
where is the weight attributed to sample , is a group of samples from the same class (with ) and is the cardinality of . We set K=10 since it is the minimum group size in our dataset. While one vs all classification requires the usage of a different binary classifier for each class, multiclass classification can be performed with a single KNN classifier.
Utilizing our multiclass classification results, we extract the best-S predictions to generate top-S cumulative accuracy curves. This method refines the potential diagnoses spectrum, offering more precise outcomes compared to single-label classification. Additionally, it deepens the involvement of clinicians in the diagnostic process, thus enhancing their trust in these advanced classification tools.
7). TRAINING
All models were trained on an NVIDIA GeForce RTX 2080 Ti, 64 GB RAM, with PyTorch 1.1.0. The Adam optimizer was used for 600 epochs with a batch size of 30 (limited by the maximum GPU memory), an initial learning rate of 1e-3 chosen based on experiments ran for a range of (1e-1, 1e-8), and a decay rate of 0.99 was applied after each epoch.
The code used in this work will be made publicly available after acceptance of the manuscript.
D. EXPERIMENTS
The development of a Clinical Face Phenotype Space (CFPS) is based on the assumption that it provides a clinically meaningful and useful model for variation within and among classes. To validate this, we conducted four experiments, each examining different aspects of the CFPSs. The experiments assessed the complete network TB-SGAE against a baseline (PCA+LDA) and two network versions with specific components removed: TB-SGE (without the decoder) and TB-GAE (without the SVD layer).
Experiment one focused on evaluating and comparing the classification capacities of our CFPSs against a linear baseline using a 5-fold cross-validation method. In each fold, 20% of data per group was designated for testing, and the remaining 80% for training. We assessed classification performance using the top-S cumulative curves for syndrome identification using the multiclass classification, as well as sensitivity, specificity, and balanced accuracy of the one-vs-all classifier. Sensitivity measures the classifier’s ability to identify true positives, specificity assesses the identification of true negatives, and balanced accuracy averages the two. A paired two-tailed Wilcoxon signed rank test determined the statistical significance of these metrics, with distance scales of embeddings normalized for comparison.
We also explored how well categories A, B, and C correlated with the classification performance of our CFPS, aiming to determine if the space accurately reflects clinical knowledge of the syndrome groups. To also visually assess these, a 2D visualization of the CFPS was generated using the Uniform Manifold Approximation and Projection (UMAP) algorithm to provide visual feedback on the CFPS structure.
Furthermore, we expected that, in general, phenotypic characteristics being syndrome uniqueness (the median of distances between the average shape of a syndrome to all other average syndrome shapes), cohesion (the median shape distance, measured on landmarks, of all individuals in each group to the average shape of the group), and severity (the average shape distance between the subjects with a syndrome and the mean shape for controls [19]) should predict accuracy to a substantial degree, and this may also be impacted by sample size. Given the correlations among the phenotypic predictors, it is difficult to investigate their effects independently. To do so, predictors were combined into a single latent variable using a PLS regression of accuracy (in each space) onto the phenotypic predictors and sample size, with one latent component.
Experiment two investigated the ability to reconstruct faces from the CFPS using training and out-of-fold (OOF) error measurements. The training error, or reconstruction loss, gauged the model’s efficacy in capturing shape variation. The OOF error, calculated as the mean absolute error for test set samples, reflected the model’s performance with unseen data.
In Experiment three, we assessed the generalization capability in clustering syndrome groups not included in CFPS training. Six syndrome groups with distinct phenotypic features were omitted during training. Their post-training projection into the space was analyzed through the determination of the clustering improvement factor (CIF). CIF, which measures the clustering improvement over random distributions, was computed using the expected and observed ranks of the nearest positive matches. Comparisons were made between the complete model (TB-SGAE), the baseline (PCA+LDA), and an unsupervised linear approach (PCA).
Experiment four verified known relationships between specific syndrome groups within the CFPS. Here, we focused on Noonan, Costello, Cardiofaciocutaneous syndrome, and Neurofibromatosis Type I (NF1), known collectively as RASopathies. A p-value for the average distance between cluster centers of these groups was calculated against an empirical null distribution generated by randomly selecting four groups from the dataset 10000 times. We also show the positioning of RASopathies within the 2D UMAP visualization of the CFPS.
Through these experiments, we aim to rigorously evaluate the CFPS’s performance in various aspects, including classification performance, facial reconstruction, generalization to unseen data, and preserving the relatedness between syndromes, thus providing insights into the developed CFPS’s effectiveness and clinical utility.
IV. RESULTS
For the first experiment, Figure 3a demonstrates the syndrome identification capacity of the CFPS, in top-S accuracy curves obtained from multiclass classification. These metrics are derived in an individual-based manner, meaning that the average values are calculated across all the test samples. This figure is generated for in TB-SGAE, TB-GAE, TB-SGE, and the baseline. The DL methods outperformed the baseline across all values, with TB-SGAE showing the highest performance. A notable performance gap was observed at lower values, with a convergence trend in accuracy as increases. Figure 3b offers a detailed analysis for TB-SGAE, highlighting its effectiveness in identifying controls and varying accuracy across different syndrome categories, following clinical expectation, with convergence in accuracy for higher values.
FIGURE 3.

Experiment one - Classification Performances: (a) Individual-based top- accuracy plots for TB-SGAE, TB-GAE, TB-SGE, and the baseline ; (b) Individual-based top- accuracy plot for TB-SGAE () separated by categories (A, B, C, and controls); (c) Classification metrics based on a balanced KNN classifier with ; (d) The average group-level metrics for all groups in categories A, B, and C based on TB-SGAE.
In addition to the syndrome identification, Table 2 reports the average and the standard error of the one-vs-all classification measures over the five cross-validation folds. These results are based on the CFPS obtained by TB-SGAE, TB-GAE (SVD layer removed), TB-SGE (decoder removed), and the baseline (PCA+LDA). These metrics are again derived in an individual-based manner. In contrast, the distributions of metrics, averaged within each syndrome group over the five folds are shown using boxplots in Fig. 3c. These results are determined in a group-wise manner, meaning that they are based on the average metrics’ values for each syndrome class. The p-values of the statistical test comparing TB-SGAE and the baseline were 0.6078, 0.0499 and 4.02e-7 for sensitivity, balanced accuracy and specificity, respectively. According to the results, the performance of the TB-SGAE was significantly higher than the baseline (p-value <0.05) for all metrics, except for the sensitivity, where the statistical difference was not significant. Fig. 3c and Table 2 also compare TB-SGAE with TB-SGE and TB-GAE to investigate the contribution of the decoder and the SVD layer, respectively. The decoder significantly improved the classification measures. Removing the SVD layer significantly decreased all performance indicators.
TABLE 2.
Comparison of discriminating individual-based metrics computed by applying a balanced KNN classifier to the embeddings extracted by TB-SGAE, TB-SGE, TB-GAE and the linear baseline (PCA + LDA). The reported metrics are sensitivity, balanced accuracy and specificity. The best value achieved for each metric is in bold.
| Model | Sensitivity | Balanced Accuracy | Specificity |
|---|---|---|---|
| TB-SGAE | 0.8234 ± 0.1920 | 0.8725 ± 0.0918 | 0.9216 ± 0.0597 |
| TB-GAE | 0.8101 ± 0.2043 | 0.8652 ± 0.0988 | 0.9202 ± 0.0560 |
| TB-SGE | 0.8110 ± 0.2095 | 0.8655 ± 0.0993 | 0.9200 ± 0.0591 |
| BASELINE | 0.8223 ± 0.1721 | 0.8427 ± 0.0822 | 0.8630 ± 0.1146 |
Fig. 3d shows the distributions of TB-SGAE metrics, averaged within each syndrome group over the five folds, stratified by the clinical categorization (A, B, or C). Syndromes in categories A and B had a higher median sensitivity, balanced accuracy and specificity than those in category C. While category B showed slightly higher sensitivity and balanced accuracy values, A largely surpassed it in terms of specificity, which is consistent with clinical expectations behind the categorization of the syndromes.
Fig. 4b shows the 2D visualization of the CFPS obtained from TB-SGAE using the UMAP algorithm. The projection of individuals in the train set (larger dots) and test set (smaller dots) are colored by their categorization. The PLS regression of balanced accuracy onto phenotypic predictors and sample size is shown in Fig. 4a. The standardized coefficients of the linear combination and the regression of accuracy onto the derived latent variable are also shown. Accuracy in the CFPS of the TB-SGAE and TB-SGE is significantly predicted by the phenotypic measures and sample size, when compared to the baseline (PCA+LDA). This observation also underscores the significance of sample size effect in deep learning models compared to the linear method, encouraging the collection of additional data in future studies. In addition, it is noteworthy that cohesion appears to be a less robust predictor in TB-SGE compared to its predictive relevance in TB-SGAE. This suggests a potential relationship between the model’s face reconstruction capability and the utilization of cohesion as a predictive factor for facial shape variations within distinct groups.
FIGURE 4.

(a) PLS regression of accuracy onto phenotypic predictors and sample size. (b) 2D UMAP visualization of the trainset (smaller dots, and test set (larger dots) into the space, colored by categories. (c) Colored 2D UMAP visualization of the four RASopathies together with the rest of the trainset (smaller dots) and test set (larger dots) colored in black.
In experiment two, the training and OOF error of reconstruction for TB-SGAE were 0.1597 and 0.1705, respectively. Reconstruction error per vertex is shown in Fig. 5a. The error bar is scaled in millimeters. The average error per vertex was less than 1 mm. Nevertheless, the heatmaps indicate that regions around the mouth, nose, and eyes had relatively higher errors. The lips and mouth regions are sensitive to expression variation, introducing extra complexity for the model to learn. To visually assess the precision and smoothness of the reconstructions from the CFPS of the complete model, the average test-set projections can be reconstructed. Fig. 5b shows reconstructions for four groups of Achondroplasia, Wolf Hirschhorn, Apert and Williams from Category A syndromes.
FIGURE 5.
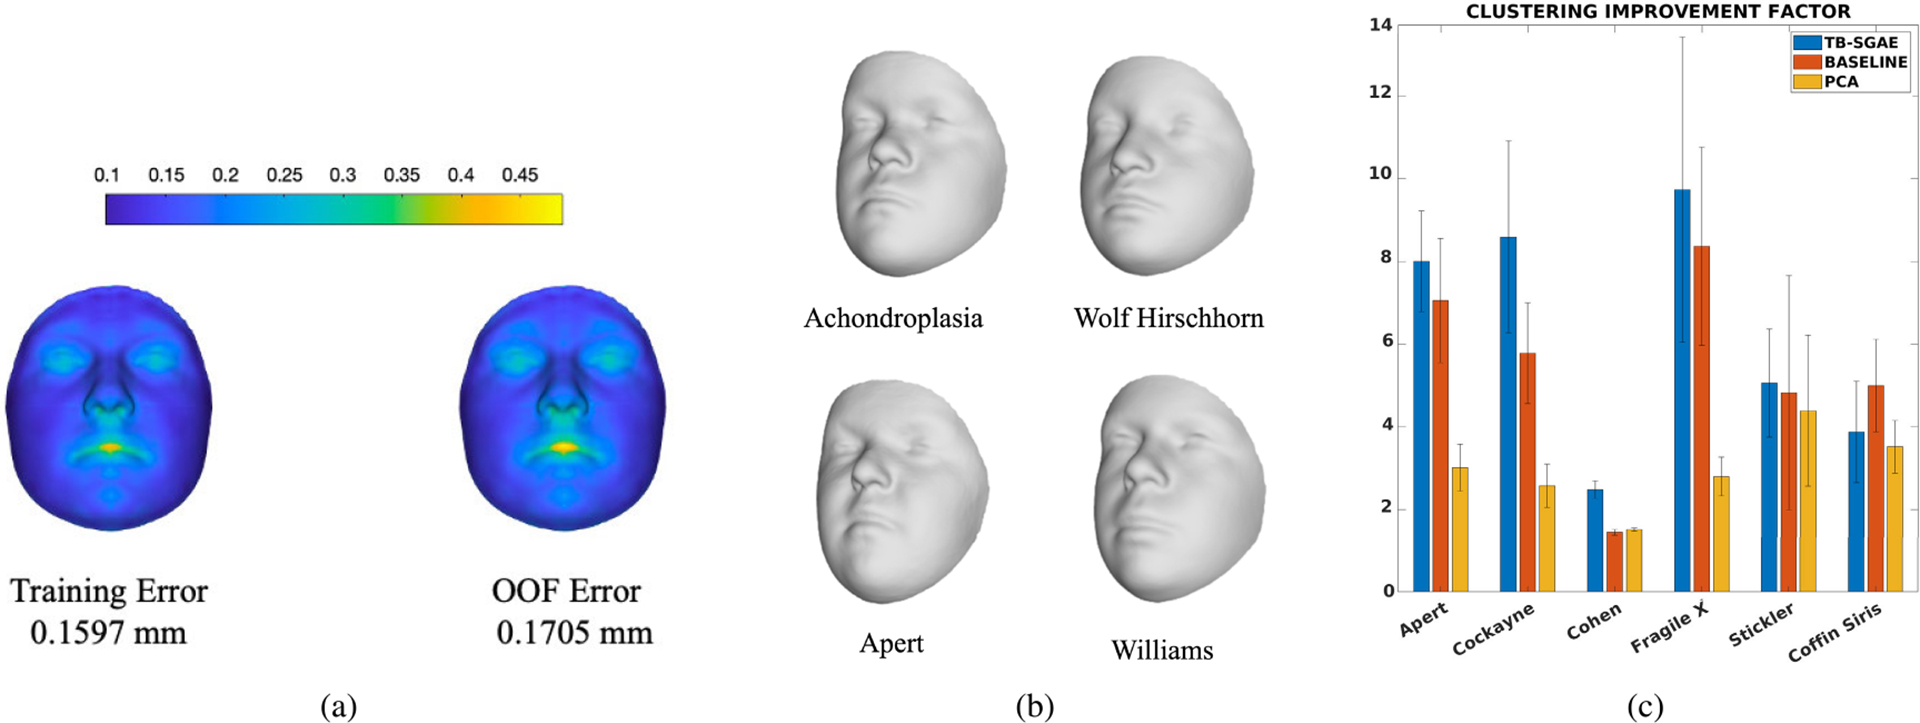
(a) The training error of reconstruction (left) and out-of-fold error of reconstruction (right); (b) The reconstruction of the average embedding of individuals with Achondroplasia, Wolf Hirschhorn, Apert, and Williams using the geometric decoder; (c) The comparison of the clustering improvement factor (CIF) for individuals in the six left-out groups of the generalization test (experiment 3), projected to the CFPSs obtained by TB-SGAE, PCA+LDA (baseline), and PCA. Error bars indicate the standard error of the mean over five folds.
The third experiment investigated the ability of the space to generalize to unseen syndromes. Six groups of syndromes were left out from the training set, and the CFPS was trained based on the 47 remaining groups. The unseen groups and the test set were merged and projected to the space. Based on these projections the CIF were computed. Fig. 5c shows the average results for TB-SGAE, the baseline (PCA+LDA) and PCA over five folds of data. The CIF was higher for five out of the six syndromes for TB-SGAE. The (unsupervised) space of principal components had a generalization power higher than a random performance, which indicates that unsupervised facial structure or similarity already improves the clustering of unseen syndromes. In addition, applying the LDA transformation to the PCA scores increased the CIF of all the syndrome groups but Cohen syndrome, which indicates that supervision further improves the clustering of unseen syndromes. Note that the maximum dimensionality of the LDA-based CFPS was bounded by the maximum number of classes in the training set minus one (i.e. 46 in this study). Therefore, we further investigated and compared the CIF results using a TB-SGAE space with 100 dimensions (used before and determined based on an SAE, see above) and 46 dimensions (equivalent to the LDA-based baseline), and observed no statistical difference (p=0.84). This is not entirely unexpected thanks to the SVD layer, which results in the most variance being coded in the lower components, making it easier to reduce dimensionality, with the minimum loss of data information.
For the last experiment, the UMAP plot in Fig. 4c shows the RASopathies grouped at the center of the UMAP, confirming these groups’ proximity in the CFPS. The statistical test also indicated that within the CFPSs based on TB-SGAE and the baseline (PCA+LDA), the average distance between testset RASopathies cluster centers in the normalized CFPSs was lower than 78.39% and 65.31% (respectively) of random selections of four groups of testset samples.
V. DISCUSSION
In this work, we build a CFPS that models the range of facial dysmorphism present in 52 syndromes alongside general facial variations from a group of controls. To this end, we proposed a triplet-based singular geometric autoencoder for multi-task learning, to simultaneously learn facial shape variation and reconstruction, in an unsupervised way, and group discriminations with the supervision of syndrome labels.
The existing CNNs for syndrome classification or building CFPSs are mostly based on large-scale 2D photographs of patients with genetic syndromes. By now, large-scale databases of 3D photographs of clinical populations have been collected. Considering the expected growth in the popularity and accessibility of portable 3D imaging hardware, building systems that apply to this imaging modality is essential to fully exploit the 3D shape information contained in such images. With the recently developed field of GDL, CNNs are now directly applicable to 3D images. This eliminates the need for any domain transformation. Therefore, in this work, we aimed to build a CFPS based on 3D facial images using spiral convolutional operators with which we facilitate both syndrome classification and facial reconstruction. Once learned, we evaluated the main properties of the CFPS, such as the classification of syndromes, generalization to novel syndromes, and the recapitulation of related genetic diseases. We also assessed the reconstruction precision from the CFPS and investigated the phenotypic shape predictors of the classification. We compared the performance of our space to a linear baseline which consists of PCA for dimensionality reduction and LDA, a linear metric learner. Similar work on 2D data [8] estimates the factor by which clustering is improved compared to random chance (CIF). Compared to such random performance, LDA is a much more difficult baseline to match or improve on. In fact, for statistical shape analysis, LDA and its regularized variants were and still are strong and popular methods that are also used and outperformed many other classifiers in the 3D syndrome classification published in [19].
Our proposed model consists of three main components. The first is a triplet-based encoder which was used in the recent syndrome classification work in [21] to optimize the distances among individuals belonging to different syndrome groups. In the triplet-loss function, the focus is on learning the CFPS such that the distances are a measure of similarity and group membership and therefore it contributes to the classification power of the space. The second component is a decoder that not only allows the reconstruction of a face from an embedding in a CFPS but also improves the classification performance of the system. The third component, being an SVD layer, makes it simpler to select the dimensionality of the space without retraining and also improves the classification, reconstruction, and generalization aspects of the CFPS
We showed that the CFPS built based on the complete model (TB-SGAE) outperforms the classification performances of the linear model which consists of PCA for dimensionality reduction and LDA for metric learning. More specifically, TB-SGAE presented the highest classification performance in all the considered metrics (being sensitivity, balanced accuracy and specificity in one-vs-all classification and the syndrome identification task assessed through top- accuracy in multiclass classification) when compared to all the tested models. This illustrates the usefulness of both the SVD layer (by comparison with TB-GAE) and the decoder (by comparison with TB-SGE). Although a direct comparison with the state-of-the-art 3D syndrome diagnosis in [19] is not available, the classification results are competitive.
Furthermore, we investigated whether the CFPS is inline with the expectations of clinicians. Experts in clinical genetics categorized syndromes into three classes. Two include syndromes that are phenotypically distinctive (A and B) and the third class of syndromes that are not necessarily phenotypically distinctive (C). Graphically, the UMAP visualization (Fig. 4b) shows that syndromes in categories A and B generate more isolated and clear clusters around the corners while category C groups show less clear cluster boundaries and are positioned close together around the center of the mapped embeddings. Category A and B are also more distant from controls than category C. This observation is in line with the high performance of Category A and B over category C in the syndrome identification test (Fig. 3b), as well as the one-vs-all classification performance (Fig. 3d).
With the ability to construct a face from an embedding, we can visualize and hence explain and understand the embeddings better. The decoder component facilitates the reconstruction of encoded facial shapes with less than 1 mm error. In addition, thanks to the orthonormal dimensions, we have a coordinate system in the space that properly spans every vector and thus allows us to explore and interpolate the space more structurally. In other words, one can manipulate one dimension without changing the values on other dimensions. This property of a vector basis or coordinate system is not available in a default autoencoder.
Furthermore, we evaluated the clustering generalization onto novel syndromes that have not been included in the training set. We computed and compared the CIF for the novel syndromes. This comparison shows that the clustering improves from a random chance for both baseline and TB-SGAE. Compared to the linear baseline, the improvement is stronger for five out of six novel syndromes within our CFPS. The comparison of the generalization power between the supervised linear metric learning approach (PCA+LDA) and that of the unsupervised and linear PCA shows that in five out of six left-out groups supervised learning improves the performance. The group that has superior performance with PCA (Cohen syndrome) is known to be clinically difficult to recognize from the face, and this observation suggests that the supervision of metric learning has less influence on groups that have little to no facial clues for diagnosis. It is also worth mentioning that the CIF obtained by PCA suggests that despite the unsupervised nature of this method, it still is powerful enough to improve the clustering factor considerably compared to random performance.
Finally, we tested for expected low distance among the four RASopathies, an etiologically related group of disorders caused by mutations in genes encoding the RAS/MAPK pathway. Results of the statistical test indicated that the four groups are close together in the CFPS of TB-SGAE. This test provided us with one piece of evidence towards the recapitulation of the relatedness in the CFPS, although it does not demonstrate any improvement of the deep metric learners over the linear baseline, in which our measure of this recapitulation was already close to the ceiling. When genetic data are available, more comprehensive tests, correlating measures of genetic similarity to phenotypic distance should be performed. For example, genetic similarity can be based on protein-to-protein interaction as per Ferry et al. [8] or distance based on patterns of DNA methylation [32].
From a clinical perspective, the unique combination of syndrome classification, facial reconstruction and generalizability to novel faces make the TB-SGAE CFPS a promising tool to assess facial dysmorphism. It can suggest possible diagnoses, lump or split individuals based on facial (dis)similarity, and provide insight into what facial features are remarkable, considering the different sources and patterns of background facial variation. Although further testing is required, we expect the TB-SGAE to further improve in the detection of outlier phenotypes as training datasets get larger and more ethnically diverse, incorporating additional sources and types of facial variation. A second improvement could result from incorporating familial facial shape data into the analysis, with the aim of better distinguishing between syndromic and familial facial variation. This would further align the TB-SGAE CFPS with the routine workflow in clinical genetics, where interpretation of clinical and genomic data in a trio design significantly improves the diagnostic yield [33].
Despite these strengths, we believe the TB-SGAE CFPS should not be used as a standalone diagnostic tool but rather as a complement to the current clinical practice. Genetic diagnoses may have a large psychosocial impact on patients and their families, especially in the presence of facial dysmorphism [34]. Sufficient caution, clinical experience and adequate genetic counseling are necessary when establishing and communicating genetic diagnoses. This is only possible when the objective phenotyping results are integrated with findings from a comprehensive clinical assessment and molecular investigations by experienced clinicians [35].
VI. CONCLUSION
In this work, we proposed a CFPS learner based on 3D facial images and GDL techniques for large-scale syndrome analysis. The proposed model consists of the base component being a geometric encoder, which is further expanded by our additional components being a geometric decoder, with which high-precision facial shapes are reconstructed from an embedding in the CFPS, and a singular value decomposition layer to encode a structured facial mesh into an orthonormal 100-dimensional CFPS. We used a multi-task learning approach to train the model in an end-to-end manner. The loss function combines the supervised triplet-loss function with the unsupervised reconstruction-loss. In summary, we showed that supervised and unsupervised learning strategies both improve the clustering factor compared to a random performance. Moreover, supervised learning leads to superior performance compared to unsupervised learning only. Lastly, the proposed GDL-based model learns a CFPS that outperforms the linear metric learning baseline (consisting of PCA and LDA), in both syndrome classification and generalization to novel syndromes. We proved the contribution of each added component in the classification and reconstruction capacity of the CFPS. More precisely, we showed that the attached decoder not only facilitated the ability to reconstruct patient faces and generate synthetic faces but also improved the classification performance of the model both in one vs all and multiclass frameworks. In addition, the orthonormal base of the CFPS facilitated by the SVD layer has considerably impacted the classification performance, both in one vs all and multiclass frameworks. We also showed that the space strongly replicates clinical expectations such that the classification measures obtained from the CFPS relate to the categorization of syndromes. Furthermore, the proximity of the four RASopathies, characterized by mutations in functionally related genes, is reflected in the CFPS.
The resulting CFPS can potentially narrow the search space for diagnosing new instances of the syndromes that it represents, objectively assess facial similarity between undiagnosed patients who share a rare and novel disorder, and facilitate targeted sequencing of genomic regions to identify causal variants.
Acknowledgments
This work was supported in part by the National Institutes of Health under Grant R01-DE027023, in part by the Research Fund Katholieke Universiteit (KU) Leuven under Grant BOF-C1 C14/20/081, and in part by the Research Program of the Research Foundation—Flanders (Belgium) [Fonds Wetenschappelijk Onderzoek (FWO)] under Grant G078518N and Grant G0D1923N.
Biographies

SOHA S. MAHDI received the master’s degree in AI from the Department of Computer Science, KU Leuven, Belgium, in 2017, and the Ph.D. degree in AI, focusing on computer-aided diagnosis from the Department of Electrical Engineering, KU Leuven, in 2022. She is currently an accomplished AI and ML Scientist and a research affiliate with the Department of Electrical Engineering, VUB Brussels. Her expertise centers on the clinical application of AI and ML technologies, aiming to enhance healthcare outcomes through innovative research.

EDUARDA CALDEIRA received the bachelor’s degree (Hons.) in bioengineering (biomedical engineering specialization) from the Faculty of Engineering, University of Porto, and the Biomedical Sciences Institute Abel Salazar, where she is currently pursuing the joint master’s degree in bioengineering with the Faculty of Engineering. She started her research journey, in 2022, and shifted toward biometrics topics, in 2023. Her work evolved into the study of deep neural networks’ compression techniques for face biometrics applications and resulted in applying a knowledge distillation strategy for face morphing detection. In Fall 2023, she was with the Medical Imaging Research Center, KU Leuven, as a part of her Erasmus+ project. As a Researcher with INESC TEC, she has received a scholarship to continue researching biometrics for the Spring 2024, under the scope of her master’s thesis.

HAROLD MATTHEWS received the Ph.D. degree from the Department of Pediatrics, University of Melbourne, Australia, in 2018. As a Postdoctoral Researcher with KU Leuven, he applies statistical shape analysis to 3-D meshes for assessing facial abnormality and understanding diseases affecting craniofacial development.

MICHIEL VANNESTE received the Graduate degree from the Medical School, KU Leuven, Belgium, in 2020, where he is currently pursuing the Ph.D. degree with the Laboratory for Genetic Epidemiology. He combines a residency in clinical genetics with UZ Leuven, Belgium. His research interest includes major-gene effects on facial variation in both health and disease.

NELE NAUWELAERS received the master’s degree in mathematical engineering from KU Leuven, in 2018, and the Ph.D. degree from the Medical Imaging Research Center, University Hospital, where she specialized in applying geometric deep learning techniques to 3D meshes. Her research interest includes encoding facial shapes in biologically meaningful ways. After completing the Ph.D. degree, she joined the Waste Recycling Technologies Team, Flemish Institute for Technological Research (VITO), as a Postdoctoral Researcher. At VITO, she continues to advance her expertise by applying deep learning algorithms for the characterization of solid waste streams and the data-driven modeling of waste separation processes, supporting the advancement toward a more circular economy.

MENG YUAN received the B.S. degree in applied mathematics from Dalian University of Technology, China, and the M.S. degree in statistics and the M.Eng. degree in artificial intelligence from KU Leuven, Belgium. She is currently pursuing the dual Ph.D. degree with the Medical Imaging Research Center and the Department of Human Genetics. Her research interest includes deep 3D phenotyping for complex morphological shapes in imaging genetics.

GIORGOS BOURITSAS received the M.Eng. degree in electrical and computer engineering from the National Technical University of Athens, in 2017, and the Ph.D. degree in computer science from the Imperial College London, in 2023, under the supervision of Prof. Michael Bronstein and Prof. Stefanos Zafeiriou. He is currently a Machine Learning Researcher and holds a postdoctoral fellow position with the Archimedes AI Unit/Athena Research Center, working within the group of Prof. Yannis Panagakis. Previously, he was a Research Scientist Intern with Google Deepmind, a Visiting Ph.D. Researcher with Ecole Polytechnique Federale de Lausanne, a Research Associate with NCSR Demokritos, and a Visiting Undergraduate Student Researcher with the Universitat Politecnica de Catalunya. He has conducted basic and applied research on topics in the intersection of machine learning with other scientific fields, such as computer vision, network science, and physics; and his work has been published in leading conferences (NeurIPS, CVPR, ICCV, and ECCV) and journals (IEEE Transactions on Pattern Analysis and Machine Intelligence).

GARETH S. BAYNAM received the Ph.D. degree in vaccine immunogenetics from The University of Western Australia. He is currently a Clinical Geneticist, a Genomic Policy Advisor, a Patient Advocate, a Clinician Scientist, and an Intrapreneur. He equitably implements innovations through multi-stakeholder partnerships. He directs, chairs, or is on the executive for international initiatives to improve the lives of children and youth living with genetic, rare, and undiagnosed diseases. He is currently the Chair of the Diagnostics Scientific Committee of the International Rare Diseases Research Consortium (IRDiRC). He has clinically led the state-wide implementation of genomic and phenotypic technologies, artificial intelligence and digital health platforms, and omics-associated policy. He initiated the Undiagnosed Diseases Program, WA—an interdisciplinary approach for the most challenging medical mysteries. He is also the Head of the Western Australian Registers for Birth Defects and Cerebral Palsy (Western Australian Register of Developmental Anomalies) and the Director of the Academy of Child and Adolescent Health. He is also a Clinical Professor or an Adjunct Associate Professor at multiple universities in WA, USA, and Victoria. He is also a Board Member of the Genetic and Rare Diseases Network, WA, USA, and a member of the Orphanet Australia National Advisory Body and the Rare Voices Australia Scientific and Medical Advisory Committee.

PETER HAMMOND was trained in mathematics with Oxford University and in computer science and artificial intelligence with the Imperial College London. His last posts in a 40 year career were a Professor in computational biology with the Institute of Child Health, UCL, and a Senior Fellow in medical image analysis with the Big Data Institute, Oxford University, analyzing neurofacial anatomy for use in epilepsy, medical genetics, and teratology. His recent visiting research posts were with the Department of Human Genetics, Leuven University, Belgium (2017–2021), and U.K. Centre for Ecology & Hydrology (2018–2020); and the latter arising from an interest in river pollution and using artificial intelligence to detect sewage spills.

RICHARD SPRITZ received the B.S. degree in zoology from the University of Wisconsin-Madison and the M.D. degree from The Pennsylvania State University. Previously, he was the Director of the Human Medical Genetics and Genomics Program. In 1970, he was a part of the team that characterized the first human genes and discovered the first human gene mutation, in beta-thalassemia. For over four decades, his laboratory studied the molecular basis of human genetic diseases, including mapping, discovery, and mutational and functional analysis of many different human disease genes. He has received numerous awards for his research and has over 280 publications, on many different topics relating to genetic disorders and birth defects. He was an Intern and a Resident in pediatrics with the Children’s Hospital of Philadelphia. He is currently an Emeritus Professor in pediatrics with the School of Medicine, University of Colorado. He is a fellow in human genetics with the Yale School of Medicine.

OPHIR D. KLEIN received the B.A. degree in Spanish literature from the University of California at Berkeley, Berkeley, and the Ph.D. degree in genetics and the M.D. degree from the Yale School of Medicine. He is currently a Professor in orofacial sciences and pediatrics, the Larry L. Hillblom Distinguished Professor in craniofacial anomalies, and the Charles J. Epstein Professor in human genetics with the University of California at San Francisco (UCSF). He is also the Director of the Institute for Human Genetics, the Chief of the Division of Medical Genetics, the Chair of the Division of Craniofacial Anomalies, and the Director of the Program in Craniofacial Biology. His research interests include understanding how organs form in the embryo and how they regenerate in the adult, with a particular emphasis on the processes underlying craniofacial and dental development and renewal and understanding how stem cells in the intestinal epithelium enable renewal and regeneration. He has received several honors, including a New Innovator Award from NIH and the E. Mead Johnson Award from the Society for Pediatric Research. He was elected to American Society for Clinical Investigation, American Association of Physicians, and the National Academy of Medicine. He is a fellow of American Association for the Advancement of Science.

MICHAEL BRONSTEIN received the Ph.D. degree from the Technion in 2007. He is the Deep Mind Professor of AI at the University of Oxford. He was previously the Head of Graph Learning Research at Twitter, a Professor at Imperial College London and held visiting appointments at Stanford, MIT, and Harvard. He has been affiliated with three Institutes for Advanced Study (at Harvard as a Radcliffe fellow from 2017 to 2018, at TUM as a Rudolf Diesel Fellow from 2017 to 2019, and at Princeton as a short-time scholar in 2020). He is the recipient of the EPSRC Turing AI World Leading Research Fellowship, Royal Society Wolfson Research Merit Award, Royal Academy of Engineering Silver Medal, five ERC grants, two Google Faculty Research Awards, and two Amazon AWS ML Research Awards. He is a Member of the Academia Europaea, Fellow of IEEE, IAPR, BCS, and ELLIS, ACM Distinguished Speaker, and World Economic Forum Young Scientist.

BENEDIKT HALLGRIMSSON received the B.A. degree (Hons.) from the University of Alberta and the M.A. and Ph.D. degrees in biological anthropology from The University of Chicago. He is currently an International Leader in the quantitative analysis of anatomical variation. He is also the Scientific Director of Basic Science with the Alberta Children’s Hospital Research Institute and the Head of the Department of Cell Biology and Anatomy. His work focuses on structural birth defects and the developmental genetics of complex traits. He integrates 3-D imaging and morphometry with genetics and developmental biology. He has published more than 150 journal articles, 32 chapters, three edited volumes, and a textbook. He is a fellow of the American Association for the Advancement of Science and the Canadian Academy of Health Sciences. He was awarded the Rohlf Medal for Excellence in Morphometrics, in 2015.

HILDE PEETERS received the master’s degree in genetic epidemiology from Netherlands Institute for Health Sciences. She was a Student Researcher with the Center for Human Genetics Leuven working in the field of quantitative genetics and twin studies during her medical training. Subsequently, she specialized in pediatrics and did a Ph.D. degree supported by the FWO within the core domains of human molecular genetics and developmental biology. She was granted an FWO Postdoctoral Fellowship to join the Research Group of Genetic Epidemiology and Statistical Genetics of Prof. C. Van Duijn in Rotterdam for two years. In 2010, she was appointed with an academic position with KU Leuven as a part-time Assistant Professor. The clinical duties accounted for a full-time position mainly on monogenic disorders with a focus on developmental disorders and dysmorpohology. She was granted a Senior Clinical Investigator Fellowship by the FWO for 50% research activities for the project of “Improving counseling for autism and neurodevelopmental disorders through gene mapping, risk variants, and advanced methods in diagnostics.” Furthermore, in line with her research and clinical interest, she became the Clinical Laboratory Supervisor for the Diagnostic Laboratory of Congenital and Developmental Disorders, University Hospitals Leuven. She has authored over 80 peer-reviewed journal publications, 122 conference proceedings, and two book chapters (H-index of 22).

PETER CLAES received the Graduate degree from the Department of Electrical Engineering (ESAT), KU Leuven, with a major in multimedia and signal processing, in 2002, and the Ph.D. degree in engineering from KU Leuven, in 2007. He continued into a postdoctoral research with the Melbourne Dental School, University of Melbourne, from 2007 to 2011. In 2018, he was a Visiting Scholar with the Biomedical Engineering Department, University of Oxford, U.K. Since 2014, he has been a Honorary Research Fellow with the Murdoch Children’s Research Institute, Melbourne, Australia. Since October 2019, he has been a Research Associate Professor in a joint appointment with the Department of ESAT-PSI and the Department of Human Genetics, KU Leuven.
Footnotes
This work involved human subjects or animals in its research. Approval of all ethical and experimental procedures and protocols was granted by the Ethical Review Board of KU Leuven and University Hospital Leuven under Application No. S60568.
REFERENCES
- [1].Bannister J, Wilms M, Aponte D, Katz D, Klein OD, Bernier FP, Spritz R, Hallgrimsson B, and Forkert ND, “A deep invertible 3-D facial shape model for interpretable genetic syndrome diagnosis,” IEEE J. Biomed. Health Informat, vol. 26, no. 7, pp. 3229–3239, Jul. 2022. [DOI] [PMC free article] [PubMed] [Google Scholar]
- [2].Kumov V and Samorodov A, “Recognition of genetic diseases based on combined feature extraction from 2D face images,” in Proc. 26th Conf. Open Innov. Assoc. (FRUCT), Yaroslavl, Russia, Apr. 2020, pp. 1–7. [Google Scholar]
- [3].Hammond P and Suttie M, “Large-scale objective phenotyping of 3D facial morphology,” Hum. Mutation, vol. 33, pp. 817–825, May 2012. [DOI] [PMC free article] [PubMed] [Google Scholar]
- [4].Richmond S, Howe LJ, Lewis SJ, Stergiakouli E, and Zhurov AI, “Facial genetics: A brief overview,” Frontiers Genet, vol. 9, p. 462, Oct. 2018. [DOI] [PMC free article] [PubMed] [Google Scholar]
- [5].Lumaka A, Cosemans N, Mampasi AL, Mubungu G, Mvuama N, Lubala TK, Mbuyi-Musanzayi S, Breckpot J, Holvoet M, Ravel TD, Buggenhout GV, Peeters H, Donnai D, Mutesa L, Verloès A, Lukusa-Tshilobo P, and Devriendt K, “Facial dysmorphism is influenced by ethnic background of the patient and of the evaluator,” Clin. Genet, vol. 92, no. 2, pp. 166–171, Dec. 2016. [DOI] [PubMed] [Google Scholar]
- [6].Thevenot J, López MB, and Hadid A, “A survey on computer vision for assistive medical diagnosis from faces,” IEEE J. Biomed. Health Informat, vol. 22, no. 5, pp. 1497–1511, Sep. 2018. [DOI] [PubMed] [Google Scholar]
- [7].Qiang J, Wu D, Du H, Zhu H, Chen S, and Pan H, “Review on facial-recognition-based applications in disease diagnosis,” Bioengineering, vol. 9, no. 7, p. 273, Jun. 2022. [DOI] [PMC free article] [PubMed] [Google Scholar]
- [8].Ferry Q, Steinberg J, Webber C, FitzPatrick DR, Ponting CP, Zisserman A, and Nellåker C, “Diagnostically relevant facial gestalt information from ordinary photos,” eLife, vol. 3, Jun. 2014, Art. no. e02020. [DOI] [PMC free article] [PubMed] [Google Scholar]
- [9].Marbach F et al. , “The discovery of a LEMD2-associated nuclear envelopathy with early progeroid appearance suggests advanced applications for AI-driven facial phenotyping,” Amer. J. Human Genet, vol. 104, no. 4, pp. 749–757, Apr. 2019. [DOI] [PMC free article] [PubMed] [Google Scholar]
- [10].Hsieh T et al. , “PEDIA: Prioritization of exome data by image analysis,” Genet. Med, vol. 21, no. 12, pp. 2807–2814, Jun. 2019. [DOI] [PMC free article] [PubMed] [Google Scholar]
- [11].Matthews H, Vanneste M, Katsura K, Aponte D, Patton M, Hammond P, Baynam G, Spritz R, Klein OD, Hallgrimsson B, Peeters H, and Claes P, “Refining nosology by modelling variation among facial phenotypes: The RASopathies,” J. Med. Genet, vol. 60, no. 3, pp. 285–293, Jul. 2022. [DOI] [PMC free article] [PubMed] [Google Scholar]
- [12].Oti M and Brunner H, “The modular nature of genetic diseases,” Clin. Genet, vol. 71, no. 1, pp. 1–11, Jan. 2007. [DOI] [PubMed] [Google Scholar]
- [13].Allanson JE, Bohring A, Dörr H, Dufke A, Gillessen-Kaesbach G, Horn D, König R, Kratz CP, Kutsche K, Pauli S, Raskin S, Rauch A, Turner A, Wieczorek D, and Zenker M, “The face of noonan syndrome: Does phenotype predict genotype,” Amer. J. Med. Genet. A, vol. 152, no. 8, pp. 1960–1966, Jul. 2010. [DOI] [PMC free article] [PubMed] [Google Scholar]
- [14].Hammond P, Suttie M, Hennekam RCM, Allanson J, Shore EM, and Kaplan FS, “The face signature of fibrodysplasia ossificans progressiva,” Amer. J. Med. Genet. A, vol. 158, no. 6, pp. 1368–1380, May 2012. [DOI] [PMC free article] [PubMed] [Google Scholar]
- [15].Kline AD et al. , “Diagnosis and management of cornelia de Lange syndrome: First international consensus statement,” Nature Rev. Genet, vol. 19, no. 10, pp. 649–666, Jul. 2018. [DOI] [PMC free article] [PubMed] [Google Scholar]
- [16].Kreiborg S and Cohen MM, “Ocular manifestations of Apert and Crouzon syndromes: Qualitative and quantitative findings,” J. Craniofacial Surg, vol. 21, no. 5, pp. 1354–1357, Sep. 2010. [DOI] [PubMed] [Google Scholar]
- [17].Dickmann A, Parrilla R, Salerni A, Savino G, Vasta I, Zollino M, Petroni S, and Zampino G, “Ocular manifestations in wolf-hirschhorn syndrome,” J. Amer. Assoc. Pediatric Ophthalmol. Strabismus, vol. 13, no. 3, pp. 264–267, Jun. 2009. [DOI] [PubMed] [Google Scholar]
- [18].Nauwelaers N, Matthews H, Fan Y, Croquet B, Hoskens H, Mahdi S, El Sergani A, Gong S, Xu T, Bronstein M, Marazita M, Weinberg S, and Claes P, “Exploring palatal and dental shape variation with 3D shape analysis and geometric deep learning,” Orthodontics Craniofacial Res, vol. 24, no. S2, pp. 134–143, Dec. 2021. [DOI] [PMC free article] [PubMed] [Google Scholar]
- [19].Hallgrímsson B et al. , “Automated syndrome diagnosis by three-dimensional facial imaging,” Genet. Med, vol. 22, no. 10, pp. 1682–1693, May 2020. [DOI] [PMC free article] [PubMed] [Google Scholar]
- [20].Gurovich Y, Hanani Y, Bar O, Nadav G, Fleischer N, Gelbman D, Basel-Salmon L, Krawitz PM, Kamphausen SB, Zenker M, Bird LM, and Gripp KW, “Identifying facial phenotypes of genetic disorders using deep learning,” Nature Med, vol. 25, no. 1, pp. 60–64, Jan. 2019. [DOI] [PubMed] [Google Scholar]
- [21].Mahdi SS, Matthews H, Nauwelaers N, Vanneste M, Gong S, Bouritsas G, Baynam GS, Hammond P, Spritz R, Klein OD, Hallgrímsson B, Peeters H, Bronstein M, and Claes P, “Multi-scale part-based syndrome classification of 3D facial images,” IEEE Access, vol. 10, pp. 23450–23462, 2022. [Google Scholar]
- [22].Hsieh TC et al. , “GestaltMatcher facilitates rare disease matching using facial phenotype descriptors,” Nat. Genet, vol. 54, no. 3, pp. 349–357, Mar. 2022, doi: 10.1038/s41588-021-01010-x. [DOI] [PMC free article] [PubMed] [Google Scholar]
- [23].Ross A, Banerjee S, and Chowdhury A, “Deducing health cues from biometric data,” Comput. Vis. Image Understand, vol. 221, Aug. 2022, Art. no. 103438. [Google Scholar]
- [24].Klein O, Mio W, Spritz R, and Hallgrimsson B, “Developing 3D craniofacial morphometry data and tools to transform dysmorphology,” NIH, NIDCR, Tech. Rep 1U01DE024440–01, 2019. [Online]. Available: https://grantome.com/grant/NIH/U01-DE024440-01 [Google Scholar]
- [25].Kung S, Walters M, Claes P, LeSouef P, Goldblatt J, Martin A, Balasubramaniam S, and Baynam G, “Monitoring of therapy for mucopolysaccharidosis type I using dysmorphometric facial phenotypic signatures,” in JIMD Reports, Volume 22, vol. 22, Zschocke J, Baumgartner M, Morava E, Patterson M, Rahman S, and Peters V, Eds., Berlin, Germany: Springer, 2015, pp. 99–106. [DOI] [PMC free article] [PubMed] [Google Scholar]
- [26].White JD, Ortega-Castrillón A, Matthews H, Zaidi AA, Ekrami O, Snyders J, Fan Y, Penington T, Van Dongen S, Shriver MD, and Claes P, “MeshMonk: Open-source large-scale intensive 3D phenotyping,” Sci. Rep, vol. 9, no. 1, p. 6085, Apr. 2019. [DOI] [PMC free article] [PubMed] [Google Scholar]
- [27].Schroff F, Kalenichenko D, and Philbin J, “FaceNet: A unified embedding for face recognition and clustering,” in Proc. IEEE Conf. Comput. Vis. Pattern Recognit. (CVPR), Boston, MA, USA, Jun. 2015, pp. 815–823. [Google Scholar]
- [28].Bronstein MM, Bruna J, LeCun Y, Szlam A, and Vandergheynst P, “Geometric deep learning: Going beyond Euclidean data,” IEEE Signal Process. Mag, vol. 34, no. 4, pp. 18–42, Jul. 2017. [Google Scholar]
- [29].Gong S, Chen L, Bronstein M, and Zafeiriou S, “SpiralNet++: A fast and highly efficient mesh convolution operator,” in Proc. IEEE/CVF Int. Conf. Comput. Vis. Workshop (ICCVW), Oct. 2019, pp. 4141–4148. [Google Scholar]
- [30].Mahdi SS, Nauwelaers N, Joris P, Bouritsas G, Gong S, Bokhnyak S, Walsh S, Shriver MD, Bronstein M, and Claes P, “3D facial matching by spiral convolutional metric learning and a biometric fusion-net of demographic properties,” in Proc. 25th Int. Conf. Pattern Recognit. (ICPR), Milan, Italy, Jan. 2021, pp. 1757–1764. [Google Scholar]
- [31].Tan S, “Neighbor-weighted K-nearest neighbor for unbalanced text corpus,” Exp. Syst. Appl, vol. 28, no. 4, pp. 667–671, May 2005. [Google Scholar]
- [32].Aref-Eshghi E et al. , “Evaluation of DNA methylation episignatures for diagnosis and phenotype correlations in 42 Mendelian neurodevelopmental disorders,” Amer. J. Hum. Genet, vol. 108, no. 6, pp. 1161–1163, Jun. 2021. [DOI] [PMC free article] [PubMed] [Google Scholar]
- [33].Lee H, Deignan JL, Dorrani N, Strom SP, Kantarci S, Quintero-Rivera F, Das K, Toy T, Harry B, Yourshaw M, and Fox M, “Clinical exome sequencing for genetic identification of rare Mendelian disorders,” Jama, vol. 312, no. 18, pp. 1880–1887, Oct. 2014. [DOI] [PMC free article] [PubMed] [Google Scholar]
- [34].Parens E and Appelbaum PS, “On what we have learned and still need to learn about the psychosocial impacts of genetic testing,” Hastings Center Rep, vol. 49, pp. 2–9, May 2019. [DOI] [PMC free article] [PubMed] [Google Scholar]
- [35].Kelly CJ, Karthikesalingam A, Suleyman M, Corrado G, and King D, “Key challenges for delivering clinical impact with artificial intelligence,” BMC Med, vol. 17, no. 1, pp. 1–9, Dec. 2019. [DOI] [PMC free article] [PubMed] [Google Scholar]