

Abstract
Decreased renal function is often a complication of hypertension. Although it has been suggested that the response of the kidney to hypertension has an underlying genetic component, there is limited information suggesting that specific genetic regions or candidate genes contribute to the variability in creatinine clearance, a commonly used measure of kidney function. As part of the Hypertension Genetic Epidemiology Network (HyperGEN) study, creatinine clearance measurements were assessed in a large biracial sample of hypertensive siblings (466 African American subjects and 634 white subjects in 215 and 265 sibships, respectively). All participants were hypertensive before the age of 60 years, and the mean age of the siblings was 52 years among the African American subjects and 61 years among the white subjects. Two residual models were created for creatinine clearance: a minimally adjusted model (which included age and age2) and a fully adjusted model (which included age, age2, lean body mass, pulse rate, pulse pressure, hormone-replacement therapy, educational status, and physical activity). Standardized residuals were calculated separately for men and women in both racial groups. The heritability of the residual creatinine clearance was 17% and 18% among the African American and white subjects, respectively. We conducted multipoint variance components linkage analysis using GENEHUNTER2 and 387 anonymous markers (Cooperative Human Linkage Center screening set 8). The best evidence for linkage in African American subjects was found on chromosome 3 (LOD = 3.61 at 214.6 cM, 3q27) with the fully adjusted model, and the best evidence in white subjects was found on chromosome 3 (LOD = 3.36 at 115.1 cM) with the minimally adjusted model. Positional candidate genes that are contained in and around the region on chromosome 3 (214.6 cM) that may contribute to renal function include enoyl-CoA hydratase/3-hydroxyacyl-CoA dehydrogenase (EHHADH) and apolipoprotein D (ApoD). These findings suggest there may be genetic regions related to the variability of creatinine clearance among hypertensive individuals.
Introduction
Although there is conflicting evidence on the role of the kidney in initiating hypertension in humans (Woolfson and de Wardener 1996), the kidney eventually becomes a target of the increased arterial pressure (Lindeman et al. 1984; Walker et al. 1992). Primary hypertension, that is, hypertension without known cause, is the most common cause of end-stage renal disease (ESRD) in the United States (Woolfson and de Wardener 1996). It has been reported that the rate of chronic renal failure may be as high as 20%–30% among individuals with untreated primary hypertension (Brown and Whithworth 1992), and there is strong evidence to suggest that, although treatment for hypertension has reduced the rates of myocardial infarction and stroke, it is not reducing the rate of ESRD (Seedat 1999; Jaimes et al. 1996). The precise mechanism of renal damage due to hypertension is unclear, but it appears that either a thickening of the glomerular vascular structure or a hyalinization and sclerosis of the walls of the preglomerular (afferent) arterioles may decrease the blood supply to the nephron, thereby leading to a decreased ability to concentrate urine (Porth 1994). The decreased ability to concentrate urine results in a decreased glomerular filtration rate (GFR) and, eventually, in ESRD. Hemodynamic alterations in the kidney are also reported to occur before the onset of hypertension (Lebel et al. 1991). Structural changes in the arteries in the kidney disturb the normal-pressure natriuresis, thereby raising blood pressure (BP). Therefore, renal disease is complex and may result from hypertension and/or lead to its development.
It has been suggested that some persons may be especially susceptible to renal damage due to hypertension (Cusi et al. 1993). There is evidence of a familial association of ESRD due to hypertension (Ferguson et al. 1988), suggesting a genetic component to this increased susceptibility although there is no evidence for linked chromosomal regions or candidate genes in humans. However, there is evidence for linkage, on chromosome 1, to hypertension-induced renal damage in rats that is consistent across strains of rats (Brown et al. 1996; St. Lezin et al. 1999).
There is mounting evidence that the rate of kidney disease due to hypertension is far greater in African Americans than in whites (Rostand et al. 1982; Tierney et al. 1989; Blythe and Maddux 1991). In 1987, the rate of ESRD in hypertensive African Americans was 6.6 times that in hypertensive whites and was even higher when individuals >55 years old were compared (Blythe and Maddux 1991). Rostand et al. (1982) found the rate of hypertensive renal disease among the African American population of an urban Alabama county to be 17 times higher than that among the white population of the same county. This may result, in part, from socioeconomic factors, such as less-frequent treatment of hypertension among African Americans, but it may also represent a true difference in the renal response to elevated BP (Campese 1996), suggesting a physiological basis for ethnic differences in renal disease. The Multiple Risk Factor Intervention Trial Research Group found that renal function improved in response to BP control in white men but not African American men (Walker et al. 1992), again suggesting that racial groups differ in their response to increasing BP. Gene frequencies influencing the response of the kidney to hypertension may differ greatly between ethnic groups and may provide an explanation for the observed excess of kidney disease in African Americans.
The present article reports the results from a genomewide scan to detect genetic regions influencing the variability of creatinine clearance, a measure of kidney function, among hypertensive siblings without renal failure. The objectives are to determine whether such linkages exist and whether the genomic regions linked to creatinine clearance are similar in African Americans and whites.
Methods
Population
Subjects in this study included 480 sibships of two to seven individuals (215 African American and 265 white sibships). These sibships are among those participating in the Hypertension Genetic Epidemiology Network (HyperGEN) within the National Heart, Lung and Blood Institute (NHLBI) Family Blood Pressure Program, a study designed to identify genetic contributions to hypertension (Williams et al., 2000). Probands were characterized by an onset of hypertension at ⩽60 years of age and by the presence of at least one additional hypertensive sibling who was willing to participate. Hypertension was defined as systolic BP ⩾140 or diastolic BP ⩾90 during at least two separate evaluations or as receipt of treatment for hypertension. Volunteers with type 1 diabetes or renal failure were excluded, to remove potential secondary causes of hypertension. The mean age of the sibships was 52 years in African Americans and 61 years in whites. Subjects were recruited from existing cohort studies or from the community at large from the five field centers in HyperGEN (Birmingham; Forsyth County, NC; Minneapolis; Salt Lake City; and Framingham, MA). Birmingham recruited African Americans exclusively; Forsyth County recruited ∼50% African American and ∼50% whites; and Minnesota, Utah, and Framingham recruited only whites. In addition, a random sample of unrelated individuals was recruited from the same source population as the hypertensive sibling population. These individuals were recruited without regard to their hypertension status.
Phenotyping
Creatinine clearance, a ratio of urinary creatinine to serum creatinine adjusted for urine volume and collection duration (Mauck et al. 1986), was used to assess renal function. Creatinine clearance has been shown to be an accurate measure of renal function (Giovannetti and Barsotti 1991). Serum and urine creatinine were measured by a thin-film adaptation of the amidohydrolase enzymatic method using the Vitros analyzer (Johnson & Johnson Clinical Diagnostics). From serum creatinine measured on fasting blood samples collected in the field center, and the measured urine creatinine and total volume of participant-collected overnight urine samples, creatinine clearance was calculated as usual, using the participant-reported collection time according to the following formula (Mauck et al. 1986):
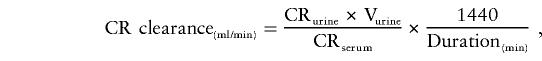 |
where CRurine is creatinine level in urine (mg/dl), CRserum is creatinine level in serum (mg/100 ml), and Vurine is volume of urine (ml). Subjects with collection times <6 hours (65 whites and 160 African Americans) were excluded from the analyses because of the potential inaccuracy of the creatinine clearance values in individuals with short collection times. To satisfy the assumption of normality in the variance-components linkage analysis, outlying creatinine clearance values >244 ml/min were excluded (21 African Americans). The Shapiro-Wilk test of normality was applied to test for deviations from normality (P=.3882 and P=.6170 for African Americans and whites, respectively, for the creatinine clearance residuals).
Genotyping
Genotyping was performed by the NHLBI Mammalian Genotyping Service. (For additional information regarding the genotyping methods, see the Web site of the Center for Medical Genetics, Marshfield Medical Research Foundation.) The genome screen was performed by means of an automated technique with the SCAnning FlUorescence Detector (SCAFUD). The Cooperative Human Linkage Center screening set 8, which includes 387 microsatellite markers approximately equally spaced every 9 cM throughout the genome, was used. The average marker heterozygosity was .76. Analyses and assignment of the marker alleles were performed using computerized algorithms. Marker incompatibilities were tested using ASPEX, a likelihood-based method. Siblings with incompatibilities were excluded from the linkage analysis, and only full sibs were included in the analysis.
Linkage Analysis
We applied a variance-components model to sibships to examine evidence for linkage of a quantitative trait locus (QTL) for creatinine clearance. A multipoint analysis was performed using GENEHUNTER2 (Pratt et al. 2000), which estimates the amount of variance in a quantitative trait that can be attributed to a QTL at that position. Maximum-likelihood values for the mean trait value, additive and dominant variance components for the QTL, additive and dominance components for other unlinked loci, and an environmental variance were estimated. To test the hypothesis that the genetic variance due to the QTL equals zero, the likelihood from the maximum-likelihood model (in which the observed variances between siblings were determined as a function of the inheritance vector at a given marker locus) was compared with the likelihood of the model in which the QTL-variance components were constrained to zero. The difference between the two log likelihoods yielded a LOD score that is similar to the classical LOD score in linkage analysis.
To reduce the variability due to nongenetic and genetic variation from other pathways (thereby potentially increasing the signal-to-noise ratio of genetic variability from major genes to total phenotypic variability), creatinine clearance values were regressed on age, age2, lean body mass, pulse rate, pulse pressure, hormone-replacement therapy, educational status, and physical activity. All of these covariates contribute to variation in renal function or creatinine clearance, and each explained a significant portion of the variation (significant parameter estimate P⩽.15 and/or increase in r2⩾.01) in creatinine clearance in one or more of the race-sex groups in the random sample.
The significant covariates (P⩽.15) in the random sample–residual models are as follows, with their respective P values in the given sex-race group: age P = .01 (white women), P = .09 (African American men); age2 P = .02 (white women), P = .06 (African American men); lean body mass P = .0001 (white women and white and African American men), P = .0004 (African American women); pulse rate P = .15 (white women); pulse pressure P = .04 (African American women); hormone-replacement therapy P = .04 (white women); education P = .08 (African American men), and physical activity P = .12 (African American men).
This comprehensive model was subsequently applied to the race- and sex-specific hypertensive samples to calculate the residual creatinine clearance values. Lean body mass and muscle mass are related to the production of creatinine, because creatinine is broken down during muscle contraction, and, thus, is directly related to the amount of creatinine in the blood available for filtration. Both pulse rate and pulse pressure affect the amount of blood passing through the kidneys. An increase in cardiac output, of which pulse rate and pulse pressure are key components, increases the GFR. Hormone-replacement therapy, and estrogen in particular, may have beneficial effects on endothelial function and BP, both of which can alter GFR. Increased physical activity also increases GFR. Education may appear to be influential because it is a known surrogate for other environmental factors such as diet, a known modifier of renal function. Each of these variables captures some environmental variation or some variation effected through other genetic pathways related to creatinine clearance, thus reducing the nongenetic sources of variation in our sample. This fully adjusted model was compared with one in which creatinine clearance was regressed only on age and age2.
Residual phenotypes were created for sex and race groups separately. Allele frequencies were estimated separately in African Americans and whites, using marker allele frequencies derived from a randomly selected subgroup (191 whites and 99 African Americans). Genome scans were performed separately for African Americans and whites.
Results
The distribution of sibship sizes is described in table 1. The mean values of creatinine clearance in this sample were 122.8 and 111.3 ml/min in African Americans and 118.4 and 96.2 ml/min in whites, for men and women, respectively. White men had the longest duration of diagnosed hypertension (17.0 years, compared with 15.6 years in white women and 15.4 years in African American men and women. White men were also taking the greatest number of antihypertensive medications (40.1% were taking two or more medications, compared with 31.6% of white women and 37.9% and 34.6% of African American men and women, respectively). African American women had an average body mass index (BMI) of 33.7 kg/m2, compared with 30.2 for African American men and 30.2 and 30.8 for white men and women, respectively. A summary of phenotypic characteristics is given in table 2. The narrow-sense heritabilities of the adjusted creatinine clearance measurements, estimated in the genetic model within GENEHUNTER2, were 17% in African Americans and 18% in whites.
Table 1.
Distribution of Sibship Sizes
| No. of Sibs | African Americans | Whites |
| 2 | 185 | 178 |
| 3 | 24 | 63 |
| 4 | 6 | 17 |
| 5 | 0 | 5 |
| 6 | 0 | 1 |
| 7 | 0 | 1 |
| Total | 215 | 265 |
Table 2.
Phenotypic and Other Characteristics of Study Participants[Note]
|
African Americans |
Whites |
|||
| Characteristica | Men (n = 124) | Women(n = 342) | Men(n= 309) | Women(n = 342) |
| Age (years) | 52.8 (9.7) | 51.5 (10.3) | 60.9 (8.7) | 61.3 (8.6) |
| Height (m) | 1.75 (0.06) | 1.63 (0.06) | 1.75 (0.07) | 1.62 (0.06) |
| Weight (lbs) | 205.2 (43.6) | 197.2 (48.5) | 204.9 (37.6) | 178.8 (41.1) |
| BMI (kg/m2) | 30.2 (6.0) | 33.7 (7.8) | 30.2 (4.9) | 30.8 (6.8) |
| Lean body mass (kg) | 74.0 (7.1) | 64.3 (0.4) | 76.1 (6.3) | 63.4 (6.1) |
| No. of anti-HT medications | ||||
| 0 | 15.3% | 12.7% | 7.4% | 6.3% |
| 1 | 46.8% | 52.6% | 52.5% | 62.1% |
| 2 | 30.6% | 25.6% | 30.8% | 26.6% |
| 3+ | 7.3% | 9.0% | 9.3% | 5.0% |
| Hormone replacement | NA | 37.5% | NA | 66.8% |
| SBP (mm Hg) | 132.3 (21.5) | 130.8 (22.3) | 126.1 (19.2) | 125.5 (19.1) |
| PP (mm Hg) | 54.0 (15.5) | 57.0 (17.5) | 53.4 (14.8) | 59.0 (16.3) |
| Pulse rate | 70.0 (14.2) | 72.9 (11.1) | 66.4 (11.6) | 70.3 (12.3) |
| HT duration (years) | 15.4 (11.1) | 15.4 (12.1) | 17.0 (11.4) | 15.6 (10.7) |
| CR clearance (ml/min) | 122.8 (46.0) | 111.3 (41.7) | 118.4 (34.3) | 96.2 (31.2) |
| Serum CR (mg/100ml) | 1.20 (0.5) | 0.96 (0.60) | 1.10 (0.30) | 0.89 (0.18) |
| Urine creatinine (mg/dl) | 152.7 (77.1) | 100.1 (59.0) | 111.0 (52.4) | 70.9 (41.0) |
| Education | ||||
| <High school | 34.7% | 21.8% | 9.4% | 10.8% |
| High school | 29.0% | 28.6% | 31.7% | 50.0% |
| College | 12.9% | 16.9% | 8.7% | 10.8% |
| Postgraduate | 23.4% | 32.9% | 50.2% | 28.4% |
| Physical activity | 2.3 (2.4) | 2.4 (2.2) | 2.6 (2.4) | 2.1 (2.3) |
Note.— All data are means (SD), except where noted. NA = not applicable.
CR = creatinine; HT = hypertension. Physical activity indicates subject's report of no. of times per week when physical activity induced sweating. Postgraduate includes professional training.
We found six regions on three chromosomes in the minimally and fully adjusted models (table 3, fig. 1) in which the peak LOD score was >1.9. Our best evidence for linkage to creatinine clearance was found, using the fully adjusted model in African Americans, on the long arm of chromosome 3 with a peak multipoint LOD score of 3.61 at position 214.6 cM, which localizes to the cytogenetic band 3q27; no comparable peak was observed in the whites at this position. Using the fully adjusted model, we observed an additional locus at 57.9 cM on chromosome 3 (LOD = 1.78) in African Americans.
Table 3.
Peak Multipoint LOD scores and QTL Variance-Components Estimates, by Race[Note]
| Race and Chromosome | LOD | Model | Position (cM) | Marker(s) (Position, cM) | VP | VA | VD |
| African American | |||||||
| 3 | 1.78 | Full | 57.9 | D3S2432 (57.9) | 1610.6 | .0 (0%) | 862.9 (54%) |
| 3 | 2.50 | Minimal | 57.9 | D3S2432 (57.9) | 1856.0 | .0 (0%) | 1187.6 (64%) |
| 3 | 3.61 | Full | 214.6 | D3S2398 (209.4)/D3S2418 (215.8) | 1610.6 | .0 (0%) | 1505.9 (93%) |
| 3 | 2.31 | Minimal | 213.3 | D3S2398 (209.4)/D3S2418 (215.8) | 1856.0 | 290.3 (16%) | 1162.2 (63%) |
| White | |||||||
| 1 | 1.91 | Full | 159.2 | D1S534 (151.9)/D1S1653 (164.1) | 865.3 | 504.8 (58%) | .0 (0%) |
| 1 | 1.49 | Minimal | 169.5 | D1S1653 (164.1)/D1S1679 (170.8) | 995.8 | 170.0 (17%) | 408.7 (41%) |
| 3 | 2.16 | Full | 97.5 | D3S4542 (89.9)/D3S2406 (102.6) | 865.3 | 187.0 (22%) | 389.4 (45%) |
| 3 | 3.36 | Minimal | 115.1 | D3S4529 (112.4)/D3S2459 (119.1) | 995.8 | .0 (0%) | 643.2 (65%) |
| 6 | 2.36 | Full | 102.8 | D6S1056 (102.8) | 865.3 | .0 (0%) | 473.2 (55%) |
| 6 | 2.97 | Minimal | 112.2 | D6S1021 (112.2) | 995.8 | 9.0 (1%) | 613.6 (62%) |
| 6 | 1.91 | Full | 166.4 | D6S305 (166.4) | 865.3 | 394.7 (45%) | 126.8 (15%) |
| 6 | 1.47 | Minimal | 166.4 | D6S305 (166.4) | 995.8 | 424.2 (43%) | .0 (0%) |
Note.— For comparison, the LOD score is given for the nearest peak for the opposite residual model. The corresponding residual model used to obtain the score is reported, either fully adjusted (age and age2, lean body mass, pulse rate, pulse pressure, hormone replacement therapy, education status, and physical activity) or minimally adjusted (age, age2). The markers given are those either at the peak LOD position or those that are flanking the position, if the peak LOD occurred between markers. For each marker, the position, in centimorgans, is given in parentheses. Also reported are the variance components estimates from GENEHUNTER2 for each peak position. VP = phenotypic variation, VA = additive variation, and VD = dominance variation.
Figure 1.

Results of the multipoint linkage analysis for African Americans (AA) and whites (W) for both the minimally adjusted and fully adjusted residual creatinine-clearance models. Each scanned marker is given, along the x-axis, at its respective distance (in cM) from the p-telomere (left) to the q-telomere (right), and the distance (in cM) of the last marker is given in parentheses.
Using the fully adjusted creatinine clearance model in the white sample, we identified two loci, with maximum LOD scores of 2.36 and 1.91, on the long arm of chromosome 6 at positions 102.8 cM and 166.4 cM, respectively. However, no similar peaks were observed in the African Americans. Two additional loci were identified in the white population on chromosome 3 (LOD = 2.16, 97.5 cM) and on chromosome 1 (LOD = 1.91, 159.2 cM), with no similar peaks in African Americans.
When compared with the minimally adjusted residual model (adjusted for age and age2 only) the peak LOD positions remain fairly consistent, although there is some change in the magnitude of the peak LOD scores (table 3, fig. 1).
The breakdown of the variance-components estimates from GENEHUNTER2 can be found in table 3. There was a general trend toward higher LOD scores having a higher proportion of the QTL variance attributed to dominance variance, with the two highest LOD scores having all dominance and no additive variance (LOD = 3.61 in African Americans, 93% dominance; LOD = 3.36 in whites, 65% dominance).
A search of candidate-gene databases for genes contained within the chromosomal region 3q27 (the region of our best evidence for linkage) identified two candidate genes, EHHADH (which has been localized to 3q26.3-3q28) and ApoD (which has been localized to 3q27-3qter).
Discussion
These are the first data to offer evidence of genetic linkage to creatinine clearance, an indicator of renal function, among hypertensive humans. Our data suggest that these influential regions differ between ethnic groups or are more easily detected in one ethnic group than the other. This difference between ethnic groups may be a result of the differing patterns of renal response to hypertension, with African Americans exhibiting significantly higher rates of hypertension-induced renal failure (Rostand et al. 1982; Tierney et al. 1989; Blythe and Maddux 1991) and faster progression of renal failure (Tierney et al. 1989). Therefore, it is plausible that the influential genetic regions would differ by ethnicity, as reported here.
The comparison of the residual models in this analysis is encouraging because the positions of the peak LOD scores remain consistent between the two models within the reported standard error of location estimates (Roberts et al. 1999). This suggests that the analysis is robust to varying adjustment strategies. One explanation for the variability in the magnitude of the peak LOD scores between the minimally and fully adjusted residual phenotype is that the additional adjustment altered the detectable genetic signal at the various loci. Where the peaks increased, the genetic signal may have been enhanced because of the reduction of nongenetic variability in creatinine clearance. Where the peaks decreased, the genetic signal may have been reduced because of shared genetic variance between creatinine clearance and one or more covariates. A second equally likely explanation is that the variation in the magnitude of the peak LOD scores is the result of statistical fluctuations in the data and not of an increasing or decreasing genetic signal at the various loci.
Because only small sibships (mean sibship size of 2.5 and 2.2 in whites and African Americans, respectively) were sampled, the variance-components estimates may not be highly accurate. In the case of our highest LOD score (LOD = 3.61 at 214.6 cM on chromosome 3 in African Americans), all of the genetic variation is in the dominance component (93% dominance, 0% additive). In simulations in which a dominance-variance component is included in the simulated trait and dominance is modeled in GENEHUNTER2, there is an upward bias of the dominance-variance component and a downward bias of the additive variance component (Pratt et al. 2000). The present simulation was conducted using a more informative pedigree structure, including cousins, resulting in better estimates of variance components than when small sibships are used. However, because variation in creatinine clearance is probably influenced by multiple genes, as well as by gene-gene and gene-environment interactions, it is also plausible that the dominance-variance component is absorbing some of this genetic complexity, thereby inflating the estimate. This may also explain why we were able to find such strong linkages despite our modest heritability estimates.
Our search of available databases for candidate loci revealed two candidate genes, in the 3q27 region, that may be influential in determining renal function. The peroxisomal bifunctional protein EHHADH is a member of the peroxisomal β-oxidation pathway. EHHADH has been shown to be expressed in the peroxisomes, which are particularly abundant in both hepatocytes and renal proximal epithelial cells, and has been localized, using FISH, to chromosome 3q26.3-3q28 (Hoefler et al. 1994). Patients with the G1528C mutation of 3-hyroxyacyl-CoA dehydrogenase exhibit hepatomegaly and steatosis of the liver, as well as accumulation of fat in the myocardium, renal tubules, and skeletal muscle (Tyni et al. 1997). Although this particular mutation is often lethal before the age of two years, it suggests that defects in the EHHADH gene could affect the renal tubules and that a nonlethal mutation in this gene could induce renal damage through the accumulation of long-chain fatty acids in the renal tubules.
ApoD, the gene for which has been localized to 3q27-3qter, is a human-protein component of plasma high-density lipoprotein (Fielding and Fielding 1980; Albers et al. 1981), but little is known about its function. It has been hypothesized that ApoD may be involved in the transport of cholesteryl esters to the liver for catabolism and in the efflux of cholesterol from peripheral tissues (Drayna et al. 1987). A polymorphism in ApoD has been associated with non–insulin-dependent diabetes mellitus (Baker et al. 1991, 1994) and, more recently, with obesity and hyperinsulinemia (Vijayaraghavan et al. 1994). ApoD has been shown to be expressed in the kidney as well as in a host of other tissues (Drayna et al. 1986). The possible role of ApoD in renal damage is highly speculative, but it may act through atherosclerosis in the renal blood vessels, although no evidence exists to support this hypothesis.
One limitation of the present study is the inability to infer the etiologic pathway between hypertension and renal function and the role the linked regions play in this pathway. There is evidence for kidney damage as a cause (de Wardener 1990) and a consequence (Lindeman et al. 1984; Walker et al. 1992) of hypertension. The present study recruited a population in which each person was diagnosed with primary hypertension at ⩽60 years of age. Although subjects diagnosed with renal failure were excluded (to eliminate subjects with renal failure–induced hypertension), it is still possible that a decrease in renal function, although not considered renal failure, may be responsible for the increased BP. At the same time, this decrease in renal function may be the result of kidney damage induced by hypertension. On the basis of the epidemiological evidence of elevated rates of hypertension-induced renal failure among African Americans, it is tempting to conclude that in the African American study population the linked region is a susceptibility locus for hypertension-induced renal damage. Likewise, this may be a locus that results in renal damage independent of hypertension and that consequently leads to elevated BP due to renal damage.
Another potential limitation of the present study is the use of creatinine clearance as a measure of renal function. Creatinine clearance, although it does not directly measure the GFR, has been shown to be a good estimate of the GFR and an accurate reflection of reductions in GFR in both normal individuals and those suffering from chronic renal failure (Giovannetti and Barsotti 1991). Although a 24-h urine collection (i.e., 24 h between first and last collection) is optimal in determining creatinine clearance, collection times significantly less than 24 hours accurately measure creatinine clearance; however, when short collection times are used, measures of creatinine clearance begin to deviate substantially from the true rate (Baumann et al. 1987). Therefore, we eliminated all subjects with collection times <6 h, to reduce the variability introduced by inaccuracy in measurement of creatinine clearance in these subjects. Nonetheless, measurement error may have reduced the power to detect linkage.
Recently it has been noted that the LOD score from a variance-components analysis that includes a dominance parameter corresponds to a χ2 test with 2 df instead of the traditional 1 df, thereby increasing the requirement for a genomewide significant LOD score (Morton 1998). A genomewide significance level of .05 (nominal P value of .0001), which corresponds to a LOD score of 3.3 in linkage analysis (the criterion suggested by Lander and Kruglyak [1995] for “significant linkage”), using a 1-df test corresponds to 3.7 using a χ2 test with 2 df.
Although our linkage results appear promising, it should be noted that none of these linkages reach a sufficiently high LOD score to be termed a “significant linkage.” Furthermore, given our strategy of using multiple residual phenotypes and of stratifying by race, this threshold would need to be further increased to account for multiple testing. Therefore, all the linkages reported here should be viewed as preliminary evidence for linkage until further studies can confirm or refute the evidence for linkage of creatinine clearance to these genomic regions.
In conclusion, we have found evidence for linkage to creatinine clearance. Our best evidence of linkage is on chromosome 3 at 214.6 cM (LOD = 3.61, fully adjusted) in African Americans. In addition, we found weaker evidence of linkage to five regions. We identified four loci in whites: one on chromosome 3 at 115.1 cM (LOD = 3.36, minimally adjusted), two on chromosome 6 at 112.2 cM (LOD = 2.97, minimally adjusted) and at 166.4 cM (LOD = 1.91, fully adjusted), and one on chromosome 1 at 159.2 cM (LOD = 1.91, fully adjusted). An additional locus in African Americans on chromosome 3 at 57.9 cM (LOD = 2.50, minimally adjusted) was also localized. None of the observed peaks were comparable between race groups. Positional candidates in the most promising region on chromosome 3 include EHHADH and ApoD.
Acknowledgments
The HyperGEN network is funded by National Institutes of Health grant NHLBI R01 HL55673 and by cooperative agreements (U10) with National Heart, Lung and Blood Institute: HL54471 (Utah FC), HL54472 (Minnesota Laboratory), HL54473 (DCC), HL54495 (Alabama FC), HL54496 (Minnesota FC), HL54509 (North Carolina), HL54515 (Utah DNA Laboratory).
Electronic-Database Information
The URLs for data in this article are as follows:
- Center for Medical Genetics, Marshfield Medical Research Foundation http://www.research.marshfieldclinic.org/genetics/
- Cooperative Human Linkage Center http://www.uiowa.edu/~vpr/research/organize/humalink.htm
References
- Albers J, Cheung M, Ewens S, Tollefson J (1981) Characterization and immunoassay of apolipoprotein D. Atherosclerosis 39:395–409 [DOI] [PubMed] [Google Scholar]
- Baker WA, Dowse G, Zimmet P, Serjeantson SW (1991) Population and pedigree analysis in Micronesians of eight loci contributing to lipid metabolism in NIDDM. In: Rifkin H, Colwell JA, Taylor SI, eds. Proceedings of the 14th International Diabetes Federation Congress. Amsterdam, Excerpta Medica, pp 220–224 [Google Scholar]
- Baker WA, Hitman GA, Hawarami K, McCarthy MI, Riikonen A, Tuomilehto-Wolf E, Nissinen A, Tuomilento J, Mahan V, Viswanathan M, Snehalatha C, Ramachandran A, Dowse GK, Zimmet P, Serjeantson SW (1994) Apolipoprotein D gene polymorphism: a new genetic marker for type 2 diabetic subjects from Naurua and South India. Diabet Med 11:947–952 [DOI] [PubMed] [Google Scholar]
- Baumann TJ, Staddon JE, Horst HM, Bivins BA (1987) Minimum urine collection periods for accurate determination of creatinine clearance in critically ill patients. Clin Pharm 6:393–398 [PubMed]
- Blythe WB, Maddux FW (1991) Hypertension as a causative diagnosis of patients entering end-stage renal disease programs in the United States from 1980–1986. Am J Kidney Dis 18:33–37 [DOI] [PubMed] [Google Scholar]
- Brown DM, Provoost AP, Daly MJ, Lander ES, Jacob HJ (1996) Renal disease susceptibility and hypertension are under independent genetic control in the fawn-hooded rat. Nat Genet 12:44–51 [DOI] [PubMed] [Google Scholar]
- Brown MA, Whithworth JA (1992) Hypertension in human renal disease. J Hypertens 10:701–712. [PubMed] [Google Scholar]
- Campese VM (1996) The kidney in the hypertensive black. Ethnicity and Health 1:145–151 [DOI] [PubMed] [Google Scholar]
- Cusi D, Tripodi G, Casari G, Robba C, Bollini P, Merati G, Bianchi G (1993) Onset and development of renal damage in hypertension. Am J Kidney Dis 21:2–9 [DOI] [PubMed] [Google Scholar]
- De Wardener HE (1990) The primary role of the kidney and salt-intake in the etiology of essential hypertension: part I. Clin Sci 79:193–200 [DOI] [PubMed] [Google Scholar]
- Drayna D, Fielding C, McLean J, Baer B, Castro G, Chen E, Comstock L, Henzel W, Kohr W, Rhee L, Wion K, Lawn R (1986) Cloning and expression of human apolipoprotein D cDNA. J Biol Chem 261:16535–16539. [PubMed] [Google Scholar]
- Drayna DT, McLean JW, Wion KL, Trent JM, Drabkin HA, Lawn RM (1987) Human apolipoprotein D gene: gene sequence, chromosome location, and homology to the alpha 2u-globulin superfamily. DNA 6:199–204. [DOI] [PubMed] [Google Scholar]
- Ferguson R, Grim CE, Opgenorth TJ (1988) A familial risk of chronic renal failure among blacks in dialysis? J Clin Epidemiol 41:1189–1196 [DOI] [PubMed] [Google Scholar]
- Fielding C, Fielding P (1980) A cholesteryl ester transfer complex in human plasma. Proc Natl Acad Sci USA 77:3327–3331 [DOI] [PMC free article] [PubMed] [Google Scholar]
- Giovannetti S, Barsotti G (1991) In defense of creatinine clearance. Nephron 59:11–14 [DOI] [PubMed] [Google Scholar]
- Hoefler G, Forstner M, McGuiness MC, Hulla W, Hiden M, Krisper P, Kenner L, Ried T, Lengauer C, Zechner R, Moser HW, Chen GL (1994) cDNA cloning of the human peroxisomal enoyl-CoA hydratase: 3-hydroxyacyl-CoA dehydrogenase bifunctional enzyme and localization to chromosome 3q26.3-3q28: a free left Alu arm is inserted in the 3′ noncoding region. Genomics 19:60–67 [DOI] [PubMed] [Google Scholar]
- Jaimes E, Galceran JM, Raij L (1996) End-stage renal disease: why aren’t improvements in hypertension treatment reducing the risk? Curr Opin Cardiol 11:471–476 [DOI] [PubMed] [Google Scholar]
- Lander E, Kruglyak L (1995) Genetic dissection of complex traits: guidelines for interpreting and reporting linkage results. Nat Genet 11:241–247 [DOI] [PubMed] [Google Scholar]
- Lebel M, Grose JH (1991) Renal eicosanoids and renal hemodynamics in early borderline hypertension. Clin Invest Med 14:525–534 [PubMed] [Google Scholar]
- Lindeman RD, Tobin JD, Shock NW (1984) Association between blood pressure and the rate of decline in renal function with age. Kidney Int 26:861–868. [DOI] [PubMed]
- Morton, N (1998) Significance levels in complex inheritance. Am J Hum Genet 62:690–697 [DOI] [PMC free article] [PubMed] [Google Scholar]
- Porth CM (1994) Pathophysiology: concepts of altered health states, 4th ed. Ch. 32 [Google Scholar]
- Pratt SC, Daly MJ, Kruglyak L (2000) Exact multipoint quantitative-trait linkage analysis in pedigrees by variance components. Am J Hum Genet 66:1153–1157 [DOI] [PMC free article] [PubMed] [Google Scholar]
- Roberts SB, MacLean CJ, Neale MC, Eaves LJ, Kendler KS (1999) Replication of linkage studies of complex traits: an examination of variation in location estimates. Am J Hum Genet 65:876–884 [DOI] [PMC free article] [PubMed] [Google Scholar]
- Rostand SG, Kirk KA, Rutsky EA, Pate BA (1982) Racial differences in the incidence of treatment for end-stage renal disease. N Engl J Med 306:1276–1279 [DOI] [PubMed] [Google Scholar]
- Seedat YK (1999) Improvement in treatment of hypertension has not reduced incidence of end-stage renal disease. J Hum Hypertens 13:747–751 [DOI] [PubMed] [Google Scholar]
- St. Lezin E, Griffin KA, Picken M, Churchill MC, Churchill PC, Kurtz TW, Liu W, Wang N, Kren V, Zidek V, Pravenec M, Bidani AK (1999) Genetic isolation of a chromosome 1 region affecting susceptibility to hypertension-induced renal damage in the spontaneously hypertensive rat. Hypertension 34:187–191 [DOI] [PubMed]
- Tierney WM, McDonald CJ, Left FC (1989) Renal disease in hypertensive adults: effect of race and type II diabetes mellitus. Am J Kidney Dis 13:485–493 [DOI] [PubMed] [Google Scholar]
- Tyni T, Rapola J, Paetau A, Palotie A, Pihko H (1997) Pathology of long-chain 3-hydroxyacyl-CoA dehydrogenase deficiency caused by the G1528C mutation. Pediatr Pathol Lab Med 17:427–447 [PubMed]
- Van Lente F, Suit P (1989) Assessment of renal function by serum creatinine and creatinine clearance: glomerular filtration rate estimated by four procedures. Clin Chem 35:2326–2330 [PubMed]
- Vijayaraghavan S, Hitman GA, Kopelman PG (1994) Apolipoprotein-D polymorphism: a genetic marker for obesity and hyperinsulinemia. J Clin Endocrinol Metab 79:568–570 [DOI] [PubMed] [Google Scholar]
- Walker WG, Neaton JD, Cutler JA, Neuwirth R, Cohen JD (1992) Renal function change in hypertensive members of the Multiple Risk Factor Intervention Trial: racial and treatment effects. JAMA 268:3085–3091 [PubMed] [Google Scholar]
- Williams RR, Rao DC, Ellison RC, Arnett DK, Heiss G, Oberman A, Eckfeldt JH, Leppert MF, Province MA, Mockrin SC, Hunt SC (2000) NHLBI Family Blood Pressure Program: methodology and recruitment in the HyperGEN Network. Ann Epidemiol 10:389–400 [DOI] [PubMed] [Google Scholar]
- Woolfson RG, de Wardener HE (1996) Primary renal abnormalities in hereditary hypertension. Kidney Int 50:717–731 [DOI] [PubMed] [Google Scholar]