

Abstract
We show that single-nucleotide polymorphisms (SNPs) of moderate to high heterozygosity (minor allele frequencies >10%) can be efficiently detected, and their allele frequencies accurately estimated, by pooling the DNA samples and applying a capillary-based SSCP analysis. In this method, alleles are separated into peaks, and their frequencies can be reliably and accurately quantified from their peak heights (SD <1.8%). We found that as many as 40% of publicly available SNPs that were analyzed by this method have widely differing allele frequency distributions among groups of different ethnicity (parents of Centre d'Etude Polymorphisme Humaine families vs. Japanese individuals). These results demonstrate the effectiveness of the present pooling method in the reevaluation of candidate SNPs that have been collected by examination of limited numbers of individuals. The method should also serve as a robust quantitative technique for studies in which a precise estimate of SNP allele frequencies is essential—for example, in linkage disequilibrium analysis.
Single-nucleotide polymorphisms (SNPs) are considered to be useful polymorphic markers for genetic studies of polygenic traits, and a worldwide effort to collect SNPs has achieved an accumulation of millions of them in public databases. However, most of these SNPs have been identified by examination of a limited number of individuals, and information on their allele frequencies is lacking or tentative. Furthermore, studies have indicated that allele frequencies might vary widely between different ethnic populations (Lai et al. 1998; Nickerson et al. 1998). Thus, validation of these candidate SNPs, and estimation of their allele frequency, especially for each ethnic group, is required before these candidate markers can be used for genetic studies.
It has been suggested that large numbers of SNPs, in the range 30,000–500,000, are required for whole-genome association studies (Collins et al. 1999; Kruglyak 1999). It is also claimed that accurate estimation of allele frequencies, using large samples, is needed in association studies of genes with low relative risk (Risch and Teng 1998). Therefore, the method for estimation of SNP allele frequencies in such studies must be amenable to scaling-up, both in the number of loci and in the number of individuals.
Pooling an equal amount of DNA from individual samples and measuring the relative abundance of alleles in the pool is obviously an efficient strategy to estimate allele frequencies in many samples, because it drastically reduces the cost of the analysis and the amount of DNA consumed, compared with genotyping individuals and counting alleles. Obviously, the quantification method in the pooled analysis must be accurate and reproducible, so that the measurement error is significantly smaller than the statistical error of sampling. Pooled analysis has been successfully applied to microsatellite markers (Barcellos et al. 1997; Shaw et al. 1998). A pooling strategy for SNP analysis has also been proposed (Kwok et al. 1994; Germer et al. 2000), but the accuracy achievable in the analysis of many markers remains to be evaluated.
We have developed a streamlined and cost-effective mutation/polymorphism detection method, PLACE-SSCP, in which PCR products are post-labeled with fluorescent dyes, and analyzed with an automated capillary electrophoresis system, under SSCP conditions (Inazuka et al. 1996, 1997; Hayashi et al. 1998; Kondo et al. 2000). We show here that allele frequencies of SNPs in a population can be easily and accurately estimated from the relative peak heights of separated alleles, using PLACE-SSCP analysis of pooled DNA.
We analyzed four or more individual DNAs, together with pooled samples by PLACE-SSCP of each sequence-tagged site (STS), to identify individuals with different genotypes. Heterozygotes and homozygotes were unambiguously identifiable from the SSCP profiles, and they were selected for direct sequencing, followed by PolyPhred analysis (Nickerson et al. 1997; Ewing et al. 1998) and visual inspection. Figure 1 shows examples of the PLACE-SSCP analyses and identification of SNP nucleotides by sequencing of individual DNA samples. In this example, the genotype of each individual is evident from the peaks of the R110-labeled strand (blue, see legend to fig. 1)—that is, one individual (J1) was a heterozygote, another (J2) was a homozygote for one allele, and the other two—C1 and C2—were homozygotes for another allele. Sequencing samples from individuals J1 and C1 identified the SNP alleles unambiguously (National Center for Biotechnology Information [NCBI] Assay ID in NCBI Single Nucleotide Polymorphism Database: ss1107). The genotypes of individuals were also clearly apparent from the peaks of the R6G-labeled strands (red), although each allele revealed three peaks.
Figure 1.

Quantitative detection of SNP alleles by PLACE-SSCP. An STS (GenBank accession number G29427) containing an SNP (ss1107) was amplified from each individual's DNA (Japanese: J1 and J2; CEPH parents: C1 and C2) and pooled DNAs (the Japanese pool: JP; the CEPH pool: CP) and analyzed by PLACE-SSCP (A), essentially as described (Inazuka et al. 1996, 1997; Hayashi et al. 1998). PCR products were subjected to postlabeling reaction, in which the two strands of each STS were differentially labeled at their 3′-termini with fluorescent nucleotides, 6-carboxyrhodamine (R110)-dUTP and N,N′-diethyl-2′,7′-dimethyl-6-carboxyrhodamine (R6G)-dCTP (purchased from Applied Biosystems). The PCR product amplified from the reference individual, which was labeled with N,N,N′,N′-tetramethyl-6-carboxyrhodamine (TAMRA)-dUTP and dCTP, served as an internal standard, together with the size marker (Genescan 500 TAMRA, Applied Biosystems), to precisely calibrate the mobility (not shown). Capillary electrophoresis by means of an ABI Prism 310 Genetic Analyzer was performed in a medium containing 5% POP without denaturant (kindly provided by Applied Biosystems) in 1× TBE containing 10% glycerol. The temperature of the capillary unit was kept at 25°C by an active cooling device. Data collection, mobility calibration, and peak height measurement were performed by means of GeneScan Analysis Software (Applied Biosystems). The threshold value of peak height detection was set at 50 arbitrary units, so that minor alleles with frequencies of >10% were quantifiable. Allele frequencies were calculated as described in the text. Arrowheads above indicate peaks of alleles with indicated sequences that were determined by sequencing of individual samples (B). We noted that essentially the same separation and peak quantifiability can be achieved by means of GeneScan Polymer (commercially available from Applied Biosystems) at 6%, instead of the POP described in the present report.
Quantitative allele detection by PLACE-SSCP was tested by mixing experiments, as exemplified in table 1. In this example, genomic DNA from two individuals who were homozygous for alternative alleles of an SNP were combined at various ratios (from 0:10 to 10:0) and analyzed by PLACE-SSCP. The allele composition estimated from the raw data of peak heights deviated significantly from the actual mixing ratio, presumably because of the different amplification efficiency of each allele (Barnard et al. 1998). However, after correction of peak heights at each mixing ratio with those at a 1:1 mixing ratio, the estimate was in excellent agreement (within 1%) with the mixing ratios for the whole range (table 1). Mixing experiments using other SNPs gave essentially the same results (data not shown).
Table 1.
Quantitative Detection of Alleles
| Peak Heightsa |
Fraction of G Allele (%) |
|||
| MixingRatio(G:T) | G | T | Rawb | Correctedc |
| 0:1 | 0 | 3546 | .0 | .0 |
| 1:9 | 392 | 2915 | 11.9 | 9.6 |
| 2:8 | 833 | 2525 | 24.8 | 20.7 |
| 3:7 | 1179 | 2133 | 35.6 | 30.4 |
| 4:6 | 1577 | 1825 | 46.4 | 40.6 |
| 5:5 | 1434 | 1132 | 55.9 | 50.0 |
| 6:4 | 2319 | 1174 | 66.4 | 60.9 |
| 7:3 | 2582 | 905 | 74.0 | 69.3 |
| 8:2 | 2899 | 596 | 82.9 | 79.3 |
| 9:1 | 3171 | 300 | 91.4 | 89.3 |
| 10:0 | 3160 | 0 | 100.0 | 100.0 |
Peak heights of alleles in arbitrary units.
Percent G allele calculated from peak heights.
Percent G allele calculated from corrected peak heights. See text for method of correction.
On the basis of the results described above, accurate quantification of STS allele frequencies in pooled DNA analysis was achieved by means of the following equation:
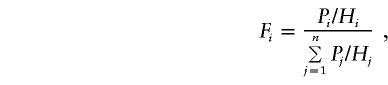 |
where n is the number of alleles of the STS, Fi is the frequency of the i-th STS allele, Pi is the peak height of the i-th allele in the pool, and Hi is the correction factor. Hi is the relative peak height of the alleles when they are present in equal molar ratios and is obtained from the peak height ratios in heterozygotes of all combinations. The allele frequency of each SNP is calculated by adding the frequencies of the STS alleles (Fi) that contain the same alleles of the SNP. Thus, in the case of an STS with two alleles, H1 and H2 are the peak heights of alleles 1 and 2, respectively, in the heterozygote, and the allele frequencies of the SNP are the same as the allele frequencies of the STS.
The reproducibility of the quantification of the two SNP alleles of the STS was evaluated from the variability of RH (the ratio of the peak heights of the alleles with greater to lesser peaks in the heterozygote; RH >1) and RP (the ratio of corresponding alleles in the pool). The minor allele frequency (F) is related to RH and RP by the following equations: F=RH/(RH+RP) for RH⩽RP, and F=RP/(RH+RP) for RH>RP. In either case, ΔF (SD of F) is estimated in the following equation:
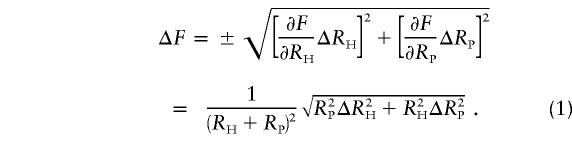 |
Here, by introducing CH and CP as the coefficients of variation of RH and RP, respectively (i.e., CH=ΔRH/RH and CP=ΔRP/RP), equation (1) can be expressed as follows:
 |
Equation (2) implies that ΔF is greatest when F=.5.
We found that the coefficients of variation of peak-height ratios (CH and CP), in repeated experiments, did not exceed .052, if the peak-height ratios were determined in the same batch of experiments (obtained by five repeated determinations for each of 10 STSs). Using this value, we concluded that the highest possible value for the SD attributable to measurement error was 0.018. This figure is equivalent to the SD attributable to sampling error in the study of ∼800 chromosomes,  , where p is the allele frequency and is .5.
Using the method described above, we evaluated the allele frequencies of 61 candidate SNPs from the Human SNP Database (Wang et al. 1998) in 48 STSs, ranging in size from 100 to 330 bp, on chromosome 6q. The population groups examined consisted of 53 unrelated Japanese subjects and 78 parents from CEPH. The individual source of each Japanese DNA sample was made anonymous by randomization, in accordance with the Guidelines of the Kyushu University Ethical Committee. Each sample was diluted to 50 ng/μl, on the basis of the absorbance at 260 nm, measured in two independent assays. Samples were then combined manually, in equal parts, to constitute the sample of pooled DNA.
In all, 48 of the 61 candidate SNPs examined were confirmed by sequencing. The other 13 candidate SNPs were not detected, even by sequencing of the DNA of the seven individuals from whom these SNPs were originally identified (Wang et al. 1998). Five of the sequence-verified SNPs were not detected by PLACE-SSCP. Therefore, the sensitivity of detection of SNPs, using our present method, was 90%. In addition to the verified SNPs, 15 new SNPs were detected by PLACE-SSCP and were confirmed by sequencing (table 2). We found no false positives—that is, the PCR products that showed different peak patterns in PLACE-SSCP always contained sequence discrepancies.
Table 2.
SNPs Characterized in This Study
| No. of SNPs |
|||
| Category | Known | New | Total |
| Confirmed by sequencing | 48 | 15 | 63 |
| Detectable by PLACE-SSCP | 43 | 15 | 58 |
| Quantifiable | 35 | 13 | 48 |
| Informativea: | |||
| In both pools (JP and CP) | 15 | 2 | 17 |
| Only in Japanese pool (JP) | 1 | 0 | 1 |
| Only in CEPH pool (CP) | 7 | 3 | 10 |
| Not informative in both pools | 12 | 8 | 20 |
| Diverged frequencyb | 14 | 5 | 19 |
SNPs with minor allele frequencies of >10%.
SNPs with significantly different allele frequencies between JP and CP (P<.01).
The alleles of all verified and new SNPs were quantified. Separation of the alleles of some STSs was not sufficient for quantification of each allele component. At this stage, we could estimate the allele frequencies of 35 (73%) of the 48 verified SNPs, and 13 (87%) of the 15 new SNPs (see Electronic-Database Information for the allele frequencies of each SNP). Allele frequency of an SNP (NCBI assay ID in NCBI Single Nucleotide Polymorphism Database: ss3167) in the CEPH pool, estimated by pooled PLACE-SSCP (29.9%), was in good agreement with that determined by typing individual DNAs by PLACE-SSCP (28.2%), indicating reliability of frequency estimation performed in this study.
As summarized in table 2, one-third of the sequence-confirmed and quantifiable candidate SNPs were not informative (minor allele frequency <10%), even in the population examined in the original study (CEPH). A still higher proportion (about half) of the SNPs were not informative in the other population (Japanese). The newly discovered SNPs were less informative than those already reported, as expected from the fact that most informative SNPs can be detected by examining even a limited number of individuals (Wang et al. 1998).
The significance of differences in the allele frequencies between the two groups was assessed by use of an approximate binomial proportions test (Shaw et al. 1998). The normal deviate statistics and corresponding P values were obtained for SNPs with minor allele frequencies of >10%. We found that the allele frequencies of 14 SNPs (40%) were significantly different between the two groups (P<.01) (table 2). This result is consistent with previous studies showing that allele frequencies of SNPs vary among populations (Lai et al. 1998; Nickerson et al. 1998), although the groups studied here are not necessarily representative of the ethnic groups to which they belong (white and Japanese).
We have shown here that PLACE-SSCP is an efficient method by which to estimate allele frequencies of SNPs, using pooled DNA. The method does not require fluorescence-labeled primers, and far less DNA is consumed. An alternative strategy for the analysis of pooled DNA samples is by direct sequencing (Kwok 1994). However, quantification by pooled sequencing is less accurate (SD up to 5%) than our PLACE-SSCP method. Furthermore, the cost of sequencing by means of commercially available kits is three to four times higher than that for the reagents used in our postlabeling method. Thus, the present method is cost effective, especially in multilocus analyses. In addition, this method is easy to perform, and interpretation of the results is straightforward. The number of samples in a pool is unlimited, and, therefore, the labor and cost required for allele frequency estimation is reduced, compared with the allele-counting approach, which requires the typing of each individual.
Acknowledgments
We thank Dr. Hidenori Tachida of Kyushu University, Fukuoka, for discussion of the statistical analysis of the data; Dr. Hirokazu Furuya of Kyushu University Medical School, for supplying the DNA; and Drs. Marianne Hane and H. Michael Wenz of Applied Biosystems, for supplying the polymer for capillary electrophoresis. PolyPhred, Phred-Phrap, and Consed software were kindly made available by Drs. Deborah Nickerson, Brent Ewing, David Gordon, and Phil Green, of the University of Washington, Seattle. This work was supported by Grants-in-Aid for Scientific Research on Priority Areas (Genome) from the Ministry of Education, Science, and Culture of Japan, and by the Special Coordination Funds for Promoting Science and Technology from the Science and Technology Agency, Japan.
Electronic-Database Information
Accession numbers and URLs for data in this article are as follows:
- GenBank, http://www.ncbi.nlm.nih.gov/Genbank/GenbankSearch.html
- Human SNP Database, Whitehead Institute Genome Research Center, http://www-genome.wi.mit.edu/SNP/human/index.html
- NCBI Single Nucleotide Polymorphism Database, http://www.ncbi.nlm.nih.gov/SNP/index.html (“Main search” for searching primers and sequences of STSs using accession numbers in dbSTS and for information on newly identified SNPs in this study [NCBI assay ID 458568-458582], “Method” for searching information on the allele frequencies of SNPs estimated in this study [“Method Q1” submitted by “KYUGEN”)
References
- Barcellos LF, Klitz W, Field LL, Tobias R, Bowcock AM, Wilson R, Nelson MP, Nagatomi J, Thomson G (1997) Association mapping of disease loci, by use of a pooled DNA genomic screen. Am J Hum Genet 61:734–747 [DOI] [PMC free article] [PubMed] [Google Scholar]
- Barnard R, Futo V, Pecheniuk N, Slattery M, Walsh T (1998) PCR bias toward the wild-type k-ras and p53 sequences: implications for PCR detection of mutations and cancer diagnosis. BioTechniques 25:684–691 [DOI] [PubMed] [Google Scholar]
- Collins A, Lonjou C, Morton NE (1999) Genetic epidemiology of single-nucleotide polymorphisms. Proc Natl Acad Sci USA 96:15173–15177 [DOI] [PMC free article] [PubMed] [Google Scholar]
- Ewing B, Hiller L, Wendl MC, Green P (1998) Base-calling of automated sequencer traces using Phred. I. Accuracy assessment. Genome Res 8:175–185 [DOI] [PubMed] [Google Scholar]
- Germer S, Holland MJ, Higuchi R (2000) High-throughput SNP allele-frequency determination in pooled DNA samples by kinetic PCR. Genome Res 10:258–266 [DOI] [PMC free article] [PubMed] [Google Scholar]
- Hayashi K, Kukita Y, Inazuka M, Tahira T (1998) In: Cotton RGH, Edkins E, Forrest S (eds) Mutation detection: a practical approach. IRL Press, Oxford, pp 7–24 [Google Scholar]
- Inazuka M, Tahira T, Hayashi K (1996) One-tube post-PCR fluorescent labeling of DNA fragments. Genome Res 6:551–557 [DOI] [PubMed] [Google Scholar]
- Inazuka M, Wenz HM, Sakabe M, Tahira T, Hayashi K (1997) A stream-lined mutation detection system: multi-color post-PCR fluorescence-labeling and SSCP analysis by capillary electrophoresis. Genome Res 7:1094–1103 [DOI] [PMC free article] [PubMed] [Google Scholar]
- Kondo H, Tahira T, Hayashi H, Oshima K, Hayashi K (2000) Microsatellite genotyping of post-PCR fluorescence labeled markers. BioTechniques 29:868–872 [DOI] [PubMed] [Google Scholar]
- Kruglyak L (1999) Prospects for whole-genome linkage disequilibrium mapping of common disease genes. Nat Genet 22:139–144 [DOI] [PubMed] [Google Scholar]
- Kwok P-Y, Carson C, Yager TD, Ankener W, Nickerson DA (1994) Comparative analysis of human DNA variations by fluorescence-based sequencing of PCR products. Genomics 23:138–144 [DOI] [PubMed] [Google Scholar]
- Lai E, Riley J, Purvis I, Roses A (1998) A 4-Mb high-density single nucleotide polymorphism-based map around human APOE. Genomics 54:31–38 [DOI] [PubMed] [Google Scholar]
- Nickerson DA, Taylor SL, Weiss KM, Clark AG, Hutchinson RG, Stengard J, Salomaa V, Vartiainen E, Boerwinkle E, Sing CF (1998) DNA sequence diversity in a 9.7-kb region of the human lipoprotein lipase gene. Nat Genet 19:233–240 [DOI] [PubMed] [Google Scholar]
- Nickerson DA, Tobe VO, Taylor SL (1997) PolyPhred: automating the detection and genotyping of single nucleotide substitutions using fluorescence-based resequencing. Nucleic Acids Res 25:2745–2751 [DOI] [PMC free article] [PubMed] [Google Scholar]
- Rish N, Teng J (1998) The relative power of family-based and case-control designs for linkage disequilibrium studies of complex human diseases I. DNA pooling. Genome Res 8:1273–1288 [DOI] [PubMed] [Google Scholar]
- Shaw SH, Carrasquillo MM, Kashuk C, Puffenberger EG, Chakravarti A (1998) Allele frequency distributions in pooled DNA samples: applications to mapping complex disease genes. Genome Res 8:111–123 [DOI] [PubMed] [Google Scholar]
- Wang DG, Fan JB, Siao CJ, Berno A, Young P, Sapolsky R, Ghandour G, Perkins N, Winchester E, Spencer J, Kruglyak L, Stein L, Hsie L, Topaloglou T, Hubbell E, Robinson E, Mittmann M, Morris MS, Shen N, Kilburn D, Rioux J, Nusbaum C, Rozen S, Hudson TJ, Lander ES (1998) Large-scale identification, mapping, and genotyping of single-nucleotide polymorphisms in the human genome. Science 280:1077–1082 [DOI] [PubMed] [Google Scholar]