

Abstract
Tuberous sclerosis (TSC) is a relatively common hamartoma syndrome caused by mutations in either of two genes, TSC1 and TSC2. Here we report comprehensive mutation analysis in 224 index patients with TSC and correlate mutation findings with clinical features. Denaturing high-performance liquid chromatography, long-range polymerase chain reaction (PCR), and quantitative PCR were used for mutation detection. Mutations were identified in 186 (83%) of 224 of cases, comprising 138 small TSC2 mutations, 20 large TSC2 mutations, and 28 small TSC1 mutations. A standardized clinical assessment instrument covering 16 TSC manifestations was used. Sporadic patients with TSC1 mutations had, on average, milder disease in comparison with patients with TSC2 mutations, despite being of similar age. They had a lower frequency of seizures and moderate-to-severe mental retardation, fewer subependymal nodules and cortical tubers, less-severe kidney involvement, no retinal hamartomas, and less-severe facial angiofibroma. Patients in whom no mutation was found also had disease that was milder, on average, than that in patients with TSC2 mutations and was somewhat distinct from patients with TSC1 mutations. Although there was overlap in the spectrum of many clinical features of patients with TSC1 versus TSC2 mutations, some features (grade 2–4 kidney cysts or angiomyolipomas, forehead plaques, retinal hamartomas, and liver angiomyolipomas) were very rare or not seen at all in TSC1 patients. Thus both germline and somatic mutations appear to be less common in TSC1 than in TSC2. The reduced severity of disease in patients without defined mutations suggests that many of these patients are mosaic for a TSC2 mutation and/or have TSC because of mutations in an as-yet-unidentified locus with a relatively mild clinical phenotype.
Introduction
Tuberous sclerosis (TSC [MIM 605284, MIM 191092]) is an autosomal dominant condition characterized by seizures, mental retardation, and development of widespread hamartomatous lesions (Jozwiak et al. 1994; Kwiatkowski and Short 1994; Webb et al. 1996; Ewalt et al. 1998; Gomez et al. 1999). TSC affects 1/6,000–10,000 individuals (Sampson et al. 1989; Osborne et al. 1991). Two-thirds of cases are sporadic, without antecedent family history, reflecting a high spontaneous mutation rate. Inactivating mutations in either TSC1 or TSC2 cause this tumor suppressor–gene syndrome (European Tuberous Sclerosis Consortium 1993; van Slegtenhorst et al. 1997). TSC1 consists of a 3.4-kb coding region with 21 coding exons, spanning 50-kb genomic extent on 9q34, and TSC2 consists of a 5.4-kb coding region with 41 exons and spans 40-kb genomic extent on 16p13.
So far, 154 patients with mutations in TSC1 and 292 patients with mutations in TSC2 have been reported (Cheadle et al. 2000; Human Genetics Online Review Tables). Fifteen or more of these have been seen recurrently, but none accounts for >5% of all patients (European Tuberous Sclerosis Consortium 1993; Sampson et al. 1997; van Bakel et al. 1997; van Slegtenhorst et al. 1997, 1999; Au et al. 1998; Beauchamp et al. 1998; Kwiatkowska et al. 1998; Young et al. 1998; Jones et al. 1999). Most (88%) identified mutations are small changes—38% small deletions or insertions and 50% nonsense, splice-site, or missense point mutations. Large genomic deletions and rearrangements account for 12% of identified mutations and have been reported exclusively in TSC2. A number of methods have been used to identify mutations in these two genes: heteroduplex analysis using conformation-sensitive gel electrophoresis (van Slegtenhorst et al. 1997; Kwiatkowska et al. 1998), SSCP (Au et al. 1998; Beauchamp et al. 1998; Young et al. 1998; Jones et al. 1999; van Slegtenhorst et al. 1999), denaturing-gradient gel electrophoresis (Dabora et al. 1998), the protein-truncation test (van Bakel et al. 1997; Mayer et al. 1999), pulsed-field gel electrophoresis combined with Southern blotting (European Tuberous Sclerosis Consortium 1993; Sampson et al. 1997), and FISH (Michalet et al. 1997). The most comprehensive analysis performed to date in a large series of patients with TSC used a combination of SSCP and heteroduplex analysis, as well as screening for large deletions by several methods, and yielded mutations in 130 of 163 patients: a detection rate of 80%, which improves to 87% if some patients without defined mutations after large deletion screening are removed (Jones et al. 1999, 2000).
In this same series, it appeared that patients with mutations in TSC1 (hereafter denoted “TSC1 disease” and distinguished from “TSC2 disease”) had less mental retardation on average than patients with TSC2 disease. To avoid bias, the analysis was restricted to sporadic patients only, and 59 (67%) of 88 patients with sporadic TSC2 had mental retardation, compared with 4 (32%) of 13 patients with TSC1 disease (P=.0145, Fisher's exact test; Jones et al. 1999). However, this has not been seen uniformly (Kwiatkowska et al. 1998; Niida et al. 1999; van Slegtenhorst et al. 1999), and no study has examined the influence of TSC1 disease versus TSC2 disease on the myriad other clinical features of TSC.
Here we present an analysis of 224 unselected and sequentially ascertained patients with TSC, derived largely from pediatric neurology practices in three separate geographic locations. We have developed a combination of efficient methods to comprehensively identify mutations in TSC1 and TSC2. A clinical instrument for recording clinical data on patients with TSC was also developed and applied at each center. These methods have yielded both a very high detection rate of mutations in TSC1 and TSC2 in these unselected patients (83% overall) and significant new information on the difference in phenotype between patients with TSC1 and TSC2 disease.
Subjects and Methods
Patients and Clinical Assessment
The patients with TSC that we studied were a consecutive, unselected series of 224 index patients derived from four sources: 36 were obtained through patient-derived requests, all from the United States; 105 were derived from an academic pediatric neurology practice in Warsaw, Poland; and 83 were derived from academic pediatric neurology practices in the United States (65 from Cincinnati and 18 from Boston). All patients provided informed consent, and this study was approved by institutional review boards at each institution. All patients encountered at each institution with an initial diagnosis of TSC were offered participation. Although initially included in these cohorts, 14 patients were not studied because of either a lack of an adequate DNA sample or failure to meet formal TSC diagnostic criteria (Roach et al. 1998). An additional three patients were dropped after partial mutational analysis, when it was discovered that they failed to meet diagnostic criteria.
Standardized clinical information was collected prospectively on all patients and updated by additional studies and follow-up during the period of mutational analysis. This information consisted of the age and family status of the patient and 16 different measures of both the clinical and radiographic features of TSC (see fig. 1). The information was collected by persons blinded to the mutational status of the patients. General clinical features of the patients from Warsaw, Cincinnati, and Boston were determined by clinicians experienced in the manifestations of TSC (S.J., D.F., and E.T.). Medical records were reviewed for the patients studied through mail solicitation. Specialized examinations or radiographic studies were used to assess the extent of lesions in the brain, kidney, liver, retina, and heart. Most manifestations were graded according to a binary scale (present or absent), but several features were graded in severity at 3–5 levels, including mental retardation, facial angiofibromas, kidney and liver angiomyolipomas (AMLs), kidney cysts, and lung involvement. In addition, for a subset of patients in which high-resolution brain magnetic-resonance imaging (MRI) and/or computed-tomography (CT) scans were available, the number of subependymal nodules (SENs) and cortical tubers were counted. Most of these studies were reviewed by a single radiologist (J.E.).
Figure 1.

TSC clinical features grading form
Mutational Analysis of Exons by Denaturing High-Performance Liquid Chromatography (DHPLC)
DNA was extracted from leukocytes or from Epstein-Barr virus–transformed lymphoblastoid cell lines by use of standard methods. Primers were designed by use of TSC1 and TSC2 genomic sequence information (GenBank accession numbers AC002318, AC002096, and AC005600) and the GCG version 8 primer program or the WI Primer 3 program. Amplified fragments were 186–507 bp in length. A detailed description of our method of performing DHPLC is published elsewhere, describing its application to exons 1–20 of TSC2 (Choy et al. 1999). For analysis of the remaining exons of these genes, similar methods were used, and complete information on amplicons and run conditions is available (Tuberous Sclerosis [TSC] Project Web site). After completion of analysis of patient DNA samples using a single set of run conditions for DHPLC, we modified the temperature for 20 exons in which analysis by the WAVEMAKER 3.4 software (Transgenomic) or by the DHPLC MELT program (N. F. Hansen and P. Oefner) suggested that higher or lower temperatures might detect additional sequence variants. All samples remaining without identified mutations were then analyzed under these different conditions. Four additional mutations were detected in this manner.
PCR was performed using AmpliTaq Gold (PE Biosystems) in 20-μl reactions with 10–50 ng of genomic DNA. Amplified fragments showing a DHPLC elution shift were confirmed in a repeat analysis. Sequence variation was identified by bidirectional sequencing using an ABI 377 machine (PE Biosystems) with Big Dye terminator chemistries (PE Biosystems). Sequence traces were analyzed using the GAP4 program of the Staden package, and sequence variation within TSC1 and TSC2 was positioned using the VARIATION WIZARD program (Tuberous Sclerosis [TSC] Project). This program permits inspection of genomic and cDNA sequence information for alignment and interpretation of sequence variation. It is freely available from M.P.R. In two amplicons with DHPLC shifts, no sequence variation could be detected, despite repeated sequencing analyses. In those cases, the amplified fragments were cloned and tested by mixing studies and DHPLC analysis, and the variant sequence was identified by sequencing.
Missense mutations were considered to be nonconservative amino acid substitutions if they had a negative score in the BLOSUM matrix (Henikoff and Henikoff 1992). A table of polymorphisms discovered during this study is available (Tuberous Sclerosis [TSC] Project Web site).
Mutational Analyses for Large Deletions and Insertions
Two methods were used for identification of larger deletions, insertions, and genomic rearrangements. First, long-range PCR was performed (Dabora et al. 2000). Large amplicons for long-range PCR were chosen to provide overlapping coverage of the entire 40-kb genomic extent of TSC2 in 19 fragments of size 1.7–11.6 kb. PCR products were analyzed by electrophoresis on 0.8% agarose gels with long run times, to permit visual identification of fragments smaller or larger than normal. Such fragments were gel purified and reamplified with additional PCR primers, to permit isolation and sequencing of the junction site of all apparent deletions and insertions. Multiplex long-range PCR was also performed using a single forward primer and multiple reverse primers (each >15 kb from the forward primer), to enable detection of larger deletion fragments.
Second, quantitative PCR was performed for detection of large deletions and duplications (Yau et al. 1996; Morgan et al. 1999). 6-FAM–labeled forward primers were used with unlabeled reverse primers for multiplex PCR of selected TSC2 exons. Primer sequences were identical to those used for single TSC2 exon amplification used for DHPLC (see Tuberous Sclerosis [TSC] Project Web site). Sets of exons of TSC2 were amplified in multiplex PCR as follows—set 1: exons 4, 7, and 26; set 2: exons 7, 16, and 26; and set 3: exons 25, 26, and 36. In each of these sets, TSC1 exon 17 was also amplified as a control. PCR conditions were identical to those used for DHPLC analysis, except that multiple primer pairs were present in individual PCR reactions at concentrations from 0.25 to 0.75 μM to normalize the amount of amplicon generated for each exon, and only 18 cycles of PCR were performed, to ensure that amplification was still in the exponential phase. PCR products were analyzed by electrophoresis of 2 μl on 4.25% polyacrylamide gels on the ABI 377. Electropherogram patterns were analyzed and quantitated using GENESCAN version 3.1 software (PE Biosystems). All samples were analyzed in duplicate, and those that indicated a probable deletion were repeated for confirmation. Every PCR reaction set and gel run also included at least one positive control sample with a deletion previously defined by long-range PCR and five control samples.
To determine whether a deletion or duplication of an exon had occurred, we calculated the relative amount of each TSC2 exon produced in the multiplexed PCR reaction according to the method described elsewhere (Yau et al. 1996). For example, to calculate the dosage quotient (DQ) of TSC2 exon 4 in an unknown sample (U), in comparison with a control sample (C), the following formula was used:
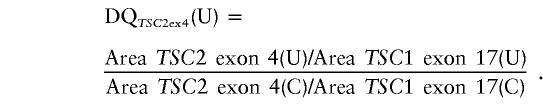 |
We actually used the average value of five control samples run on the same gel as the denominator in this calculation. Control samples have DQ values in the range of 0.80–1.25 (Yau et al. 1996). DQ mean values <0.61 were scored as exon deletions, and mean values >1.30 were scored as exon duplications. For each deletion patient, the SD of ⩾4 DQ measurements was ⩽0.11; for each duplication patient, the SD of ⩾4 DQ measurements was ⩾0.41. One patient DNA sample repeatedly gave intermediate values in the 0.61–0.80 interval, average 0.73 (n=4), which we scored as a mosaic deletion.
Paternity and Maternity Testing
Paternity and maternity testing was performed for all families in which TSC2 missense mutations were found in sporadic patients and in which parental DNA samples were available. This was performed by analysis of at least three highly informative microsatellite markers (D15S127, D15S131, D16S515, and D16S520), using fluorescently labeled primers and analysis by gel electrophoresis on the ABI 377 and GENESCAN version 3.1 software.
Statistical Analysis
Statistical comparisons were performed using the STATVIEW version 5.0 package for the Macintosh. Fisher's exact test was used for the analysis of categorical variables, and Student’s unpaired t test was used for the analysis of quantitative variables.
Results
Patient Characteristics
Two hundred twenty-four patients meeting formal diagnostic criteria for TSC were studied. These were derived by sequential ascertainment without selection and were primarily from three academic pediatric neurology settings (tables 1and 2). The index patients were 1–51 years old, with a median age of 10 years and an average age of 11.5 years. Eighty-three percent of index patients were sporadic cases, 8% were from families in which there were two affected individuals, and 9% were from families in which there were three or more affected individuals. All of the two-patient families contained an affected parent and child; there were no families with two affected children and unaffected parents.
Table 1.
Patient Characteristics
|
No. (%) of Patients Aged |
|||||
| Characteristic | 1–5 years | 6–10 years | 11–15 years | 16–25 years | >25 years |
| All | 67 (30) | 54 (24) | 45 (20) | 42 (19) | 16 (7) |
| Sporadic TSC | 56 (31) | 44 (24) | 36 (20) | 35 (19) | 12 (7) |
| Familial TSC | 10 (26) | 10 (26) | 9 (23) | 6 (16) | 3 (8) |
| TSC1 mutation | 7 (25) | 8 (32) | 3 (11) | 7 (25) | 3 (11) |
| TSC2 mutation | 45 (28) | 36 (23) | 35 (22) | 33 (21) | 9 (6) |
Table 2.
Patient Origins and Families
| Characteristic | No. (%) of Patients |
| Patient origin: | |
| US/mail | 36 (16) |
| Warsaw | 105 (47) |
| Cincinnati | 65 (29) |
| Boston | 18 (8) |
| Family: | |
| Sporadic | 183 (83) |
| Small familya | 17 (8) |
| Familyb | 21 (9) |
| Unknown | 3 |
Denotes a family in which there are only two affected members.
Denotes a family in which three or more individuals are affected.
Detailed clinical data were collected on each patient, using a standardized clinical instrument that covers the classic clinical features of TSC, including both physical and radiographic findings (fig. 1). Several clinical features were graded according to severity. For a subset of patients in which high resolution brain CT and/or MRI scans were available, the number of SENs (CT or MRI) and/or cortical tubers (MRI) were counted. A summary of the clinical findings in these patients is presented in table 3. Adjusting for age, the prevalence of brain, kidney, and skin involvement in this cohort is similar to that in other series (Jozwiak et al. 1992, 1994, 1998; Webb et al. 1996; Ewalt et al. 1998; Gomez et al. 1999), with a slightly higher frequency of neurologic manifestations, consistent with ascertainment of most patients through neurology practices.
Table 3.
Clinical Features of the Patients, with Comparisons of Sporadic versus Familial and TSC1 Versus TSC2 Mutation Subsets[Note]
| All (n = 224) | P, Sporadic (n= 38) vs. Familial (n = 183) | TSC1 SporadicCases (n = 22) | TSC2 SporadicCases (n = 129)a | P, Sporadic TSC1 vs. TSC2 | |
| Age range | 1–51 (11.5) | NS | 2–51 (13.4) | 1–44 (11.2) | NS |
| Median age (years) | 10 | 9 | 10 | ||
| Neurologic features: | |||||
| Seizures: | 202/223 (93%) | NS (.055) | 19/22 (86%) | 127/128 (99%) | .02 |
| Age range | 1–50 (11.5) | 2–50 (12.3) | 1–44 (11.4) | NS | |
| Mental handicap (age ⩾6): | |||||
| Mild + moderate + severe | 102/155 (66%) | NS | 7/14 (50%) | 66/90 (73%) | NS |
| Moderate + severe | 65/155 (42%) | NS | 2/14 (14%) | 41/90 (46%) | .04 |
| Age range | 6–44 (12.0) | 9–24 (13.1) | 6–44 (11.7) | NS | |
| Mean grade (scale 0–3) | 1.25 | .67 | 1.4 | .007 | |
| Subependymal nodules: | 177/193 (92%) | NS | 15/20 (75%) | 127/136 (93%) | .02 |
| Age range | 1–51 (11.6) | 2–51 (13.4) | 1–44 (11.6) | NS (.055) | |
| Mean SEN number | 4.7 | 1.7 | 6.7 | .0002 | |
| SEGA: | 23/207 (11%) | NS | 2/21 (9%) | 13/118 (12%) | NS |
| Age range | 3–44 (14.7) | 9–11 (10) | 4–44 (15.9) | ||
| Tubers (any): | 100/113 (88%) | NS | 13/15 (87%) | 55/60 (92%) | NS |
| >10 tubers | 40/78 (51%) | NS | 1/9 (11%) | 29/42 (69%) | .002 |
| Age range | 1–50 (11.4) | 2–50 (11.7) | 1–44 (11) | NS | |
| Mean tuber number | 10.2 | 4.4 | 12.9 | .002 | |
| Renal features: | |||||
| Kidney cysts: | |||||
| Grades 1–4 | 52/207 (25%) | NS | 3/19 (16%) | 30/122 (25%) | NS |
| Grades 2–4 | 29/207 (14%) | 0/19 (0%) | 19/122 (16%) | NS (.08) | |
| Grade 4 | 6/207 (3%) | 0/19 (0%) | 5/122 (4%) | NS | |
| Age range | 1–50 (13.6) | 9–50 (26.3) | 1–44 (13.8) | NS (.07) | |
| Mean grade (scale 0–4) | .46 | .16 | .52 | NS (.14) | |
| Kidney AMLs: | 113/207 (55%) | NS | 6/19 (31%) | 72/121 (60%) | .03 |
| Age range | 1.5–44 (13.2) | 9–21 (11.8) | 1.5–44 (13.8) | NS | |
| Mean grade (scale 0–3) | .83 | .32 | .97 | .006 | |
| Skin features: | |||||
| Hypomelanotic macules: | 202/219 (92%) | .02 | 20/21 (95%) | 124/128 (97%) | NS |
| Age range | 1–51 (11.2) | ||||
| Facial angiofibromas (age ⩾2): | 155/208 (75%) | NS | 13/22 (59%) | 95/121 (78%) | NS |
| Age range | 2–51 (14.3) | 4–51 (18.5) | 2–44 (13.6) | NS (.09) | |
| Mean grade (scale 0–3) | 1.4 | .9 | 1.5 | .02 | |
| Shagreen patch: | 100/210 (48%) | NS | 7/20 (35%) | 68/130 (52%) | NS |
| Age range | 2–51 (13.1) | 4–51 (18.9) | 2–42 (12.7) | NS (.06) | |
| Ungual fibroma: | 39/215 (18%) | NS | 5/20 (25%) | 26/128 (20%) | NS |
| Age range | 4–51 (21) | 6–51 (29.2) | 4–42 (18.7) | NS (.07) | |
| Forehead plaque: | 74/217 (34%) | NS | 2/20 (10%) | 51/128 (40%) | .01 |
| Age range | 2–42 (13.3) | 6–20 (13) | 2–42 (13.5) | NS | |
| Other features: | |||||
| Liver AMLs: | 12/195 (6%) | NS | 0/15 | 9/117 (8%) | NS |
| Age range | 3–38 (16.7) | 10–38 (17.4) | |||
| Retinal hamartomas: | 46/192 (24%) | NS | 0/16 | 32/117 (27%) | .01 |
| Age range | 1–44 (12.8) | 1.5–44 (13.2) | |||
| Cardiac rhabdomyoma: | 100/195 (51%) | NS | 8/17 (47%) | 58/117 (50%) | NS |
| Age range | 1–33 (9.6) | 3–20 (7.6) | 1–23 (8.5) | NS | |
| LAM (females, age ⩾16): | 5/48 (11%) | NS | 0/5 | 3/17 (18%) | NS |
| Age range | 18–37 (27.4) | 18–37 (25.3) |
Note.— Age range (average age [in years]) considers all patients with positive findings. SEGA = subependymal giant cell astrocytoma.
Mosaic case with large TSC2 deletion not included in this analysis.
We compared the clinical features in sporadic patients with the clinical features seen in index members of familial cases (table 3). The familial-case index patients had a somewhat lower frequency of seizures than sporadic patients (82% vs. 93%, P=.055) and a significantly lower frequency of hypomelanotic macules (82% vs. 94%, P=.02). However, there was no significant difference between those two groups for all other features. When this analysis was repeated considering only those patients with TSC2 mutations (see below), there were no significant differences.
Mutation Analysis
We used three complementary strategies for mutation detection in these patients: DHPLC analysis of amplified exons, long-range PCR amplification within the TSC2 gene, and quantitative PCR analysis of TSC2 amplicons. These were performed in a sequential manner and were chosen on the basis of their sensitivity and the known mutation spectrum of TSC1 and TSC2 genes (Cheadle et al. 2000).
When DHPLC was used, 166 small mutations were detected in these 224 patients (table 4 and fig. 2); 138 (83%) of these mutations occurred in TSC2 and 28 (17%) in TSC1. There were 44 (27%, 12 in TSC1 and 32 in TSC2) small deletions, 14 (8%, 3 in TSC1 and 11 in TSC2) small insertions, 48 (29%, 11 in TSC1 and 37 in TSC2) nonsense mutations, 29 (17%, 2 in TSC1 and 27 in TSC2) point mutations affecting splice sites, and 31 (19%, all in TSC2) missense mutations.
Table 4.
Small Mutations in TSC1 and TSC2 Identified by DHPLC
| Patient | Gene/Exona | Mutationb | MutationTypec | FamilyTyped | Denovoe | Reportedf | First Author (year) |
| LR115 | TSC1E07 | 868-869delTT | del | S | u, o | van Slegtenhorst (1997) | |
| BG1601 | TSC1E08 | 954C→T 245R→X | non | F | u, o | ||
| BG401 | TSC1E08 | 954C→T 245R→X | non | S | u, o | ||
| BHM3901 | TSC1E08 | 954C→T 245R→X | non | S | u, o | ||
| BHM4201 | TSC1E09 | 970insT | ins | S | n | ||
| BHM1001 | TSC1E09 | 1055–1056delTC | del | S | n | ||
| LR821 | TSC1E09 | 1122–1134+1del14 | del | S | u | Kwiatkowska (1998) | |
| LR721 | TSC1E10 | 1209–1210delCT | del | S | o | van Slegtenhorst (1997) | |
| BHM7001 | TSC1E15 | 1746C→T 509R→X | non | smF | u, o | ||
| ONK431 | TSC1E15 | 1746C→T 509R→X | non | S | u, o | van Slegtenhorst (1997) | |
| BG101 | TSC1E15 | 1918delC | del | S | n | ||
| ONK381 | TSC1E15 | 1929–1930delAG | del | S | u, o | van Slegtenhorst (1997) | |
| ONK661 | TSC1E15 | 1950G→T 577E→X | non | F | u | ||
| ONK421 | TSC1E15 | 2109–2112delAAAG | del | S | u, o | van Slegtenhorst (1997) | |
| ONK741 | TSC1E15 | 2109–2112delAAAG | del | smF | u, o | Kwiatkowska (1998) | |
| LR911 | TSC1E15 | 2124–2125delAC | del | S | u, o | van Slegtenhorst (1997) | |
| LR251 | TSC1E15 | 2181C→T 654Q→X | non | S | u | Kwiatkowska (1998) | |
| BG1001 | TSC1E17 | 2295C→T 692R→X | non | S | o | ||
| BHM3301 | TSC1E17 | 2355–2359delCATCG | del | S | n | ||
| ONK711 | TSC1E17 | 2394–2397delAAAG | del | S | u | Kwiatkowska (1998) | |
| ONK641 | TSC1E18 | 2448C→T 743Q→X | non | U | u, o | van Slegtenhorst (1997) | |
| BHM4601 | TSC1E18 | 2520C→T 767Q→X | non | S | n | ||
| ONK781 | TSC1E18 | 2577C→T 786R→X | non | S | u, o | van Slegtenhorst (1997) | |
| BHM5101 | TSC1E19 | 2722insA | ins | S | n | ||
| LR100 | TSC1E20 | 2729–2108delAAAC | del | S | u, o | Kwiatkowska (1998) | |
| BG801 | TSC1E20 | 2790insG | ins | F | n | ||
| BHM2501 | TSC1I04 | 432–1G→A | spl | S | o | ||
| BHM7101 | TSC1I04 | 432–1G→A | spl | S | o | ||
| ONK121 | TSC2E03 | 268C→T 90Q→X | non | S | u | Choy (1999) | |
| ONK1071 | TSC2E04 | 357delC | del | S | u | Choy (1999) | |
| ONK841 | TSC2E04 | 415delA | del | S | u | Choy (1999) | |
| LR811 | TSC2E05 | 569insA | ins | S | u | Choy (1999) | |
| ONK221 | TSC2E06 | 618C→A 206C→X | non | S | n | ||
| ONK451 | TSC2E07 | 731G→A 244C→Y | mis-c | S | Yes | n | |
| LR841 | TSC2E07 | 759C→A 253C→X | non | S | n | ||
| ONK861 | TSC2E07 | 774G→C 258K→N | mis-spl-c | S | Yes | u | Choy (1999) |
| ONK311 | TSC2E08 | 782G→C 261R→P | mis-pr | S | u | Choy (1999) | |
| ONK831 | TSC2E08 | 826–827delAT | del | S | o | ||
| BHM602 | TSC2E09 | 871insC | ins | S | u | Choy (1999) | |
| BHM3601 | TSC2E09 | 911G→A 304W→X | non | S | n | ||
| BHM1103 | TSC2E09 | 972C→G 324Y→X | non | S | u | Choy (1999) | |
| ONK251 | TSC2E09 | 972C→G 324Y→X | non | F | u | ||
| LR951 | TSC2E10 | 1082T→C 361L→P | mis-c | S | Yes | u | Choy (1999) |
| BHM5301 | TSC2E10 | 1093–1095delATC 365delI | in-f del-c | S | o | ||
| ONK341 | TSC2E10 | 1096G→T 366E→X | non | S | n | ||
| BHM1401 | TSC2E11 | 1219T→G 407Y→D | mis-pr | S | u, o | Choy (1999) | |
| ONK1031 | TSC2E11 | 1255C→T 419P→S | mis-spl-c | S | Yes | n | |
| Z61 | TSC2E12 | 1336C→T 446Q→X | non | S | u | Choy (1999) | |
| BHM4701 | TSC2E13 | 1372C→T 458R→X | non | S | o | ||
| BHM5701 | TSC2E13 | 1372C→T 458R→X | non | S | o | ||
| ONK351 | TSC2E13 | 1372C→T 458R→X | non | S | o | ||
| ONK881 | TSC2E13 | 1372C→T 458R→X | non | S | o | ||
| ONK1001 | TSC2E13 | 1407delG | del | S | n | ||
| BHM4401 | TSC2E14 | 1472C→A 491S→X | non | S | n | ||
| ONK1091 | TSC2E14 | 1513C→T 505R→X | non | S | o | ||
| BHM1601 | TSC2E16 | 1783C→T 595Q→X | non | S | n | ||
| LR601 | TSC2E16 | 1831C→T 611R→W | mis-c | S | u, o | Choy (1999) | |
| ONK571 | TSC2E16 | 1831C→T 611R→W | mis-c | S | u, o | Choy (1999) | |
| BHM3201 | TSC2E16 | 1832G→A 611R→Q | mis-c | U | Yes | o | |
| BHM4301 | TSC2E16 | 1832G→A 611R→Q | mis-c | S | Yes | o | |
| KS31 | TSC2E18 | 1965insT | ins | S | n | Choy (1999) | |
| BHM802 | TSC2E18 | 2081–2083delTGC 694delL | in-f del-c | S | Yes | u | Choy (1999) |
| ONK1151 | TSC2E19 | 2108G→A 703W→X | non | S | o | ||
| LR941 | TSC2E19 | 2158–2171insGTCCCTGCGCTATA | ins | S | u | Choy (1999) | |
| ONK551 | TSC2E19 | 2182delT | del | S | n | ||
| BHM2301 | TSC2E19 | 2210–2214insGCTCT | ins | S | n | ||
| LR901 | TSC2E20 | 2225C→G 742S→X | non | S | u | Choy (1999) | |
| ONK111 | TSC2E20 | 2240–2241delTG | del | S | n | ||
| KS41 | TSC2E20 | 2251C→T 751R→X | non | S | u, o | Choy (1999) | |
| ONK531 | TSC2E20 | 2251C→T 751R→X | non | S | u, o | Choy (1999) | |
| BHM7301 | TSC2E20 | 2328C→A 776Y→X | non* | S | n | ||
| ONK731 | TSC2E21 | 2440G→A 814E→K | mis-c | F | n | ||
| ONK501 | TSC2E23 | 2687G→A 896W→X | non | S | n | ||
| ONK921 | TSC2E23 | 2714G→A 905R→Q | mis-pr | S | n | ||
| ONK291 | TSC2E24 | 2785G→T 929E→X | non | S | n | ||
| ONK161 | TSC2E26 | 3094C→T 1032R→X | non | F | n | ||
| ONK761 | TSC2E26 | 3094C→T 1032R→X | non | smF | n | ||
| LR921 | TSC2E26 | 3098insA | ins | S | n | ||
| ONK191 | TSC2E26 | 3098insA | ins | S | n | ||
| ONK23 | TSC2E26 | 3098insA | ins | S | n | ||
| ONK391 | TSC2E26 | 3099C→A 1033Y→X | non | S | n | ||
| ONK981 | TSC2E27 | 3178T→C 1060W→R | mis-c | S | Yes | n | |
| ONK1081 | TSC2E27 | 3212C→G 1071T→R | mis-c | S | Yes | n | |
| BHM1901 | TSC2E27 | 3214delA | del | F | n | ||
| ONK701 | TSC2E27 | 3220–3221delGG; 3221 insC | del | F | n | ||
| BHM3401 | TSC2E29 | 3412C→T 1138R→X | non | S | o | ||
| BHM401 | TSC2E29 | 3412C→T 1138R→X | non | S | o | ||
| BHM5801 | TSC2E29 | 3412C→T 1138R→X | non | S | o | ||
| LR831 | TSC2E29 | 3412C→T 1138R→X | non | S | o | ||
| ONK51 | TSC2E29 | 3574delC | del | S | n | ||
| ONK181 | TSC2E30 | 3685C→T 1229Q→X | non | S | n | ||
| Z51 | TSC2E30 | 3685C→T 1229Q→X | non | S | n | ||
| BHM6701 | TSC2E30 | 3750C→G 1250Y→X | non | S | n | ||
| BHM6501 | TSC2E32 | 3984delG | del | smF | n | ||
| BG1701 | TSC2E33 | 4096G→T 1366E→X | non | S | n | ||
| ONK401 | TSC2E33 | 4255delC | del | S | n | ||
| ONK41 | TSC2E33 | 4375C→T 1459R→X | non | S | o | ||
| Z81 | TSC2E33 | 4375C→T 1459R→X | non | S | o | ||
| BG1402 | TSC2E33 | 4422–4423delAG | del | F | o | ||
| ONK371 | TSC2E33 | 4427–4430insTAGA | ins | S | n | ||
| ONK961 | TSC2E33 | 4439T→A 1480L→X | non | S | n | ||
| BG1901 | TSC2E34 | 4544–4547delACAA | del | S | o | ||
| ONK271 | TSC2E35 | 4598–4626ins29bp | ins | smF | n | ||
| ONK1051 | TSC2E35 | 4606C→T 1536Q→X | non | S | n | ||
| ONK1181 | TSC2E35 | 4645T→A 1549Y→N | mis-pr | S | n | ||
| BHM1801 | TSC2E35 | 4655–4657delAAG 1552delE | in-f del-c | S | Yes | n | |
| ONK1121 | TSC2E36 | 4672G→A 1558E→K | mis-c | S | Yes | n | |
| ONK11 | TSC2E36 | 4790T→C 1597L→P | mis-c | S | Yes | n | |
| ONK891 | TSC2E36 | 4823–4825delACT 1608delY | in-f del-pr | S | n | ||
| BHM503 | TSC2E36 | 4825–4831delTGCTGGC | del | S | n | ||
| BHM3801 | TSC2E37 | 4854delC | del | S | n | ||
| ONK751 | TSC2E37 | 4927A→C 1643N→H | mis-pr | S | n | ||
| ONK561 | TSC2E37 | 4934–4935delTT | del | smF | o | ||
| BHM3001 | TSC2E37 | 4943T→C 1648I→T | mis-pr | S | n | ||
| ONK91 | TSC2E37 | 4952A→G 1651N→S | mis-spl-c | F | o | ||
| ONK581 | TSC2E37 | 4989insG | ins | S | n | ||
| BHM103 | TSC2E38 | 5024C→T 1675P→L | mis-c | F | o | ||
| BHM2601 | TSC2E38 | 5024C→T 1675P→L | mis-c | S | o | ||
| LR851 | TSC2E38 | 5024C→T 1675P→L | mis-c | S | Yes | o | |
| ONK61 | TSC2E38 | 5024C→T 1675P→L | mis-c | S | o | ||
| ONK71 | TSC2E38 | 5024C→T 1675P→L | mis-c | S | o | ||
| ONK991 | TSC2E38 | 5024C→T 1675P→L | mis-c | S | o | ||
| BHM6101 | TSC2E38 | 5051–5068+16del34 | del* | S | o | ||
| ONK681 | TSC2E39 | 5108T→G 1703V→G | mis-pr | S | n | ||
| ONK871 | TSC2E39 | 5126C→G 1709P→R | mis-c | S | Yes | n | |
| BHM6301 | TSC2E39 | 5126C→T 1709P→L | mis-spl-c | S | Yes | o | |
| ONK591 | TSC2E39 | 5126C→T 1709P→L | mis-spl-c | S | Yes | o | |
| ONK81 | TSC2E40 | 5167T→C 1723S→P | mis-pr | S | n | ||
| BG301 | TSC2E40 | 5238–5255del18 1746delHIKRLR | in-f del-c | smF | o | ||
| LR61 | TSC2E40 | 5238–5255del18 1746delHIKRLR | in-f del-c | S | o | ||
| LR801 | TSC2E40 | 5238–5255del18 1746delHIKRLR | in-f del-c | S | o | ||
| LR871 | TSC2E40 | 5238–5255del18 1746delHIKRLR | in-f del-c | S | Yes | o | |
| ONK1101 | TSC2E40 | 5238–5255del18 1746delHIKRLR | in-f del-c | S | Yes | o | |
| ONK1141 | TSC2E40 | 5238–5255del18 1746delHIKRLR | in-f del-c | S | Yes | o | |
| ONK231 | TSC2E40 | 5238–5255del18 1746delHIKRLR | in-f del-c | S | o | ||
| ONK261 | TSC2E40 | 5238–5255del18 1746delHIKRLR | in-f del-c | S | o | ||
| ONK281 | TSC2E40 | 5238–5255del18 1746delHIKRLR | in-f del-c | S | o | ||
| BHM302 | TSC2E40 | 5252–5259+19del27 | del | F | n | ||
| ONK522 | TSC2E40 | 5252–5259+19del27 | del | smF | n | ||
| ONK362 | TSC2I01 | 138+1G→A | spl | F | o | ||
| ONK901 | TSC2I01 | 138+5G→A | spl | S | Yes | u | Choy (1999) |
| BG1501 | TSC2I03 | 336+2T→G | spl | S | n | ||
| Z21 | TSC2I03 | 337–1G→T | spl | S | u | Choy (1999) | |
| BG1802 | TSC2I05 | 600–2A→G | spl | S | n | ||
| BHM1301 | TSC2I07 | 774+2T→A | spl | S | u | Choy (1999) | |
| ONK211 | TSC2I08 | 849–1G→A | spl | S | u | Choy (1999) | |
| BG1301 | TSC2I09 | 976–15G→A | spl | S | o | ||
| ONK171 | TSC2I09 | 976–15G→A | spl | smF | o | ||
| ONK1061 | TSC2I11 | 1258–2A→C | spl | S | n | ||
| ONK631 | TSC2I11 | 1258–3C→G | spl | S | n | ||
| BG701 | TSC2I13 | 1444–1G→A | spl | S | o | ||
| BHM2001 | TSC2I18 | 2098–1G→A | spl | F | n | ||
| ONK821 | TSC2I19 | 2221–2A→C | spl | S | n | ||
| BHM2701 | TSC2I22 | 2639+1G→C | spl | S | n | ||
| LR931 | TSC2I23 | 2743–2A→C | spl | S | n | ||
| BG601 | TSC2I23 | 2743–2A→G | spl | U | n | ||
| ONK144 | TSC2I23 | 2743–1insGCCAG | spl | F | n | ||
| ONK601 | TSC2I26 | 3131+11–3131+28del18 | spl-pr | smF | n | ||
| ONK851 | TSC2I29 | 3610+1G→A | spl | S | n | ||
| BG201 | TSC2I32 | 4005+1G→T | spl | S | n | ||
| BHM902 | TSC2I35 | 4663–1G→A | spl | S | n | ||
| ONK131 | TSC2I35 | 4663–1G→A | spl | S | n | ||
| LR961 | TSC2I38 | 5069–1G→A | spl | S | n | ||
| ONK811 | TSC2I39 | 5160+1G→A | spl | smF | n | ||
| ONK331 | TSC2I39 | 5161–1G→A | spl | S | n | ||
| ONK514 | TSC2I39 | 5161–1G→A | spl | smF | n |
Mutations are listed in the order TSC1 exon mutations, TSC1 intron mutations, TSC2 exon mutations, TSC2 intron mutations.
Nomenclature is per Antonarakis (1998). TSC1 numbering uses A of initiator ATG as +222; TSC2 numbering uses A of initiator ATG as +1.
del = deletion; non = nonsense; ins = insertion; spl = splice site; mis = missense; in-fr del = in-frame deletion; mis-spl = missense and probable splice site change; c = confirmed; pr = probable. *, patient with two mutations.
S = sporadic; smF = family with two affected members; F = family with more than two affected members.
“Yes” means shown by parental DNA analysis to be de novo.
o = others; u = us (previous reports); n = novel.
Figure 2.

Map of the sites of small mutations in TSC1 and TSC2. Proportional drawings (boxes) of all of the exons of TSC1 and TSC2 are shown. Intron regions are not drawn to scale and are expanded only when a mutation is present. Mutation symbols are x = nonsense; ▪ = splice site; ▵ = deletion; ▿ = insertion; ○ = missense; and ▴ = in-frame deletion. A line separates mutations occurring at nearby but not identical nucleotide positions.
Missense and in-frame–deletion mutations accounted for 44 (32%) of 138 of all small TSC2 mutations and were not seen in TSC1. Thirty-five missense changes and in-frame deletions in TSC2 were confirmed as mutations (mis-c, in-f, del-c in table 4) if either the mutation was shown to be present in a sporadic patient with TSC and not present in parental samples or if similar evidence had been obtained elsewhere by others. When directly confirmed in this way, we also confirmed, by analysis using three microsatellite markers each with heterozygosity >80%, that parental samples were authentic. In nine cases in which parental samples were not available, eight missense changes and one in-frame deletion were considered to be probable mutations (mis-pr, in-f, and del-pr in table 4) if the change in amino acid was nonconservative. In addition, of the 23 unique missense changes in TSC2, 21 occurred at amino acids identical in rat and mouse Tsc2, and 20 occurred at amino acids identical in fugu (Kim et al. 1995; Kobayashi et al. 1995; Maheshwar et al. 1996). The other three residues that had changed in fugu were very conservative substitutions, in contrast to the missense mutations we identified. Four unique missense mutations (mis-spl in table 4) seen in five patients were predicted by computational analysis (Berkeley Drosophila Genome Project, Splice Site Prediction by Neural Network) to cause a change in RNA splicing.
Seventy-nine (48%) of the 166 small mutations are novel mutations never before reported; 130 of the 166 have not been reported by us previously. Twenty-one mutations were seen more than once in this cohort, from two to nine times, in a total of 59 patients. The most frequent mutation seen here, 5238–5255del18 1746delHIKRLR, is an in-frame deletion mutation that was seen in nine patients (4%) in this cohort. This deletion occurs in the sequence context of a direct repeat of 11 of the 18 residues lost in the deletion. Two patients were found to have two distinct mutations within TSC2. One patient had both a nonsense mutation and a missense mutation, and the other had both a deletion mutation and a missense mutation, in each case affecting different exons of TSC2. The missense mutations were confirmed in one case and were probable in the other.
Seventeen large-deletion and 3 large-duplication mutations were identified in TSC2, 6 by long-range PCR and 14 by quantitative PCR (table 5). Long-range PCR was performed using 33 different sets of amplification primers and detected 6 deletions, ranging in size from 440 bp to 39 kb. The deletion junctions have been sequenced in all cases, and four of these have been reported elsewhere (Dabora et al. 2000). The remaining 15 deletions/duplications were detected by quantitative PCR (fig. 3). Because our quantitative PCR assay analyzes only a subset of the TSC2 exons, the exact size and location of each deletion or duplication has not been determined. One patient was mosaic for a deletion of exons 25, 26, and 36, since the dosage quotients (see Subjects and Methods section) for these exons were consistently between 0.61 and 0.8.
Table 5.
Mutations in TSC2 Identified by Long-Range and Quantitative PCR
| Patient | TSC2 Deletion/Duplication | Detection Method |
| BHM1501 | 4.5-kb deletion, introns 2–5 | Long PCRa |
| BHM1701 | 39-kb deletion, introns 1–40 | Long PCRa |
| ONK 10-1 | 34-kb deletion, introns 1–33 | Long PCRa |
| ONK 101-1 | 1.4-kb deletion, exons 37–39 | Long PCRa |
| BG501 | 440-bp deletion, intron 39–3′ UTR | Long PCR |
| BHM 4001 | 465-bp deletion, introns 9–10 | Long PCR |
| BHM5401 | Duplication, exon 25 | Quantitative PCR |
| BHM5501 | Duplication exons 7, 16, and 25 | Quantitative PCR |
| BHM5901 | Duplication exons 16 and 25 | Quantitative PCR |
| JR 1-1 | Deletion, exons 7, 16, 25, 26, and 36 | Quantitative PCR |
| LR 89-1 | Deletion, exons 4, 7, 16, 25, 26, and 36 | Quantitative PCR |
| ONK 15-1 | Deletion, exons 25, 26, and 36 | Quantitative PCR |
| ONK 24-1 | Deletion, exon 36 | Quantitative PCR |
| ONK 46-1 | Deletion, exons 4, 7, 16, 25, 26, and 36 | Quantitative PCR |
| ONK 116-1 | Deletion, exons 4 and 7 | Quantitative PCR |
| BHM2901 | Deletion, exons 16, 25, and 26 | Quantitative PCR |
| BHM4901 | Deletion, exons 4, 7, 16, 25, 26, and 36 | Quantitative PCR |
| BHM6801 | Deletion, exon 36 | Quantitative PCR |
| ONK 95-1 | Deletion, exon 7 | Quantitative PCR |
| BG1201 | Mosaic deletion, exons 25, 26, and 36 | Quantitative PCR |
Reported elsewhere (Dabora et al. 2000).
Figure 3.

Analysis of deletions and duplication events by quantitative PCR. Representative electropherograms (left) and dosage quotient values (right) for 3 DNA samples analyzed by quantitative PCR: control sample (top); ONK102: 34-kb deletion in TSC2 identified by long-range PCR (middle); ONK151: deletion of TSC2 exons 25, 26, and 36 identified using quantitative PCR (bottom).
Genotype-Phenotype Comparisons
We examined the clinical manifestations of patients with different types of mutations to see whether there was any correlation between mutation type and specific clinical features. A major consideration in this analysis is the relative ages of patients in the subsets being compared, since many TSC clinical features are age-dependent in their expression (Jozwiak et al. 1994, 1998; Kwiatkowski and Short 1994; Webb et al. 1996; Gomez et al. 1999). For this reason, comparisons involving mental retardation were restricted to age ⩾6 years; those involving facial angiofibroma were restricted to age ⩾2 years, and those involving lymphangioleiomyomatosis of the lung were restricted to females age ⩾16 years. The first major comparison was between patients with TSC1 disease and those with TSC2 disease.
Sporadic patients with TSC1 disease had an age range, average age, and median age that was similar to that of sporadic patients with TSC2 disease (table 1 and top of table 3). However, the majority of clinical features were seen at a substantially higher frequency and/or severity in the set of patients with sporadic TSC2 than in the set of patients with sporadic TSC1 (table 3, 12/16 clinical measures), with statistically significant differences in eight clinical features. We initially excluded familial cases from this analysis, to avoid ascertainment bias, even though the difference between clinical features in familial cases and sporadic cases was relatively minor, as above. Seizures were significantly more common in patients with sporadic TSC2 than those with TSC1 (98% vs. 86%, P=.02); moderate to severe mental retardation was more frequent in patients with TSC2 (46% vs. 14%, P=.04), and the average level (scale 0–3) of mental retardation was also higher in patients with TSC2, compared with those with TSC1 (1.4 vs. 0.67, P=.007). These clinical manifestations were matched by similar differences in brain radiographic findings. Twenty-nine (69%) of 42 patients with TSC2 had >10 tubers identified by MRI examination, compared with 1 (11%) of 9 patients with TSC1 (P=.002); the average tuber count was significantly higher in patients with TSC2, compared with those with TSC1 (12.9 vs. 4.4, P=.002), and patients with TSC2 had more SENs than patients with TSC1 (6.7 vs. 1.7, P=.0002).
Renal cystic disease occurred at similar rates in patients with sporadic TSC2, compared with those with TSC1 (25% vs. 16%, P=NS), but patients with TSC1 who had renal cysts were also somewhat older than patients with TSC2 who had renal cysts (26.3 vs. 13.8 years, P=.07). There was also a higher frequency of grade 2–4 renal cystic disease in patients with TSC2 (19% vs. 0%, P=.08). Renal AMLs were seen at higher frequency and had a higher average grade in patients with TSC2, compared with those with TSC1 (60% vs. 31%, P=.03; mean grade 0.97 vs. 0.32, P=.006; respectively). Several dermatologic manifestations of TSC tended to be more severe in patients with TSC2 mutations. The mean grade of angiofibromas was higher in patients with TSC2 than in those with TSC1 (1.5 vs. 0.9, P=.02), despite the older average age of the patients with TSC1 who had those lesions, and a fibrous forehead plaque was seen more commonly in patients with TSC2 than in those with TSC1 (40% vs. 10%, P=.01). Although ungual fibroma were seen at similar frequency in the two groups, the average age of patients with TSC1 was significantly higher than that for patients with TSC2 with this finding (29.2 vs. 18.7 years, P=.07). Retinal hamartomas were also seen with increased frequency in the patients with TSC2, compared with those with TSC1 (27% vs. 0%, P=.01). There was a suggestion of an increased frequency of lymphangioleiomyomatosis (LAM) of the lung in patients with TSC2, compared with those with TSC1, but this did not achieve statistical significance because of small numbers of female patients of age >16 years (3/17 patients with TSC2 had LAM vs. 0/5 patients with TSC1).
When this analysis between TSC1 and TSC2 mutations was repeated using both sporadic patients and familial index patients, similar results were obtained with generally similar levels of confidence (table 6). The differences in the frequency of grade 2–4 kidney cysts (17% vs. 0%, P=.03) and mean grade of kidney cysts (0.55 vs. 0.125, P=.05) become significant in this larger population (table 6).
Table 6.
Clinical Features of Patients with NMI and Comparison with Patients Who Have TSC1 and TSC2 Mutations[Note]
| NMI (all)(n = 38) | TSC1 (all)(n = 28) | TSC2 (all)(n = 158) | P, T1 vs. T2 | P, T1 vs. NMI | P, T2 vs. NMI | |
| Age range (years) (average age) | 1–33 (9.8) | 2–51 (14.9) | 1–44 (11.3) | NS | NS | NS |
| Neurologic features: | ||||||
| Seizures | 25/37 (68%) | 24/28 (86%) | 153/158 (97%) | .03 | NS (.15) | <.0001 |
| Mental handicap (age ⩾6 years): | ||||||
| Mild + moderate + severe | 12/22 (54%) | 10/20 (50%) | 80/113 (71%) | NS (.08) | NS | NS (.14) |
| Moderate + severe | 9/22 (41%) | 4/19 (21%) | 52/113 (46%) | .05 | NS | NS |
| Mean MR gr (scale 0–3) | 1.1 | .79 | 1.49 | .02 | NS | NS |
| SENs: | 26/34 (76%) | 20/25 (80%) | 131/134 (98%) | .003 | NS | .0001 |
| Mean SEN number | 2.9 | 2.0 | 6.3 | .0005 | NS | .0008 |
| SEGA | 2/37 (5%) | 4/26 (15%) | 17/145 (12%) | NS | NS | NS |
| Tubers (any): | 19/24 (79%) | 15/18 (83%) | 66/71 (93%) | NS | NS | NS (.12) |
| >10 tubers | 6/20 (30%) | 1/11 (9%) | 34/47 (72%) | .0002 | NS | .002 |
| Mean tuber number | 6.9 | 4.3 | 12.9 | .0004 | NS | .002 |
| Renal features: | ||||||
| Kidney cysts: | ||||||
| Grades 1–4 | 6/34 (18%) | 3/24 (12.5%) | 43/149 (29%) | NS | NS | NS |
| Grades 2–4 | 4/34 (12%) | 0/24 (0%) | 25/149 (17%) | .03 | NS | NS |
| Grade 4 | 0/34 (0%) | 0/24 (0%) | 6/149 (4%) | NS | NS | NS |
| Mean grade | .32 | .125 | .55 | .05 | NS | NS |
| Kidney AMLs: | 16/35 (46%) | 7/24 (29%) | 89/148 (60%) | .007 | NS | NS |
| Mean grade | .66 | .29 | .96 | .001 | .05 | NS |
| Skin features: | ||||||
| Hypomelanotic macules | 26/35 (74%) | 26/27 (96%) | 150/157 (95%) | NS | .03 | .0004 |
| Facial angiofibromas (age ⩾2 years): | 21/36 (58%) | 18/28 (64%) | 116/155 (75%) | NS | NS | NS (.06) |
| Mean grade | 1.2 | 1.0 | 1.5 | .01 | NS | NS (.06) |
| Shagreen patch | 9/35 (26%) | 9/25 (36%) | 82/153 (54%) | NS | NS | .004 |
| Ungual fibroma | 3/35 (9%) | 5/25 (20%) | 31/155 (20%) | NS | NS | NS |
| Forehead plaque | 8/35 (23%) | 3/25 (12%) | 64/155 (42%) | .006 | NS | .05 |
| Other features: | ||||||
| Liver AMLs | 1/31 (3%) | 0/20 (0%) | 11/144 (8%) | NS | NS | NS |
| Retinal hamartomas | 5/28 (18%) | 0/20 (0%) | 41/144 (28%) | .004 | NS (.07) | NS |
| Cardiac rhabdomyoma | 19/34 (56%) | 9/21 (43%) | 72/140 (51%) | NS | NS | NS |
| LAM (females, age ⩾16 years) | 0/7 (0%) | 0/6 (0%) | 5/36 (14%) | NS | NS | NS |
Note.— Abbreviations are as in table 3.
We also compared the clinical features of the 38 patients in whom no mutations could be identified in separate analyses with patients with TSC1, patients with TSC2, and TSC1 and TSC2 patients combined (table 6). We expected that this group was a composite of patients whose mutations may not have been detected for several different reasons. The “no mutation identified” (NMI) group had clinical features that were generally less severe than those in patients with TSC2 mutations and were generally similar to clinical features of patients with TSC1 mutations. The NMI group had a lower incidence of seizures, mental retardation, cortical tubers, SENs, hypomelanotic macules, facial angiofibromas, Shagreen patch, and forehead plaque in comparison with patients with TSC2 mutations. They also had a lower average SEN count, tuber count, and grade of facial angiofibromas. Most of these comparisons were also significant when made between the NMI group and patients with both TSC1 and TSC2 combined. This may be partly because TSC2 cases significantly outnumber TSC1 cases. When NMI patients were compared with patients with TSC1, many clinical features were seen at similar frequencies (table 6). However, hypomelanotic macules (74% in NMI vs. 96% in TSC1, P=.03) were seen significantly less frequently in NMI patients, compared with patients with TSC1, whereas renal AMLs had greater severity in NMI patients, compared with patients with TSC1 (average level 0.66 vs. 0.29, P=.05).
A comparison of the clinical features of patients with different types of TSC2 mutations was also performed, to see whether there was any clinical correlation among those subsets. We divided the TSC2 mutations into two subsets for this analysis: first, chain-terminating small mutations (insertion, deletion, nonsense, and splice-site mutations) and large genomic deletions and second, non–chain-terminating mutations (missense and in-frame deletion mutations). This analysis was performed in two different ways, once with patients with TSC2 missense/splice mutations in the first subset and then with those patients in the second subset. In both comparisons, the only significant difference in clinical features was for Shagreen patch, which was seen less often in the missense/in-frame deletion group (38% vs. 59%, P=.04). We suspect that this single difference represents random chance. This provides further evidence that TSC2 missense mutations are pathogenic and inactivating similar to other TSC2 mutations.
Discussion
We have studied the largest series of patients with TSC yet reported and have identified mutations in 186 (83%) of 224 cases. Twenty-eight (12%) index patients were found to have mutations in TSC1, 138 (62%) were found to have small mutations in TSC2, 20 (9%) were found to have large genomic deletions in TSC2, and 38 (17%) had no mutation identified. The overall mutation detection rate increases to 190 (88%) of 217 if we include two unconfirmed missense mutations and two samples suspected of being mosaic cases with large TSC2 deletions, as well as correcting the denominator to exclude seven samples in which there was an inadequate DNA supply to complete the entire analysis. The great majority of these mutations, 148 (78%), have not been reported elsewhere. The cumulative mutation detection rate and distribution of mutations described here are similar to those reported in a British cohort of 150 patients with TSC by Sampson and coworkers over the past several years (Jones et al. 1997, 1999, 2000; Maheshwar et al. 1997). The major difference seen in comparison of these two series is that the British cohort has a somewhat higher frequency of genomic disruptions of TSC2 (15% vs. 9% in this study, P=NS). This is possibly due to ascertainment and/or selection bias, since there was a higher frequency of patients with TSC in the British cohort who have polycystic kidney disease (6% vs. 3% in this series).
We have developed two relatively novel yet technically simple strategies for detection of large genomic rearrangements within TSC2: long-range PCR (Dabora et al. 2000) and quantitative PCR (Yau et al. 1996). Long-range PCR can be performed in any current molecular laboratory, requiring only a PCR machine and agarose gel electrophoresis. Because a complete assay of the TSC2 gene by this method requires multiple PCR reactions, we perform this analysis only on patient samples in which no small mutation in TSC1 or TSC2 has been detected by DHPLC. Quantitative PCR analysis is also a relatively simple assay, requiring only fluorescently labeled primers, careful PCR technique, and a sequencing machine with fluorescent detection capability, such as the ABI 377 used here. The combination of the two assays should provide detection of all deletion mutations of size >400 bp within the TSC2 gene. A significant fraction of partial gene duplications and moderate size insertions are also detected by quantitative PCR and/or long-range PCR. Chromosomal translocations involving TSC2 are not detected by these methods, but these appear to be extremely rare (European Tuberous Sclerosis Consortium 1993; Sampson et al. 1997; Eussen et al. 1999; van Slegtenhorst et al. 1999).
In this analysis, we have found mutations in TSC1 in only 12% of all index patients, with very similar detection rates in sporadic (12%) and familial (13%) cases. The observation that TSC1 mutations account for only a small proportion (10%–20%) of all patients with TSC has now been made in several series studied in multiple laboratories (Kwiatkowska et al. 1998; Young et al. 1998; Jones et al. 1999; Niida et al. 1999; van Slegtenhorst et al. 1999). However, our observations of families contrasts somewhat with observations made of limited numbers of extended multigeneration families with TSC in which linkage and mutational studies indicate there is an approximately equal frequency of TSC1 and TSC2 mutations (Young et al. 1998; Jones et al. 1999; Niida et al. 1999; van Slegtenhorst et al. 1999). The predominance of TSC2 mutations in the families studied here appears to be primarily due to their small size, since nearly half of these families consist of just two affected individuals, and there are only six families that extend to three or four (three families each) generations. However, even among these extended families, five of six had mutations in TSC2. We conclude that the estimated frequency of TSC1 versus TSC2 mutations in familial cases, based on previous linkage studies, may have been biased because of the small numbers of families studied. Our data suggest that TSC2 mutations are substantially more frequent in both familial and sporadic cases than TSC1 mutations.
The greatly lower frequency of de novo mutations in TSC1 versus TSC2 (a ratio of 1:6 in this cohort) can be explained somewhat by examination of the genomic structure and types of mutations that occur in these genes. Deletion, insertion, and nonsense mutations occur at lower frequency in TSC1, compared with TSC2 (∼1:3 ratio), which is partially explained by the smaller size of the coding region (about two-thirds) and fewer number of exons (about one-half) in TSC1, compared with TSC2 (fig. 2). However, splice-site and missense mutations and genomic rearrangements are all very rare or not seen in TSC1, in contrast to TSC2. It is the deficiency of these latter mutation types that pushes down the frequency of de novo mutations in TSC1 to such a low level in comparison with TSC2. The differing spectrum and frequency of TSC1, compared with TSC2, mutations may be due to intrinsic differences in the regional genomic structure of the two genes. The lack of clearly pathogenic missense mutations in TSC1 suggests the possibility that such a mutation either has no effect or causes a different clinical phenotype, possibly through a dominant negative effect (Cheadle et al. 2000).
The detailed analysis of clinical phenotype and its relationship to mutation type performed here permits a delineation of the distinctions in clinical features associated with TSC1 versus TSC2 disease. TSC1 disease is less severe than TSC2, by a significant margin, in multiple clinical measures that relate to brain, kidney, dermatologic, and retinal involvement by TSC. The observations have value in the clinical setting in which genetic counseling is offered to patients with known mutations in either TSC1 or TSC2. It is clear, however, that there is a wide degree of variation in clinical phenotype for each of TSC1 and TSC2 mutations, so that a precise prediction of the severity of clinical features cannot be made in either case. This clinical variability is nicely demonstrated by the nine independent patients in this series with the TSC2 in-frame deletion mutation 5238–5255del18 1746delHIKRLR. The age range for eight of these patients was 7–28 years and all had seizures, but mental retardation ranged from none to severe, facial angiofibromas ranged from none to extensive (grade 3), and renal AMLs ranged from minimal to extensive (grades 1–3). Thus, there is extensive clinical variability even for identical mutations.
However, it is possible to derive some clinical guidelines in the assessment of patients with TSC. First, patients that are either sporadic cases or from small families are more likely to be due to TSC2 than TSC1 mutation (odds ratio 6:1). Second, as the severity of the disease and number of clinical features increases, so does the chance that the patient bears a TSC2 mutation. One way to consider this is to group all patients with any of the following clinical features: forehead fibrous plaque, liver AMLs, retinal hamartomas, or significant renal involvement (grade ⩾2 cysts or AMLs). This group represents the majority of patients with TSC in this series (124 [55%]). In this group, there were 3 (2%) TSC1 mutations, 104 (84%) TSC2 mutations, and 17 (14%) without a mutation identified. Thus, any of these clinical features strongly predicts that the patient has a TSC2 mutation. Conversely, in the group of patients without any of these features, TSC1 mutations are more common (25%).
There are at least two hypotheses to explain why TSC1 disease is less severe than TSC2 disease. First it is possible that second-hit events (following the Knudson two-hit model) occur less often in TSC1 than in TSC2. Second, it is possible that complete loss of hamartin, the TSC1 gene product, has different effects in cells, compared with the loss of tuberin, the TSC2 gene product.
The two hit model for hamartoma development in TSC postulates that second somatic mutations occur in the cells that give rise to TSC hamartomas (Green et al. 1994; Henske et al. 1996). This model has been well-proven by loss of heterozygosity analysis for the renal AMLs and cardiac rhabdomyomas of TSC, with more provisional evidence for hamartomas involving the brain and skin (Henske et al. 1996, 1997). A reduced level of somatic mutation in TSC1 (second-hit events), compared with TSC2, is implied by the reduced number of both cortical tubers (4.4 in TSC1 vs. 12.9 in TSC2, P=.002) and SENs (1.7 in TSC1 vs. 6.7 in TSC2, P=.0002) in patients with TSC1, compared with those with TSC2. This apparent difference in somatic mutation rates between TSC1 and TSC2 is concordant with the difference in germline mutation rates in the two genes. However, it is possible that tuber and SEN counting by MRI/CT scan only detects lesions above a certain size, so this may not provide an accurate count of second-hit events.
In addition, the extreme qualitative difference in kidney disease in patients with TSC1 versus TSC2 may be more consistent with the second hypothesis. No significant renal involvement was seen in any index patient with a TSC1 mutation in this series; all had either no or minimal (grade 1) renal cysts and AML. In contrast, significant renal involvement (grade ⩾2 renal cysts or AMLs) was seen in 27% of all the patients in this series, and mutations were identified in 53 (87%) of these 61 patients, all with TSC2. This distinction is rather striking and may fit better with a differential role of the gene products tuberin and hamartin in renal cell growth control.
Similar to reports elsewhere, we found that all six patients with polycystic kidney disease had a large deletion involving the 3′ end of the TSC2 gene and likely involving the adjacent PKD1 gene (Sampson et al. 1997). One of these patients was mosaic for this deletion.
Although it was not the primary intent of this study, we also examined the correlation between clinical features among this large patient set. Among all patients, 55 (73%) of 75 without mental retardation had seizures, whereas 138 (99%) of 139 with mental retardation had seizures (P<.0001), consistent with studies elsewhere that indicate that patients with TSC without seizures do not develop mental retardation at an appreciable rate (Gomez et al. 1999). In contrast, we found a relatively poor correlation between tuber count and mental retardation. Mean tuber counts were 7.5 for patients without mental retardation, 14.7 for mild, 9.7 for moderate, and 12.1 for patients with severe mental retardation. There was a correlation between any degree of mental retardation (tuber count 12.5) versus those without mental retardation (7.5, P=.0035). This finding is similar to reports elsewhere in which tuber count has correlated to a modest degree with mental retardation (Goodman et al. 1997). However, a rather striking correlation was seen between the extent of renal AMLs and mental retardation. In index patients of age ⩾6 years, 75 (76%) of 99 with kidney AMLs had some degree of mental retardation, whereas only 19 (44%) of 43 without such lesions had any degree of mental retardation (P=.0004). In addition, the mean grade of mental retardation in patients with AMLs (1.61) was significantly higher than in those without (0.84, P=.0004). Similar results were obtained when only patients with TSC2 were considered. This correlation between renal angiomyoplipomas and mental retardation in TSC is unexplained, although it has been noted elsewhere (O'Callaghan et al. 2000). A direct causative relationship seems biologically implausible, although it could be viewed as simply a correlation between severity of disease in two distinct organs.
DHPLC has proved to be an efficient tool for mutation detection in TSC. It is ideally suited for genetic disorders like TSC, in which mutations are scattered over multiple exons, in that amplicons may be scanned at high sensitivity and efficiency by the DHPLC technique, followed by directed sequencing. The most frequent mutation in this series was seen in only 9 (4%) of all patients, and most other recurrent mutations were seen in only two patients. In addition, 79 of the 166 small mutations reported here in TSC1 and TSC2 have not been previously identified by any group, indicating that the spectrum of mutations in these two genes continues to expand. Therefore, mutation detection approaches directed at identification of specific mutations cannot be comprehensive in this disorder.
At the conclusion of this mutational screening, we were left with a set of 38 (17%) patients in whom no mutation was identified, the NMI set. There are multiple potential factors that could contribute to the lack of identification of a definite mutation in these patients. First, there were two patients in this set in whom missense changes in TSC2 were identified that could not be classified as mutations because they were only moderately nonconservative and parental samples were not available. Second, there were two cases in which mosaicism for a large deletion in TSC2 was suspected but results were inconclusive. Third, there were seven patients whose DNA samples were depleted before a complete analysis was performed. Fourth, it is likely that inactivating mutations remote from coding exons and their splice boundaries occur at some rate in TSC1 and TSC2, and these and certain other classes of mutation will go undetected or unconfirmed as mutations by methods that analyze DNA only. Fifth, it is possible that there are additional causative loci that account for a small fraction of TSC cases. Finally, we and others have reported elsewhere that some patients with relatively low level mosaicism for a TSC1 or TSC2 mutation may present with diagnostic features of TSC (Sampson et al. 1997; Kwiatkowska et al. 1999; Verhoef et al. 1999). Some of these mutations may be difficult to detect by any conventional method, particularly mosaic single-base substitution mutations. It was of considerable interest to note that the NMI patients as a set had clinical features that were significantly milder than those of patients with TSC2 mutations and were somewhat different from those with TSC1 mutations (table 6). Because the numbers of these patients is relatively small, the comparisons are of only modest statistical significance. In addition, the NMI patient set is likely to be a mixed grouping of patients from several of the categories listed above. Nonetheless, the observations indicate that the NMI set of patients has a distinct set of clinical features, which, in our view, suggests the hypothesis that mosaicism for a mutation in TSC2 and/or additional, as-yet-unidentified TSC loci account for a significant fraction of these patients. Additional study will be required to explore this hypothesis.
Acknowledgments
The authors thank the many patients and families with TSC who have contributed DNA samples for analysis and the continuing support of William Watts. This work was supported by NIH grants NINDS NS31535, NCI CA71445, and NCI CA86248, and the National Tuberous Sclerosis Association.
Electronic-Database Information
Accession numbers and URLs for data in this article are as follows:
- Berkeley Drosophila Genome Project, Splice Site Prediction by Neural Network, http://www.fruitfly.org/seq_tools/splice.html (for splice-site detection by computation)
- GenBank, http://www.ncbi.nlm.nih.gov/Genbank (for TSC1 and TSC2 genomic sequence information [accession numbers AC002318, AC002096, and AC005600])
- Human Genetics Online Review Tables, http://expmed.bwh.harvard.edu/ts/review/
- Online Mendelian Inheritance in Man (OMIM), http://www.ncbi.nlm.nih.gov/Omim (for TSC [MIM 605284 and MIM 191092])
- Primer 3, http://www-genome.wi.mit.edu/cgi-bin/primer/primer3_www.cgi
- Run the DHPLC MELT Program, http://insertion.stanford.edu/melt.html
- Staden Package, http://www.mrc-lmb.cam.ac.uk/pubseq/
- Tuberous Sclerosis (TSC) Project, The, http://zk.bwh.harvard.edu/projects/tsc/ (for Primer sequences, PCR and DHPLC conditions, polymorphism tables, and Variation Wizard)
References
- Antonarakis SE (1998) Recommendations for a nomenclature system for human gene mutations. Nomenclature Working Group. Hum Mutat 11:1–3 [DOI] [PubMed] [Google Scholar]
- Au K-S, Rodriguez JA, Finch JL, Volcik KA, Roach ES, Delgado MR, Rodriguez E, Northrup H (1998) Germ-line mutational analysis of the TSC2 gene in 90 tuberous-sclerosis patients. Am J Hum Genet 62:286–294 [DOI] [PMC free article] [PubMed] [Google Scholar]
- Beauchamp RL, Banwell A, McNamara P, Jacobsen M, Higgins E, Northrup H, Short P, Sims K, Ozelius L, Ramesh V (1998) Exon scanning of the entire TSC2 gene for germline mutations in 40 unrelated patients with tuberous sclerosis. Hum Mutat 12:408–416 [DOI] [PubMed] [Google Scholar]
- Cheadle JP, Reeve MP, Sampson JR, Kwiatkowski DJ (2000) Molecular genetic advances in tuberous sclerosis. Hum Genet 107:97–114 [DOI] [PubMed] [Google Scholar]
- Choy Y, Dabora S, Hall F, Ramesh V, Niida Y, Franz D, Kasprzyk-Obara J, Reeve M, Kwiatkowski DJ (1999) Superiority of denaturing high performance liquid chromatography over single-stranded conformation and conformation-sensitive gel electrophoresis for mutation detection in TSC2. Ann Hum Genet 63:383–391 [DOI] [PubMed] [Google Scholar]
- Dabora SL, Nieto A, Jozwiak S, Franz D, van den Ouweland A, Kwiatkowski DJ (2000) Identification and characterization of 6 large (1.3 kb–39 kb) deletions in TSC2 using long range PCR suggests diverse deletion mechanisms including Alu-mediated homologous recombination. J Med Genet 37:877–882 [DOI] [PMC free article] [PubMed] [Google Scholar]
- Dabora SL, Sigalas I, Hall F, Eng C, Vijg J, Kwiatkowski DJ (1998) Comprehensive mutation analysis of TSC1 using two-dimensional DNA electrophoresis with DGGE. Ann Hum Genet 62:491–504 [DOI] [PubMed] [Google Scholar]
- European Tuberous Sclerosis Consortium (1993) Identification and characterization of the tuberous sclerosis gene on chromosome 16. Cell 75:1305–1315 [DOI] [PubMed] [Google Scholar]
- Eussen BH, Bartalini G, Bakker L, Balestri P, Di Lucca C, Van Hemel JO, Dauwerse H, van Den Ouweland AM, Ris-Stalpers C, Verhoef S, Halley DJ, Fois A (2000) An unbalanced submicroscopic translocation t(8;16)(q24.3;p13.3)pat associated with tuberous sclerosis complex, adult polycystic kidney disease, and hypomelanosis of Ito. J Med Genet 37:287–291 [DOI] [PMC free article] [PubMed] [Google Scholar]
- Ewalt DH, Sheffield E, Sparagana SP, Delgado MR, Roach ES (1998) Renal lesion growth in children with tuberous sclerosis complex. J Urol 160:141–145 [PubMed] [Google Scholar]
- Gomez M, Sampson J, Whittemore V (eds) (1999) The tuberous sclerosis complex. Oxford, England, Oxford University Press [Google Scholar]
- Goodman M, Lamm SH, Engel A, Shepherd CW, Houser OW, Gomez MR (1997) Cortical tuber count: a biomarker indicating neurologic severity of tuberous sclerosis complex. J Child Neurol 12:85–90 [DOI] [PubMed] [Google Scholar]
- Green AJ, Smith M, Yates JR (1994) Loss of heterozygosity on chromosome 16p13.3 in hamartomas from tuberous sclerosis patients. Nat Genet 6:193–196 [DOI] [PubMed] [Google Scholar]
- Henikoff S, Henikoff JG (1992) Amino acid substitution matrices from protein blocks. Proc Natl Acad Sci U S A 89:10915–10919 [DOI] [PMC free article] [PubMed] [Google Scholar]
- Henske EP, Scheithauer BW, Short MP, Wollmann R, Nahmias J, Hornigold N, van Slegtenhorst M, Welsh CT, Kwiatkowski DJ (1996) Allelic loss is frequent in tuberous sclerosis kidney lesions but rare in brain lesions. Am J Hum Genet 59:400–406 [PMC free article] [PubMed] [Google Scholar]
- Henske EP, Wessner LL, Golden J, Scheithauer BW, Vortmeyer AO, Zhang Z, Klein-Szanto AJP, Kwiatkowski DJ, Yeung RS (1997) Loss of tuberin in both subependymal giant cell astrocytomas and angiomyolipomas supports a two-hit model for the pathogenesis of tuberous sclerosis tumors. Am J Pathol 151:1639–1647 [PMC free article] [PubMed] [Google Scholar]
- Jones AC, Daniells CE, Snell RG, Tachataki M, Idziaszczyk SA, Krawczak M, Sampson JR, Cheadle JP (1997) Molecular genetic and phenotypic analysis reveals differences between TSC1 and TSC2 associated familial and sporadic tuberous sclerosis. Hum Mol Genet 6:2155–2161 [DOI] [PubMed] [Google Scholar]
- Jones AC, Sampson JR, Hoogendoorn B, Cohen D, Cheadle JP (2000) Application and evaluation of denaturing HPLC for molecular genetic analysis in tuberous sclerosis. Hum Genet 106:663–668 [DOI] [PubMed] [Google Scholar]
- Jones AC, Shyamsundar MM, Thomas MW, Maynard J, Idziaszczyk S, Tomkins S, Sampson JR, Cheadle JP (1999) Comprehensive mutation analysis of TSC1 and TSC2-and phenotypic correlations in 150 families with tuberous sclerosis. Am J Hum Genet 64:1305–1315 [DOI] [PMC free article] [PubMed] [Google Scholar]
- Jozwiak S, Kawalec W, Dluzewska J, Daszkowska J, Mirkowicz-Malek M, Michalowicz R (1994) Cardiac tumours in tuberous sclerosis: their incidence and course. Eur J Pediatr 153:155–157 [DOI] [PubMed] [Google Scholar]
- Jozwiak S, Pedich M, Rajszys P, Michalowicz R (1992) Incidence of hepatic hamartomas in tuberous sclerosis. Arch Dis Child 67:1363–1365 [DOI] [PMC free article] [PubMed] [Google Scholar]
- Jozwiak S, Schwartz RA, Janniger CK, Michalowicz R, Chmielik J (1998) Skin lesions in children with tuberous sclerosis complex: their prevalence, natural course, and diagnostic significance. Int J Dermatol 37:911–917 [DOI] [PubMed] [Google Scholar]
- Kim KK, Pajak L, Wang H, Field LJ (1995) Cloning, developmental expression, and evidence for alternative splicing of the murine tuberous sclerosis (TSC2) gene product. Cell Mol Biol Res 41:515–526 [PubMed] [Google Scholar]
- Kobayashi T, Nishizawa M, Hirayama Y, Kobayashi E, Hino O (1995) cDNA structure, alternative splicing and exon-intron organization of the predisposing tuberous sclerosis (Tsc2) gene of the Eker rat model. Nucleic Acids Res 23:2608–2613 [DOI] [PMC free article] [PubMed] [Google Scholar]
- Kwiatkowska J, Jozwiak S, Hall F, Henske EP, Haines JL, McNamara P, Braiser J, Wigowska-Sowinska J, Kasprzyk-Obara J, Short MP, Kwiatkowski DJ (1998) Comprehensive mutational analysis of the TSC1 gene: observations on frequency of mutation, associated features, and nonpenetrance. Ann Hum Genet 62:277–285 [DOI] [PubMed] [Google Scholar]
- Kwiatkowska J, Wigowska-Sowinska J, Napierala D, Slomski R, Kwiatkowski DJ (1999) Mosaicism in tuberous sclerosis as a potential cause of the failure of molecular diagnosis. N Engl J Med 340:703–707 [DOI] [PubMed] [Google Scholar]
- Kwiatkowski DJ, Short MP (1994) Tuberous sclerosis. Arch Dermatol 130:348–354 [PubMed] [Google Scholar]
- Maheshwar MM, Cheadle JP, Jones AC, Myring J, Fryer AE, Harris PC, Sampson JR (1997) The GAP-related domain of tuberin, the product of the TSC2 gene, is a target for missense mutations in tuberous sclerosis. Hum Mol Genet 6:1991–1996 [DOI] [PubMed] [Google Scholar]
- Maheshwar MM, Sandford R, Nellist M, Cheadle JP, Sgotto B, Vaudin M, Sampson JR (1996) Comparative analysis and genomic structure of the tuberous sclerosis 2 (TSC2) gene in human and pufferfish. Hum Mol Genet 5:131–137 [DOI] [PubMed] [Google Scholar]
- Mayer K, Ballhausen W, Rott HD (1999) Mutation screening of the entire coding regions of the TSC1 and the TSC2 gene with the protein truncation test (PTT) identifies frequent splicing defects. Hum Mutat 14:401–411 [DOI] [PubMed] [Google Scholar]
- Michalet X, Ekong R, Fougerousse F, Rousseaux S, Schurra C, Hornigold N, van Slegtenhorst M, Wolfe J, Povey S, Beckmann JS, Bensimon A (1997) Dynamic molecular combing: stretching the whole human genome for high-resolution studies. Science 277:1518–1523 [DOI] [PubMed] [Google Scholar]
- Morgan NV, Tipping AJ, Joenje H, Mathew CG (1999) High frequency of large intragenic deletions in the Fanconi anemia group A gene. Am J Hum Genet 65:1330–1341 [DOI] [PMC free article] [PubMed] [Google Scholar]
- Niida Y, Lawrence-Smith N, Banwell A, Hammer E, Lewis J, Beauchamp RL, Sims K, Ramesh V, Ozelius L (1999) Analysis of both TSC1 and TSC2 for germline mutations in 126 unrelated patients with tuberous sclerosis. Hum Mutat 14:412–422 [DOI] [PubMed] [Google Scholar]
- O'Callaghan FJ, Noakes M, Osborne JP (2000) Renal angiomyolipomata and learning difficulty in tuberous sclerosis complex. J Med Genet 37:156–157 [DOI] [PMC free article] [PubMed] [Google Scholar]
- Osborne JP, Fryer A, Webb D (1991) Epidemiology of tuberous sclerosis. Ann N Y Acad Sci 615:125–127 [DOI] [PubMed] [Google Scholar]
- Roach ES, Gomez MR, Northrup H (1998) Tuberous sclerosis complex consensus conference: revised clinical diagnostic criteria. J Child Neurol 13:624–628 [DOI] [PubMed] [Google Scholar]
- Sampson JR, Maheshwar MM, Aspinwall R, Thompson P, Cheadle JP, Ravine D, Roy S, Haan E, Bernstein J, Harris PC (1997) Renal cystic disease in tuberous sclerosis: role of the polycystic kidney disease 1 gene. Am J Hum Genet 61:843–851 [DOI] [PMC free article] [PubMed] [Google Scholar]
- Sampson JR, Scahill SJ, Stephenson JB, Mann L, Connor JM (1989) Genetic aspects of tuberous sclerosis in the west of Scotland. J Med Genet 26:28–31 [DOI] [PMC free article] [PubMed] [Google Scholar]
- van Bakel I, Sepp T, Ward S, Yates JR and Green AJ (1997) Mutations in the TSC2 gene: analysis of the complete coding sequence using the protein truncation test (PTT). Hum Mol Genet 6:1409–1414 [DOI] [PubMed] [Google Scholar]
- van Slegtenhorst M, de Hoogt R, Hermans C, Nellist M, Janssen B, Verhoef S, Lindhout D, et al (1997) Identification of the tuberous sclerosis gene TSC1 on chromosome 9q34. Science 277:805–808 [DOI] [PubMed] [Google Scholar]
- van Slegtenhorst M, Verhoef S, Tempelaars A, Bakker L, Wang Q, Wessels M, Bakker R, Nellist M, Lindhout D, Halley D, van den Ouweland A (1999) Mutational spectrum of the TSC1 gene in a cohort of 225 tuberous sclerosis complex patients: no evidence for genotype-phenotype correlation. J Med Genet 36:285–289 [PMC free article] [PubMed] [Google Scholar]
- Verhoef S, Bakker L, Tempelaars AM, Hesseling-Janssen AL, Mazurczak T, Jozwiak S, Fois A, Bartalini G, Zonnenberg BA, van Essen AJ, Lindhout D, Halley DJ, van den Ouweland AM (1999) High rate of mosaicism in tuberous sclerosis complex. Am J Hum Genet 64:1632–1637 [DOI] [PMC free article] [PubMed] [Google Scholar]
- Webb DW, Clarke A, Fryer A, Osborne JP (1996) The cutaneous features of tuberous sclerosis: a population study. Br J Dermatol 135:1–5 [PubMed] [Google Scholar]
- Yau SC, Bobrow M, Mathew CG, Abbs SJ (1996) Accurate diagnosis of carriers of deletions and duplications in Duchenne/Becker muscular dystrophy by fluorescent dosage analysis. J Med Genet 33:550–558 [DOI] [PMC free article] [PubMed] [Google Scholar]
- Young JM, Burley MW, Jeremiah SJ, Jeganathan D, Ekong R, Osborne JP, Povey S (1998) A mutation screen of the TSC1 gene reveals 26 protein truncating mutations and 1 splice site mutation in a panel of 79 tuberous sclerosis patients. Ann Hum Genet 62:203–213 [DOI] [PubMed] [Google Scholar]