

Abstract
Abstract
Objectives
This study aimed to develop and validate a machine-learning (ML) model to predict iron deficiency without anaemia (IDWA) using routinely collected electronic health record (EHR) data. The primary hypothesis was that an ML model could achieve better accuracy in identifying low ferritin levels (<30 ng/mL) in non-anaemic patients compared with traditional methods.
Design
A retrospective cohort study.
Setting
Data were derived from secondary and tertiary care facilities within the eight-hospital Mount Sinai Health System, an urban academic health system.
Participants
The study included 211 486 adult patients (aged ≥18 years) with normal haemoglobin levels (≥130 g/L for men and ≥120 g/L for women) and recorded ferritin measurements.
Primary and secondary outcome measures
The primary outcome was the prediction of low ferritin levels (<30 ng/mL) using extreme gradient-boosted decision trees, an ML algorithm suited for structured clinical data. Secondary outcomes included subgroup analyses stratified by sex and age to evaluate model performance in different populations.
Data from 211 486 Mount Sinai Health System patients with normal haemoglobin levels and ferritin testing were analysed. The model used demographic data, blood count indices and chemistry results to identify low ferritin levels (<30 ng/mL).
Results
Of the 211 486 patients analysed, 19.56% (n=41 368) of the patients had low ferritin levels. In the low ferritin group, the mean age was 41.28 years with 89.64% females. In contrast, the normal ferritin group had a mean age of 50.14 years with 62.02% females. The model achieved an area under the curve (AUC) of 0.814. At a sensitivity threshold of 70%, the model had a specificity of 75.85%, with a positive predictive value of 37.6% and a negative predictive value of 92.41%. The model outperformed an alternative model based only on complete blood count indices (AUC 0.814 vs 0.741). Subgroup analysis showed that model accuracy varied by sex and age, with lower performance in premenopausal women (AUC 0.736) compared with postmenopausal women (AUC 0.793) and men (AUC of 0.832 in those under 60 years and 0.806 in those aged 60 and above).
Conclusions
The ML model provides an effective approach to screening for IDWA using readily available EHR data. Implementing this tool in clinical settings may facilitate early diagnosis of IDWA.
Keywords: Machine Learning, Anaemia, HAEMATOLOGY
STRENGTHS AND LIMITATIONS OF THIS STUDY.
Model development drew on 211 486 unique adult patients from the eight-hospital Mount Sinai Health System, providing statistical power and broad demographic and clinical diversity.
Training on 2014–2023 data and validation on an independent test set of data from 2024 mitigated temporal leakage and simulated real-world performance.
An extreme gradient-boosted decision tree algorithm was used for the primary analysis to handle complex, non-linear data.
SHapley Additive exPlanations values quantified individual feature contributions to the model’s prediction.
This study’s retrospective, single-system design, relying solely on one network’s historical data, introduces potential selection or information bias.
Introduction
Iron-deficiency anaemia (IDA) accounts for about 50% of all anaemia cases and is reported to affect roughly one in eight people globally.1,4 Iron deficiency without anaemia (IDWA) is an under-recognised condition with significant clinical implications that often remain undiagnosed due to the absence of overt symptoms.5,10 The prevalence of IDWA is substantial, particularly among high-risk populations such as athletes, preschool children, females of reproductive age and pregnant persons.211,14 The prevalence of iron deficiency in these populations is reported to range from over 30% to 40% in the absence of dietary fortification.11
Although IDWA lacks classical clinical signs, it is associated with adverse health outcomes, including reduced physical performance, cognitive impairment, compromised immune function and an overall decreased quality of life.615,18 For instance, iron-deficient children are more susceptible to upper respiratory and gastrointestinal infections—risks that can be mitigated through iron supplementation.6 Additionally, markedly depleted iron stores have been shown to cause significant fatigue in non-anaemic women, with symptoms improving substantially following intravenous iron therapy.15 Timely recognition and management of IDWA is crucial to alleviate these health concerns and prevent its progression to overt IDA, which carries more severe health risks and requires more intensive treatment.11 19
Current conventional approaches to identifying iron deficiency often rely on detecting anaemia or abnormal red blood cell indices, such as low mean corpuscular volume (MCV), low mean corpuscular haemoglobin concentration (MCHC) and elevated red cell distribution width (RDW), which may appear only in later stages of iron depletion. Although RBC indices in the presence of normal haemoglobin level can sometimes provide clues for detecting IDWA, these are not always present and are not consistently reliable for early detection.20
To address these challenges, guidelines from haematology societies, including the European Haematology Association and the US Preventive Services Task Force, emphasise the importance of screening for iron deficiency, especially in high-risk groups.21 22 The recommended screening population includes pregnant women, women of reproductive age, infants, young children, adolescents, athletes, regular blood donors, elderly patients and those with chronic conditions or restricted diets.21 22 However, even with comprehensive screening guidelines, some populations may be missed.
Developing machine-learning-based prediction models for detecting IDWA may provide an effective solution to address these diagnostic gaps. Unlike traditional approaches that rely on individual laboratory thresholds or simple rule-based criteria, machine-learning models can integrate a wide array of routinely collected clinical data to detect complex, nonlinear associations that may signal early iron deficiency. This may allow for the identification of at-risk individuals even in the absence of overt haematologic abnormalities. Prior studies have applied machine learning to predict IDA—for example, Kurstjens et al developed a model using CBC parameters and ferritin values to detect iron deficiency in anaemic primary care patients,23 while Garduno-Rapp et al built a deep learning model to forecast anaemia up to 6 months in advance in a mixed population that included anaemic individuals.24 However, these models included populations with existing anaemia.
The objective of this study was to develop and validate a machine-learning model capable of identifying IDWA using routinely available electronic health record (EHR) features. Our central hypothesis was that a machine-learning model trained on demographic, comorbidities, haematologic and biochemical markers could outperform traditional rule-based or logistic regression models in predicting low ferritin levels among patients with normal haemoglobin. To test this, we used a large dataset from the EHRs of 211 486 unique patients from the Mount Sinai Health System (MSHS), a large healthcare network based in New York City. We develop a predictive model for IDWA that leverages routinely available EHR data to automate the identification of at-risk individuals and improve overall detection accuracy.
Methods
Study design and population
This study was designed to develop and validate a predictive model for identifying low ferritin levels (defined as <30 ng/mL)2 in adults without anaemia (ie, men with haemoglobin ≥130 g/L and women ≥120 g/L).25 We focused exclusively on ferritin as our marker of choice, foregoing measurements of other iron deficiency indicators like transferrin saturation, because ferritin is the most straightforward single test that directly signifies iron deficiency.2 11 26 27
Data were extracted from the EHRs of the MSHS, a healthcare network based in New York City. MSHS encompasses eight hospital campuses, including Mount Sinai Beth Israel, Mount Sinai Brooklyn, Mount Sinai Hospital (with Kravis Children’s Hospital), Mount Sinai Queens, Mount Sinai Morningside, Mount Sinai West, New York Eye and Ear Infirmary of Mount Sinai, and Mount Sinai South Nassau—as well as the Icahn School of Medicine and Mount Sinai Phillips School of Nursing. MSHS’s extensive network also features ambulatory practices across the five boroughs of New York City, Westchester County and Long Island, supplemented by over 30 affiliated community health centres.
The dataset extracted for each patient included laboratory results for ferritin, haemoglobin and other relevant biomarkers (specified below) from patient encounters over the past decade (2014–2024). Additional data included demographics, chief complaints at admission, patient admission status (inpatient or outpatient), and all recorded ICD-10-CM codes aggregated into clinical classification software (CCS) categories.28
To reduce the potential bias of multiple tests per individual, we limited the analysis to only the first recorded ferritin and haemoglobin measurements per unique patient. This avoids within-patient correlation and over-representation.
Features for the predictive model building included
Biological markers: Haemoglobin, MCV, platelet count, MCHC, RDW, blood urea nitrogen (BUN), creatinine, albumin, alanine transaminase (ALT) and aspartate transaminase (AST).
Demographics: Age and encoded sex and race.
Clinical data: Chief complaints and prior medical diagnoses. The International Classification of Diseases, 10th Revision, Clinical Modification (ICD-10-CM) codes were aggregated and transformed into clinical categories using CCS mapping.
Admission status: Indicator of whether the ferritin test was conducted during an inpatient or outpatient visit.
The features selected for the model reflect possible factors in iron metabolism and anaemia. Haematologic markers (ie, haemoglobin levels, MCV, MCHC, RDW) capture red blood cell production and haemoglobin status, while liver enzymes (ALT, AST) and renal function markers (BUN, creatinine) were included due to their relevance in conditions that influence ferritin levels as an acute phase reactant.29
Albumin is indicative of nutritional status, and lower levels are often associated with inflammatory processes that can influence ferritin levels.29 30 Demographics and coded clinical data (ICD-10-CM codes, admission status) provide contextual insights.
We used extreme gradient-boosted decision trees (XGBoost). This tree-based ensemble copes with missing values, balances class weights and models non-linear relations in tabular EHR data.31 For the XGBoost model, we relied on the algorithm’s native handling of NaN, which routes missing values down a dedicated branch during tree construction.
For benchmarking, we fitted an L2-regularised multivariable logistic-regression model, applying median imputation for missing values. Area under the curves (AUCs) were compared with the two-sided DeLong test.
Missing values for key predictors are detailed in online supplemental Table 1.
Statistical analysis
Python (V.3.9) was used for preprocessing and modelling tasks. The gradient-boosting XGBoost algorithm was selected for its efficiency in handling sparse data and its inherent capability to manage missing values and class imbalance.31 All hypothesis tests were two-sided; p<0.05 defined statistical significance.
The model was trained and validated using data from 2014 to 2023 with fivefold cross-validation to optimise hyperparameters through a grid search approach. An independent test set comprised of data from 2024 to assess model performance.
Performance metrics included the area under the receiver operating characteristic (ROC) curve (AUC) and, for predetermined sensitivity levels (50%, 60%, 70%, 80% and 90%), the corresponding specificity, positive predictive value (PPV) and negative predictive value (NPV) were calculated. CIs of 95% for these metrics were derived via bootstrapping.
SHAP (SHapley Additive exPlanations) values were calculated to quantify the impact of each feature on the model’s prediction accuracy, providing a detailed view of the contributions of individual predictors.
We further conducted a subgroup analysis stratifying the cohort by sex and age (under and over 60 years) to differentiate between the effects of gender and account for menopausal status in women, as premenopausal women typically have lower iron stores due to recurrent blood loss through menstruation.32
In addition, we developed a model relying solely on haemoglobin, MCV, MCHC and RDW to assess the baseline predictive capacity of established haematologic indices associated with iron deficiency.29
Patient and public involvement
Patients were not involved in the design, conduct, reporting or dissemination plans of this research.
Results
Patient cohort and study sample
The dataset, consisting of ferritin and haemoglobin measurements from the MSHS, included 693 687 encounters after applying adult inclusion criteria (>18 years). Following the exclusion of cases of anaemia (haemoglobin <130 g/L for men and <120 g/L for women), the study cohort was reduced to 345 251 encounters from 211 486 unique patients. Among this group, low ferritin levels (<30 ng/mL) were found in 41 368 patients, a prevalence of 19.56%.
The patient selection process is illustrated in figure 1 and characteristics of the study are summarised in table 1. Although the low p value can be attributed to the large sample size, some clinical differences between the two groups of patients can be seen. The low ferritin group consisted of nearly 90% females and had a younger average age compared with the normal ferritin group (mean age 41.28 vs 50.14). In the low-ferritin group, the haemoglobin, MCV and MCHC were slightly lower, and the RDW and platelet count were higher, as expected, compared with the normal-ferritin group. Similar findings were seen in a subgroup analysis by sex and age (under and over 60 years), which can be found in online supplemental Tables 2–5.
Figure 1. Flow chart of patient selection. EHR, electronic health record.

Table 1. Baseline demographic and clinical characteristics.
| Feature | Low ferritin (<30 ng/mL) 41 368 (19.56%) |
Normal ferritin (≥30 ng/mL) 170 118 (80.44%) |
P value |
|---|---|---|---|
| Age (mean (SD)) | 41.28 (15.99) | 50.14 (18.87) | <0.001 |
| Sex | Female: 37 083 (89.64%); Male: 4285 (10.36%) | Female: 105 514 (62.02%); Male: 64 604 (37.98%) | <0.001 |
| Race | Asian: 1659 (4.01%); Black: 4296 (10.38%); Other: 17 920 (43.32%); White: 17 493 (42.29%) | Asian: 6350 (3.73%); Black: 20 480 (12.04%); Other: 69 402 (40.80%); White: 73 886 (43.43%) | <0.001 |
| Haemoglobin (g/L) | 131.2 (8.7) | 138.9 (12.4) | <0.001 |
| Mean corpuscular volume (fL) | 87.71 (5.73) | 90.23 (5.89) | <0.001 |
| Platelet count (109/L) | 272.16 (80.93) | 250.32 (81.88) | <0.001 |
| Mean corpuscular haemoglobin concentration (g/dL) | 32.85 (0.99) | 33.19 (1.05) | <0.001 |
| Red cell distribution width (%) | 14.10 (2.16) | 13.47 (1.85) | <0.001 |
| Creatinine (mg/dL) | 0.78 (0.24) | 0.96 (0.84) | <0.001 |
| Albumin (g/dL) | 4.30 (0.40) | 4.22 (0.57) | <0.001 |
| Alanine transaminase (U/L) | 19.08 (17.92) | 39.77 (201.87) | <0.001 |
| Aspartate transaminase (U/L) | 21.42 (13.83) | 39.34 (217.33) | <0.001 |
| Diabetes mellitus | 3676 (8.89%) | 22 046 (12.96%) | <0.001 |
| Heart failure | 765 (1.85%) | 7998 (4.70%) | <0.001 |
| Ischaemic heart disease | 2082 (5.03%) | 17 082 (10.04%) | <0.001 |
| Chronic renal disease | 1077 (2.60%) | 11 194 (6.58%) | <0.001 |
| Cancer | 10 649 (25.74%) | 49 643 (29.18%) | <0.001 |
| Chronic obstructive pulmonary disease | 896 (2.17%) | 7126 (4.19%) | <0.001 |
| Gastrointestinal bleeding | 612 (1.48%) | 2784 (1.64%) | <0.001 |
Hyperparameter tuning results
As stated earlier, the model was developed to predict low ferritin levels in non-anaemic encounters. Through systematic hyperparameter tuning conducted on the 2014–2023 dataset using fivefold cross-validation, we identified optimal settings for our XGBoost model. Most configurations showed a similar AUC of 0.823, indicating stable model performance across different hyperparameters, as shown in online supplemental Table 6.
Model performance on testing data
The model was evaluated on the 2024 testing dataset to predict low ferritin levels (<30 ng/mL) in patients without anaemia and achieved an AUC of 0.814 (95% CI 0.807 to 0.820). Key performance metrics at varying sensitivity thresholds are summarised in table 2. For example, at a sensitivity of 70%, the model yielded a specificity of 75.85% (95% CI 75.24% to 76.45%), with a PPV of 37.6% (95% CI 36.51% to 38.68%) and an NPV of 92.41% (95% CI 92.0% to 92.8%). The logistic model yielded an AUC of 0.784 (95% CI 0.777 to 0.791), significantly lower than XGBoost (p<0.001) and a specificity of 72.1% (95% CI 71.5% to 72.7%) at the 70% sensitivity point.
Table 2. Performance metrics of the model at varying sensitivity thresholds for predicting low ferritin levels in non-anaemic patients.
| Sensitivity | Specificity | PPV | NPV | TP | FP | TN | FN |
|---|---|---|---|---|---|---|---|
| 50.01 (95% CI 48.44 to 51.5) | 87.81 (95% CI 87.37 to 88.22) | 46.03 (95% CI 44.48 to 47.62) | 89.42 (95% CI 89.02 to 89.85) | 2013 | 2360 | 17 008 | 2012 |
| 60.0 (95% CI 58.42 to 61.54) | 82.62 (95% CI 82.11 to 83.11) | 41.77 (95% CI 40.58 to 43.0) | 90.86 (95% CI 90.42 to 91.3) | 2415 | 3366 | 16 002 | 1610 |
| 70.01 (95% CI 68.55 to 71.37) | 75.85 (95% CI 75.24 to 76.45) | 37.6 (95% CI 36.51 to 38.68) | 92.41 (95% CI 92.0 to 92.8) | 2818 | 4677 | 14 691 | 1207 |
| 80.02 (95% CI 78.8 to 81.31) | 66.84 (95% CI 66.13 to 67.5) | 33.4 (95% CI 32.46 to 34.33) | 94.15 (95% CI 93.76 to 94.54) | 3221 | 6422 | 12 946 | 804 |
| 90.01 (95% CI 89.1 to 90.94) | 54.2 (95% CI 53.45 to 54.94) | 29.0 (95% CI 28.23 to 29.85) | 96.31 (95% CI 95.93 to 96.67) | 3623 | 8870 | 10 498 | 402 |
FN, False negative; FP, False positive; NPV, negative predictive value; PPV, positive predictive value; TN, True negative; TP, True positive.
In the subgroup analysis of females under the age of 60, model performance was reduced to an AUC of 0.736 (95% CI 0.727 to 0.746). For other subgroups, the AUC ranged from 0.793 to 0.832, with the male subgroup demonstrating an AUC of 0.832 in individuals under 60 years and 0.806 in those aged 60 and above. Detailed metrics for each subgroup by sex and age category (under and over 60 years) are provided in online supplemental Tables 7–10. Further subgroup analysis for ages above and below 45 is presented in the online supplemental Tables 11–14.
In our study cohort, 1537 patients, which represent 6.6% of the total, exhibited normal MCV, MCHC and RDW but were accurately identified by our model as having low ferritin, with the model set at 70% sensitivity.
Efficacy of haematologic indices in predicting iron deficiency: a model based on traditional markers
When using only haemoglobin levels, MCV, MCHC and RDW to build the model, it achieved a lower AUC of 0.741 (95% CI 0.733 to 0.750), as shown in online supplemental Table 15.
Feature importance analysis
SHAP values were calculated to quantify the impact of each feature on the model’s prediction accuracy, providing a detailed view of the contributions of individual predictors. The feature importance analysis is illustrated in figure 2, presenting the ten most important features in the model.
Figure 2. SHAP feature importance analysis of key predictors for low ferritin levels. SHAP, SHapley Additive exPlanations.
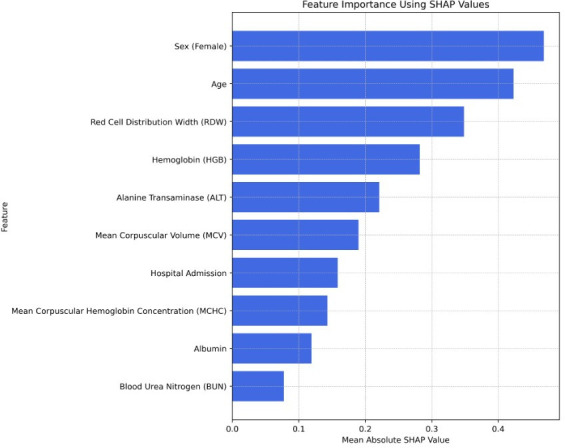
The analysis shows that demographic factors, such as age and sex, are the most influential features in predicting low ferritin levels. Haematologic markers (such as haemoglobin, MCV, MCHC and RDW) also contribute significantly to the model’s predictions, as expected. ALT, as well as albumin and BUN, also appears significant.
Discussion
In this study, we developed a predictive model to identify patients with IDWA using EHR data from over 210 000 individuals. Our model demonstrated solid performance, with an AUC of 0.814, indicating its capability to address the diagnostic gap for IDWA—an often under-recognised condition.5,10
The high prevalence of IDWA, particularly among women of reproductive age, younger individuals and athletes, underscores the need for early detection.3 33 Our model highlights the importance of integrating multiple biological and demographic markers, including haemoglobin levels, MCV, MCHC, RDW, liver enzymes such as ALT and albumin levels, as predictive features.
Notably, our feature importance analysis found that demographic characteristics, particularly age and sex, were critical predictors. This finding is consistent with the increased risk of iron deficiency among premenopausal women due to menstruation.2 5 11 34
The subgroup analysis revealed that model performance varied across demographic groups, with reduced accuracy for younger women compared with older individuals and men. For example, at a sensitivity set of 70%, the specificity and PPV for females under 60 were 63.63% (95% CI 62.61% to 64.66%) and 40.83% (95% CI 39.55% to 42.17%), respectively. In contrast, for males under 60, the specificity was 81.3% (95% CI 80.18% to 82.5%) and the PPV was 15.48% (95% CI 13.04% to 17.89%). This finding may be attributed to the primary causes of iron deficiency differing between populations, with young women often experiencing iron deficiency due to factors like menstruation and nutritional habits, not evident in the EHR data.2 11 35 In contrast, in other populations (such as men and postmenopausal women), low iron levels may be linked to age and underlying conditions detectable through other blood tests, hospitalisation status, background diseases and other EHR data.3336,39 Despite this, our approach remains clinically valuable even in the younger female population, as the model still identified a substantial subset of iron-deficient individuals within this subgroup. At 70% sensitivity, the model accurately identified 2308 female patients under the age of 60 with low ferritin, representing 18.4% of this subgroup who had normal haemoglobin levels.
Interestingly, our model identified several systemic markers—such as ALT, BUN and albumin—as significant predictors of low ferritin levels. The group with IDWA showed lower ALT levels, for example. ALT, a protein predominantly found in the liver, may indicate liver damage, suggesting an underlying reason for increased ferritin as an acute-phase reactant.40 Similarly, elevated BUN could suggest impaired renal function or dehydration, and lower albumin may reflect malnutrition, all potential indicators of an underlying inflammatory state.29 30 41 42 These findings suggest that factors beyond traditional haematologic markers play an important role in predicting IDWA.
Our approach to model building also emphasises the utility of advanced machine-learning methods, such as gradient boosting, for handling complex clinical data and significantly improving on conventional approaches in identifying IDWA. We compared our XGBoost model against the logistic model, yielding an AUC of 0.784 (95 % CI 0.777 to 0.791), which was significantly lower than that of our XGBoost model (p<0.001).
Physicians often rely on RBC indices (eg, MCV, MCHC and RDW) to diagnose iron deficiency. However, a key limitation for IDWA detection is that these indices frequently remain within normal ranges in the absence of overt anaemia.21 Our machine-learning model directly addresses this challenge by demonstrating its ability to outperform a model based merely on haemoglobin levels combined with RBC indices (ie, with normal MCV, MCHC and RDW) and to identify low ferritin in individuals with these normal markers.2 11 20 Specifically, with the model set at 70% sensitivity, 6.6% of patients in our study cohort had normal RBC indices but were nevertheless correctly identified as having low ferritin. This capability is particularly important for the early detection of iron deficiency, enabling timely intervention and helping prevent the long-term health and lifestyle consequences associated with untreated iron deficiency.6 15 33 43
Machine-learning models in related settings have reported AUCs of 0.90–0.92 with sensitivity 59%–69% and specificity 95% in anaemic primary-care patients,23 0.89 with sensitivity 0.75 and specificity 0.85 for predicting IDA up to 6 months in advance.24 These benchmarks were developed in populations that were either exclusively anaemic populations or included individuals with anaemia—settings with higher prevalence and clearer clinical signals. In contrast, our model (AUC 0.814; specificity 75.9% at 70% sensitivity) performs acceptably given that it targets subtler, preanaemic cases.
Importantly, in our model, we used only data readily available in the EHR, making our approach more practical for clinical implementation. By leveraging existing patient data, our model can be seamlessly integrated into current healthcare systems as a clinical decision-support tool to flag patients with suspected IDWA without requiring additional costly or time-consuming testing procedures. However, implementation in clinical practice poses challenges. These include integration into existing EHR systems, alert fatigue among clinicians and the need for user education to ensure appropriate interpretation of model outputs. Furthermore, there is a potential risk of overtesting or overtreatment if model outputs are used without clinical context. Therefore, prospective studies are needed to evaluate the model’s utility in real-world workflows and to define appropriate thresholds for action.
While this model was developed using data from a large, diverse patient population within the MSHS in New York City, its reliance on routinely collected EHR variables enhances its potential generalisability. The demographic and clinical features used are commonly recorded across most healthcare systems globally. However, differences in population health characteristics, data coding practices and access to laboratory testing may impact model performance. External validation in other clinical settings, particularly in regions with different iron deficiency prevalence or healthcare infrastructure, is necessary to confirm its broader applicability and guide appropriate model recalibration if needed.
Our study has several limitations. First, while the retrospective design allowed us to use a large dataset, it also introduced inherent biases, including potential selection bias due to reliance on routinely collected data. Additionally, the model was developed and validated in a single healthcare system, limiting its generalisability. However, MSHS is a large health system, encompassing eight hospitals, multiple outpatient clinics and treating a diverse urban population. We recommend validating its effectiveness within individual institutions before widespread implementation. Moreover, while the model incorporates a broad range of clinical features, its reliance on data from EHRs may exclude potential predictors not routinely captured, such as detailed dietary habits, medication usage or clinical symptoms like fatigue, as well as information about patients’ over-the-counter iron supplementation. For example, if some patients were taking supplements, it could have affected their blood test results and RBC indices, introducing further variability.20 Furthermore, our study exclusively evaluated a single type of machine-learning algorithm (XGBoost). Another potential limitation is the ferritin threshold for defining iron deficiency, which is not well established in IDWA. According to the WHO guideline on the use of ferritin concentrations to assess iron status in individuals and populations, low ferritin is defined as below 15 ng/mL or 30 ng/mL in adults, according to their inflammation or infection status.44 We chose to select a ferritin threshold of 30 ng/mL as this is the threshold in many medical centres, and some studies suggest it is more appropriate. In addition, we aimed to identify IDWA also in patients with inflammation-related conditions who might benefit from early intervention. Also, residual demographic imbalance could affect calibration in settings whose age or sex mix differs from ours. Future work will prospectively test and recalibrate the model in external healthcare systems to confirm its generalisability. Additionally, using a single encounter per patient may overlook information in subsequent tests; future research will evaluate whether models built on last or multiple encounters produce comparable results.
In conclusion, while further validation in real-world clinical settings is warranted, this research, evaluating a single machine-learning method, suggests the model’s potential to early identify patients with IDWA. By integrating routinely available EHR data, this approach could facilitate early interventions, improving patient outcomes while reducing healthcare costs associated with late-stage diagnosis and treatment of IDA. Further research should focus on model integration into clinical workflows and evaluating its impact on patient management outcomes.
Article summary
The study uses a large and diverse dataset from a multihospital healthcare system.
A machine-learning approach allows the integration of multiple demographic and clinical features, providing a readily available data-driven prediction model.
The focus on routinely collected EHR data ensures the model’s practical applicability for integration into existing clinical workflows.
The retrospective study design may introduce biases.
Generalisability is limited as the model was developed and validated in a single healthcare system, necessitating external validation in broader populations.
Supplementary material
Footnotes
Funding: The authors have not declared a specific grant for this research from any funding agency in the public, commercial or not-for-profit sectors.
Prepublication history and additional supplemental material for this paper are available online. To view these files, please visit the journal online (https://doi.org/10.1136/bmjopen-2024-097016).
Provenance and peer review: Not commissioned; externally peer reviewed.
Patient consent for publication: Not applicable.
Patient and public involvement: Patients and/or the public were not involved in the design, or conduct, or reporting, or dissemination plans of this research.
Ethics approval: The Institutional Review Board (IRB) of MSHS approved the study (STUDY-20-00338), and informed consent was waived due to the retrospective design.
Data availability statement
All data relevant to the study are included in the article or uploaded as supplementary information.
References
- 1.Camaschella C. Iron deficiency: new insights into diagnosis and treatment. Hematology Am Soc Hematol Educ Program. 2015;2015:8–13. doi: 10.1182/asheducation-2015.1.8. [DOI] [PubMed] [Google Scholar]
- 2.Lopez A, Cacoub P, Macdougall IC, et al. Iron deficiency anaemia. Lancet. 2016;387:907–16. doi: 10.1016/S0140-6736(15)60865-0. [DOI] [PubMed] [Google Scholar]
- 3.Centers for Disease Control and Prevention (CDC) Iron deficiency--United States, 1999-2000. MMWR Morb Mortal Wkly Rep. 2002;51:897–9. https://pubmed.ncbi.nlm.nih.gov/12418542/ Available. [PubMed] [Google Scholar]
- 4.Jefferds MED, Mei Z, Addo Y, et al. Iron Deficiency in the United States: Limitations in Guidelines, Data, and Monitoring of Disparities. Am J Public Health. 2022;112:S826–35. doi: 10.2105/AJPH.2022.306998. [DOI] [PMC free article] [PubMed] [Google Scholar]
- 5.Johnson S, Lang A, Sturm M, et al. Iron Deficiency without Anemia: A Common Yet Under-Recognized Diagnosis in Young Women with Heavy Menstrual Bleeding. J Pediatr Adolesc Gynecol. 2016;29:628–31. doi: 10.1016/j.jpag.2016.05.009. [DOI] [PubMed] [Google Scholar]
- 6.Koleini N, Shapiro JS, Geier J, et al. Ironing out mechanisms of iron homeostasis and disorders of iron deficiency. J Clin Invest. 2021;131:e148671. doi: 10.1172/JCI148671. [DOI] [PMC free article] [PubMed] [Google Scholar]
- 7.Al-Naseem A, Sallam A, Choudhury S, et al. Iron deficiency without anaemia: a diagnosis that matters. Clin Med (Lond) 2021;21:107–13. doi: 10.7861/clinmed.2020-0582. [DOI] [PMC free article] [PubMed] [Google Scholar]
- 8.Balendran S, Forsyth C. Non-anaemic iron deficiency. Aust Prescr. 2021;44:193–6. doi: 10.18773/austprescr.2021.052. [DOI] [PMC free article] [PubMed] [Google Scholar]
- 9.Ioannou GN, Rockey DC, Bryson CL, et al. Iron deficiency and gastrointestinal malignancy: a population-based cohort study. Am J Med. 2002;113:276–80. doi: 10.1016/s0002-9343(02)01214-7. [DOI] [PubMed] [Google Scholar]
- 10.Soppi ET. Iron deficiency without anemia - a clinical challenge. Clin Case Rep. 2018;6:1082–6. doi: 10.1002/ccr3.1529. [DOI] [PMC free article] [PubMed] [Google Scholar]
- 11.Camaschella C. Iron-deficiency anemia. N Engl J Med. 2015;372:1832–43. doi: 10.1056/NEJMra1401038. [DOI] [PubMed] [Google Scholar]
- 12.Clénin G, Cordes M, Huber A, et al. Iron deficiency in sports - definition, influence on performance and therapy. Swiss Med Wkly. 2015;145:w14196. doi: 10.4414/smw.2015.14196. [DOI] [PubMed] [Google Scholar]
- 13.Milman N, Taylor CL, Merkel J, et al. Iron status in pregnant women and women of reproductive age in Europe. Am J Clin Nutr. 2017;106:1655S–1662S. doi: 10.3945/ajcn.117.156000. [DOI] [PMC free article] [PubMed] [Google Scholar]
- 14.Suedekum NA, Dimeff RJ. Iron and the athlete. Curr Sports Med Rep. 2005;4:199–202. doi: 10.1097/01.csmr.0000306207.79809.7f. [DOI] [PubMed] [Google Scholar]
- 15.Krayenbuehl PA, Battegay E, Breymann C, et al. Intravenous iron for the treatment of fatigue in nonanemic, premenopausal women with low serum ferritin concentration. Blood. 2011;118:3222–7. doi: 10.1182/blood-2011-04-346304. [DOI] [PubMed] [Google Scholar]
- 16.Halterman JS, Kaczorowski JM, Aligne CA, et al. Iron deficiency and cognitive achievement among school-aged children and adolescents in the United States. Pediatrics. 2001;107:1381–6. doi: 10.1542/peds.107.6.1381. [DOI] [PubMed] [Google Scholar]
- 17.Nielsen P. Iron deficiency without anemia - more than just a sensitivity disorder. MMW Fortschr Med. 2022;164:24–5. doi: 10.1007/s15006-022-0851-x. [DOI] [PubMed] [Google Scholar]
- 18.Rineau E, Gaillard T, Gueguen N, et al. Iron deficiency without anemia is responsible for decreased left ventricular function and reduced mitochondrial complex I activity in a mouse model. Int J Cardiol. 2018;266:206–12. doi: 10.1016/j.ijcard.2018.02.021. [DOI] [PubMed] [Google Scholar]
- 19.Castelo-Branco C, Quintas L. Iron deficiency without anemia: indications for treatment. GREM Gynecological and Reproductive Endocrinology & Metabolism. 2020;04/2020:215–22. doi: 10.53260/GREM.201043. [DOI] [Google Scholar]
- 20.Brugnara C, Laufer MR, Friedman AJ, et al. Reticulocyte hemoglobin content (CHr): early indicator of iron deficiency and response to therapy. Blood. 1994;83:3100–1. [PubMed] [Google Scholar]
- 21.Iolascon A, Andolfo I, Russo R, et al. Recommendations for diagnosis, treatment, and prevention of iron deficiency and iron deficiency anemia. Hemasphere. 2024;8:e108. doi: 10.1002/hem3.108. [DOI] [PMC free article] [PubMed] [Google Scholar]
- 22.Force UPST, Nicholson WK, Silverstein M, et al. Screening and Supplementation for Iron Deficiency and Iron Deficiency Anemia During Pregnancy: US Preventive Services Task Force Recommendation Statement. JAMA. 2024;332:906–13. doi: 10.1001/jama.2024.15196. [DOI] [PubMed] [Google Scholar]
- 23.Kurstjens S, de Bel T, van der Horst A, et al. Automated prediction of low ferritin concentrations using a machine learning algorithm. Clin Chem Lab Med. 2022;60:1921–8. doi: 10.1515/cclm-2021-1194. [DOI] [PubMed] [Google Scholar]
- 24.Garduno-Rapp NE, Ng YS, Weon JL, et al. Early identification of patients at risk for iron-deficiency anemia using deep learning techniques. Am J Clin Pathol. 2024;162:243–51. doi: 10.1093/ajcp/aqae031. [DOI] [PubMed] [Google Scholar]
- 25.WHO CM . Haemoglobin concentrations for the diagnosis of anaemia and assessment of severity. Geneva: Switz World Heal Organ; 2011. pp. 1–6. [Google Scholar]
- 26.Snook J, Bhala N, Beales ILP, et al. British Society of Gastroenterology guidelines for the management of iron deficiency anaemia in adults. Gut. 2021;70:2030–51. doi: 10.1136/gutjnl-2021-325210. [DOI] [PMC free article] [PubMed] [Google Scholar]
- 27.Fehr J, Favrat B, Schleiffenbaum B, et al. Diagnosis and treatment of iron deficiency without anaemia. Praxis (Bern 1994) 2009;98:1445–51. doi: 10.1024/1661-8157.98.24.1445. [DOI] [PubMed] [Google Scholar]
- 28.Clinical classifications software refined (CCSR) for ICD-10-cm diagnoses. 2022
- 29.Fletcher A, Forbes A, Svenson N, et al. A British Society for Haematology Good Practice Paper. Guideline for the laboratory diagnosis of iron deficiency in adults (excluding pregnancy) and children. Br J Haematol. 2022;196:523–9. doi: 10.1111/bjh.17900. [DOI] [PubMed] [Google Scholar]
- 30.Eckart A, Struja T, Kutz A, et al. Relationship of Nutritional Status, Inflammation, and Serum Albumin Levels During Acute Illness: A Prospective Study. Am J Med. 2020;133:713–22. doi: 10.1016/j.amjmed.2019.10.031. [DOI] [PubMed] [Google Scholar]
- 31.Chen T, Guestrin C. XGBoost: A Scalable Tree Boosting System. 2016;10 doi: 10.1145/2939672.2939785. [DOI] [Google Scholar]
- 32.Andrews NC. Disorders of iron metabolism. N Engl J Med. 1999;341:1986–95. doi: 10.1056/NEJM199912233412607. [DOI] [PubMed] [Google Scholar]
- 33.Philip KEJ, Sadaka AS, Polkey MI, et al. The prevalence and associated mortality of non-anaemic iron deficiency in older adults: a 14 years observational cohort study. Br J Haematol. 2020;189:566–72. doi: 10.1111/bjh.16409. [DOI] [PMC free article] [PubMed] [Google Scholar]
- 34.Munro MG, Mast AE, Powers JM, et al. The relationship between heavy menstrual bleeding, iron deficiency, and iron deficiency anemia. Am J Obstet Gynecol. 2023;229:1–9. doi: 10.1016/j.ajog.2023.01.017. [DOI] [PubMed] [Google Scholar]
- 35.Pawlak R, Berger J, Hines I. Iron Status of Vegetarian Adults: A Review of Literature. Am J Lifestyle Med. 2018;12:486–98. doi: 10.1177/1559827616682933. [DOI] [PMC free article] [PubMed] [Google Scholar]
- 36.Guralnik JM, Eisenstaedt RS, Ferrucci L, et al. Prevalence of anemia in persons 65 years and older in the United States: evidence for a high rate of unexplained anemia. Blood. 2004;104:2263–8. doi: 10.1182/blood-2004-05-1812. [DOI] [PubMed] [Google Scholar]
- 37.Stancu S, Stanciu A, Zugravu A, et al. Bone marrow iron, iron indices, and the response to intravenous iron in patients with non-dialysis-dependent CKD. Am J Kidney Dis. 2010;55:639–47. doi: 10.1053/j.ajkd.2009.10.043. [DOI] [PubMed] [Google Scholar]
- 38.von Haehling S, Jankowska EA, van Veldhuisen DJ, et al. Iron deficiency and cardiovascular disease. Nat Rev Cardiol. 2015;12:659–69. doi: 10.1038/nrcardio.2015.109. [DOI] [PubMed] [Google Scholar]
- 39.Chopra VK, Anker SD. Anaemia, iron deficiency and heart failure in 2020: facts and numbers. ESC Heart Fail. 2020;7:2007–11. doi: 10.1002/ehf2.12797. [DOI] [PMC free article] [PubMed] [Google Scholar]
- 40.Rej R. Aspartate aminotransferase activity and isoenzyme proportions in human liver tissues. Clin Chem. 1978;24:1971–9. [PubMed] [Google Scholar]
- 41.Levey AS. Measurement of renal function in chronic renal disease. Kidney Int. 1990;38:167–84. doi: 10.1038/ki.1990.182. [DOI] [PubMed] [Google Scholar]
- 42.Dossetor JB. Creatininemia versus uremia. The relative significance of blood urea nitrogen and serum creatinine concentrations in azotemia. Ann Intern Med. 1966;65:1287–99. doi: 10.7326/0003-4819-65-6-1287. [DOI] [PubMed] [Google Scholar]
- 43.Achebe MO, Mandell E, Jolley K, et al. Pagophagia and restless legs syndrome are highly associated with iron deficiency and should be included in histories evaluating anemia. Am J Hematol. 2023;98:E8–10. doi: 10.1002/ajh.26775. [DOI] [PubMed] [Google Scholar]
- 44.WHO . Geneva: World Health Organization; 2020. WHO guideline on use of ferritin concentrations to assess iron status in individuals and populations. [PubMed] [Google Scholar]