

Abstract
We describe a new approach for analysis of the epidemiology of progressive genetic disorders that quantifies the rate of progression of the disease in the population by measuring the mutational flow. The framework is applied to Huntington disease (HD), a dominant neurological disorder caused by the expansion of a CAG-trinucleotide sequence to >35 repeats. The disease is 100% penetrant in individuals with ⩾42 repeats. Measurement of the flow from disease alleles provides a minimum estimate of the flow in the whole population and implies that the new mutation rate for HD in each generation is ⩾10% of currently known cases (95% confidence limits 6%–14%). Analysis of the pattern of flow demonstrates systematic underascertainment for repeat lengths <44. Ascertainment falls to <50% for individuals with 40 repeats and to <5% for individuals with 36–38 repeats. Clinicians should not assume that HD is rare outside known pedigrees or that most cases have onset at age <50 years.
Introduction
Huntington disease (HD [MIM 143100]) arises gradually. Subtle motor disorders (Smith et al. 2000) and cognitive deficits (Lawrence et al. 1998) precede chorea, psychiatric disturbances, and global cognitive deterioration. According to Harper (1992, p. 366), “in HD, more than most genetic disorders, all investigators are struck by the number of new affected patients discovered through a detailed and systematic family survey, often as a result of a home visit, whose existence was totally unsuspected, and who would not have been included in any survey limited to primary cases.”
HD shows anticipation, with onset tending to become earlier in successive generations. The disease is caused by the expansion of a CAG repeat in the HD gene (The Huntington's Disease Collaborative Research Group 1993). In European populations, most alleles at the locus have 15–20 repeats. The disease affects individuals with an allele with ⩾36 repeats, but for chromosomes with <41 repeats it is variably penetrant within the normal human life span (Rubinsztein et al. 1996; McNeil et al. 1997). Median age at onset becomes progressively earlier as repeat length increases (Brinkman et al. 1997). Alleles with ⩾36 repeats are highly mutable. The mutation rate is higher in the male germ line, where most of the changes involve increases in repeat length (i.e., there is an upward bias [Kremer et al. 1995; Leeflang et al. 1995]), providing a molecular basis for anticipation.
Before the genotype responsible for HD was determined, new mutations were generally believed to be very rare (Conneally 1984; Harper 1992). Because of the frequent late onset of the disease and the possibility of false paternity, it was difficult to confirm that any individual case was a bona fide new mutation, and many researchers assumed that ambiguous cases were unlikely to be genuine (e.g., see Shaw and Caro 1982). The identification of the HD gene revealed unambiguous evidence of a significant level of new mutation. It was found that, for ∼1%–3% of patients, neither parent had a CAG repeat of size ⩾36 (Andrew et al. 1997). In each of these cases, the new mutation had arisen on paternal transmission of an allele with 27–35 repeats (Goldberg et al. 1993). These repeat lengths, which are rare in the normal population, have been designated “intermediate alleles.” They give no risk of disease to the individual but do give a small risk to his or her children.
Alleles with 36–39 repeats are rare among recognized disease chromosomes (e.g., see Kremer et al. 1994). This rarity, in all likelihood, reflects underascertainment due to incomplete penetrance and/or late onset of the disease. Because of this underascertainment, it seems to follow that we cannot be measuring all the mutations occurring in the population that increase repeat length to ⩾36. Here we consider the evolution of the disease genotype within a population context. We show that a more meaningful estimate of the new mutation rate can be achieved through measurement of the mutational flow. The flow reflects the progression of the genotype within the population in each generation, which, in turn, determines the rate at which new families with HD arise. By comparing the pattern of flow observed for disease alleles with the pattern expected in the whole population, we are able to estimate the degree of underascertainment of each CAG length.
Material and Methods
HD Chromosomes
We used CAG measurements from the HD pedigree collection of the Centre for Molecular Medicine and Therapeutics (CMMT) at the University of British Columbia in Vancouver. The cohort is composed of individuals of primarily Canadian origin, although people of South African and northern-European descent are also represented. The database contained 1,830 genotyped individuals with ⩾36 repeats. The database was also searched for parent-to-offspring transmissions of disease chromosomes, defined as length ⩾36 in either parent or offspring; a total of 459 were found.
During the history of the database, CAG length has been measured by three different methods, the earliest of which included the flanking CCG repeat. For the present study, it was important to maximize the number of available transmissions, while avoiding bias that might result from parent and offspring CAG length being measured by a different method. For measurement of CAG length in each transmission, we therefore chose the most accurate method for which both parent and offspring data was available. Eight transmissions were excluded because there were no matching measurements; this left a total of 451. The flanking CCG was included for 328 of the disease-chromosome measurements and for 143 of the transmissions. Excluding these data increases the sampling variance but does not significantly change any estimate (data not shown).
Mutational Model
A mutational model can be used to describe the repeat-length change, either from parents to offspring, or during the mitotic divisions in the germ cells of a single individual, or over time in a population. Here we use variations of the same model, for all three purposes.
The CAG repeat can mutate to either a longer or a shorter length. The simplest model (the stepwise-mutation model of Kimura and Ohta [1978]) assumes that there is an equal probability of increases and decreases and that the mutation rate is independent of the length of the repeat. Neither of these assumptions is applicable at the HD locus. Large alleles have higher mutation rates, and there is also evidence of an upward bias. Following Rubinsztein et al. (1994), we define a model that can incorporate these characteristics.
Under the model, mutation acts by changing the frequency p(x,t) of repeats that are length x at time t. The mutation rate is given by μxn, where μ is a constant and n determines the degree of length dependence of the mutation rate. For n=0, the mutation rate is independent of repeat length, whereas for n>0 the mutation rate increases progressively for larger repeat lengths. We assume that all repeat-length changes are either stepwise additions or stepwise subtractions of a single repeat: (1+b)/2 of the changes are stepwise increases of one repeat, and the other (1-b)/2 are stepwise decreases; b determines the mutation bias and is constrained to lie between −1 (all mutations decrease repeat length) and +1 (all mutations increase repeat length).
The model has an upper boundary β. All repeats that reach the boundaries are removed. The total frequency of repeats must stay equal to 1, at all times. This is achieved by use of a renormalizing term ζ(t). The rate of change of p(x,t) is given by
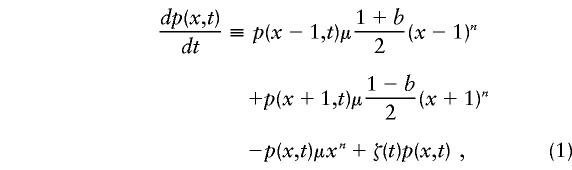 |
for values of x<β, with p(β,t)≡0. The renormalizing term is
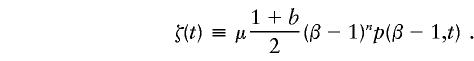 |
The upper boundary is necessary to make the model well defined and capable of being simulated, since, in its absence, repeat length will run off to infinity when b>0 and n>2(Falush and Iwasa 1999). We use the boundary to represent selection against very large repeats—for example, those due to early onset of HD. For these parameter values, increasing the value of β has little effect on the distribution of shorter repeats (D.F., unpublished data). The reason is that, once arrays have reached a large length, they increase very rapidly with high probability and will quickly hit the boundary wherever it is located. For this reason, the main criterion that should be used in choosing β when fitting the model to empirical data is that it should include the largest observed repeat length.
The continuous-time definition of the model (eq. [1]) differs from that of Rubinsztein et al. (1994), who assumed discrete time intervals. Our definition has the advantage that the same model can be adapted to different contexts by measuring time in different units. In order to simulate sperm repeat-length distributions, time is assumed to be proportional to the number of mitoses. According to established physiological models, the number of mitoses undergone by a sperm of a man of age a is approximately 34+23(a-13) , whereas eggs undergo 24 mitoses, irrespective of age (Vogel and Rathenberg 1975). In order to simulate populations, on the other hand, time is assumed to be proportional to the number of generations. In the generational model, we do not distinguish between males and females. To convert between mitotic and generational models, we use 194 as the average number of mitoses. We obtain this number from the consideration that the mean age of fathers in the database is 28.13 years, implying an age of ∼27.4 years at the date of conception. On the basis of the formulas above, there are, on average, 364.8 mitoses in the male germ line and 24 in the female germ line, or an average of 194 mitoses for the sexes combined.
We simulated one generation of a finite population by starting with the initial frequency distribution in the population and running equation (1) for one generation. This provided the frequency distribution expected in the next generation. To calculate the actual numbers for each repeat length, random numbers were generated from a multinomial distribution. To record the mutational flow in the final generation of the simulation, we separately calculated, for each combination of x and y, the expected and actual numbers that mutated from length x to length y. This method of simulation (which also differs from that of Rubinsztein et al. [1994]) has the advantage that the simulation time is almost independent of population size, making it practical to simulate very large populations.
Results
Mutational Properties of Disease Alleles
Leeflang et al. (1999) measured the CAG length of 3,672 sperm carrying an HD disease allele, by using single-sperm PCR. The sperm were collected from 26 individuals in the large Venezuelan pedigree with HD. The range of somatic repeat length of their disease alleles was 37–62. To estimate mutational parameters on the basis of the data, we assumed that the initial distribution (t=0) for sample j with somatic repeat length sj was
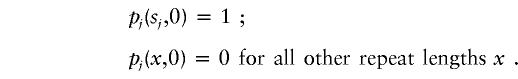 |
We set β=160 to include the largest sperm (length 159) in Leeflang et al.'s sample. The model is run for time tj=34+23(aj-13), where aj is the age at which the sperm sample was collected. The total log likelihood that the data will be observed in all samples, given the mutational parameters μ, n, and b, is
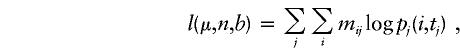 |
where mij is the number of sperm in sample j that have i repeats.
We fitted the mitotic model to the distribution for all 27 samples (one individual was sampled at two ages), using a grid search to find the combination of parameters that gave the highest likelihood. To limit the search time, we considered only integer values of n. We obtained estimates for the mutation bias, b=.277; the degree of length dependence of the mutation rate, n=8; and the mutation rate per mitosis, μ=1.05×10⁻¹⁵. These parameters imply that, for a repeat of length 40, the mutation rate per mitosis is 0.0069. The model (represented by the line in each graph in fig. 1) accurately predicts both the modest skew observed in the sperm of individuals with somatic repeat lengths <44 (e.g., sample S shown in figure 1) and the more-pronounced skew in individuals with repeat lengths 44–49 (e.g., sample N).
Figure 1.

Repeat-length distribution for 8 of the 27 samples collected by Leeflang et al. (1999), compared with the distributions predicted by the mitotic model. The samples were chosen to illustrate the full range of variation—both in terms of mutational properties and in terms of goodness of model fit—that was observed in the data.
The mitotic model fits the data significantly better than does a model that incorporates no age dependence (dashed line in fig. 2; P≪.01, by likelihood-ratio test) but, nevertheless, fails to explain a large proportion of the interindividual variation in mutational spectra. In particular, for sample P the sperm repeat length has a much higher mean and variance than are predicted by the model, and for sample A it has a much higher mean. The deviation from the model shows little obvious pattern, except that the model tends to underestimate the upward bias for somatic repeat lengths >49. Most of the remaining variation is not attributable to either age or CAG length.
Figure 2.

Mean (A) and variance (B) of repeat-length distribution in 27 sperm-typing samples collected by Leeflang et al. (1999) (dots), compared with the corresponding values as predicted by the mitotic model (crosses). The dashed line indicates the values expected under the best-fit model with no age effect. The solid line in panel A shows the length that would be observed if all sperm were identical to somatic cells. The fact that all points are above this line shows that there is an upward bias in the germ line of each individual. The somatic repeat lengths of some samples have been displaced fractionally from integer values, to maximize their visibility on the graphs. The letters indicate the sample names used by Leeflang et al.
We have also tested the model by using pedigree data, by comparing the distribution of sizes of mutations observed in transmissions of disease chromosomes versus the prediction by the model when the parents' repeat length, age, and sex are given (fig. 3). The sample is not a random subset of all such transmissions, however, since the phenotype of the offspring has played some role in the ascertainment of approximately half of the sample (table 1). As a consequence, we expect to observe more increases in repeat length—and fewer decreases—than the model predicts. For this reason, it is not appropriate either to estimate model parameters on the basis of pedigree data or to assess the fit of the model quantitatively. The model fits the observed pattern of paternally derived mutations quite well, although it underestimates the number of large increases. With regard to maternal transmission, the model significantly underestimates both the number of large increases and the number of large decreases. This concords with evidence from other microsatellite loci (Huttley et al. 2000), which implies that the sex difference in mutation rate is smaller than would be predicted on the basis of the relative number of mitoses in male versus female germ lines.
Figure 3.

Expected distribution of changes (% of sample), in one generation, under the mitotic model, compared with observations from 209 paternal transmissions (A), 214 maternal transmissions (B), and the complete sample of 451 transmissions (C).
Table 1.
Disease-Chromosome Transmissions in the CMMT Database[Note]
|
No. of Cases |
||
| Parental Source of Transmissionand Status of Offspring | Parent Affected | Parent Unaffected |
| Paternal: | ||
| Affected | 88 | 8 |
| Unaffected: | ||
| CAG ⩾36 | 93 | 17 |
| CAG <36 | 68 | 16 |
| DNA unavailablea | 171 | 8 |
| Maternal: | ||
| Affected | 90 | 0 |
| Unaffected: | ||
| CAG ⩾36 | 123 | 8 |
| CAG <36 | 121 | 7 |
| DNA unavailablea | 244 | 3 |
| Sex of parent unknown: | ||
| Affected | 9 | 0 |
| Unaffected: | ||
| CAG ⩾36 | 12 | 2 |
| CAG <36 | 7 | 1 |
| DNA unavailablea | 13 | 1 |
Note.— In this table, we show all cases in which the parent has a chromosome with CAG ⩾36, as well as those in which the parental chromosome has given rise to a new mutation in one of his or her children. When the offspring has CAG <36, this generally represents a case of nontransmisssion of the disease chromosome.
Offspring has been entered into the database but, as yet, has not requested genetic testing through the CMMT.
We can also test the fit of the generational model to the pedigree data. We assume 194 mitoses per generation, as estimated, above, on the basis of the average number of mitoses in the male and female germ lines. A mutation rate of 0.0069 per mitosis for a repeat of length 40 implies an average of 1.34 mutations per generation. However, after the repeat has mutated once, the mutation rate changes. Although, since it does not distinguish between maternal and paternal transmission, this model may appear oversimplified, it gives a reasonable fit to the distribution of mutation sizes observed in all 451 transmissions (fig. 3C). The frequency of large increases is again underestimated.
In summary, we have shown that a simple length-dependent mitotic model can account adequately for (a) the repeat-length distribution observed in individual sperm samples, (b) the mutation-rate variation between samples with different somatic repeat lengths, and (c) the overall pattern of mutation observed in disease-chromosome transmissions. Mutation is upwardly biased for all repeat lengths, and the mutation rate is strongly dependent on the length of the repeat. Under the best-fit model, there are 1.77 stepwise increases in length for every stepwise decrease, and the mutation rate per mitosis is 60 times higher for repeats of length 60 than for repeats of length 36.
Although the model accounts for most features of the empirical data, there are some discrepancies:
-
1.
The model underestimates the mutation rate for female transmission. Both increases and decreases in length are more common than expected. This discrepancy arises either because there is an elevated mutation rate in the meiotic divisions, because there are replication-independent mutational events, or because of qualitative mutation differences between male and female germ lines. The elevated level of large deletions in the maternal data suggests a qualitative difference in mutational properties, but further data are needed to confirm this. At other (i.e., nontrinucleotide) disease loci, there is evidence for an elevated level of deletions in the female germ line (Grimm et al. 1994).
-
2.
In the Leeflang et al. data set, there is substantial interindividual variation that cannot be accounted for by either age or somatic repeat length. These individuals share the same haplotype, so the variation is not due to genetic variation at closely linked sites (i.e., to cis-acting factors); instead, it must be attributed to either stochastic mutational events in early germ cell divisions (clustered mutation [Jones et al. 1999]), genetic variation in germ-line mutational properties that is caused by unlinked (trans-acting) factors, or environment. Unfortunately, none of these factors is easy to investigate or model.
-
3.
Some of the observed large increases and all of the (very rare) large decreases in repeat length are unlikely under the model. The pattern of variation that is observed suggests that larger-than-stepwise changes in repeat length do occur at a significant rate. However, not all large changes in length happen because of a single big event. Each increase in repeat length elevates the mutation rate, so large increases can occur through repeated small mutations in the course of the numerous male germ-cell divisions, especially in individuals with elevated mutation rates.
-
4.
The model tends to underestimate the mutational bias in sperm samples from individuals with somatic repeat lengths >49.
Likelihood of Observed New Mutations under the Mitotic Model
New mutations are rare in pedigree data. Of the 451 transmissions in the CMMT database, 8 represent new mutations to length ⩾36 from a shorter repeat length; in six of these cases, repeat length had increased by ⩾9 repeats (table 2); the other two transmissions represented small increases in repeat length that were ascertained on the basis of affected individuals elsewhere in the pedigree.
Table 2.
Genotypic New Mutations in the CMMT Database[Note]
|
Repeat Length in |
||||
| Father | Offspring | Age Difference(years) | Offspring Affected? | Probability of Mutationa |
| 34 | 36 | 31 | No | .21 |
| 35 | 36 | 36 | No | .52 |
| 31 | 44 | 34 | Yes | 1.7×10⁻⁷ |
| 33 | 44 | 27 | Yes | 2.1×10⁻⁶ |
| 35 | 45 | 27 | Yes | 1.2×10⁻⁴ |
| 30 | 49 | NA | Yes | NA |
| 34 | 43 | NA | Yes | NA |
| 27 | 38 | NA | Yes | NA |
Note.— Because of the specific interest that the research groups (e.g., Goldberg et al. 1993, 1995; Chong et al. 1997) have in these patients, new mutations may be slightly overrepresented in the CMMT database. To be conservative, we have included only examples in which DNA is available from both parents. In two additional cases, DNA from only one parent is available; in four other cases, the new mutation has been inferred on the basis of the repeat length in sibs.
Under the mitotic model.
All of the six large increases are very unlikely under the mutational model (see table 2). The primary reason for this is the method of ascertainment; new mutations are detected because of the large repeat length of the offspring, and they therefore fall within the extreme right-hand tail of the distribution of repeat lengths inherited from intermediate alleles. Even when this ascertainment effect is taken into account, the large increases are still not well predicted by the model. The population frequency of intermediate alleles is ∼1% in European chromosomes (Goldberg et al. 1995). So we would expect to observe an event with probability 1.7×10⁻⁷ (table 2) once, on average, if we sampled from 6×10⁸ chromosome transmissions. Although it is difficult to quantify, the CMMT chromosomes come from a much smaller pool of births. The deviations from the model that are most likely to account for these mutations are either larger-than-stepwise increases or elevated germ-line mutation rates in a small proportion of fathers.
Another important issue concerning these new mutations is whether they are representative of the increases in repeat length to ⩾36 that occur in the population. A comparison with the repeat-length changes observed in sperm samples from carriers of intermediate alleles also suggests that the six large increases are highly atypical. Of the 95 mutations to length ⩾36 that were observed by Chong et al. (1997), only 2 were increases of >5 repeats; one of these was an increase of 6 repeats, and the other was a increase of 8 repeats. From this we conclude that the majority of ascertained new mutations are “outliers,” which are detected because they cause an unusually abrupt change in phenotype. Many new mutations cause mild phenotypes. They are unlikely to be noticed while the father is still alive, and it is plausible that they could escape detection for several generations. A different approach is needed to estimate the true new-mutation rate for HD.
Estimate of Mutational Flow from Transmissions of Disease Alleles
The mutational flow is defined as the net number of chromosomes mutating beyond a given repeat length. The flow at length 35.5 is the number of chromosomes mutating from ⩽35 to ⩾36 (the new-mutation rate), minus the number of chromosomes mutating from ⩾36 to ⩽35 (the back-mutation rate). So, for example, if the parent has 36 repeats and the offspring has 39, then this transmission represents a flow of +1 beyond lengths 36.5, 37.5, and 38.5 and a flow of 0 at all other repeat lengths; if the parent has 37 repeats and the offspring has 36, then this represents a flow of −1 at length 36.5 and a flow of 0 at all other repeat lengths. The flow is averaged over all transmissions. The flow is a useful concept because of its properties in a large population. Here, we will assume that the human population is large in the relevant sense.
Figure 4A shows the flow in a simulated large population. There is an approximately constant positive flow at all repeat lengths between 20.5 and the upper boundary, which is at length 60. If the flow is measured at length 45.5, for example, this therefore provides an estimate of the flow at length 35.5.
Figure 4.

Mutational flow per 100,000 individuals in a simulated large population. A and B, Flow in a single generation in the whole population (unbroken line) and as estimated on the basis of disease-chromosome transmission in which ascertainment depends on the repeat length in either the offspring (dotted line) or parent (dashed line) and increases linearly, from 10% of transmissions, at repeat length 36, to 100% of transmissions, at length 45. A, No selection until repeat length 60. B, 1% Reduction in fitness for each repeat >35. C and D, Flow (dashed line), estimated differential flow (eq. [2]) (thinner unbroken line), and estimated point flow (eq. [3]) (thicker unbroken line). Both the estimated differential flow and the estimated point flow are based on the repeat-length distribution and an accurate mutational model. C, Whole population. D, Ascertained disease chromosomes only. Ascertainment is dependent on repeat length, with ascertainment rates increasing linearly, from 10%, at length 36, to 100%, at length 45. All results were obtained from a single simulated population of constant size 10,000,000 that evolved for 10,000 generations after being fixed for 18 repeats. We used the generational model, in which the mutational parameters were estimated on the basis of sperm-typing data, as explained in the text. The upper boundary value β=60 was chosen to optimize visual presentation.
The disease-chromosome transmissions that we observe represent a very small fraction of the transmissions in the whole population. They are ascertained on the basis of the disease phenotypes of the parent, child, and/or other individuals in the pedigree (table 1). In the developed world, most individuals with a chromosome with 50 repeats probably come to medical attention, since disease onset in such cases reliably occurs at age <40 years (Brinkman et al. 1997). Chromosomes with length 36–39 are rare among disease chromosomes and are occasionally found in unaffected individuals from the general population (e.g., see De Rooij et al. 1993), so it is clear that ascertainment is lower for these repeat lengths. What is less clear is the level of ascertainment between these two extremes. For the moment, we will assume that ascertainment increases progressively with repeat length. We will estimate actual ascertainment levels below.
The probability that a transmission in which the parent has x repeats and the offspring has y repeats will be ascertained depends, in a unknown way, on both x and y and also on the CAG length in other close relatives. We consider two very simple models of the ascertainment process. In the first model , ascertainment is entirely dependent on the CAG length in the parent. The probability that a particular transmission will be ascertained is given by δ(x), where
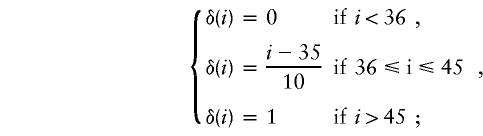 |
that is, ascertainment increases linearly from 10%, at length 36, to 100%, at length 45. In the second model, we assume that ascertainment is based on the genotype of the child, so that the probability that the transmission will be observed is given by δ(y).
Simulation of these models (fig. 4A) shows that, when ascertainment is based on paternal genotype, flow estimates are negative at some repeat lengths and never exceed the true flow in the population; in contrast, if flow estimates are based on offspring genotype, then the estimated flow has a peak slightly higher than that of the true flow. HD normally affects parents first, so that, in practice (table 1), ascertainment is most dependent on parental genotype. The model results therefore suggest that, at all repeat lengths, the ascertained flow should either equal or underestimate the population flow.
One factor that can alter the pattern of flow is selection against large alleles, either because of clinical disease or because of the more subtle, subclinical effects due to the presence of an expanded CAG repeat. In figure 4A, there is no selection against disease alleles until they reach repeat length 60. In figure 4B, by contrast, we impose progressively stronger selection, starting at length 36. Fitness is 100% for chromosomes with ⩽35 repeats, 99% at length 36, 98% at length 37, etc. In this case, the flow decreases beyond length 35.5, so that the flow at length 45.5 is a substantial underestimate of the new-mutation rate.
Together, the arguments given above suggest that the flow will be underestimated for very large repeat lengths, because of selection against disease alleles, but that it will also be underestimated for short repeat lengths, because of incomplete ascertainment. It should therefore be expected that the flow estimated on the basis of disease alleles will peak at an intermediate repeat length. If there is little or no selection before medical ascertainment (as in fig. 4A), then the peak flow will be close to the net new-mutation rate for the whole population; in contrast, if there is significant selection, then the new-mutation rate will be underestimated by the peak flow (as in fig. 4B).
The flow estimated on the basis of all 451 transmissions of disease chromosomes peaks at length 43.5, at 0.1 per ascertained transmission (fig. 5A). The flow measured on paternal transmission peaks at 0.20 per transmission, at length 43.5, whereas the maternal flow is negative at length 40, peaking at 0.05 per transmission, at length 48. The higher magnitude of flow in paternal transmission reflects the higher mutation rate and stronger upward bias. The sex difference in the peak and trough of the flow reflects a sex difference in the pattern of ascertainment. For maternal transmissions, the majority were ascertained on the basis of the phenotype of the parent alone, whereas, for paternal transmissions, offspring genotype was more important (table 1). The simulation results (fig. 4A) correctly imply that, for this reason, maternal transmission should have both a later peak and a more negative trough.
Figure 5.

Mutational flow estimated on the basis of 449 disease-chromosome transmissions. A, Flow per transmission, in paternal and maternal inheritance (dashed lines) and in all transmissions (unbroken line). B, Ratio (flow at length x)/(flow at length 43.5). Bars indicate 95% confidence limits, calculated by means of a percentile bootstrap.
The shape of the flow for large repeat lengths provides evidence on natural selection at the locus. Unfortunately, the shape has a high sampling variance (fig. 5B). In 2.5% of bootstrap replicates, the flow at length 53.5 is <40% of the flow at length 43.5. This would imply strong selection against alleles of length 44–53. However, in 2.5% of replicates the flow at length 53.5 actually exceeds the flow at length 43.5, implying little selection up to length 53 and/or underascertainment of alleles of length 43.5. Therefore, this sample of mutations offers inconclusive evidence on the pattern of selection.
The confidence limits of each flow estimate are approximately inversely proportional to the square root of the sample size, implying that a fourfold increase in sample size is necessary to halve the size of the confidence limit for the flow at a single point. So, if, for example, we collected 10 times more data, then we might be allowed to conclude that the flow at length 46.5 was 72%–98% of the value at length 43.5, implying significant selection by length 46, and that the flow is reduced by between a factor of two and three by length 59.5 (this was calculated by use of our data set repeated 10 times).
Flow Estimation by the Mutational Model
This direct estimate of the flow makes few assumptions but has two important limitations. First, the estimated flow at each point is based on a relatively small number of mutations and, therefore, has a high sampling variance. Second, ascertainment of the transmissions depends, in a complicated way, on the genotype of parent and offspring, making it difficult to extrapolate from the observed level of flow to the degree of underascertainment of shorter disease alleles.
An alternative approach uses the mutational model. The principle is to use the model to calculate the expected flow in a single transmission for each disease chromosome. For simplicity, we ignore both the sex of the carrier and the question of whether the chromosome is in fact transmitted to any offspring. We use the generational model to calculate the average expected flow of all of the genotyped disease chromosomes in the database.
Because our model is defined in continuous time, it is mathematically natural to calculate the initial expected rate of flow, rather than the expected flow in a single transmission. This approach leads to a method for estimation of ascertainment levels. On the basis of equation (1), the expected flow beyond length x+0.5, per unit of time, is
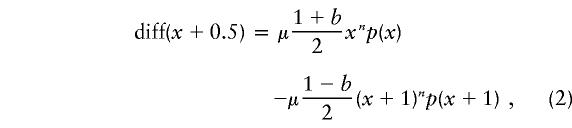 |
where p(x) is the frequency of chromosomes at length x. This is the differential flow. When the mutational model is correct, as in the simulated examples (fig. 4C and D), the differential flow peaks at approximately the same level as does the true population flow (fig. 4C). However, because the statistic is the difference between two numbers of similar magnitude, it has a high sampling variance. When the differential flow is calculated on the basis of ascertained disease chromosomes, its value is very sensitive to ascertainment-level differences between repeat lengths (fig. 4D), and it gives negative values at some lengths. It is not possible to estimate ascertainment levels on the basis of the value of the differential flow at any one point.
A preferable statistic is the point flow:
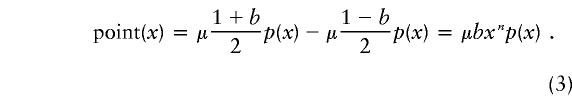 |
The point flow also peaks at approximately the same level as does the true population flow (fig. 4C), but it has a lower sampling variance. The value of the point flow estimated at each repeat length is proportional to the ascertainment level at that length. This property allows us to make estimates of the degree of underascertainment. The flow peaks at length 44, at 0.093 per ascertained disease chromosome (fig. 6A). We assume conservatively that there is 100% ascertainment at length 44 and that selection has not reduced the frequency of the repeats. The lower value of flow at other repeat lengths is assumed to be due to both underascertainment at shorter repeat lengths and selection against larger repeat lengths. The value of (point flow at length x)/(point flow at length 44) then provides an estimate of the proportion by which selection or underascertainment has reduced the measured flow. This approach (fig. 6B) implies that incomplete ascertainment has significantly reduced the measured flow for repeats of length ⩽42 and that selection has significantly reduced it for repeat lengths of ⩾45. Ascertainment levels drop from 40%, at length 40, to <5%, for repeats of length 36–38.
Figure 6.

Mutational flow estimated on the basis of repeat-length distribution in 1,830 disease chromosomes. A, Estimated point flow (unbroken line) and estimated differential flow (dashed line). Because they have a high sampling variance, repeat lengths >70 are not shown. B, Ratio (point flow at length x)/(point flow at length 44) (unbroken line). The ratio provides an estimate of the degree of underascertainment for repeat lengths >44. Bars indicate 95% confidence limits, calculated by means of a percentile bootstrap.
Discussion
Mutational Flow and HD Epidemiology
The measurement of mutational flow provides the appropriate framework for analysis of the epidemiology of dominant disorders caused by a progressive genotype. In order to measure the flow at a particular point on the course of a river, the number of molecules crossing the point that are going upstream is subtracted from the number that are going downstream. The flow abstracts from local noise to the total movement of water. The mutational flow, defined as the net number mutating past a particular repeat length, gives a similar insight into the overall progression of the disease in the population. The flow is calculated by relating the genotype or phenotype (the latter is not presented) of the parents to that of the offspring. Flow measurements can be used to estimate the new-mutation rate of the disorder, the level of underascertainment of mild genotypes or phenotypes, and the strength of selection against severe and mild genotypes.
Our initial application of this approach to HD has demonstrated that the new-mutation rate for the disease is much higher than has generally been assumed. HD has been a textbook example of a genetic disease that, because its onset typically occurs after reproductive age, has been at little or no selective disadvantage (e.g., see Vogel and Molulsky 1986—where, of the genetic diseases listed, HD has the lowest mutation rate). Our analysis of the pattern of flow demonstrates that this paradigm is not correct. The peak value of the flow, at length 43.5, implies a historical selective coefficient against disease chromosomes (as currently ascertained) that is ∼10%.
There are significant practical difficulties involved in making a rigorous epidemiological estimate of the new-mutation rate by direct measurement of the mutational flow. Ideally, parent and offspring CAG length should be obtained for all HD births within a given time period and geographical area. Since CAG testing has become widespread only recently, and because the age at which carriers are genotyped varies greatly, it will be many years before a study can be designed in this way. We have instead used all available disease-chromosome transmissions in the CMMT database. These transmissions were mostly ascertained on the basis of parental phenotype (table 1) and appear to be representative of the transmissions that result in ascertained disease chromosomes. Simulation results (fig. 4A and B) imply that, when chromosomes are ascertained on the basis of parental phenotype, the flow estimates generally will underestimate the true value in the population. Our estimate of 10% is therefore a conservative indication of the new-mutation rate per disease chromosome per generation at current ascertainment levels in Canadians and Europeans. For calculation of the new-mutation rate in a specific population, our estimate needs to be multiplied by the frequency, at birth, of ascertained disease chromosomes; for example, if the offspring of the transmissions in the CMMT database have an ascertainment profile similar to that of known cases of HD in South Wales, then a South Wales HD heterozygote frequency of 2×10⁻⁴ (Harper et al. 1979) implies a new-mutation rate of 2×10⁻⁵ per birth. Premolecular epidemiological estimates (Harper 1992) range between 0 and 0.96×10⁻⁵, with a mode of 0.08×10⁻⁵.
For an accurate measure of the mutational flow, the number of transmissions in the sample needs to be very large. Our estimate of 10% ± 4% for the peak flow at length 43.5 is based on 451 disease-chromosome transmissions. The sampling variance is high because the flow represents the difference between two numbers of similar magnitude—that is, the number increasing in length minus the number decreasing—and because only a small fraction of the sample flows beyond any given point. If a heterozygote frequency of 2×10⁻⁴ is assumed, then these transmissions represent the disease chromosomes from 2.2 million births. Harper (1992) has suggested that, for logistical reasons, HD prevalence estimates should be made for population sizes of 500,000–5,000,000. Several decades of data would be needed in order to get an equivalent sample size to the present study, even for populations at the upper end of this size range. Even our large sample provides only limited information on selection at the locus. In particular, the data are consistent with either a sharp peak in the pattern of flow or a short plateau between lengths 43 and 53: a sharp peak would imply that there is a range of repeat lengths in which the genotype causes a significant selective disadvantage but which, nevertheless, is systematically underascertained; a plateau would be consistent with the selective neutrality of these genotypes.
Because of the sample-size issue, we have developed an alternative approach to estimation of the flow, one that is based on a mutational model of CAG repeat–length change. The flow is estimated by calculation of the expected distribution of CAG repeat-length changes in a single generation for ascertained disease chromosomes. The estimates of flow are only as accurate as the mutational model used to calculate them, but, depending on the method of calculation, the sampling variance can be much lower than that based on direct observation of parent-to-offspring transmissions (compare the sizes of the bars in figs. 5 and 6). In addition, only one generation of data is needed, which makes cohort studies much more feasible. We estimated model parameters by using Leeflang et al.'s (1999) data from single-sperm–typing experiments on disease carriers. The pattern of flow that we obtained from the 1,830 disease chromosomes in the CMMT database (fig. 6A) is qualitatively and quantitatively very similar to that obtained from disease-chromosome transmissions (fig. 5A) and implies that selection is progressive and that it probably overlaps with underascertainment. We also estimated the minimum degree of underascertainment as a function of repeat length, using the same approach (fig. 6B).
The mutational flow has important advantages over traditional measures of disease levels. The peak flow gives a more accurate indication of the true level of HD in a population than disease prevalence or incidence because it is relatively insensitive to ascertainment levels. Underascertainment chiefly affects more mildly affected patients, most of whom will have disease alleles shorter than the repeat length at which the flow peaks. For this reason, we propose that the comparison of peak flows should become the method of choice for determining relative disease levels in different populations. Furthermore, comparison of the pattern of flow could also be used to measure differences in ascertainment.
Clinical Implications
A rigid distinction between “intermediate alleles,” which have 29–35 repeats, and “disease alleles,” which have ⩾36 repeats does not reflect current clinical reality. Only a small minority of individuals with 36–39 repeats are medically ascertained. The estimates in figure 6B imply that, among individuals with ⩾36 CAG repeats, the number who are never ascertained is twice the number of those who are ascertained. These estimates are conservative, because of the possibility of underascertainment at length 44. To include all individuals with ⩾36 CAG repeats, incidence estimates should therefore be at least tripled. However, a significant proportion of these individuals do not develop disease (Rubinsztein et al. 1996, McNeil et al. 1997).
At present, there are no reliable methods for estimating what proportion of ascertained or unascertained individuals with ⩾36 CAG repeats will actually develop disease. It does not seem feasible to ascertain all individuals in a population with ⩾36 CAG repeats, and a prospective cohort study would take several decades. When retrospective data are used, it is unclear to what extent ascertainment depends on the phenotype of the individual, the phenotypes of close relatives, or the alertness of local physicians. Ascertainment based on the phenotype of the individual would make age-at-onset distributions calculated on the basis of ascertained individuals unduly pessimistic—as might relative-based ascertainment, if there is heritable variation in susceptibility (McNeil et al. 1997). Random ascertainment due to local differences in HD awareness would lead to unbiased estimates. The degree of uncertainty becomes more acute as ascertainment decreases. Genetic counseling of individuals with 36–39 repeats should mention both the high degree of uncertainty that surrounds their prognosis and the good news that they are unlikely to develop severe clinical symptoms before old age.
We can be sure that many unascertained individuals do develop disease. For example, our analysis (fig. 6B) implies that ascertainment levels at lengths 42 and 43 are, respectively, ∼20% and ∼5% lower than those at length 44. Penetrance is ∼100% at these lengths, because, of the many individuals who have these repeat lengths and who have been ascertained on the basis of affected relatives with larger alleles, very few have been observed who reach age 60 years and do not develop the disease. On the basis of this reasoning, it seems very likely that we are missing >20% of affected individuals with 36–41 repeats. Affected individuals in this range have a phenotype that, on average, is more mild than that in individuals with 42 repeats, and they are also less likely to have affected relatives with larger expansions.
Late-onset HD principally causes motor disorders and has a relatively benign course, with little effect on life expectancy. James et al. (1994) have highlighted the particular problems concerning the detection and diagnosis of these motor disorders. In a study of 33 cases with an onset age of 60 years, they found that only 3 were initially noted by the patient themselves and that more than half the patients with obvious signs of HD died either being unaware or continually denying the presence of symptoms; the 10 individuals in the study who were genotyped all had either 38 or 39 repeats.
New mutations are much more common than previously had been thought. Approximately 10% of individuals who develop clinical disease have parents who, on the basis of their own phenotype, would not have been considered to be carriers of HD. Therefore, health-care workers should not assume that HD is either principally a disease of middle age or a disease that is rare outside known pedigrees. As James et al. (1994) have stressed, the detection of late-onset cases would make it possible to inform and council younger generations, who will often prove to be more seriously affected.
The progress that is currently being made in the understanding of the pathology of HD gives us a realistic hope that effective treatments will soon become available. At that point, it will become important to detect a higher proportion of the at-risk and mildly affected individuals in the population. An increased understanding of the ascertainment process will be important in the development of effective strategies by which this can be achieved.
Acknowledgments
This work was prompted by a discussion, with David C. Rubinsztein, on the magnitude of the new-mutation rate of HD. Sarah P. Otto provided tested routines for generation of random numbers from a binomial distribution. We also thank Paul Marjoram and Enzo Russo and anonymous reviewers for comments, and we thank Mike Boots, Mashashi Kamo, Dean Elterman, Atsushi Mochizuki, Akira Sasaki, Akiko Satake, Shusaku Toyah, and Thierry Wirth for help. The authors were supported by the Japan Society for the Promotion of Science (support to D.F.), the Medical Research Council of Sweden (support to E.W.A.), the Medical Research Council of Canada (support to R.R.B), the Ministry of Education, Science, and Culture, Japan (support to Y.I.), and the Canadian Institutes of Health Research (support to M.R.H.).
Electronic-Database Information
The accession number and URL for data in this article are as follows:
- Online Mendelian Inheritance in Man (OMIM), http://www.ncbi.nlm.nih.gov/Omim/ (for HD [MIM 143100])
References
- Andrew SA, Goldberg YP, Hayden MR (1997) Rethinking genotype and phenotype correlations in polyglutamine expansion disorders. Hum Mol Genet 6:2005–2010 [DOI] [PubMed] [Google Scholar]
- Brinkman RR, Mezei MM, Theilmann J, Almqvist E, Hayden MR (1997) The likelihood of being affected with Huntington disease by a particular age, for a specific CAG size. Am J Hum Genet 60:1202–1210 [PMC free article] [PubMed] [Google Scholar]
- Chong SS, Almqvist E, Telenius H, LaTray L, Nichol K, Bourdelat-Parks B, Goldberg YP, Hadad BR, Richards F, Sillence D, Greenberg CR, Ives E, VandenEngh G, Hughes MR, Hayden MR (1997) Contribution of DNA sequence and CAG size to mutation frequencies of intermediate alleles for Huntington disease: evidence from single sperm analyses. Hum Mol Genet 6:301–309 [DOI] [PubMed] [Google Scholar]
- Conneally PM (1984) Huntington disease: genetics and epidemiology. Am J Hum Genet 36:506–526 [PMC free article] [PubMed] [Google Scholar]
- De Rooij KE, De Koning Gans PA, Skraastad MI, Belfroid RD, Vegter-Van Der Vlis M, Roos RA, Bakker E, Van Ommen GJ, Den Dunnen JT, Losekoot M (1993) Dynamic mutation in Dutch Huntington's disease patients: increased paternal repeat instability extending to within the normal size range. J Med Genet 30:996–1002 [DOI] [PMC free article] [PubMed] [Google Scholar]
- Falush D, Iwasa Y (1999) Size-dependent mutability and microsatellite constraints. Mol Biol Evol 16:960–966 [Google Scholar]
- Goldberg YP, Kremer B, Andrew SE, Theilmann J, Graham RK, Squitieri F, Telenius H, Adam S, Sajoo A, Starr E, Heiberg, A, Wolff G, Hayden MR (1993) Molecular analysis of new mutations for Huntington's disease: intermediate alleles and sex of origin effects. Nat Genet 5:174–179 [DOI] [PubMed] [Google Scholar]
- Goldberg YP, McMurray CT, Zeisler J, Almqvist E, Sillence D, Richards F, Gacy AM, Buchanan J, Telenius H, Hayden MR (1995) Increased instability of intermediate alleles in families with sporadic Huntington disease compared to similar sized intermediate alleles in the general population. Hum Mol Genet 4:1911–1918 [DOI] [PubMed] [Google Scholar]
- Grimm T, Meng G, Liechti-Gallati S, Bettecken T, Müller CR, Müller B (1994) On the origin of deletions and point mutations in Duchenne muscular dystrophy: most deletions arise in oogenesis and most point mutations result from events in spermatogenesis. J Med Genet 31:183–186 [DOI] [PMC free article] [PubMed] [Google Scholar]
- Harper PS (1992) The epidemiology of Huntington's disease. Hum Genet 89:365–376 [DOI] [PubMed] [Google Scholar]
- Harper PS, Walker DA, Tyler A, Newcombe RG, Davies K (1979) Huntington's chorea: the basis for long-term prevention. Lancet 2:346–349 [DOI] [PubMed] [Google Scholar]
- Huntington's Disease Collaborative Research Group, The (1993) A novel gene containing a trinucleotide repeat that is expanded and unstable on Huntington's disease chromosomes. Cell 72:971–983 [DOI] [PubMed] [Google Scholar]
- Huttley GA, Jakobsen IB, Wilson SR, Easteal S (2000) How important is DNA replication for mutagenesis? Mol Biol Evol 17:929–937 [DOI] [PubMed] [Google Scholar]
- James CM, Houlihan GD, Snell RG, Cheadle JP, Harper PS (1994) Late-onset Huntington's disease: a clinical and molecular study. Age Ageing 23:445–448 [DOI] [PubMed] [Google Scholar]
- Jones AG, Rosenqvist G, Berglund A, Avise JC (1999) Clustered microsatellite mutations in the pipefish Syngnathus typhle. Genetics 152:1057–1063 [DOI] [PMC free article] [PubMed] [Google Scholar]
- Kimura M, Ohta T (1978) Stepwise mutation model and distribution of allelic frequencies in a finite population. Proc Natl Acad Sci USA 75:2868–2872 [DOI] [PMC free article] [PubMed] [Google Scholar]
- Kremer B, Almqvist E, Theilmann J, Spence N, Telenius H, Goldberg YP, Hayden MR (1995) Sex-dependent mechanisms for expansions and contractions of the CAG repeat on affected Huntington disease chromosomes. Am J Hum Genet 57:343–350 [PMC free article] [PubMed] [Google Scholar]
- Kremer B, Goldberg P, Andrew SE, Theilmann J, Telenius H, Zeisler J, Squitieri F, Lin B, Basset A, Almqvist E, Bird TD, Hayden MR (1994) A worldwide study of the Huntington's disease mutation: the sensitivity and specificity of measuring CAG repeats. N Engl J Med 330:1401–1406 [DOI] [PubMed] [Google Scholar]
- Lawrence AD, Hodges JR, Rosser AE, Kershaw A, Ffrench-Constant C, Rubinsztein DC, Robbins TW, Sahakian BJ (1998) Evidence for specific cognitive deficits in preclinical Huntington's disease. Brain 121:1329–1341 [DOI] [PubMed] [Google Scholar]
- Leeflang EP, Tavare S, Marjoram P, Neal COS, Srinidhi J, MacDonald ME, de Young M, Wexler NS, Gusella JF, Arnheim N (1999) Analysis of germline mutation spectra at the Huntington's disease locus supports a mitotic mutation mechanism. Hum Mol Genet 8:173–183 [DOI] [PubMed] [Google Scholar]
- Leeflang EP, Zhang L, Tavare S, Hubert R, Srinidhi J, Macdonald ME, Myers RH, Deyoung M, Wexler NS, Gusella JF, Arnheim N (1995) Single sperm analysis of the trinucleotide repeats in the Huntington's disease gene—quantification of the mutation frequency-spectrum. Hum Mol Genet 4:1519–1526 [DOI] [PubMed] [Google Scholar]
- McNeil SM, Novelletto A, Srinidhi J, Barnes G, Kornbluth I, Altherr MR, Wasmuth JJ, Gusella JF, MacDonald ME, Myers RH (1997) Reduced penetrance of the Huntington's disease mutation. Hum Mol Genet 6:775–779 [DOI] [PubMed] [Google Scholar]
- Rubinsztein DC, Amos W, Leggo J, Goodburn S, Ramesar RS, Old J, Bontrop R, McMahon R, Barton DE, Ferguson-Smith MA (1994) Mutational bias provides a model for the evolution of Huntington's disease and predicts a general increase in disease prevalence. Nat Genet 7:525–530 [DOI] [PubMed] [Google Scholar]
- Rubinsztein DC, Leggo J, Coles R, Almqvist E, Biancalana V, Cassiman JJ, Chotai K, et al (1996) Phenotypic characterization of individuals with 30–40 CAG repeats in the Huntington disease (HD) gene reveals HD cases with 36 repeats and apparently normal elderly individuals with 36–39 repeats. Am J Hum Genet 59:16–22 [PMC free article] [PubMed] [Google Scholar]
- Shaw M, Caro A (1982) The mutation rate to Huntington's chorea. J Med Genet 19:161–167 [DOI] [PMC free article] [PubMed] [Google Scholar]
- Smith MA, Brandt J, Shadmehr R (2000) Motor disorder in Huntington's disease begins as a dysfunction in error feedback control. Nature 403:544–549 [DOI] [PMC free article] [PubMed] [Google Scholar]
- Vogel F, Molulsky A (1986) Human genetics: problems and approaches, 2d ed. Springer-Verlag, Berlin [Google Scholar]
- Vogel F, Rathenberg R (1975) Spontaneous mutation in man. In: Harris H, Hirschhorn K (eds) Advances in human genetics. Vol 5. Plenum Press, New York, pp 233–318 [DOI] [PubMed] [Google Scholar]