

Abstract
Tuberous sclerosis complex (TSC), an autosomal dominant disease caused by mutations in either TSC1 or TSC2, is characterized by the development of hamartomas in a variety of organs. Concordant with the tumor-suppressor model, loss of heterozygosity (LOH) is known to occur in these hamartomas at loci of both TSC1 and TSC2. LOH has been documented in renal angiomyolipomas (AMLs), but loss of the wild-type allele in cortical tubers appears to be very uncommon. Analysis of second, somatic events in tumors for which the status of both TSC1 and TSC2 is known is essential for exploration of the pathogenesis of TSC-lesion development. We analyzed 24 hamartomas from 10 patients for second-hit mutations, by several methods, including LOH, scanning of all exons of both TSC1 and TSC2, promoter methylation of TSC2, and clonality analysis. Our results document loss of the wild-type allele in six of seven AMLs, without evidence of the inactivation of the second allele in many of the other lesions, including tumors that appear to be clonally derived. Laser-capture microdissection further demonstrated loss of the second allele in all three cellular components of an AML. This study thus provides evidence that, in both TSC1 and TSC2, somatic mutations resulting in the loss of wild-type alleles may not be necessary in some tumor types—and that other mechanisms may contribute to tumorigenesis in this setting.
Introduction
Tuberous sclerosis complex (TSC) is an autosomal dominant disorder characterized by seizures, mental retardation, and multiple hamartomas in many organs. Major TSC lesions include cortical tubers, subependymal nodules (SENs) and subependymal giant-cell astrocytomas (SEGAs) in the brain, multiple retinal nodular hamartomas, hypomelanotic macules, facial angiofibromas, shagreen patch and periungual fibromas of the skin, cardiac rhabdomyomas, renal angiomyolipomas (AMLs), and pulmonary lymphangioleiomyomatosis (LAM). TSC displays genetic heterogeneity involving two different causative genes on chromosomes 9q34.3—TSC1 (MIM 605284)—and 16p13.3—TSC2 (MIM 191092) (The European Chromosome 16 Tuberous Sclerosis Consortium 1993; van Slegtenhorst et al. 1997). The TSC1 gene has 21 coding exons and 2 leader exons; the TSC2 gene has 41 coding exons with multiple-transcript isoforms, because of the alternative splicing of exons 25 and 31 (Xu et al. 1995; Olsson et al. 1996), and a leader exon 1a–encoding core promoter sequence (Maheshwar et al. 1996; Kobayashi et al. 1997). Large-scale cohort studies of comprehensive germline-mutation analysis have detected, among sporadic cases, a higher frequency of TSC2 mutations compared to TSC1 mutations (Au et al. 1998; Jones et al. 1999; Niida et al. 1999; Dabora et al. 2001). The TSC1 protein, hamartin, and the TSC2 protein, tuberin, interact with each other in vivo, indicating that these two proteins participate in at least some common biochemical pathways (Plank et al. 1998; van Slegtenhorst et al. 1998; Nellist et al. 1999; Murthy et al. 2000).
Loss of heterozygosity (LOH) of both TSC1 and TSC2 has been documented in TSC hamartomas, supporting the classification of the TSC genes as tumor-suppressor genes (Carbonara et al. 1994; Green et al. 1994; Henske et al. 1996; Sepp et al. 1996; van Slegtenhorst et al. 1997). However, LOH frequencies vary significantly among tumor types. Renal AMLs reveal a high frequency of LOH, whereas CNS lesions show a low frequency of LOH (Henske et al. 1996). Similarly, renal cellular carcinomas in the Eker rat, a naturally occurring model in which the homologous Tsc2 gene is mutated, show a higher frequency of LOH, compared to other tumors in these animals (Kubo et al. 1994, 1995; Yeung et al. 1995). Mice with Tsc2+/− also display a variable frequency of LOH in their tumors (Onda et al. 1999).
Although LOH studies in a variety of TSC hamartomas have been performed by several investigators, a systematic study of somatic mutations in TSC lesions has not been reported. A recent study performed on renal AMLs, cortical tubers, and facial angiofibromas from patients with TSC who are known to have germline mutations in TSC2 showed, in a majority of the AMLs, LOH and, in two of the three angiofibromas, an intragenic deletion spanning 22–25 kb, thus documenting the complete inactivation of TSC2 (Au et al. 1999). This study, however, failed to detect the somatic mutations in cortical tubers. Failure to demonstrate the somatic events in TSC hamartomas has been attributed either to subtle variations in the TSC genes or to a mixture of normal and abnormal cells in the lesions (Au et al. 1999; Cheadle et al. 2000). We therefore undertook a detailed analysis of the somatic mutations in 24 hamartomas obtained from 10 different patients with TSC in whom germline TSC1/TSC2 mutations have been screened. Our results suggest that AMLs frequently exhibit the loss of both alleles of the TSC genes, without evidence of the inactivation of the second allele in many of the other lesions. Tumors that appear to be clonally derived still do not harbor the second, somatic event, raising the possibilities that second-hit mutations are not necessary and that other mechanisms may contribute to some TSC lesions.
Subject and Methods
Sample Collection
Twenty-four hamartomas obtained from 10 different patients with TSC were included in this study. Tissue samples were collected from various sources, including the TSC Clinic at Massachusetts General Hospital, referrals from the Tuberous Sclerosis Alliance, and private physicians. All cases were clinically diagnosed according to established criteria (Roach et al. 1998). This study was approved by the Institutional Review Board of Massachusetts General Hospital. All living persons donating tissue to this work provided informed consent. Patients 1–7 in this study have been described elsewhere (Beauchamp et al. 1998; Niida et al. 1999). Patient 8 had severe pulmonary TSC, and three LAM samples were taken at the time of lung transplantation; LAM 1 was somewhat fibrotic, and LAMs 2 and 3 had abundant amounts of smooth-muscle cells. Patient 9 had multiple-organ involvement with fatal renal failure caused by massive growth of bilateral multiple renal AMLs; AMLs and other tumor samples were obtained through an autopsy. Patient 10 had all of the characteristics of the TSC phenotype, except for mental retardation.
For the majority of samples, DNA was extracted from frozen tissues by standard proteinase-K digestion followed by phenol/chloroform extraction and ethanol precipitation. For four samples (an AML of patient 2, a SEGA of patient 4, and cardiac rhabdomyomas of patients 5 and 6), DNA was extracted from paraffin-embedded tissues. In brief, after the scraped tissues were deparaffinized by xylene, samples were washed several times with ethanol and were digested in buffer (1× Tris-EDTA [pH 8.0], 0.5% Tween 20, and 1 mg of proteinase-K/ml) at 50°C for 3–5 d, followed by phenol/chloroform extraction and ethanol precipitation.
LOH Analysis
Chromosomal markers D9S2126, D9S1830, D9S1199, and D9S1198, flanking the TSC1 locus; chromosomal markers D16S663, D16S665, D16S525, and Kg8, flanking the TSC2 locus; and an intragenic EcoRV polymorphism in exon 40 of the TSC2 gene were tested for LOH in hamartomas. All markers other than the TSC2 EcoRV polymorphism were analyzed by PCR amplification using [32P]α-dGTP, followed by separation on a sequencing gel and then autoradiography. Primer sequences for these markers are available at The Genome Database. For the TSC2 EcoRV polymorphism, PCR was performed with TSC2 exon 40 primers, and PCR products were digested with EcoRV and electrophoresed on 1% agarose gels (Au et al. 1999). In addition, whenever possible, identified germline mutations were used as additional LOH markers. When the germline mutation was a small deletion, PCR products were run on 8% sequencing gels. When the germline mutation was a single-base-pair substitution, LOH was assessed at these sites by SSCP and direct sequencing. In every analysis, only when the intensity, compared to that in the blood control, of one allele was decreased >50% was LOH scored as positive (Louis et al. 1992).
Screening for Intragenic Somatic Mutations
To detect small intragenic second-hit mutations, tumor DNA was screened, by SSCP, for all coding exons of both TSC1 and TSC2 genes, as described elsewhere for germline-mutation screening (Beauchamp et al. 1998; Niida et al. 1999). Any detected SSCP shift was directly sequenced, to determine whether it represented a mutation or a polymorphism. Also, tubers 1, 4, and 5 of patient 9 were tested by denaturing high-performance liquid chromatography (DHPLC) for possible TSC2 mutations, by methods described elsewhere (Choy et al. 1999; Dabora et al. 2001).
To screen for relatively large gene rearrangements, we performed long-range PCR and Southern blot analyses. Long-range PCR was performed for both TSC1 and TSC2, with primers and conditions reported by Jones et al. (1999). However, three primers—TSC2 7-15F (TGAGCCTCAGGAGTCCCCCATGTAAG), 7-15R (TGAGACCACCGCACCCTCAGCAAATC), and 26-41F (AC-GCCCTGTTGGGGTCTTTCCGAG)—were resynthesized, since the published primers were not optimal for our PCR analysis. For tumors in which a sufficient quantity of DNA was available, Southern blot analysis of TSC2 was performed. A total of 10 μg of DNA in samples digested with either EcoRI or HindIII was separated on a 0.7% agarose gel, transferred to positively charged nylon membrane (Hybond N+; Amersham), and probed, by standard methods, with TSC2 full-length cDNA labeled with [32P]α-dGTP.
Methylation Analysis
To check for hypermethylation of the TSC2 promoter, a PCR-based technique to detect hypermethylation of the HpaII or SmaI site within exon 1a was employed. After complete digestion by HpaII or SmaI, DNA samples were amplified with TSC2 exon 1a–specific primers (forward, GGCGGCACAGAACTACAACT; and reverse, CACCCGCCATGACTTAAAAC) under standard PCR conditions, with 5% dimethyl sulfoxide (DMSO). The same samples were also amplified for exon 1, which served as a control for a failure of the PCR reaction of exon 1a. Primers for exon 1 amplification were the same primers used in SSCP analysis of exon 1. DNA samples treated with restriction-enzyme buffer but without enzyme were also used as positive controls for exon 1a amplification. Amplification products were analyzed by 1% agarose-gel electrophoresis followed by ethidium bromide staining.
Allelic Expression, by Reverse-Transcription PCR (RT-PCR), in Cortical Tubers
RT-PCR was performed to determine the mRNA-expression level of the wild-type allele in cortical tubers from patient 9. Frozen tissue samples were powdered on dry ice, and RNA was immediately extracted with TRIzol (Gibco). cDNA was synthesized with the SuperScript Preamplification System for First-Strand cDNA Synthesis (Gibco). RT-PCR was performed, for 20 cycles, with 5% DMSO, [32P]α-dCTP, and TSC2 exon 33 primers (forward, ATCCCCATCGAGCGAGTCGTCTCCTC; and reverse, ACCAGGCAGCACTTTCCCCGTCCA). To eliminate the possibility of DNA contamination, RNA samples extracted from normal gray matter of the patient were subjected to PCR without RT. Samples were run on a sequence gel at 80 W for 3 h and were developed by autoradiography.
Laser-Capture Microdissection (LCMD) Analysis
LCMD was performed with the Arcturus PixCell 2 system. Cells were dissected from 4-μm-thick, paraffin-embedded sections and were stained with a modified hematoxylin-and-eosin stain. DNA was extracted from microdissected cells, after digestion with proteinase-K for 3–5 d. One to two microliters of the microdissected sample of DNA was used as a template for PCR.
Clonality Analysis
To check the clonality of the tumor samples, a PCR-based assay with the human androgen-receptor gene, or HUMARA, was performed as described elsewhere (Allen et al. 1992; Green et al. 1996). In brief, 1 μg of genomic DNA was digested, for 48 h, with 10 U of HpaII in a 20-μl reaction volume at 37°C, and 2 μl of digested DNA was subjected to PCR in the presence of [32P]α-dCTP. After PCR, an equal amount of loading buffer (50% glycerol in 0.5× Tris-EDTA with bromophenol blue) was added to the reaction; 1 μl of each sample was loaded onto a nondenaturing, 8% polyacrylamide gel containing 8% glycerol and electrophoresed at 10 W for 17 h at room temperature, and autoradiography was performed. The autoradiographs were scanned with the Fluor-S-Multiimager Analyzer (Bio-Rad), to quantitate the two X-linked alleles generated by the HUMARA clonality assay. The clonality ratio (CR) was determined through the published procedure with the criteria that a polyclonal sample will have a CR of ∼1.0 and that a sample containing an appreciable percentage (>50%) of clonal cells will have a CR of >3.0 (Zhu et al. 1995).
Results
Germline Mutations
A panel of 10 patients with TSC who have a variety of hamartomas were included in this study. Of particular interest is patient 9, an autopsy case of TSC from whom two AMLs, five tubers, two SEGAs, and an ungual fibroma (UF) were available. The germline mutations in patients 1–7 have been reported elsewhere (Beauchamp et al. 1998; Niida et al. 1999), whereas the germline mutations in patients 8 and 9—E19 2109 G→A (W703X) and E33 4207delG (D1400fs→1410X), respectively—are novel TSC2 mutations. We were unable to identify the germline mutation in patient 10 (table 1).
Table 1.
LOH and Clonality Analyses of TSC Lesions[Note]
|
Allele Status at |
|||||||||||||||
| Patient (Sex) | Inheritance | Germline Mutation | TumorType | D16S663 | D16S665 | Kg8 | Exon 40 | TSC2GLM | D16S525 | D9S2126 | D9S1830 | TSC1GLM | D9S1199 | D9S1198 | Clonality |
| 1 (F) | Sporadic | TSC1, exon 15 (1711delTG,V497fs→503X) | UF | NI | NI | H | H | NA | NI | H | H | H | H | NI | NI |
| 2 (F) | Sporadic | TSC1, exon 15 (2148C→T, Q655X) | AML | H | NI | H | NI | NA | NI | NI | H | LOHa | LOH | LOH | C |
| 3 (M) | Sporadic | TSC1, exon 15 (2104T→A, L628X) | SEGA | H | NI | NI | NI | NA | NI | H | H | Ha | H | H | NA |
| 4 (F) | Familial | TSC2, intron 1, splice donor (138+1G→A) | SEGA | H | H | NI | LOH | LOHa | LOH | NI | H | NA | NI | H | NT |
| 5 (F) | Sporadic | TSC2, exon 30, 3685–3700del (Q1229fs→1296X) | Rhabdo | NI | H | NI | NI | H | NI | H | NI | NA | NI | H | NI |
| 6 (M) | Sporadic | TSC2, exon 12 (1348G→T, E450X) | Rhabdo | H | NI | NI | NI | Ha | NI | NI | H | NA | H | H | NA |
| 7 (F) | Sporadic | TSC2, exon 36 (4743delC, L1581fs→158Xb) | AML | H | H | H | NI | NAc | LOH | H | H | NA | H | H | C |
| 8 (F) | Familial | TSC2, exon 19 (2109G→A, W703X) | LAM 1 | H | H | H | NI | Ha | NI | H | NI | NA | H | H | P |
| LAM 2 | H | H | H | NI | Ha | NI | H | NI | NA | H | H | P | |||
| LAM 3 | H | H | H | NI | Ha | NI | H | NI | NA | H | H | P | |||
| 9 (F) | Sporadic | TSC2, exon 33 (4207delG, D1400fs→1410X) | AML 1 | NI | LOH | LOH | NI | LOH | NI | NI | H | NA | H | NI | C |
| AML 2 | NI | H | H | NI | H | NI | NI | H | NA | H | NI | P | |||
| Tuber 1 | NI | H | H | NI | H | NI | NI | H | NA | H | NI | C | |||
| Tuber 2 | NI | H | H | NI | H | NI | NI | H | NA | H | NI | P | |||
| Tuber 3 | NI | H | H | NI | H | NI | NI | H | NA | H | NI | P | |||
| Tuber 4 | NI | H | H | NI | H | NI | NI | H | NA | H | NI | P | |||
| Tuber 5 | NI | H | H | NI | H | NI | NI | H | NA | H | NI | S | |||
| SEGA 1 | NI | H | H | NI | H | NI | NI | H | NA | H | NI | S | |||
| SEGA 2 | NI | H | H | NI | H | NI | NI | H | NA | H | NI | P | |||
| UF | NI | H | H | NI | H | NI | NI | H | NA | H | NI | C | |||
| GP | NI | H | H | NI | H | NI | NI | H | NA | H | NI | P | |||
| 10 (F) | Sporadic | Not detected | AML 1 | LOH | LOH | NI | NI | NA | LOH | H | H | NA | NI | H | P |
| AML 2 | LOH | LOH | NI | NI | NA | LOH | H | H | NA | NI | H | C | |||
| AML 3 | LOH | LOH | NI | NI | NA | LOH | H | H | NA | NI | H | P | |||
Note.— Rhabdo = cardiac rhabdomyoma; GP = gastric polyp; GLM = germline mutation point; NI = not informative; H = heterozygous; NA = not applicable; NT = not tested owing to sample quantity; C = clonal; P = polyclonal; S = significantly skewed toward one allele.
Allelic status at the GLM was assessed by SSCP/sequencing, and only definite losses were scored as LOH; the remaining cases are scored as H, since allelic loss can be ambiguous if determined by SSCP or sequencing analysis.
Somatic mosaicism.
Owing to mosaicism.
LOH Analysis of Hamartomas
The hamartomas were tested for allelic loss, by LOH analysis with markers at and surrounding the TSC1 and TSC2 genes. All samples were informative for at least one marker, at both loci. LOH at the TSC1 gene was detected in one AML from patient 2 (fig. 1), and no evidence of LOH was seen in a UF and a SEGA obtained from patients 1 and 3, respectively, who harbor germline mutations in the TSC1 gene. LOH for the TSC2 gene was observed in one SEGA (patient 4; fig. 1) and in six AMLs obtained from three unrelated patients (patients 7, 9, and 10; figs. 1 and 2). All three AML samples obtained from patient 10 revealed the same pattern of LOH (table 1). Among the two AMLs obtained from patient 9, only AML 1 showed LOH. Other lesions, including the 5 tuber samples obtained from this patient, showed no evidence of LOH at the TSC2 locus (fig. 2). In those tumors where LOH was detected, it was apparent that this involved deletion of the complete TSC1 or TSC2 wild-type allele, leaving the nonfunctional mutant germline allele.
Figure 1.

TSC lesions with LOH. Decreased intensity of the lower allele for D9S1198 is seen in AML (A) of patient 2 (P2), compared to the blood control (B). Similarly, for D16S525, loss of the upper allele is seen in AML (A) of patient 7 (P7) and in all three AMLs (A1–A3) of patient 10 (P10). Patient 4 (P4) is informative for the EcoRV polymorphism in exon 40 of TSC2, with the PCR product from blood digested with EcoRV (B/EV) showing three bands, at 583 bp, 389 bp, and 194 bp; and the 583-bp band is lost in the SEGA (S/EV) sample of this patient; undigested products from blood (B) and the SEGA (S) are shown as controls. Blackened arrows indicate the two alleles of each marker, and unblackened arrowheads indicate the lost allele.
Figure 2.

LOH analysis of various lesions from patient 9. Normal spleen tissue (SP), two AMLs (A1 and A2), five cortical tubers (T1–T5), two SEGAs (S1 and S2), a UF (UF), and a gastric polyp (GP) were examined for LOH at the TSC1 and TSC2 loci. Kg8 as well as the germline mutation in exon 33 of TSC2 in this patient reveal LOH only in AML 1 (A1). Decreased intensity—of the wild-type allele (WT) compared to the 1-bp–deleted mutant allele (M), which represents the germline mutation (GLM)—is noticeable. A normal, unrelated control (NC) in which only the wild-type allele is amplified is also included in the analysis.
Analysis of Other Possible Somatic Mutations in the TSC1 and TSC2 Genes
The absence of LOH in many of the tumor samples raised the possibility that more-subtle mutations caused loss of function of the second allele in these tumors. We therefore analyzed the individual exons of the TSC1 and TSC2 genes, by SSCP screening, as described elsewhere (Beauchamp et al. 1998; Niida et al. 1999). A UF from patient 1, who has a TSC1 germline mutation, was screened only for TSC1, owing to an insufficient amount of DNA. Similarly, the SEGA from patient 4 was not screened by SSCP, owing to insufficient DNA; however, LOH at the TSC2 locus was detected in this sample. All other tumors were screened for the entire TSC1 and TSC2 coding sequences. This analysis, in addition to confirming the respective germline mutations in all the tumor samples, identified, in exon 33 of TSC2, a complex 14-bp deletion causing a frameshift and premature termination (4358–4359del and 4361–4372del; P1453fs→1518X) in AML 1 of patient 9. This 14-bp deletion was near the germline mutation in exon 33 of this patient, and, by sequencing exon 33 of TSC2, we further confirmed that this somatic event was present in the wild-type allele. AML 1 also displayed LOH at the TSC2 locus. Thus, two distinct somatic events in this AML raised the possibility that either a second, cell-specific event or two independent somatic events occurred in this tumor. To clarify this further, we performed LCMD (see following subsection, “LCMD”).
In all other tumors analyzed, no mutations other than the germline mutation were detected by SSCP screening. Since enough DNA was available for tubers 1, 4, and 5 obtained from patient 9, these samples were subjected to DHPLC analysis, in a search for subtle mutations that might have been missed by initial SSCP analysis. DHPLC also failed to detect a somatic event in these tubers, although the germline mutation was confirmed. Our attempts to detect other intragenic deletions, by Southern blot and long-range PCR analyses of the tumors with sufficient DNA, also failed to detect any variations (table 2). Hypermethylation of the wild-type alleles, leading to epigenetic gene silencing, was considered, and no evidence of methylation of the TSC2 promoter region was noted (data not shown). Furthermore, in order to determine the mRNA-expression level of the wild-type allele, RT-PCR analysis was performed for the region spanning the germline mutation (1-bp deletion in TSC2 exon 33) in tubers 1, 4, and 5 as well as in normal gray and white matter obtained from this patient. In these three tubers, the wild-type–allele:mutant-allele intensity ratio was similar to the intensity ratio obtained from the normal brain samples (fig. 3).
Table 2.
Intragenic-Mutation and Promoter-Methylation Analyses of TSC Lesions
|
Analysis ofb |
|||||
|
TSC1/TSC2 |
TSC2 |
||||
| Patient | TumorTypea | SSCP | Long-RangePCR | SouthernBlot | PromoterMethylation |
| 1 | UF | NSo/… | …/… | … | … |
| 2 | AML | NSo/NS | …/… | … | U |
| 3 | SEGA | NSo/NS | N/N | … | U |
| 4 | SEGA | …/… | …/… | … | … |
| 5 | Rhabdo | NS/NSo | …/… | … | U |
| 6 | Rhabdo | NS/NSo | …/… | … | U |
| 7 | AML | NS/NSo | …/… | … | U |
| 8 | LAM 1 | NS/NSo | N/N | N | U |
| LAM 2 | NS/NSo | N/N | N | U | |
| LAM 3 | NS/NSo | N/N | N | U | |
| 9 | AML 1 | NS/E33c | N/N | N | U |
| AML 2 | NS/NSo | N/N | N | U | |
| Tuber 1 | NS/NSo | N/N | N | U | |
| Tuber 2 | NS/NSo | N/N | N | U | |
| Tuber 3 | NS/NSo | N/N | N | U | |
| Tuber 4 | NS/NSo | N/N | … | U | |
| Tuber 5 | NS/NSo | N/N | … | U | |
| SEGA 1 | NS/NSo | N/N | N | U | |
| SEGA 2 | NS/NSo | N/N | N | U | |
| UF | NS/NSo | N/N | N | U | |
| GP | NS/NSo | N/N | N | U | |
| 10 | AML 1 | NS/NS | N/N | N | U |
| AML 2 | NS/NS | N/N | N | U | |
| AML 3 | NS/NS | N/N | N | U | |
For abbreviations, see table 1.
NS = no shift; NSo = no shift other than germline mutation; N = normal; U = unmethylated; an ellipsis (…) denotes that the sample was not tested, owing to inadequate sample quantity.
Complex 14-bp deletion of wild-type allele (see text).
Figure 3.
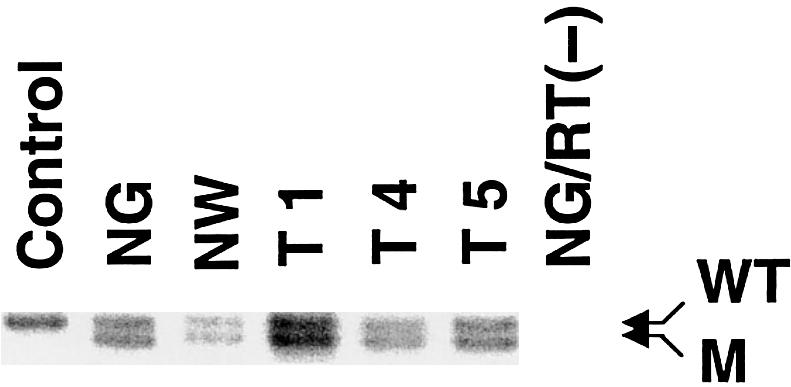
RT-PCR of cortical tubers derived from patient 9. Three cortical tubers (T1, T4, and T5), as well as normal gray matter (NG) and normal white matter (NW) from the same patient, were tested for allelic expression of the wild-type and 1-bp–deleted alleles in exon 33. Fibroblast cDNA from a normal, unrelated person was amplified, as a control. In all three tubers, the wild-type–allele (WT):mutant-allele (M) intensity ratio is not altered compared to that in normal gray or white matter. RNA from the normal-gray-matter sample without RT was used as a negative control, to exclude DNA contamination in the RNA preparations.
LCMD
To examine whether specific cell types in AML 1 could be associated with LOH and the 14-bp deletion, we performed LCMD on this tumor and isolated the three components that comprise AMLs: blood vessels, smooth muscle, and fat. LCMD was performed on sequential slices of the paraffin-embedded AML 1 tissue, and each slide was divided into four quadrants—upper left, lower left, upper right, and lower right—to minimize the risk of contamination of the derived samples. For all three cellular components, DNA obtained from each quadrant was analyzed for LOH and the 14-bp deletion. LOH analysis was performed with Kg8, as well as with the germline mutation (1-bp deletion in exon 33). Although histologically all four quadrants looked similar, genetic analysis clearly revealed the 14-bp deletion in blood-vessel, smooth-muscle, and fat components in the upper-left quadrant only, without evidence of LOH. The 14-bp deletion, however, appeared to have occurred only in a minor population of cells, as evidenced by the wild-type–allele:mutant-allele intensity ratio in the whole-tumor as well as in the laser-captured specimens (fig. 4). Conversely, distinct LOH was detected with both markers in all three cellular components of the lower-right quadrant only, without the 14-bp deletion. The upper-right quadrant did not reveal either LOH or the 14-bp deletion in any of the cells, and the lower-left quadrant revealed LOH in muscle only, without evidence of either LOH or the 14-bp deletion in either the blood-vessel or the fat components (fig. 4). These results appear to rule out the possibility of a second, cell-specific event occurring in this AML; rather, these results demonstrate that a second event occurred in all three components of this AML. The two somatic mutations suggest either that both somatic events arose independently in this tumor or that this AML represents a mixture of at least two distinct primary tumors.
Figure 4.

LCMD analysis of renal AML 1 (A1) from patient 9. The three components of A1—blood vessels (V), smooth muscle (M), and fat (F)—were microdissected from four quadrants of the slide: upper left (UL), lower left (LL), upper right (UR), and lower right (LR). DNA extracted from these cells was examined for two different somatic mutations: the 14-bp deletion in exon 33 and LOH. LOH analysis was performed with Kg8 and, in exon 33, the 1-bp deletion representing the germline mutation (GLM). DNA samples from spleen (SP) and AML 1 (A1), in its entirety, serve as controls. “NC” represents DNA from a normal, unrelated person, as a control for the 1-bp deletion. The 14-bp deletion is seen in all three cellular components of the upper-left quadrant, whereas LOH is observed in all three cell types of the lower-right quadrant. In the lower-left quadrant, only muscle shows LOH, whereas the cell components in the upper-right quadrant show neither the 14-bp deletion nor LOH.
LCMD was performed on tuber 5 from this patient, and balloon cells within the tubers were isolated. As controls, neurons and white matter were also dissected from the histologically normal cortex of this patient. These cells were subjected to LOH analysis with Kg8 and the 1-bp deletion in TSC2 exon 33 as markers. Balloon cells did not reveal LOH for these markers when compared with either normal spleen cells or the microdissected neurons and white matter (fig. 5).
Figure 5.

LOH analysis of balloon cells microdissected from tuber 5 of patient 9. Abnormal balloon cells (BC) microdissected from cortical tuber 5, as well as neuron (N) and white matter (WM) taken from the normal cortex, were analyzed for LOH. Neither Kg8 nor the germline mutation (GLM) reveals LOH in the balloon cells. AML 1 (A1) and spleen (SP) serve as controls, and LOH is detected in AML 1, as expected. “NC” represents a normal, unrelated person.
Clonality Analysis
The lack of somatic mutations in some of the TSC lesions could also reflect a mixture of normal and abnormal cells in these lesions. We therefore performed clonality analysis by PCR amplification of the highly polymorphic HUMARA in female patients. Five of the eight female patients were informative for this marker. Two others (patients 1 and 5) were not informative, and the DNA was insufficient for analysis of patient 4. Renal AMLs from patients 2 and 7 were clearly clonal in origin, compared to those in the respective germline controls (fig. 6). The three LAM samples from patient 8 were all polyclonal. Of the three analyzed AMLs from patient 10, only one was clonal (fig. 6), although all three tumors displayed LOH for TSC2. In patient 9, DNA from several hamartomas was tested for clonality, along with that from normal tissues such as spleen and muscle. Two bands with closely matched intensities were evident in the HpaII-digested normal spleen and muscle tissues (fig. 6). The analyzed hamartoma tissues from this patient, however, revealed varied clonality. Of the two AMLs, AML 1 was monoclonal in origin, with a CR (see “Subjects and Methods”) of 3.50, whereas AML 2 was polyclonal. Of the five tubers analyzed, tuber 1 was clonal, with a CR of 3.80, tubers 2–4 were polyclonal, and tuber 5 was skewed toward one allele, with a CR of 2.94. Similarly, of the two SEGAs, SEGA 1 revealed a skewed pattern, with a CR of 2.73, and SEGA 2 was polyclonal. The UF from this patient was clonal, with a CR value of 3.88, and the gastric polyp was polyclonal. The analyses performed on all of the hamartomas, as well as the respective germline mutations, are summarized in table 1.
Figure 6.

Clonality analysis by HUMARA PCR. In polyclonal tissues, undigested samples, denoted as “HpaII(−),” and digested samples, denoted as “HpaII(+),” produce two bands. In clonal tissues, although undigested samples produce two bands, the digested samples reveal a significant reduction in the intensity of one of the bands (in an unmethylated allele). Compared to control blood DNA (B), renal AMLs (A) from patients 2 and 7 (P2 and P7) show clear clonality. Three lung LAMs (L1–L3) from patient 8 (P8) are polyclonal. In patient 10 (P10), AML 2 (A2) is clonal, whereas AML 1 and AML 3 are polyclonal. Multiple lesions of patient 9 (P9) show varied clonalities. Renal AML 1 (A1), cortical tuber 1 (T1), and a UF (UF) show clear clonality. Cortical tuber 5 (T5) and SEGA 1 (S1) are skewed toward the upper allele. Other hamartomas, including AML 2 (A2), tubers 2–4 (T2–T4), and SEGA 2 (S2), appear to be polyclonal. DNA from spleen (SP) and from muscle (M) of this patient serve as controls. DNA from an unrelated male (MC) serves as a control, for complete digestion of the samples by HpaII.
Discussion
We have performed a comprehensive screen for inactivating mutations in the coding exons of both TSC1 and TSC2, on 24 lesions from 10 patients with TSC. Our results clearly support the idea that complete inactivation of the TSC genes is characteristic of renal AMLs but not of other TSC lesions, including cortical tubers. LCMD performed on one of the AML samples from patient 9 showed that blood-vessel, smooth-muscle, and fat tissues all harbor the same second, somatic mutation in at least one portion of the tumor, whereas results from other regions of the tumor were inconclusive. Our data differ from those of a previous report, which demonstrated, also by microdissection, LOH in smooth muscle and in fat but not in blood vessels, although the authors of that study noted the absence of tuberin immunostaining in all three cell types (Henske et al. 1997). Clearly, careful analysis of additional AMLs by LCMD is necessary to confirm that these three cell types are derived from a common precursor cell. We observed two different somatic mutations—LOH and a 14-bp deletion of TSC2 in AML 1—whose presence suggested either that the two mutations arose successively (i.e., the 14-bp deletion was followed by LOH) or that AML 1 is a mixture of two different tumors with an identical X chromosome–inactivation pattern. Nevertheless, it is clear that the renal AMLs in TSC follow the classic Knudson model, requiring a second somatic mutation in the wild-type allele. None of the other tumors analyzed, except one SEGA (from patient 4), revealed the loss of the second allele of either TSC1 or TSC2.
The inability to identify a second, somatic event in either TSC1 or TSC2 in many tumor samples raises a number of different possibilities. For instance, trans-heterozygous mutations could occur, as shown in autosomal dominant polycystic kidney disease, with inactivation of one allele at each of the PKD1 and PKD2 loci (Koptides et al. 2000; Watnick et al. 2000). We screened all tumor samples for somatic events in both TSC1 and TSC2 and found no evidence of a trans-heterozygous event. However, concurrent mutations in one or more other genes remain a possibility. Another potential mechanism for inactivation of the wild-type allele is somatic methylation, which is increasingly implicated in the pathogenesis of human cancers (Merlo et al. 1995). One study reports hypermethylation of the von Hippel–Lindau gene in 33% of tumors that do not display LOH (Prowse et al. 1997). We examined this possibility and found no evidence of methylation within TSC2 exon 1a near a defined promoter element. It is generally believed that many of the lesions seen in TSC are of mixed cell type, and a true tumor-cell population could be low in abundance, resulting in a failure to detect the somatic events by LOH analysis. Detailed studies performed on LAM samples indicate that LAM cells are nearly always tightly intermixed with other cell types (Carsillo et al. 2000). To address this, we performed clonality analysis, which revealed that some of the lesions that showed absence of a somatic mutation were indeed polyclonal. In particular, the three LAM samples derived from patient 8 were polyclonal, suggesting that the somatic event in these lesions could have been masked by stromal contamination. Of the three analyzed AMLs from patient 10, two were polyclonal and one was clonal, although all three tumors showed evidence of LOH. That nonclonal AMLs reveal LOH again suggests that these could be mixtures of individual tumors with similar LOH events. On the contrary, AML 1 from patient 9 was clonal, with the loss of both alleles of TSC2, and AML 2 was polyclonal, with the somatic event unidentified. Of the other lesions from patient 9, tuber 1 and the UF were clearly clonal, whereas tuber 5 and one SEGA contained a relatively high proportion of clonal cells, and the possibility of detecting the somatic events would be predicted. Both SSCP and DHPLC analyses of these tumors did not detect subtle mutations, and Southern blot analysis and long-range PCR failed to reveal other intragenic deletions. The latter two techniques may not be ideal if only minor portions of the samples carry the mutations, but these assays should detect the mutations in lesions that have clonal cells that constitute ⩾50% of the population. RT-PCR performed on the tubers showed equal expression of both alleles. In addition, the balloon cells microdissected from one of the tubers also failed to reveal loss of the other allele. Thus, although lack of detection of a somatic mutation event could be due to an admixture of normal cells in tumors that are polyclonal, this cannot provide an explanation in tumors that are clonally derived.
Previous studies, as well as the present study, show that a majority of AMLs seen in TSC are associated with loss of the wild-type allele, primarily as LOH. It has been suggested that tumorigenesis in UFs and brain lesions probably does not require the extensive LOH seen in AMLs and could be associated with subtle variations in the TSC genes (Au et al. 1999). We have carefully searched for and found no evidence of subtle variations of the TSC genes in many of the lesions, particularly brain lesions. This suggests the possibility that haplo-insufficiency of TSC1 and TSC2 genes may be sufficient for TSC-lesion development in some cases. There is increasing evidence that haplo-insufficiency for other tumor-suppressor genes—such as NF1 (Ingram et al. 2000; Cichowski and Jacks 2001), PTEN (Marsh et al. 1998), and p53 (Venkatachalam et al. 1998)—may be pathogenic. Retention of the wild-type allele has also been demonstrated in tumors derived from murine models heterozygous for p53, p27Kip1, and PTEN inactivation (Di Cristofano et al. 1998; Fero et al. 1998; Venkatachalam et al. 1998; Podsypanina et al. 1999). Haplo-insufficiency of these tumor-suppressor genes could be explained in a number of ways. Haploid levels of tumor-suppressor proteins may be inadequate to regulate the activity of downstream target proteins that might play a role in growth stimulation in some cell types. Other possibilities include (a) the germline mutation acting in a dominant-negative fashion to block activity of the wild-type allele in tumors and (b) the expression of the wild-type protein being “turned off” or reduced as a result of epigenetic events or cooperating mutations in genes other than those for TSC (Macleod 2000). It is therefore possible that a second, somatic mutation may not be strictly necessary for all cell types involved in TSC lesions. Immunohistochemistry studies performed for tuberin and hamartin in brain lesions yield variable findings—with moderate to no reactivity for tuberin in SEGAs (Kerfoot et al. 1996; Arai et al. 1999; Plank et al. 1999) and with positive immunoreactivity for tuberin and hamartin in dysmorphic neurons of cortical tubers (Johnson et al. 1999; Mizuguchi et al. 2000), further supporting the idea that the TSC proteins are not completely lost in these lesions. Further detailed analysis of the fate of the wild-type allele in human TSC lesions other than AMLs, as well as in lesions that develop in mouse models of TSC, is essential for exploration of whether (a) subtle, second-hit mutations are occurring, (b) haplo-insufficiency alone is sufficient, or (c) other genetic/epigenetic events are involved in TSC-lesion development.
Acknowledgments
This work was supported in part by National Institutes of Health grants NS24279 and NS31535 and by the National Tuberous Sclerosis Association. We wish to extend our thanks to the families of patients with TSC, who made this work possible. We thank R. L. Beauchamp, for her assistance throughout this work, and the members of our laboratory, for helpful comments on the manuscript.
Electronic-Database Information
Accession numbers and URLs for data in this article are as follows:
- Genome Database, The, http://gdbwww.gdb.org/ (for primer sequences for LOH analysis)
- Online Mendelian Inheritance in Man (OMIM), http://www.ncbi.nlm.nih.gov/Omim/ (for TSC [MIM 605284 and MIM 191092])
- Tuberous Sclerosis (TSC) Project, http://zk.bwh.harvard.edu/projects/tsc/ (for primer sequences as well as PCR and DHPLC conditions)
References
- Allen RC, Zoghbi HY, Moseley AB, Rosenblatt HM, Belmont JW (1992) Methylation of HpaII and HhaI sites near the polymorphic CAG repeat in the human androgen-receptor gene correlates with X chromosome inactivation. Am J Hum Genet 51:1229–1239 [PMC free article] [PubMed] [Google Scholar]
- Arai Y, Ackerley CA, Becker LE (1999) Loss of the TSC2 product tuberin in subependymal giant-cell tumors. Acta Neuropathol (Berl) 98:233–239 [DOI] [PubMed] [Google Scholar]
- Au KS, Hebert AA, Roach ES, Northrup H (1999) Complete inactivation of the TSC2 gene leads to formation of hamartomas. Am J Hum Genet 65:1790–1795 [DOI] [PMC free article] [PubMed] [Google Scholar]
- Au K-S, Rodriguez JA, Finch JL, Volcik KA, Roach ES, Delgado MR, Rodriguez E, Northrup H (1998) Germline mutational analysis of the TSC2 gene in 90 tuberous sclerosis patients. Am J Hum Genet 62:286–294 [DOI] [PMC free article] [PubMed] [Google Scholar]
- Beauchamp RL, Banwell A, McNamara P, Jacobsen M, Higgins E, Northrup H, Short P, Sims K, Ozelius L, Ramesh V (1998) Exon scanning of the entire TSC2 gene for germline mutations in 40 unrelated patients with tuberous sclerosis. Hum Mutat 12:408–416 [DOI] [PubMed] [Google Scholar]
- Carbonara C, Longa L, Grosso E, Borrone C, Garre MG, Brisigotti M, Migone N (1994) 9q34 loss of heterozygosity in a tuberous sclerosis astrocytoma suggests a growth suppressor-like activity also for the TSC1 gene. Hum Mol Genet 3:1829–1832 [DOI] [PubMed] [Google Scholar]
- Carsillo T, Astrinidis A, Henske EP (2000) Mutations in the tuberous sclerosis complex gene TSC2 are a cause of sporadic pulmonary lymphangioleiomyomatosis. Proc Natl Acad Sci USA 97:6085–6090 [DOI] [PMC free article] [PubMed] [Google Scholar]
- Cheadle J, Reeve M, Sampson J, Kwiatkowski D (2000) Molecular genetic advances in tuberous sclerosis. Hum Genet 107:97–104 [DOI] [PubMed] [Google Scholar]
- Choy YS, Dabora SL, Hall F, Ramesh V, Niida Y, Franz D, Kasprzyk-Obara J, Reeve MP, Kwiatkowski DJ (1999) Superiority of denaturing high performance liquid chromatography over single-stranded conformation and conformation-sensitive gel electrophoresis for mutation detection in TSC2. Ann Hum Genet 63:383–391 [DOI] [PubMed] [Google Scholar]
- Cichowski K, Jacks T (2001) NF1 tumor suppressor gene function: narrowing the GAP. Cell 104:593–604 [DOI] [PubMed] [Google Scholar]
- Dabora SL, Jozwiak S, Franz DN, Roberts PS, Nieto A, Chung J, Choy YS, Reeve MP, Thiele E, Egelhoff JC, Kasprzyk-Obara J, Domanska-Pakiela D, Kwiatkowski DJ (2001) Mutational analysis in a cohort of 224 tuberous sclerosis patients indicates increased severity of TSC2, compared with TSC1, disease in multiple organs. Am J Hum Genet 68:64–80 [DOI] [PMC free article] [PubMed] [Google Scholar]
- Di Cristofano A, Pesce B, Cordon-Cardo C, Pandolfi P (1998) Pten is essential for embryonic development and tumor suppression. Nat Genet 19:348–355 [DOI] [PubMed] [Google Scholar]
- European Chromosome 16 Tuberous Sclerosis Consortium, The (1993) Identification and characterization of the tuberous sclerosis gene on chromosome 16. Cell 75:1305–1315 [DOI] [PubMed] [Google Scholar]
- Fero M, Randel E, Gurley K, Roberts J, Kemp C (1998) The murine gene p27Kip1 is haplo-insufficient for tumor suppression. Nature 396:177–180 [DOI] [PMC free article] [PubMed] [Google Scholar]
- Green AJ, Johnson PH, Yates JR (1994) The tuberous sclerosis gene on chromosome 9q34 acts as a growth suppressor. Hum Mol Genet 3:1833–1834 [DOI] [PubMed] [Google Scholar]
- Green AJ, Sepp T, Yates JR (1996) Clonality of tuberous sclerosis harmatomas shown by non-random X-chromosome inactivation. Hum Genet 97:240–243 [DOI] [PubMed] [Google Scholar]
- Henske EP, Scheithauer BW, Short MP, Wollmann R, Nahmias J, Hornigold N, Slegtenhorst Mv, Welsh CT, Kwiatkowski DJ (1996) Allelic loss is frequent in tuberous sclerosis kidney lesions but rare in brain lesions. Am J Hum Genet 59:400–406 [PMC free article] [PubMed] [Google Scholar]
- Henske EP, Wessner LL, Golden J, Scheithauer BW, Vortmeyer AO, Zhuang Z, Klein-Szanto AJ, Kwiatkowski DJ, Yeung RS (1997) Loss of tuberin in both subependymal giant cell astrocytomas and angiomyolipomas supports a two-hit model for the pathogenesis of tuberous sclerosis tumors. Am J Pathol 151:1639–1647 [PMC free article] [PubMed] [Google Scholar]
- Ingram DA, Yang FC, Travers JB, Wenning MJ, Hiatt K, New S, Hood A, Shannon K, Williams DA, Clapp DW (2000) Genetic and biochemical evidence that haploinsufficiency of the Nf1 tumor suppressor gene modulates melanocyte and mast cell fates in vivo. J Exp Med 191:181–188 [DOI] [PMC free article] [PubMed] [Google Scholar]
- Johnson MW, Emelin JK, Park SH, Vinters HV (1999) Co-localization of TSC1 and TSC2 gene products in tubers of patients with tuberous sclerosis. Brain Pathol 9:45–54 [DOI] [PMC free article] [PubMed] [Google Scholar]
- Jones AC, Shyamsundar MM, Thomas MW, Maynard J, Idziaszczyk S, Tomkins S, Sampson JR, Cheadle JP (1999) Comprehensive mutation analysis of TSC1 and TSC2—and phenotypic correlations in 150 families with tuberous sclerosis. Am J Hum Genet 64:1305–1315 [DOI] [PMC free article] [PubMed] [Google Scholar]
- Kerfoot C, Wienecke R, Menchine M, Emelin J, Maize JC Jr, Welsh CT, Norman MG, DeClue JE, Vinters HV (1996) Localization of tuberous sclerosis 2 mRNA and its protein product tuberin in normal human brain and in cerebral lesions of patients with tuberous sclerosis. Brain Pathol 6:367–377 [DOI] [PubMed] [Google Scholar]
- Kobayashi T, Urakami S, Cheadle JP, Aspinwall R, Harris P, Sampson JR, Hino O (1997) Identification of a leader exon and a core promoter for the rat tuberous sclerosis 2 (Tsc2) gene and structural comparison with the human homolog. Mammal Genome 8:554–558 [DOI] [PubMed] [Google Scholar]
- Koptides M, Mean R, Demetriou K, Pierides A, Deltas CC (2000) Genetic evidence for a trans-heterozygous model for cystogenesis in autosomal dominant polycystic kidney disease. Hum Mol Genet 9:447–452 [DOI] [PubMed] [Google Scholar]
- Kubo Y, Klimek F, Kilkuchi Y, Bannasch P, Hino O (1995) Early detection of Knudson's two-hits in preneoplastic renal cells of the Eker rat model by laser microdissection procedure. Cancer Res 55:989–990 [PubMed] [Google Scholar]
- Kubo Y, Mitani H, Hino O (1994) Allelic loss at the predisposing gene locus in spontaneous and chemically induced renal cell carcinomas in the Eker rat. Cancer Res 54:2633–2635 [PubMed] [Google Scholar]
- Louis DN, von Deimling A, Seizinger BR (1992) A (CA)n dinucleotide repeat assay for evaluating loss of allelic heterozygosity in small and archival human brain tumor specimens. Am J Pathol 141:777–782 [PMC free article] [PubMed] [Google Scholar]
- Macleod K (2000) Tumor suppressor genes. Curr Opin Genet Dev 10:81–93 [DOI] [PubMed] [Google Scholar]
- Maheshwar MM, Sanford R, Nellist M, Cheadle JP, Sgotto B, Vaudin M, Sampson JR (1996) Comparative analysis and genomic structure of the tuberous sclerosis 2 (TSC2) gene in human and pufferfish. Hum Mol Genet 5:131–137 [DOI] [PubMed] [Google Scholar]
- Marsh DJ, Dahia PL, Coulon V, Zheng Z, Dorion-Bonnet F, Call KM, Little R, Lin AY, Eeles RA, Goldstein AM, Hodgson SV, Richardson AL, Robinson BG, Weber HC, Longy M, Eng C (1998) Allelic imbalance, including deletion of PTEN/MMACI, at the Cowden disease locus on 10q22-23, in hamartomas from patients with Cowden syndrome and germline PTEN mutation. Genes Chromosomes Cancer 21:61–69 [DOI] [PubMed] [Google Scholar]
- Merlo A, Herman JG, Mao L, Lee DJ, Gabrielson E, Burger PC, Baylin SB, Sidransky D (1995) 5′ CpG island methylation is associated with transcriptional silencing of the tumour suppressor p16/CDKN2/MTS1 in human cancers. Nat Med 1:686–692 [DOI] [PubMed] [Google Scholar]
- Mizuguchi M, Ikeda K, Takashima S (2000) Simultaneous loss of hamartin and tuberin from the cerebrum, kidney and heart with tuberous sclerosis. Acta Neuropathol (Berl) 99:503–510 [DOI] [PubMed] [Google Scholar]
- Murthy V, Haddad LA, Smith N, Pinney D, Tyszkowski R, Brown D, Ramesh V (2000) Similarities and differences in the subcellular localization of hamartin and tuberin in the kidney. Am J Physiol Ren Physiol 278:F737–F746 [DOI] [PubMed] [Google Scholar]
- Nellist M, van Slegtenhorst MA, Goedbloed M, van den Ouweland AM, Halley DJ, van der Sluijs P (1999) Characterization of the cytosolic tuberin-hamartin complex: tuberin is a cytosolic chaperone for hamartin. J Biol Chem 274:35647–35652 [DOI] [PubMed] [Google Scholar]
- Niida Y, Lawrence-Smith N, Banwell A, Hammer E, Lewis J, Beauchamp R, Sims K, Ramesh V, Ozelius L (1999) Analysis of both TSC1 and TSC2 for germline mutations in 126 unrelated patients with tuberous sclerosis. Hum Mutat 14:412–422 [DOI] [PubMed] [Google Scholar]
- Olsson PG, Schofeld JN, Edwards YH, Frischauf AM (1996) Expression and differential splicing of the mouse TSC2 homolog. Mammal Genome 7:212–215 [DOI] [PubMed] [Google Scholar]
- Onda H, Lueck A, Marks PW, Warren HB, Kwiatkowski DJ (1999) Tsc2+/− mice develop tumors in multiple sites that express gelsolin and are influenced by genetic background. J Clin Invest 104:687–695 [DOI] [PMC free article] [PubMed] [Google Scholar]
- Plank TL, Logginidou H, Klein-Szanto A, Henske EP (1999) The expression of hamartin, the product of the TSC1 gene, in normal human tissues and in TSC1- and TSC2-linked angiomyolipomas. Mod Pathol 12:539–545 [PubMed] [Google Scholar]
- Plank TL, Yeung RS, Henske EP (1998) Hamartin, the product of the tuberous sclerosis 1 (TSC1) gene, interacts with tuberin and appears to be localized to cytoplasmic vesicles. Cancer Res 58:4766–4770 [PubMed] [Google Scholar]
- Podsypanina K, Ellenson LH, Nemes A, Gu J, Tamura M, Yamada KM, Cordon-Cardo C, Catoretti G, Fisher PE, Parsons R (1999) Mutation of Pten/Mmac1 in mice causes neoplasia in multiple organ systems. Proc Natl Acad Sci USA 96:1563–1568 [DOI] [PMC free article] [PubMed] [Google Scholar]
- Prowse AH, Webster AR, Richards FM, Richard S, Olschwang S, Resche F, Affara NA, Maher ER (1997) Somatic inactivation of the VHL gene in von Hippel–Lindau disease tumors. Am J Hum Genet 60:765–771 [PMC free article] [PubMed] [Google Scholar]
- Roach ES, Gomez MR, Northrup H (1998) Tuberous sclerosis complex consensus conference: revised clinical diagnostic criteria. J Child Neurol 13:624–628 [DOI] [PubMed] [Google Scholar]
- Sepp T, Yates JR, Green AJ (1996) Loss of heterozygosity in tuberous sclerosis hamartomas. J Med Genet 33:962–964 [DOI] [PMC free article] [PubMed] [Google Scholar]
- van Slegtenhorst M, de Hoogt R, Hermans C, Nellist M, Janssen B, Verhoef S, Lindhout D, et al (1997) Identification of the tuberous sclerosis gene TSC1 on chromosome 9q34. Science 277:805–808 [DOI] [PubMed] [Google Scholar]
- van Slegtenhorst M, Nellist M, Nagelkerken B, Cheadle J, Snell R, van den Ouweland A, Reuser A, Sampson J, Halley D, van der Sluijs P (1998) Interaction between hamartin and tuberin, the TSC1 and TSC2 gene products. Hum Mol Genet 7:1053–1057 [DOI] [PubMed] [Google Scholar]
- Venkatachalam S, Shi YP, Jones SN, Vogel H, Bradley A, Pinkel D, Donehower LA (1998) Retention of wild-type p53 in tumors from p53 heterozygous mice: reduction of p53 dosage can promote cancer formation. EMBO J 17:4657–4667 [DOI] [PMC free article] [PubMed] [Google Scholar]
- Watnick T, He N, Wang K, Liang Y, Parfrey P, Hefferton D, St George-Hyslop P, Germino G, Pei Y (2000) Mutations of PKD1 in ADPKD2 cysts suggest a pathogenic effect of trans-heterozygous mutations. Nat Genet 25:143–144 [DOI] [PubMed] [Google Scholar]
- Xu L, Sterner C, Maheshwar MM, Wilson PJ, Nellist M, Short PM, Haines JL, Sampson JR, Ramesh V (1995) Alternative splicing of the tuberous sclerosis 2 (TSC2) gene in human and mouse tissues. Genomics 27:475–480 [DOI] [PubMed] [Google Scholar]
- Yeung RS, Xiao G-G, Everitt JI, Jin F, Walker CL (1995) Allelic loss at the tuberous sclerosis 2 locus in spontaneous tumors in the Eker rat. Mol Carcinog 14:28–36 [DOI] [PubMed] [Google Scholar]
- Zhu J, Frosch MP, Busque L, Beggs AH, Dashner K, Gilliland DG, Black PM (1995) Analysis of meningiomas by methylation- and transcription-based clonality assays. Cancer Res 55:3865–3872 [PubMed] [Google Scholar]