

Abstract
Under the goal of carbon neutrality, CO2 foam flooding combined with the sequestration offers multibenefits for the development of low-permeability and tight oil reservoirs. However, its effectiveness is often hindered by severe gas channeling caused by foam instability and complex geological conditions. This study investigates the foam performance of two foaming agents inside tight porous media via core flooding tests, followed by reservoir-scale optimization studies of foam injection strategies, which are subsequently performed to assess the effectiveness of foam-assisted gas channeling control under different geological scenarios. The results elucidate the impact mechanisms of geological heterogeneity on the CO2 foam performance and provide theoretical and technical support for the integrated optimization of foam-based enhanced oil recovery and CO2 sequestration in low permeability and tight reservoirs.


1. Introduction
Carbon capture, utilization, and storage (CCUS) provides critical emission reduction through subsurface CO2 sequestration. − CO2-enhanced oil recovery (CO2-EOR) offers the benefit of improved oil recovery and permanent CO2 sequestration in subsurface reservoirs. − With conventional reservoirs depleted, low-permeability and tight reservoirs now constitute primary targets for hydrocarbon extraction. − These formations contain 40% of global recoverable reserves and offer proportional CO2 storage potential. However, strong heterogeneity in low permeability and tight reservoirs frequently triggers gas channeling and viscous fingering during CO2 flooding, which reduces displacement efficiency. − Moreover, gas breakthrough diminishes storage efficiency while inducing pressure transients that compromise wellbore integrity. ,
CO2 foam flooding technology mitigates these challenges by generating aqueous foam systems within reservoirs. Surfactant-stabilized lamellae increase apparent viscosity, selectively plug high-permeability channels, and divert CO2 foam flow toward unswept zones. This conformance control suppresses gas breakthrough while mobilizing residual oil, simultaneously enhancing storage and recovery efficiency. However, the extreme pore-throat structures in tight reservoirs (<50 mD) present formidable challenges for conventional foam systems, , foam film rupture rates increase, and fracture networks cause preferential foam channeling. These geological constraints significantly limit the synergy between CO2 storage and displacement. Consequently, developing foam systems tailored to tight reservoir characteristics and quantifying heterogeneity impacts across scales become prerequisites for CCUS deployment in tight formations.
While current research emphasizes foam-assisted enhanced oil recovery, critical gaps remain in understanding surfactant behavior under reservoir conditions and the influence of geological heterogeneity on foam-based gas mobility control. Experimental results indicate that the surfactant is a key determinant of foam performance. Anionic surfactants, despite their high foaming capacity, suffer from poor salt tolerance, core-scale tests show a 40% decrease in channeling resistance when salinity exceeds 104 mg/L. − In contrast, zwitterionic surfactants remain stable under high-salinity conditions but tend to adsorb onto rock surfaces, reducing effective concentration and compromising foam plugging efficiency in reservoirs. Fracture development further complicates foam dynamics, promoting preferential gas flow along fracture paths and undermining foam diversion capacity. Given the complex pore-throat structure of the reservoir, there is an urgent need for foaming agents with good injectivity and strong channeling control performance. − To address these challenges, a multifactor coupled model that integrates foam properties and formation characteristics is urgently needed to inform the design of effective channeling control strategies.
This study proposes a geology-adaptive framework that integrates foam behavior with gas channeling control strategies under varying reservoir conditions. The main objectives of this study are as follows: (1) Two novel foaming agents BSC-1 and BSC-2 are developed; (2) foam flow and parallel core flooding experiments are conducted to evaluate their performance, leading to the selection of BSC-1 as the optimal foaming agent; and (3) the coupling mechanism between geological heterogeneity and foam flooding is investigated through sensitivity analysis of key geological factors, providing the basis for developing effective gas channeling control strategies and optimizing engineering parameters.
2. Materials and Methods
2.1. Experimental Section
2.1.1. Synthesis of Foaming Agents
To ensure the applicability of foam systems under varied reservoir conditions, two foaming agents with different performance characteristics are developed and optimized to prepare foam working solutions. Foam flow and core flooding experiments are conducted to evaluate and compare their foaming capacity, stability, and displacement efficiency in representative geological scenarios. The objective is to select a composition with both favorable injectivity and effective gas channeling control, making it suitable for integration into subsequent numerical simulations.
Foaming agent-blended surfactant composition 1 (BSC-1) is formulated by blending three components: fatty alcohol polyoxyethylene ether sulfonate (AHS) at 0.1 wt %, cetyl hydroxy sulfobetaine (CHSB) at 0.3 wt %, and lauryl alcohol at 0.015 wt %.
Foaming agent-blended surfactant composition 2 (BSC-2) is formulated by blending four components: fatty alcohol polyoxyethylene ether sulfonate (AHS) at 0.1 wt %, cetyl hydroxy sulfobetaine (CHSB) at 0.3 wt %, lauryl alcohol at 0.015 wt %, and hydrophobically associating water-soluble polymer (HAWP) at 0.12 wt %. All materials are purchased from Shanghai Macklin Biochemical Co., China.
2.1.2. Foam Flow Experiment
To evaluate the injectivity and plugging performance of the developed foam systems under reservoir-relevant conditions, a series of CO2 foam flow experiments are conducted. Key parameters assessed include the injectivity index (I), resistance factor (RF), and residual resistance factor (RRF). The details of the simulated formation water used in the experiments are provided in Table S1 of the Supporting Information. The experimental workflow is illustrated in Figure , and the experimental steps are as follows:
-
1
Based on the representative permeability range of the target reservoir block, 7 artificial cores are fabricated. Liquid permeability and porosity are measured for each core and the parameters are summarized in Table .
-
2
Three cores with ultralow (∼3.63 mD), low (∼16.5 mD), and moderate permeability (∼115 mD) are selected for detailed evaluation. Key physical properties, including porosity and permeability, are characterized.
-
3
Foam working solutions are prepared using the optimized formulations. Under high-temperature (∼100 °C) and high-pressure (∼15 MPa) conditions, CO2 is coinjected with the surfactant solutions at various gas–liquid ratios and injection rates to generate foam systems. Experimental parameters are listed in Table .
-
4
Foam is injected into the cores using a high-precision pump at controlled gas–liquid ratios. Injection pressure and flow rate are recorded to calculate the injectivity index (I) using the following expression:
| 1 |
where I is the injectivity index (10–5 mL/MPa·cm2), Q is the injection flow rate (mL/min), A is the core cross-sectional area (cm2), and ΔP is the pressure differential across the core during injection (MPa).
-
5
Formation water is first injected into the core sample at a constant flow rate until a stable pressure drop (ΔP 1) is established. Subsequently, a mixture of CO2 and the foaming agent is coinjected at the same rate until a new steady-state pressure drop (ΔP 2) is reached. The RF is defined as
| 2 |
-
6
Formation water is initially injected to establish the baseline pressure drop (ΔP 1). This is followed by the coinjection of 2.0 pore volume (PV) of CO2 and foaming agent at a constant rate. After foam injection, formation water is reinjected at the same rate until the pressure drop stabilized at a new value (ΔP 3). The RRF is calculated as
| 3 |
1.

Schematic diagram of the foam flow experiment procedure.
1. Core Parameters Used in the Experiments.
| sample ID | size, L × D, cm | porosity, % | permeability, mD |
|---|---|---|---|
| 1 | 7.3 × 2.5 | 12.1 | 3.63 |
| 2 | 7 × 2.5 | 18.1 | 16.5 |
| 3 | 7 × 2.5 | 26.8 | 115 |
| 4 | 7 × 2.5 | 24.4 | 16.8 |
| 5 | 6.5 × 2.5 | 26.1 | 82 |
| 6 | 6.4 × 2.5 | 28.3 | 202 |
| 7 | 7.6 × 2.5 | 29.5 | 412 |
2. Gas-Liquid Ratios and Injection Parameters for Different Systems.
| permeability, mD | gas–liquid ratio | injection rate, mL/min |
|---|---|---|
| 3.63 | 1:2 | 0.1 |
| 1:1 | ||
| 2:1 | ||
| 3:1 | ||
| 1:1 | 0.05 | |
| 0.2 | ||
| 16.5 | 1:2 | 0.1 |
| 1:1 | ||
| 2:1 | ||
| 3:1 | ||
| 1:1 | 0.05 | |
| 0.2 | ||
| 115 | 1:2 | 0.1 |
| 1:1 | ||
| 2:1 | ||
| 3:1 | ||
| 1:1 | 0.05 | |
| 0.2 | ||
| 0.5 |
2.1.3. Parallel Core Flooding Experiments
Parallel core flooding experiments are conducted to investigate the effectiveness of the CO2 foam-assisted gas diversion in heterogeneous formations. The experimental system consisted of ISCO pumps, core holders, foam generator, and graduated collection cylinders, and the workflow is illustrated in Figure . Artificial heterogeneous cores are fabricated with permeability contrast ratios of 1.01, 4.97, 12.24, and 25. Each core measured 2.5 cm in diameter and 15.24 cm in length. The crude oil used in the tests has a viscosity of 4.8 ± 1.0 cP. All experiments are performed at a reservoir-representative temperature of 100 °C and pressure of 15 MPa. Foam performance is evaluated by comparing breakthrough time, oil recovery efficiency, and gas-to-oil ratio (GOR) across different permeability contrasts. Key experimental parameters are summarized in Table and the experimental procedure is as follows:
-
1
Core saturation and baseline water flooding: Cores are vacuum-saturated with synthetic formation brine. Porosity and permeability are measured and the water is then injected at a constant flow rate to achieve full water-wet conditions, and the initial steady-state permeability is recorded.
-
2
CO2 injection: CO2 is introduced at a flow rate of 1.0 mL/min until the GOR at the outlet exceeded 300. Pressure evolution in each flow path, fluid production volumes, and gas breakthrough time are monitored in real time.
-
3
Foam-assisted gas diversion: A total of 0.5 PV of CO2 foam is coinjected at a flow rate of 0.2 mL/min with a gas-to-liquid volumetric ratio of 1:1 to establish steady-state foam flow. Pressure responses across the cores are recorded to assess the foam’s ability to divert flow from high-permeability channels.
-
4
Postfoam water flooding: Synthetic brine is reintroduced at a constant flow rate of 0.2 mL/min until the water cut reached 98%. Final oil recovery is measured, and the effectiveness of foam-assisted gas diversion is quantitatively evaluated based on the observed improvement in sweep efficiency and flow redistribution.
2.

Schematic of the parallel core flooding apparatus.
3. Parameters for Parallel Core Flooding Experiments.
| ID | porosity, % | permeability, mD | oil saturation, % | permeability contrast |
|---|---|---|---|---|
| #1 | 24.4 | 16.8 | 74.8 | 1.02 |
| 23.2 | 16.5 | 75.8 | ||
| #2 | 26.1 | 82.0 | 76.2 | 4.97 |
| 24.1 | 16.5 | 74.5 | ||
| #3 | 28.3 | 202 | 75.4 | 12.24 |
| 23.6 | 16.5 | 73.3 | ||
| #4 | 29.5 | 412 | 74.2 | 25.0 |
| 23.2 | 16.5 | 76.5 |
2.2. Numerical Simulation Section
2.2.1. Numerical Model Construction
Based on prior experiments, a 3D Cartesian grid model with 60 × 60 × 1 is constructed on the commercial software CMG to evaluate foam flooding performance under varying geological conditions. The production well is located in the grid (58, 3, 1), the injection well is located in the grid (3, 57, 1), and the grid dimensions in the X, Y, and Z directions are 300, 300, and 10 m, which is a simple heterogeneous concept reservoir model. The reservoir lies at a depth of 3010 m, as shown in Figure , with the horizontal distance distinguished by the colormap, and the model setup and simulation input parameters are summarized in Table .
3.

Three-dimensional numerical model.
4. Model Parameters of the Reservoir.
| model parameters | value |
|---|---|
| reservoir pressure, MPa | 30 |
| reservoir temperature, °C | 100 |
| crude oil viscosity, mPa·s | 7.79 |
| oil density, kg/m3 | 0.82 |
| minimum miscibility pressure, MPa | 31.64 |
| porosity, % | 10 |
| horizontal permeability, mD | 15, 50 |
| vertical permeability, mD | 3–10 |
| initial oil saturation, % | 70 |
2.2.2. Geological Factor Analysis
With the component inputs, foam reaction mechanisms, and key flow parameters established, the model is now fully equipped for subsequent sensitivity analyses. The properties of pseudocomponents used for oil characterization are summarized in Table S2, the reaction formulas for the foam dynamics model are provided in Table S3, and the specific parameters of the foaming agent input into the model are listed in Table S4, all of these tables are available in the Supporting Information. The sensitivity analysis is conducted to identify the geological factors affecting the performance of CO2 flooding, with a focus on reservoir tightness, vertical heterogeneity, horizontal heterogeneity, and fracture characteristics. By defining a range of variable conditions, the study systematically investigates how these geological factors impact CO2 foam stability, sweep efficiency, and oil recovery. The analysis elucidates the mechanisms through which key geological parameters influence gas channeling control and provides essential geological insights for optimizing foam injection strategies.
3. Results and Discussion
3.1. Analysis of Experimental Data
3.1.1. Experimental Investigation of Foam Flow
Under ultralow permeability conditions of 3.36 mD, both the gas–liquid ratio and injection rate significantly influence the RF and RRF for the BSC-1 and BSC-2 systems, as shown in Figures and . Experimental results identify the optimal operating conditions for both systems as a gas–liquid ratio of 1:1 and an injection rate of 0.1 mL/min. Under these conditions, BSC-1 exhibits an injectivity index of 5.31, which is 4.6 times higher than that of BSC-2, recorded at 1.15. Likewise, BSC-1 achieves higher RF and RRF, reaching 6.55 and 2.46, respectively, compared to 6.05 and 1.66 for BSC-2.
4.

Effect of the gas–liquid ratio on RF and RRF at 3.36 mD.
5.

Effect of the injection rate on RF and RRF at 3.63 mD.
The BSC-1 formulation demonstrates a substantially higher injectivity index than that of BSC-2, indicating superior injectivity and reduced flow resistance in porous media. Although the RF of the two systems is comparable, BSC-1 exhibits a slightly higher value, suggesting enhanced foam-induced resistance during displacement that may contribute to improved sweep efficiency and flow profile regulation. Furthermore, the BSC-1 system maintains a stronger residual resistance after foam flooding, reflecting its greater capacity to sustain flow diversion and control gas–liquid transport over extended periods. Collectively, these results underscore the clear performance advantages of BSC-1 under the tested conditions.
Under low permeability conditions of 16.5 mD, the effects of the gas–liquid ratio and injection rate on foam plugging performance present new characteristics, as shown in Figures and . Experimental results indicate that the optimal gas–liquid ratio for both BSC-1 and BSC-2 systems remained at 1:1. However, the optimal injection rate for BSC-2 needs to be increased to 0.2 mL/min, which is 100% higher than that of BSC-1 at 0.1 mL/min. Under these optimized conditions, BSC-1 achieves an injectivity index of 7.67, significantly higher than the 4.86 observed for BSC-2.
6.

Effect of the gas–liquid ratio on RF and RRF at 16.5 mD.
7.

Effect of injection velocity on RF and RRF at 16.5 mD.
Despite this, the plugging performances of the two systems becomes comparable. The RF and RRF of BSC-1 are 64.5 and 4.8, respectively, slightly lower than those of BSC-2, which reaches 68.8 and 5.2. The differences in RF and RRF are 6.7% and 8.3%, respectively, indicating only a minor disparity. These results suggest that under low-permeability conditions, both systems demonstrate similar effectiveness in controlling gas channeling.
Under medium permeability conditions of 115 mD, the effects of the gas–liquid ratio and injection rate on foam plugging performance exhibit significant differences, as illustrated in Figures and . Experimental results show that the optimal parameters for the BSC-1 system remain unchanged, with a gas–liquid ratio of 1:1 and an injection rate of 0.1 mL/min. In contrast, the optimal gas–liquid ratio for BSC-2 increases to 2:1. Under conditions characterized by low rock capillary pressure and high film separation pressure, BSC-2 exhibited improves foam stability and reduces rupture tendency. The optimal injection rates for both systems do not continue to rise, as excessive rates tend to deform liquid films and accelerate foam coalescence.
8.
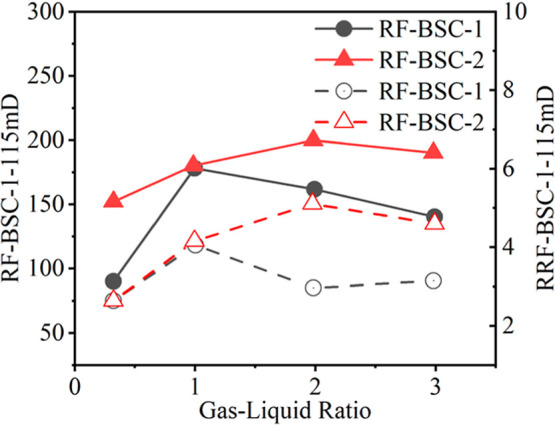
Effect of the gas–liquid ratio on RF and RRF at 115 mD.
9.

Effect of injection velocity on RF and RRF at 115 mD.
Under these optimized conditions, the RF of BSC-2 reaches 231.6, which is 29.6% higher than that of BSC-1 at 178.8. The RRF of BSC-2 is 5.79, reflecting a 23.9% increase over BSC-1, which records as 4.67. The injectivity index of BSC-2 is 23.7, 54.3% lower than BSC-1’s value of 51.4. In comparison, the BSC-1 system exhibits better injectivity.
3.1.2. Parallel Core Flooding Experiment
Outlet gas/oil ratio (GOR) serves as a key parameter for evaluating the gas control performance of CO2 foam. It is a sensitive indicator of foam performance in controlling gas mobility. A sustained low GOR suggests that gas flow is effectively suppressed by the foam, while a sharp increase indicates foam degradation or inadequate conformance control.
The production dynamics of the BSC-1 foam system under permeability contrast values of 1.02, 4.97, and 12.24 are shown in Figure (a), 10(b), and 10(c), respectively. As the injected pore volume increases, the oil recovery factor correspondingly improves. At a contrast of 1.02, the maximum oil recovery reaches 69.19%, with most of the oil produced during the gas-free and gas breakthrough stages. Following foam injection, the gas/oil ratio drops to 0, indicating effective gas shut-off. The GOR measured when gas reappears, either at the end of the foam shut-off stage or during subsequent waterflooding, is expressed as a percentage of the maximum GOR recorded during the waterflooding phase. Results show that the maximum GOR variation rate increases with permeability contrast, reaching 9.8% at 1.02, 14.4% at 4.97, and 25.3% at 12.24. This trend suggests that a higher permeability contrast enhances gas mobility control, as indicated by the larger variation rates.
10.

Production performance of BSC-1 foam under different permeability contrast conditions: (a) 1.02, (b) 4.97, (c) 12.24.
The outlet GOR profiles for BSC-1 and BSC-2 foaming agents under different permeability contrasts are presented in Figure (a) and (b). During the subsequent waterflooding stage, the timing of gas reappearance at the outlet is later for the BSC-1 system compared to the BSC-2 system under the same permeability contrast, indicating better gas-blocking persistence. The area under the gas control stage reflects the long-term gas mobility control capability of the foam system, and a larger area indicates stronger control (represented by the blue shaded region in Figure ). As the permeability contrast increases, this area also tends to expand. Under identical conditions, the BSC-1 system consistently exhibits a larger control area than BSC-2, demonstrating superior gas conformance performance.
11.

Gas/oil ratio variation with injection volume under different permeability contrasts: (a) BSC-1 and (b) BSC-2.
Figure shows the oil recovery enhancement results of BSC-1, BSC-2, and SHY (a conventional foaming agent previously used in the field) under various permeability contrasts. Both the BSC-1 and BSC-2 systems achieve optimal oil recovery at a permeability contrast of around 10. Within this range, BSC-2 outperforms BSC-1 in the recovery efficiency. However, when the contrast increases to 25, the oil recovery performance of both systems declines significantly.
12.

Oil recovery improvement by BSC-1, BSC-2, and SHY foaming agents under different permeability contrasts.
The foam flow and parallel core displacement experiments reveal distinct performance differences between BSC-1 and BSC-2 across ultralow (3.63 mD), low (16.5 mD), and medium (115 mD) permeability conditions. BSC-1 consistently shows better injection ability, higher RRF, and more stable long-term gas control. In ultralow permeability cores, its injectivity index and waterflood residual RF are significantly higher than BSC-2, indicating superior foam stability and blockage performance. Although the performance gap narrowed under low permeability, BSC-1 still maintained a better injectivity and conformance control. Under medium permeability, BSC-2 exhibits a higher immediate blockage strength, but BSC-1 shows greater long-term stability. Overall, BSC-1 demonstrates more balanced and reliable performance and is therefore selected for subsequent numerical simulation studies under complex geological scenarios.
3.2. Analysis of Simulation Data
3.2.1. Effect of Reservoir Tightness
Numerical simulations are conducted for two representative reservoirs with permeabilities of 15 and 50 mD, using the operational parameters summarized in Table . Figure (a) compares the oil production rates of three injection strategies at a permeability of 50 mD, with SAG achieving the highest peak production. Figure (b) shows that when permeability increased from 15 to 50 mD, the peak oil production under SAG rises from 8.31 to 28.40 m3/d, demonstrating the effectiveness of SAG in enhancing oil output and improved foam conformance performance with higher permeability.
5. Input Parameters for Foam Flooding Simulation.
| parameter | value |
|---|---|
| surface gas injection rate, ton/day | 10 |
| liquid injection rate, ton/day | 10 |
| liquid injection timing, PV | 0.081 |
| plug volume per segment, PV | 0.006 |
| number of segment plugs | 3 |
| segment plug gas–liquid ratio | 1:1 |
| Injection–production ratio | 1:1 |
| permeability | 15 mD, 50 mD |
13.

Oil production rate under different injection strategies and permeabilities: (a) comparison of three injection strategies at 50 mD and (b) SAG injection at two permeability levels.
Figure presents the oil recovery profiles, where SAG consistently achieves the highest final recovery 44.70% at 15 mD and 50.06% at 50 mD, highlighting its improved sweep efficiency with increasing permeability. GOR trends are shown in Figure . Continuous gas injection produced the highest early stage GOR, while SAG maintained low GOR values for a longer duration. Notably, in the 15 mD case, the GOR under SAG only rises at the latest stage, indicating prolonged gas blockage and delayed gas breakthrough. Figure illustrates the oil saturation and foam strength distributions. At higher permeability, foam propagation is significantly improved, with the high-strength foam zone expanding over 3-fold and oil saturation reduced by approximately 28%. The foam front advances 45% farther compared to the 15 mD case, enabling broader gas diversion. In contrast, foam mobility in low-permeability reservoirs remains limited, compromising its gas channeling control.
14.

Comparison of the recovery rate under different permeabilities.
15.

Comparison of GOR under different permeabilities and operating conditions.
16.

Schematic diagram of oil saturation and foam strength under different permeabilities for each system.
3.2.2. Effect of Vertical Heterogeneity Analysis
Vertical heterogeneity is a critical geological feature influencing fluid flow and displacement efficiency, particularly in CO2 foam-enhanced oil recovery processes. As shown in Figure , horizontal permeability varies with different stratigraphic rhythms, highlighting their impact on the overall reservoir permeability structure. A series of heterogeneous models are constructed to investigate the effects of permeability contrast and rhythmic layering, as detailed in Table .
17.

Horizontal permeability models under different rhythmic types: (a) positive rhythm and (b) negative rhythm.
6. Perforation Parameters under Different Rhythmic Types and Permeability Contrasts.
| rhythm | permeability contrast | injection well perforation location |
|---|---|---|
| positive rhythm | 10 | mid-depth, low depth |
| 5 | ||
| 3 | ||
| negative rhythm | 10 | mid-depth, low depth |
| 5 | ||
| 3 |
Figure illustrates oil recovery outcomes under varying injection strategies at a permeability contrast of 10. In progradational reservoirs where permeability increases from top to bottom, the WAG strategy achieved the highest recovery of 46.63%, with a notably rapid increase in oil production. This underscores the advantage of alternating injection in enhancing the displacement efficiency. Overall, recovery in progradational settings outperformed that in retrogradational settings under all injection schemes. Figure further quantifies the impact of vertical heterogeneity on the recovery performance. In retrogradational reservoirs, CO2 preferentially migrates upward due to gravity override and permeability stratification. Smaller permeability contrasts lead to an improved vertical sweep, delayed gas breakthrough, and higher ultimate recovery. In progradational reservoirs, the increasing permeability profile counteracts gravity segregation, and smaller contrasts help reduce permeability near the perforated interval, further delaying breakthrough and improving the sweep. Figure presents the spatial distribution of oil saturation and foam strength under varying heterogeneity conditions. Oil saturation consistently declines with increasing injection volume, particularly in progradational systems where depletion is more pronounced. Foam strength remains high under retro gradational conditions but gradually weakens with distance from the injection point.
18.

Recovery rate of continuous gas injection, WAG, and SAG Control.
19.

Oil recovery under different injection modes and rhythmic types: (a) gas injection; (b) WAG; (c) SAG.
20.

Oil saturation and foam strength diagram under different rhythmic variabilities and permeability heterogeneity.
These results provide strategic insights for tailoring EOR designs to different stratigraphic rhythms. In progradational reservoirs, direct CO2 foam injection following gas flooding, especially from the base of the formation, can leverage gravity to mobilize residual oil while replacing WAG to prevent oil accumulation in midreservoir zones. In contrast, retrogradational reservoirs benefit from initial WAG injection followed by CO2 foam deployment in the later stages to recover residual oil in the lower zones and then target oil trapped in the central reservoir layers.
3.2.3. Effect of Fracture Characteristics Analysis
This section investigates foam behavior in fractures of varying orientations (horizontal and vertical) and half-lengths (10 and 50 m). Reservoir properties and operational parameters are listed in Table , while fracture characteristics are detailed in Table . Figure compares hydraulic fracture geometries.
7. Parameters of Reservoir and Operational Conditions.
| parameter | value |
|---|---|
| reservoir pressure, MPa | 30 |
| reservoir temperature, °C | 100 |
| porosity, % | 10 |
| horizontal permeability, mD | 50 |
| vertical permeability, mD | 10 |
| initial oil saturation, % | 0.7 |
| surface gas injection rate, m3/day | 5000 |
| injection rate, m3/day | 10 |
| injection timing, PV | 0.081 |
| single segment plug injection volume, PV | 0.006 |
8. Parameters of Fracture.
| parameters | value |
|---|---|
| fracture width, m | 0.001 |
| fracture half-length, m | 100, 500 |
| fracture relative orientation | horizontal, vertical, lateral |
| refined grid width, m | 0.6096 |
| modified permeability, mD | 50,000, 100,000, 200,000 |
| effective permeability, mD | 82.02, 164.04, 328.08 |
| fracture tip permeability, mD | 500, 1000, 2000 |
| permeability decline method | linear decrease |
| edge-modified permeability, mD | 0.82, 1.64, 3.28 |
21.

Hydraulic fracture types: (a) vertical, (b) horizontal, (c) lateral.
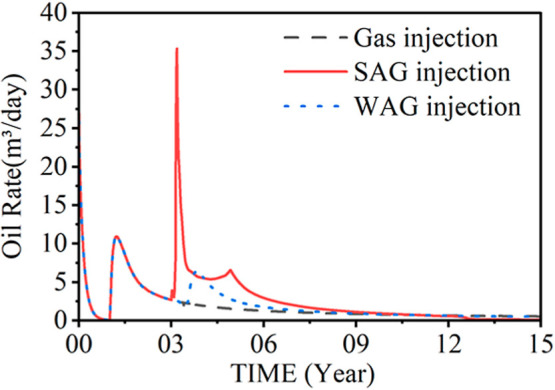
Figure shows the oil and gas production under different injection strategies. Both continuous gas injection and WAG lead to an initial production increase followed by decline. In contrast, SAG injection peaks in the third year at 35.25 m3/day and then declines sharply but stabilizes at a relatively high level. As illustrated in Figure , SAG outperforms the other strategies in recovery efficiency, reaching a maximum oil recovery of 41.38%. WAG achieves a final recovery of 31.36%, outperforming continuous gas injection (26.43%) but lagging behind that of SAG. Figure compares the GOR across injection methods. GOR under gas injection rose continuously, indicating severe channeling. In SAG, GOR peaks in the third year, then drops sharply, suggesting effective channeling suppression. WAG also shows a third-year peak, but the subsequent decline is slower than in SAG, reflecting weaker control.
22.
Comparison of the oil production rate under 100 m half fracture length and different operation conditions.
23.

Comparison of the recovery rate under 100 m half fracture length and different operation conditions.
24.

Comparison of GOR under 100 m half fracture length and different operation conditions.
Figure presents the spatial distribution of oil saturation and foam strength under different fracturing conditions. In vertical fractures aligned with the upward gas flow direction, foam exhibited enhanced mobility along the fracture plane, directly targeting gas channels. Leveraging its viscoelastic and surfactant properties, the foam effectively sealed high-permeability paths, enabling more precise channeling control.
25.

Schematic diagram of oil saturation and foam strength under different fracture conditions.
Overall, fracture geometry significantly influenced recovery, GOR, and hydrocarbon production. Properly oriented fractures improved the sweep efficiency. Among all injection strategies, SAG consistently delivers the best performance in optimizing gas utilization, enhancing recovery, and maximizing the cumulative oil production. Foam strength and oil saturation distribution emerge as key factors for improving reservoir performance. Under fractured conditions, foam injection substantially enhanced both the recovery and oil mobility.
From the analysis of the above research results, it is evident that fracture characteristics have a significant effect on the CO2 foam gas channel control. Horizontal fractures accelerate foam expansion, weakening the control effect, while vertical fractures can more accurately control gas channel paths and improve foam sealing efficiency. In reservoirs with high fracture conductivity, the foam’s sealing ability is limited, but it can still significantly increase oil and gas production. Conversely, in reservoirs with low fracture conductivity or when fractures are misaligned with the displacement direction, foam can effectively improve the mobilization efficiency of residual oil. Based on these research findings, the following optimization recommendations are proposed:
-
1
For reservoirs with horizontal fractures: It is recommended to adjust the foam injection rate and injection period to prevent premature foam loss. By optimizing the injection scheme, the foam’s sealing ability can be extended, thereby enhancing its control effect.
-
2
For vertical fracture conditions: Foam should be injected primarily into the upstream fracture area. The foam’s viscosity and surfactant properties were utilized to strengthen the sealing effect. Directing foam along the fracture path can more effectively seal the gas channel.
-
3
For reservoirs with high fracture conductivity: It is recommended to combine foam injection with other techniques (such as polymer injection, profile control, or water shutoff technology) to enhance foam’s sealing ability. These methods help mitigate the decline in foam sealing efficiency caused by high fracture conductivity.
-
4
For reservoirs with weak fracture conductivity: The foam system’s concentration and injection pressure should be optimized to ensure effective fracture sealing and mobilization of residual oil. Proper adjustment of these parameters will improve foam’s sealing ability in fractures and increase oil and gas recovery.
-
5
For high-permeability fractures: When fracture permeability is too high, foam’s sealing ability is limited. In such cases, combining foam with gel injection or water shutoff technology can enhance the sealing effect and further increase recovery.
3.2.4. Effect of Horizontal Heterogeneity Analysis
To evaluate the impact of lateral heterogeneity on the performance of CO2 foams in gas channeling control, numerical simulations are conducted using a realistic geological model and completion parameters. Three representative formations at depths of 2900, 2980, and 3005 m (denoted as K = I, II, and III) are analyzed based on the geological characteristics of the A-10 and AB38 well groups. The mechanical model reflecting lateral heterogeneity is illustrated in Figures and , and key formation parameters are listed in Table .
26.

Geological model.
27.

Plan views of representative layers: (a) K = I, (b) K = II, (c) K = III.
9. Key Parameters of Representative Strata.
| number of layers | average value, mD | maximum value, mD | minimum value, mD | permeability coefficient of variation |
|---|---|---|---|---|
| K I | 10.8196 | 32.3123 | 0.14732 | 0.81788 |
| K II | 8.64741 | 22.3254 | 0.11523 | 0.76875 |
| K III | 1.87125 | 13.5495 | 0.0116 | 9.28105 |
Figure shows the GOR trends under different heterogeneities and injection scenarios. Under continuous CO2 injection, the GOR increases sharply at early stages, while SAG injection significantly reduces the GOR, demonstrating improved gas mobility control. As shown in Figure , both continuous injection and SAG strategies result in increased cumulative oil production, with SAG achieving superior performance. The A-4 well group under SAG exhibits the highest cumulative production (14,015 m3) over the development period. Notably, SAG leads to substantial production gains in the A-4, A-5, A-7, and A-9 well groups. A-5 sees moderate improvement due to minimal channeling, while severe gas channeling in A-7 and A-9 is effectively mitigated by CO2 foam, leading to significant production enhancement.
28.

Comparison chart of production GOR under different horizontal heterogeneity and operational conditions.
29.

Comparison chart of cumulative oil production for each well under different horizontal heterogeneity and operational conditions.
Figure presents the spatial distribution of oil saturation under different injection strategies. In the A-10 well network, preferential gas channels tend to form between A-9 and A-10, causing residual oil to accumulate between A-10, A-4, and A-5. Following CO2 foam injection, foam is concentrated in the northwest region, blocking dominant flow paths, reducing GOR at A-9, and improving residual oil mobilization. In contrast, WAG injection fails to suppress gas channeling effectively, resulting in a limited sweep efficiency. Similarly, in the AB38 network, channeling primarily occurred between AB38 and adjacent A-3, with residual oil accumulating along the axis via AB38, A-3, and A-8. CO2 foam injection redirects flow, significantly reduces gas breakthrough, improves injectivity, and increases the reservoir gas–liquid ratio, optimizing sweep. Compared with WAG, CO2 foam demonstrates superior channeling control and residual oil recovery, especially in complex well patterns.
30.

Comparison chart of oil saturation under different horizontal heterogeneity and operational conditions.
Figure highlights the distinct spatial distributions of oil saturation, foam strength, and lamellae under different lateral heterogeneity scenarios. Detailed analysis of foam dynamics in A-10 and AB38 networks showed that in the deeper formation (K = III), the CO2 foam effectively mobilized residual oil, whereas WAG injection is insufficient for deep-zone recovery.
31.

Comparison chart of oil saturation, foam strength, and liquid film distribution under different horizontal heterogeneities.
4. Conclusions
To mitigate gas channeling in low-permeability and tight reservoirs, two novel foaming agents, BSC-1 and BSC-2, are developed and systematically evaluated through foam flow and core flooding experiments. Based on its superior performance, BSC-1 is selected for further study. Reservoir-scale simulations are subsequently conducted to assess the effectiveness of foam-assisted gas channeling control under varying geological conditions. The main conclusions are as follows:
-
1
Foam flow experiments demonstrate that BSC-1 outperformed BSC-2 in injectivity and plugging. At 3.36 mD, BSC-1 achieves an injectivity index of 5.31, which is 4.6 times higher than BSC-2, and exhibits higher RF and RRF of 6.55 and 2.46, respectively. At 16.5 mD, BSC-1 maintains better injectivity, while their plugging performance is similar. At 115 mD, BSC-2 showed a lower injectivity index.
-
2
Parallel core flooding experiments confirm that BSC-1 provides more effective gas blocking and stable conformance control. At a permeability contrast of 1.02, it achieved 69.19% oil recovery, with the GOR dropping to 0. As the contrast increases to 4.97 and 12.24, GOR fluctuation rises to 25.3%, indicating enhanced control over gas mobility.
-
3
Numerical simulations reveal that CO2 foam flooding significantly improves oil recovery and gas control across diverse reservoir conditions. Compared to WAG and gas injection, SAG delays gas breakthrough more effectively, reduces GOR, and enhances residual oil mobilization. It performs well in tight, vertically and laterally heterogeneous, and fractured reservoirs, particularly vertical fractures dominated.
Supplementary Material
Acknowledgments
The authors would like to express their gratitude towards Dr. Jun Yang and Dr. Jing Zhao from the School of Petroleum Engineering, Changzhou University, for the kindly support in numerical simulation and experimental equipment.
The Supporting Information is available free of charge at https://pubs.acs.org/doi/10.1021/acsomega.5c04612.
Tables related to the initialization of the numerical model with CMG STARS, including chemical compositions of the formation water, pseudocomponent properties of crude oil, detailed reactions of in situ foam behaviors, and other key parameters based on laboratory studies that quantify the foam performance in the reservoirs (PDF)
Writingoriginal draft preparation: Feng Yao; writingreview and editing: Feng Yao, Xingguang Zhou; methodology: Feng Yao, Xingguang Zhou; software: Feng Yao, Tianci Zhang; laboratory experiments: Tianci Zhang. All authors have read and agreed to the published version of the manuscript.
This research is funded by the Jiangsu Oilfield Company, SINOPEC (Grant No. JD23001).
The authors declare no competing financial interest.
References
- Chen S., Liu J., Zhang Q., Teng F., McLellan B. C.. A Critical Review on Deployment Planning and Risk Analysis of Carbon Capture, Utilization, and Storage (CCUS) toward Carbon Neutrality. Renewable Sustainable Energy Rev. 2022;167:112537. doi: 10.1016/j.rser.2022.112537. [DOI] [Google Scholar]
- Saxena A., Prakash Gupta J., Tiwary J. K., Kumar A., Sharma S., Pandey G., Biswas S., Raghav Chaturvedi K.. Innovative Pathways in Carbon Capture: Advancements and Strategic Approaches for Effective Carbon Capture, Utilization, and Storage. Sustainability. 2024;16(22):10132. doi: 10.3390/su162210132. [DOI] [Google Scholar]
- Haohao L., Xiang Y., Lei Z.. Current Status and Challenges of CCUS Technology Development from a Global Perspective. J. Sci. Technol. Soc. 2024;3(1):17–25. doi: 10.57237/j.jsts.2024.01.003. [DOI] [Google Scholar]
- Li D., Saraji S., Jiao Z., Zhang Y.. CO2 Injection Strategies for Enhanced Oil Recovery and Geological Sequestration in a Tight Reservoir: An Experimental Study. Fuel. 2021;284:119013. doi: 10.1016/j.fuel.2020.119013. [DOI] [Google Scholar]
- Davoodi S., Al-Shargabi M., Wood D. A., Mehrad M., Rukavishnikov V. S.. Carbon Dioxide Sequestration through Enhanced Oil Recovery: A Review of Storage Mechanisms and Technological Applications. Fuel. 2024;366:131313. doi: 10.1016/j.fuel.2024.131313. [DOI] [Google Scholar]
- Panahov G. M., Abbasov E. M., Jiang R.. The Novel Technology for Reservoir Stimulation: In Situ Generation of Carbon Dioxide for the Residual Oil Recovery. J. Pet. Explor. Prod. Technol. 2021;11(4):2009–2026. doi: 10.1007/s13202-021-01121-5. [DOI] [Google Scholar]
- Zhao J., Peng M., Qi X., Wen Q., Yang J.. Low-Carbon and High-Efficiency Nanosheet-Enhanced CO2 Huff-n-Puff (HnP) for Heavy Oil Recovery. Chem. Eng. J. 2024;500:156875. doi: 10.1016/j.cej.2024.156875. [DOI] [Google Scholar]
- Kuang N., Yang S., Yuan Z., Wang M., Zhang Z., Zhang X., Wang M., Zhang Y., Li S., Wu J., Lv W.. Study on Oil and Gas Amphiphilic Surfactants Promoting the Miscibility of CO2 and Crude Oil. ACS Omega. 2021;6(41):27170–27182. doi: 10.1021/acsomega.1c03822. [DOI] [PMC free article] [PubMed] [Google Scholar]
- Hu W., Wei Y., Bao J.. Development of the Theory and Technology for Low Permeability Reservoirs in China. Pet. Explor. Dev. 2018;45(4):685–697. doi: 10.1016/S1876-3804(18)30072-7. [DOI] [Google Scholar]
- Muther T., Qureshi H. A., Syed F. I., Aziz H., Siyal A., Dahaghi A. K., Negahban S.. Unconventional Hydrocarbon Resources: Geological Statistics, Petrophysical Characterization, and Field Development Strategies. J. Pet. Explor. Prod. Technol. 2022;12(6):1463–1488. doi: 10.1007/s13202-021-01404-x. [DOI] [Google Scholar]
- Chen X., Yang Z., Yu H., Niu Z., Li W., Jia N., Wang W., Zhang Y., Li H., Chang Y.. Enhancing Oil Recovery in Low Permeability Reservoirs through CO 2 Miscible Flooding: Mechanisms and Dynamics. ACS Omega. 2024;9(50):49336–49347. doi: 10.1021/acsomega.4c06509. [DOI] [PMC free article] [PubMed] [Google Scholar]
- Liu S.. Review of the Development Status and Technology of Tight Oil: Advances and Outlook. Energy Fuels. 2023;37(19):14645–14665. doi: 10.1021/acs.energyfuels.3c02726. [DOI] [Google Scholar]
- Zhang T., Ming T., Yuan L., Zhu G., Zhang C., Liu Y., Li Y., Wang W., Yang X.. Experimental Study on Stress-Dependent Multiphase Flow in Ultra-Low Permeability Sandstone during CO2 Flooding Based on LF-NMR. Energy. 2023;278:127874. doi: 10.1016/j.energy.2023.127874. [DOI] [Google Scholar]
- Wei B., He X., Li X., Ju Y., Jin J., Luo Q.. Residual Oil Contents of Dolomicrite and Sandy Dolomite Tight Oil Reservoirs after CO2 Huff and Puff: An Experimental Study. Energy. 2023;275:127510. doi: 10.1016/j.energy.2023.127510. [DOI] [Google Scholar]
- Zhao J., Torabi F., Yang J.. The Synergistic Role of Silica Nanoparticle and Anionic Surfactant on the Static and Dynamic CO2 Foam Stability for Enhanced Heavy Oil Recovery: An Experimental Study. Fuel. 2021;287:119443. doi: 10.1016/j.fuel.2020.119443. [DOI] [Google Scholar]
- Zhang B., Lu N., Guo Y., Wang Q., Cai M., Lou E.. Modeling and Analysis of Sustained Annular Pressure and Gas Accumulation Caused by Tubing Integrity Failure in the Production Process of Deep Natural Gas Wells. J. Energy Resour. Technol. 2022;144(6):063005. doi: 10.1115/1.4051944. [DOI] [Google Scholar]
- Jing Y., Wang T., Zhang B., Zheng Y., Li X., Lu N.. Safety Risk Analysis of Well Control for Wellbore with Sustained Annular Pressure and Prospects for Technological Development. Chem. Technol. Fuels Oils. 2025;61(1):110–119. doi: 10.1007/s10553-025-01844-9. [DOI] [Google Scholar]
- Jian G., Fernandez C. A., Puerto M., Sarathi R., Bonneville A., Biswal S. L.. Advances and Challenges in CO2 Foam Technologies for Enhanced Oil Recovery in Carbonate Reservoirs. J. Pet. Sci. Eng. 2021;202:108447. doi: 10.1016/j.petrol.2021.108447. [DOI] [Google Scholar]
- Chen Z., Dong Y., Hu H., Zhang X., Tang S.. Evaluation of the Synergistic Oil Displacement Effect of a CO2 Low Interfacial Tension Viscosity-Increasing System in Ultra-Low Permeability Reservoirs. Processes. 2024;12(7):1476. doi: 10.3390/pr12071476. [DOI] [Google Scholar]
- Liu P., Zhang X., Wu Y., Li X.. Enhanced Oil Recovery by Air-Foam Flooding System in Tight Oil Reservoirs: Study on the Profile-Controlling Mechanisms. J. Pet. Sci. Eng. 2017;150:208–216. doi: 10.1016/j.petrol.2016.12.001. [DOI] [Google Scholar]
- Zhao S., Fu Q., Ma W.. Pore-Throat Size Distribution and Classification of the Paleogene Tight Sandstone in Lishui Sag, East China Sea Shelf Basin, China. Energy Fuels. 2021;35(1):290–305. doi: 10.1021/acs.energyfuels.0c02636. [DOI] [Google Scholar]
- Adebayo A. R.. Viability of Foam to Enhance Capillary Trapping of CO2 in Saline AquifersAn Experimental Investigation. Int. J. Greenhouse Gas Control. 2018;78:117–124. doi: 10.1016/j.ijggc.2018.08.003. [DOI] [Google Scholar]
- Ren G., Nguyen Q. P., Lau H. C.. Laboratory Investigation of Oil Recovery by CO2 Foam in a Fractured Carbonate Reservoir Using CO2-Soluble Surfactants. J. Pet. Sci. Eng. 2018;169:277–296. doi: 10.1016/j.petrol.2018.04.053. [DOI] [Google Scholar]
- Li L., Ge J., Zhang Z., Xu S., Zhou X., Chen P., Chu P.. Research on Compound Amidohydroxysulfobetaine Foamer for High-Temperature and High-Salinity Clastic Reservoirs. Colloids Surf., A. 2024;702:135120. doi: 10.1016/j.colsurfa.2024.135120. [DOI] [Google Scholar]
- Raj S., Ramamurthy K.. Classification of Surfactants and Admixtures for Producing Stable Aqueous Foam. Adv. Colloid Interface Sci. 2024;331:103234. doi: 10.1016/j.cis.2024.103234. [DOI] [PubMed] [Google Scholar]
- Zhang C., Xue Y., Huang D., Wei B.. Design and Fabrication of Anionic/Cationic Surfactant Foams Stabilized by Lignin-Cellulose Nanofibrils for Enhanced Oil Recovery. Energy Fuels. 2020;34(12):16493–16501. doi: 10.1021/acs.energyfuels.0c03234. [DOI] [Google Scholar]
- Sharifi A., Miri R., Riazi M.. A Holistic Review of Harsh Conditions Resistant Surfactants for Enhanced Oil Recovery in Dense Carbonate Reservoir. Fuel. 2023;353:129109. doi: 10.1016/j.fuel.2023.129109. [DOI] [Google Scholar]
- Guglielmi Y., Elsworth D., Cappa F., Henry P., Gout C., Dick P., Durand J.. In Situ Observations on the Coupling between Hydraulic Diffusivity and Displacements during Fault Reactivation in Shales. J. Geophys. Res.:Solid Earth. 2015;120(11):7729–7748. doi: 10.1002/2015JB012158. [DOI] [Google Scholar]
- Youssif M. I., Piri M., Goual L.. Review on Foam-Assisted Gas Injection in Fractured Car bonates for Enhanced Oil Recovery. Energy Fuels. 2024;38(17):15887–15912. doi: 10.1021/acs.energyfuels.4c01825. [DOI] [Google Scholar]
- Zhao J., Yang J., Zeng F.. Complex Displacement Behavior during Foaming Gas Drainage in 2D Microfluidic Networks. Fuel. 2023;344:128071. doi: 10.1016/j.fuel.2023.128071. [DOI] [Google Scholar]
- Zhao J., Torabi F., Yang J.. The Role of Emulsification and IFT Reduction in Recovering Heavy Oil during Alkaline-surfactant-Assisted CO2 Foam Flooding: An Experimental Study. Fuel. 2022;313:122942. doi: 10.1016/j.fuel.2021.122942. [DOI] [Google Scholar]
- Zhao J., Torabi F., Yang J.. Role of Viscous Forces in Foam Flow in Porous Media at the Pore Level. Ind. Eng. Chem. Res. 2021;60(7):3156–3173. doi: 10.1021/acs.iecr.0c05735. [DOI] [Google Scholar]
- Liang X., Shi L., Cheng L., Wang X., Ye Z.. Optimization of Polymer Mobility Control for Enhanced Heavy Oil Recovery: Based on Response Surface Method. J. Pet. Sci. Eng. 2021;206:109065. doi: 10.1016/j.petrol.2021.109065. [DOI] [Google Scholar]
- Wei P., Pu W., Sun L., Pu Y., Wang S., Fang Z.. Oil Recovery Enhancement in Low Permeable and Severe Heterogeneous Oil Reservoirs via Gas and Foam Flooding. J. Pet. Sci. Eng. 2018;163:340–348. doi: 10.1016/j.petrol.2018.01.011. [DOI] [Google Scholar]
Associated Data
This section collects any data citations, data availability statements, or supplementary materials included in this article.