

Abstract
The primary goal of a genomewide scan is to estimate the genomic locations of genes influencing a trait of interest. It is sometimes said that a secondary goal is to estimate the phenotypic effects of each identified locus. Here, it is shown that these two objectives cannot be met reliably by use of a single data set of a currently realistic size. Simulation and analytical results, based on variance-components linkage analysis as an example, demonstrate that estimates of locus-specific effect size at genomewide LOD score peaks tend to be grossly inflated and can even be virtually independent of the true effect size, even for studies on large samples when the true effect size is small. However, the bias diminishes asymptotically. The explanation for the bias is that the LOD score is a function of the locus-specific effect-size estimate, such that there is a high correlation between the observed statistical significance and the effect-size estimate. When the LOD score is maximized over the many pointwise tests being conducted throughout the genome, the locus-specific effect-size estimate is therefore effectively maximized as well. We argue that attempts at bias correction give unsatisfactory results, and that pointwise estimation in an independent data set may be the only way of obtaining reliable estimates of locus-specific effect—and then only if one does not condition on statistical significance being obtained. We further show that the same factors causing this bias are responsible for frequent failures to replicate initial claims of linkage or association for complex traits, even when the initial localization is, in fact, correct. The findings of this study have wide-ranging implications, as they apply to all statistical methods of gene localization. It is hoped that, by keeping this bias in mind, we will more realistically interpret and extrapolate from the results of genomewide scans.
Introduction
The primary goal of a genomewide scan, by linkage and/or by association analysis, is to localize genes whose variation influences the observed phenotypic variation. A secondary goal, at least in the opinion of some investigators, is to estimate the effects of each identified locus on the phenotype (e.g., Blangero et al. 2000). This can be measured by estimating parameters that characterize the relationship between genotype and phenotype—for example, locus-specific heritability, locus-specific recurrence risk to relatives, and the risk attributable to a specific allele or genotype. Clinically and epidemiologically oriented researchers, in particular, often tend to view the estimation of locus-specific effects, especially if estimated as an attributable risk, as an integral and crucial component of a genome scan.
In this study, we demonstrate that the chromosomal position and the genotype-phenotype relationship of a locus cannot both be estimated reliably by use of a single data set of currently realistic size, at least for loci of small effect size. The fundamental problem of joint estimation is that the statistic providing evidence for the presence of a locus at a given chromosomal location, typically given in the form of a LOD score, is itself a function of the parameter(s) characterizing the genotype-phenotype relationship. Statistical significance and the estimated parameter(s) therefore are not independent but are highly correlated. When the test statistic is maximized over the many pointwise tests in the genome, the estimates of the parameter(s) characterizing the locus-specific effects thus are effectively maximized as well. The obvious sampling bias in the reported test statistics results in a less-obvious sampling bias in the reported parameter estimates, which tend to be grossly inflated. This is borne out empirically by the observation that most follow-up studies give lower estimates of effect size than do the initial studies.
As an example, we focus on the additive phenotypic variance attributable to the genetic variation at a quantitative trait locus (QTL), which is a free parameter estimated in variance-components (VC) linkage analysis. The bias in QTL heritabilities has been noted elsewhere in agricultural plant and animal species (Lande and Thompson 1990; Beavis 1994; Utz and Melchinger 1994; Georges et al. 1995; Kearsey and Farquhar 1997; Beavis 1998; Melchinger et al. 1998; Utz et al. 2000), but this literature is largely unknown to “gene hunters” on human data. Here, we provide a systematic overview of the problem, using both genomewide simulation of human pedigree data and approximate analytical solutions. It is shown that the bias is a function of the true effect size, the sample size, and other factors, which together also determine the power of a study. On small samples—small in the sense of having low power to detect QTLs of realistic effect size, but potentially much larger than most current human-pedigree data sets—the estimates of QTL heritability at LOD-score peaks can be virtually independent of the true state of nature.
It is important to keep in mind that VC linkage analysis and estimates of QTL effect size derived from it are only an example used here for demonstration purposes. The same bias applies to all other methods of gene localization and estimates of any underlying parameter relating marker-locus genotypes and trait phenotypes, if these parameters are estimated at peaks of the test statistic. The main goal of this study is to make investigators aware of the existence and severity of this problem in general.
Brief Overview of VC Linkage Analysis
Let us first give a brief overview of those aspects of VC linkage analysis that are required for the understanding of this study. For further details, the reader is referred to the original articles by (for example) Lange et al. (1976), Hopper and Mathews (1982), Goldgar (1990), Amos (1994), and Almasy and Blangero (1998), as well as the recent reviews by Blangero et al. (2000, 2001).
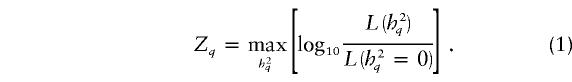
VC pedigree analysis assumes that both genetic and environmental factors have effects on the phenotype of interest. The phenotypic covariance among study participants is modeled as a function of independent, additive variance components, which are estimated by maximum likelihood. In the most basic model of VC linkage analysis, under the alternative hypothesis of linkage (i.e., the presence of a QTL at the chromosomal location being tested), the overall phenotypic variance (σ2) is modeled as the sum of the phenotypic variances attributable to the additive effects of a QTL at the given chromosomal position (σ2q), the aggregate additive effects of genes elsewhere in the genome (σ2p), and individual-specific environmental effects and/or measurement errors (σ2e). Under the null hypothesis of no linkage (i.e., the absence of a QTL at or near the chromosomal location being tested), σ2q is set to 0. The statistical evidence for linkage is evaluated by a likelihood-ratio test, which is typically presented as a LOD score:
 |
 denotes the likelihood. Asymptotically, the likelihood-ratio statistic,
  , is assumed to be distributed as an equal mixture of a χ2 random variable with 1 df and a point mass at 0 (Self and Liang 1987).
As a function of these variance components, the (additive) heritability of the trait can be written as
 |
and the (additive) heritability attributable to the QTL can be written as
 |
For brevity, we refer to σ2q as “QTL effect size” and to h2q as “QTL heritability.”
Sources of Bias
There are a variety of sources of bias in QTL effect-size estimates. Here, we will distinguish between two types of bias. By “pointwise sources of bias,” we mean the factors leading to a bias in the QTL-heritability estimate when linkage analysis is conducted at a single position, q, in the genome, and the QTL heritability is estimated independently of the magnitude of the LOD score—that is,
 |
By “genomewide sources of bias,” we mean the additional bias resulting from joint estimation of locus position and effect size in scans of the whole genome or parts thereof—that is,
 |
Of course, a genome scan may provide statistically significant evidence not just for one locus but for multiple loci or for none at all. Equation (2) is meant to illustrate the multiple-testing problem that results in genomewide bias, independent of whether the genomewide maximum LOD score is significant. This genomewide bias may also be viewed as a type of pointwise bias, resulting when the QTL heritability is estimated only when the LOD score exceeds some threshold.
In addition to these intrastudy sources of bias, there are interstudy sources of bias, because results from successful scans are presumably more likely to be reported. This last source of bias is beyond the scope of this study, but it is expected to have the general effect of magnifying the bias described here.
Pointwise sources of bias
There are many reasons why QTL-heritability estimates may be biased if computed at a single point in the genome. In general, estimates of bounded parameters are often biased, whether obtained by maximum likelihood or any other method. h2q is defined on the interval  , as it is a proportion. For h2q≠0.5, the boundaries of its domain (0 and 1) are asymmetrical, which necessarily leads to an asymmetrical distribution of
  , and is expected to result in bias. In most cases, the closer to a boundary the true value of the parameter, the larger the bias from this source. As QTL heritabilities for complex traits are expected to be small in general, on the basis of both empirical evidence and theoretical considerations (e.g., Blangero et al. 2000; Terwilliger and Göring 2000; Weiss and Terwilliger 2000), the pointwise bias from this source will typically be upward. However, under quite general “standard” conditions, maximum-likelihood estimates are consistent—that is, the estimate gets arbitrarily close to the true value with increasing sample size. This type of bias, therefore, goes away asymptotically. Under suitable circumstances, pointwise estimates of QTL heritabilities can be “effectively unbiased” (Williams et al. 1997).
There are many other reasons why pointwise QTL-heritability estimates are often biased in more-serious ways, where the bias does not disappear asymptotically and often goes hand in hand with an inflated false-positive rate. Sometimes, VC-based pedigree analysis is conducted on pedigrees that are ascertained independent of the phenotypes being studied. Such so-called “random ascertainment” minimizes the risk of ascertainment bias and has been assumed in the simulations and analytical expressions presented in this study. Often, however, other ascertainment protocols are used to increase the power of gene mapping. In general, this is expected to result in a potentially large bias in the estimation of genotype-phenotype relationships, because samples ascertained on a given phenotype are not representative of the population as a whole, with respect to that phenotype. Real-world ascertainment schemes rarely conform to simple mathematical models, and correction for such ascertainment bias may be complicated or impossible—not least because directed ascertainment typically enriches for certain etiological factors at the expense of others (see, e.g., Fisher 1934; Boehnke and Greenberg 1984; Boehnke and Lange 1984; Beaty et al. 1987; Rao et al 1988; Comuzzie and Williams 1999). Furthermore, the phenotypic distribution is rarely perfectly multivariate normal and sometimes deviates a great deal from that distribution, violating the inherent assumptions of standard VC linkage analysis. This generally leads to biased parameter estimates and, potentially, to an increased false-positive rate (see, e.g., Allison et al. 1999; Blangero et al. 2001). It should be mentioned, however, that variants of VC linkage analysis that are more robust to violations of this assumption now exist (see, e.g., Lange et al. 1989; Blangero et al. 2001). In addition, gene × gene interactions (i.e., epistasis) and gene × environment interactions also typically inflate locus-specific heritability estimates, since interactions, if not modeled, can inflate the apparent marginal effects. Environmental factors shared among relatives, including prenatal environment, mimic genetic similarity between relatives and thus inflate the estimated trait heritability (Terwilliger et al., in press) and, under certain circumstances, estimates of QTL heritability as well. Assortative mating generally has similar consequences (see, e.g., Crow and Kimura 1970; Falconer and Mackay 1996; Mukhopadhyay et al. 2000). By contrast, many types of errors—for example, genotyping errors—are expected to lead to deflated estimates of parameters describing the genotype-phenotype relationship, resulting in, for example, an inflated estimate of the recombination fraction (see, e.g., Göring and Terwilliger 2000a, 2000b, 2000c). Although such pointwise sources of bias clearly are very important, we assume their absence in this study, to highlight the magnitude of the bias due to genomewide multiple testing alone.
Genomewide sources of bias
The main focus of this article is on genomewide sources of bias—namely, the bias that results when QTL effects are reported only at the chromosomal position(s) where the test statistic peaks and exceeds some chosen threshold. When maximizing the LOD score over the genome or over parts thereof, as shown in equation (2) above, one is really engaged in a multiple-testing experiment (see Jones and Rushton [1982] for a general overview of simultaneous statistical inference). The simple explanation for why the obvious sampling bias in the reported LOD score extends to a bias in the reported QTL-heritability estimate is that the LOD score is a function of the QTL heritability parameter, as shown in equation (1) above. Z and  are therefore not independent. In fact, for a given data set, assuming constant information on meiotic transmissions throughout the genome, there is essentially a one-to-one correspondence between LOD scores and QTL-heritability estimates, which then provide redundant information (see fig. 2). Typically, however, the available information on chromosomal segregation varies from point to point throughout the genome, because of differences in marker density, marker informativeness, and which individuals are genotyped at a given marker—among other reasons, including genotyping, map, and other errors. Although the one-to-one correspondence between LOD scores and QTL-heritability estimates then no longer holds, Z and
  remain positively correlated. By maximization of the LOD score over the genome or over parts thereof, the estimate of QTL heritability is thus effectively maximized as well, resulting in an upward bias. The bias from genomewide testing may also be viewed as a type of pointwise bias that results when the QTL heritability is estimated only when the LOD score is significant. Even if pointwise estimates of locus-specific effect size were unbiased when estimated irrespective of the LOD score, they cannot be so conditional on the linkage test being significant, given the correlation of the LOD score and the QTL-heritability estimate.
Figure 2.

Nearly one-to-one relationship of QTL-heritability estimate and observed LOD score under full information on meiotic transmissions. Z = observed LOD score;  = sample estimate of additive trait heritability attributable to QTL. See text for details of the simulation.
In many respects, performing a genomewide scan is analogous to statistical model selection, where the chromosomal positions tested correspond to the model parameters considered, and the estimated locus-specific effects at chromosomal positions of the peaks of the test statistic correspond to the estimated values of the parameters chosen for the model. A difference, however, is that chromosomal positions are generally tested individually, one at a time. It is well known that estimates of parameters that are selected for the model on statistical grounds are biased if the same data set is used for model selection and parameter estimation (e.g., Miller 1990; Faraway 1992). The stricter the criteria are for including a parameter in the model, the larger the bias is expected to be. In genomewide linkage scans, the problem is severe, because the large number of tests requires a high threshold for significance. Consequently, the customary LOD score of 3 for the declaration that a linkage finding is significant asymptotically corresponds to a pointwise P value of .0001 (Morton 1955), which is much smaller than the P value of .05 commonly used as a standard in pointwise statistical analysis. The autocorrelation of the test statistic and, equivalently, of the locus effect-size estimate along the chromosomes depends on many factors, including the nature of the data and analysis method, and the appropriate genomewide significance threshold could be chosen accordingly (see also Lander and Kruglyak 1995). For genomewide scans for allelic association, the problem is even more severe, as the autocorrelation of the test statistic is lower. In other words, the number of equivalent independent tests is greater, requiring a significance threshold far in excess of a LOD score of 3, even though this is generally not practiced currently (see also Risch and Merikangas 1996). The same problem applies, to a still greater degree, to joint tests of linkage and association.
The bias caused by genomewide testing disappears asymptotically. However, as shown below, most current data sets for mapping of complex traits in humans have nowhere near the required size to make the genomewide bias negligible.
Results
Simulation Results
We have investigated the genomewide bias in QTL-heritability estimates by simulation. The simulated data set consisted of 1,000 randomly ascertained nuclear families with two offspring each. The genome comprised 22 autosomal chromosomes with a total genome size of 3,300 cM. Marker genotypes of both parents and offspring were simulated for fully informative markers spaced at a density of 2 cM throughout the genome. Quantitative-trait phenotypes were simulated for all individuals. The overall (additive) trait heritability, h2, was set to 0.5, attributable to 0–5 unlinked QTLs with h2q=0.1 each (or 0–10 QTLs with h2q=0.05 each) and nonlocalized polygenic effects. Each QTL was diallelic, with equally frequent alleles, and was located in the middle of a chromosome. The remaining phenotypic variance was due to individual-specific effects. Phenotypic effects of dominance, covariates, shared environment, and any other complicating factors were assumed to be absent. Marker maps, marker genotypes, and phenotypic data were assumed to be accurate. Two-point VC-based linkage analysis was conducted on each marker using SOLAR (Almasy and Blangero 1998). All LOD score peaks ⩾3, their chromosomal locations, and their associated QTL-heritability estimates were recorded. For genome scans without a LOD score ⩾3, the highest LOD score in the genome, its position, and its associated QTL-heritability estimate were recorded instead, as investigators generally still publish the findings of such studies and discuss at least the highest peak. For each different simulation setting, 500 replicates (i.e., full genome scans) were analyzed. By design, the size of the data set, although large compared with that of most real-world mapping studies, is too small to detect the simulated QTLs with high power, since this appears to be the reality for most genome scans of complex traits to date (e.g., Terwilliger and Göring 2000; Weiss and Terwilliger 2000). Alternative study designs, such as large, multigenerational pedigrees, involving an equal number of individuals may be more powerful (see Williams and Blangero 1999; Blangero et al. 2000) and may lead to a somewhat smaller bias. In all other respects, the simulation conditions represent a best-case scenario, designed to minimize the resulting bias.
We first examined estimates of overall trait heritability, as well as estimates of QTL heritability obtained at the exact chromosomal position of a QTL, to verify the correctness of our simulation and analysis procedure. The mean value of  across replicates was 0.498, essentially identical to the generating value. Figure 1 shows the pointwise distribution of
  at the true position of a QTL across replicates, for generating value h2q=0.05. The distribution is clearly skewed, with a long upper tail and a large point mass at the lower boundary of 0, and the expected value of
  , 0.062, is somewhat biased upwards. For h2q=0.1, the mean estimate was 0.104 (data not shown). The decrease in bias is simply due to the fact that the larger generating value is further away from the lower boundary, thus reducing the skewness resulting from the point mass at 0. Note that the observed pointwise biases are not large under the ideal circumstances simulated.
Figure 1.

Distribution of pointwise QTL-heritability estimate at position of QTL. h2q = the generating value for additive trait heritability attributable to QTL;  = its sample estimate. See text for details of the simulation.
We next examined the properties of these estimates in genomewide scans. Figure 2 shows that, in a given data set, under the assumption of complete information on chromosomal segregation throughout the genome, there is essentially a one-to-one correspondence between the observed LOD score and its associated QTL-heritability estimate. In this situation, in fact, the LOD score is essentially a linear function of  (Williams and Blangero 1999). If the information on meiotic transmission varies throughout the genome—in other words, if the effective sample size varies in terms of “equivalent number of meioses” (Edwards 1976)—the one-to-one correspondence breaks down, but statistical significance and the locus-specific effect-size estimate remain positively correlated. We therefore expected that the estimates of QTL heritabilities at genomewide LOD score peaks would be biased upwards.
Table 1 shows that this is, indeed, the case. It gives the average QTL-heritability estimate at the chromosomal position of the genomewide maximum LOD score (columns labeled Zmax) and at the chromosomal positions of LOD score peaks of at least 3 (columns labeled Z⩾3), as a function of the number of QTLs with h2q=0.1 in the genome. Let us first focus on the estimates for both true and false peaks. In the baseline case, when there is no mappable QTL in the genome (i.e., h2q=0.0), the mean estimate of  associated with Zmax is ∼0.24, demonstrating the magnitude of the bias due to maximization of the LOD score over the genome. When there are mappable QTLs in the genome, essentially identical estimates are obtained. The same also holds for QTLs with h2q=0.05 (data not shown). The QTL-heritability estimates thus are of similar magnitude, no matter what the true QTL heritabilities are or whether any mappable QTLs exist at all. Under the simulation settings, the estimates are therefore essentially independent of the true state of nature. Table 1 also gives the QTL-heritability estimates associated with only those LOD score peaks meeting or exceeding the customary LOD score threshold of 3 (Morton 1955), in which case the bias is even greater. For the simulated data set of 1,000 fully informative nuclear families, the QTL-heritability estimate simply must be nearly 30% for the LOD score to be significant, no matter what the true state of nature is.
Table 1.
Mean QTL-Heritability Estimates at Genomewide LOD Score Peaks[Note]
 for for |
||||
| True and False Peaks, at |
True Peaks, ata |
|||
| No. ofQTLs inGenome | Zmax | Z⩾3 | Zmax | Z⩾3 |
| 0 | .236 | .298 | NA | NA |
| 1 | .242 | .300 | .251 | NO |
| 2 | .246 | .301 | .256 | .301 |
| 3 | .249 | .302 | .258 | .303 |
| 4 | .253 | .301 | .259 | .301 |
| 5 | .254 | .301 | .260 | .301 |
Note.—  = mean QTL-heritability estimate; Zmax = genomewide maximum LOD score; Z⩾3 LOD score peaks ⩾3. The true generating value for the additive trait heritability attributable to each QTL was 0.1. See text for details of simulations.
NA = not applicable; NO = not observed.
Some investigators may hesitate to speak of a bias in QTL-heritability estimates when the true QTL heritability is 0 (i.e., when there is no QTL at the given chromosomal location). However, this surely is the situation for most of the genome and therefore is a relevant situation to consider. Besides, in real life, one generally cannot determine whether a LOD score peak is a true or false positive, just as one often does not know whether there really are any major QTLs to be mapped in the first place. In any case, the two rightmost columns of table 1 focus only on those LOD score peaks that are true positives, defined here arbitrarily as a peak occurring within 25 cM of a QTL. As before, the QTL-heritability estimates are greatly inflated. The estimates are very similar when both true and false peaks are considered or only true peaks. For a study with low power, like that simulated here, one can essentially predict from the outset what the estimated QTL heritabilities are likely to be.
These simulations assumed fully informative markers throughout the genome and complete, error-free information in general. Of course, this is not the case in real studies. As a result, in real data the autocorrelation of the test statistic along the chromosome is decreased (i.e., the LOD score fluctuates more), the genomewide false-positive rate is increased (Terwilliger et al. 1997), and the bias is exacerbated further (data not shown).
Analytical Results
Let us also derive an analytical expression for the genomewide bias in QTL-heritability estimates. For mathematical tractability, a number of simplifying assumptions were made. The bias resulting from genomewide testing is approximated by the pointwise bias occurring at the true position of a QTL when one conditions on the LOD score being significant. As in the simulations, we assume complete and accurate information on chromosomal segregation and phenotype. Furthermore, the analytical expressions do not allow for differences in overall trait heritability between the total population and samples obtained from it. Despite these simplifications, the analytically derived results correspond closely to those from the simulations.
Let  be the cutoff for declaring the VC likelihood-ratio statistic of linkage, Λ, to be significant, equivalent to a LOD score of 3. Under the alternative hypothesis of linkage, the statistic is expected to be distributed as a noncentral χ2 random variable with 1 df and noncentrality parameter equal to the expected value of the statistic on the data—that is,
  (Stuart and Ord 1991). Let us denote this density function as χ′2[Λ,1,ξ]. The expected QTL-heritability estimate at the true QTL location, given that the test statistic is significant—that is, Λ⩾λ, is given by
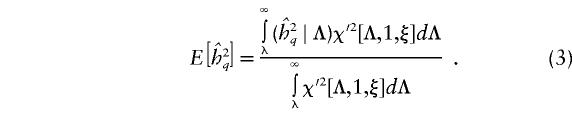 |
The denominator represents the pointwise power to detect linkage in a data set. The division by this quantity is required to ensure that the integration is done over a proper density function, integrating to 1, because the expectation is computed conditional on the test statistic being significant. Williams and Blangero (1999) have derived approximate analytical expressions for the power of VC linkage analysis for a variety of pedigree structures, in the presence of complete, error-free information on chromosomal segregation and phenotypes. They showed that the expected value of the likelihood-ratio statistic for a given data set is a function of both the QTL heritability and the overall heritability of the trait. Specifically,  , where c is a constant for a given data set and total heritability. Furthermore, when full and accurate information on chromosomal transmissions and phenotypes is available,
 |
because of the one-to-one correspondence of LOD score and QTL-heritability estimate for a given data set in that situation (see fig. 2). By substituting these two expressions into equation (3), one obtains
 |
As an example, for a data set comprising n nuclear pedigrees consisting of two parents with two offspring, the constant is given by
 |
(Williams and Blangero 1999), under the assumption of complete and accurate information on chromosomal transmissions and phenotypes.
Figure 3 shows the expected bias in the QTL-heritability estimate as a function of the sample size (i.e., the number of two-offspring nuclear pedigrees) and the true QTL heritability, for fixed overall heritability of 0.5 and LOD scores of at least 3 at the true position of the QTL. The bias is shown to be a function of the sample size and the true QTL heritability, such that for a smaller sample size and/or a smaller true QTL heritability, the bias is larger. Notice that the curves are quite linear and parallel, with slopes of ∼−1, when power is low. In other words, the QTL-heritability estimates are quite constant for different true underlying QTL heritabilities—that is,  —and thus are virtually independent of the true QTL heritability, just as observed by simulation.
Figure 3.

Bias in QTL-heritability estimate at true position of QTL for significant LOD scores. h2 = overall additive trait heritability (h2=0.5, unless otherwise indicated); h2q = additive trait heritability attributable to QTL. The indicated sample sizes refer to numbers of two-offspring nuclear families. See text for details of the approximate analytical approach.
For completeness, figure 3 also shows the bias, for a fixed sample size of 500 pedigrees, as a function of the overall trait heritability, to show that the bias also depends on this trait-specific quantity. This is also apparent from equations (4) and (5), which show that the noncentrality parameter is a function of the overall trait heritability, in addition to the QTL heritability and the sample size, among other factors. The higher the residual genetic correlation among relatives, the greater the power (Williams and Blangero 1999) and the smaller the bias for a given data set.
Figure 4 is an attempt to explain graphically why the bias decreases with an increased sample size, for a given locus-effect size in the study population. There are two components to the explanation. First, everything else being equal, the larger the sample size, the smaller the variance of the sample estimate of the locus-specific effect-size. In the figure, this is indicated by the narrower density function of  for the larger sample. Secondly, everything else being equal, the larger the sample size, the greater the power to map a locus of a given effect size. The bias, which results because the locus-specific effect size is estimated only when the test statistic is significant, is thus reduced, because a larger sample need not be as extreme, with respect to its locus-specific effect size estimate than a smaller sample, to yield a statistically significant finding. In the figure, the shaded area under each curve corresponds to the power of a sample of that size and, equivalently, to the proportion of samples of that size from which the locus-specific effect size is estimated and reported. A corollary of this is that when a LOD score of, say, 10 is reported, its associated genotype-phenotype parameter estimate(s) is more believable (i.e., is expected to be less biased) than at a less convincing LOD score of, say, 4. However, studies of such high power to detect genes influencing truly complex traits appear unrealistic, at present, for most complex-trait loci—or, at least, may be achievable only by nonrandom ascertainment schemes, in which case the ascertainment bias is expected to be large and potentially uncorrectable.
Figure 4.

Conceptual representation of genomewide bias as a function of sample size. h2q = additive trait heritability attributable to QTL in population;  = its sample estimate;
  = its mean sample estimate. The biases for the two sample sizes are indicated by the thick horizontal arrows. See text for details.
Replication
The literature is rife with publications reporting seemingly convincing evidence for the presence of a locus at a given chromosomal position for some complex trait—findings that have never been replicated. The difficulty of replicating a significant linkage and/or association finding for a complex trait in an independent sample can be disheartening. However, it should not be surprising at all, even if the initial localization is, in fact, correct (Suarez et al. 1994). This can be seen if one views the issue of replication in light of the bias discussed here. The two issues are really one and the same: when power is low—as has been shown empirically to be the case in gene mapping for complex traits—considerable luck is required to obtain a significant true finding, and the resulting bias in locus-specific effect size estimate is correspondingly large. If one assumes that a published locus-specific effect-size estimate of some initial study is accurate when performing power calculations for a replication study, one most likely overestimates the power to replicate, perhaps greatly so, ultimately resulting in likely replication failure. A corollary is that failure of replication does not imply that a reported finding is false, even though it does point out that the locus-specific effect-size estimate from the initial study is likely an overestimate.
More formally, as shown above, the bias in locus-specific effect-size estimation is inversely related to the power of a study. The pointwise failure to replicate, or 1−power, is given by
 |
where ξrep is the expected likelihood-ratio statistic for the replication study and λrep is the critical value for declaring replication significant, here assumed to correspond to a LOD score of 3, as before. In figure 5, “probability-of-replication-failure” curves (i.e., “1−power” curves) are superimposed on the bias curves of figure 3, as a function of the true underlying QTL heritability and the sample size, using the same data structures (two-offspring nuclear pedigrees) and conditions (overall heritability of 0.5 and complete and accurate information on phenotypes and chromosomal transmissions) as before. Note that the bias does not disappear until the sample size is large and/or the true QTL heritability is sizeable; in either of these cases, power would be high. Most current genetic studies of complex traits are probably underpowered and are subject to a significant upward bias in locus-specific effect-size estimates.
Figure 5.

Relationship of bias in QTL-heritability estimate and probability of replication failure. h2q = additive trait heritability attributable to QTL. The indicated sample sizes refer to numbers of two-offspring nuclear families. See text for details on analytical approach.
It should be mentioned that the prospects of replication are likely even poorer when the validation sample comes from a population that differs genetically and/or environmentally from the population used in the original study. Obviously, there are genetic differences among human populations, as a result of our evolutionary history, even though interpopulation genetic variation appears to be smaller than intrapopulation genetic variation (see, e.g., Weiss and Terwilliger 2000), and there are environmental and cultural differences as well (see, e.g., Terwilliger et al., in press). The mere fact that a locus was successfully mapped in one population makes it likely that the locus can more easily be mapped in that population than in another.
Discussion
Bias Elimination?
A key question is whether it is possible to avoid or reduce this bias. Given that estimates of locus-specific effect size can be virtually independent of the true effect size, as shown above, any hopes of satisfactory avoidance of bias appear to be misguided, even in the absence of pointwise biases. A single data set of limited size simply cannot be used to reliably estimate both locus position and effect size, at least for a locus of small effect.
Let us nonetheless discuss one attempt at bias reduction, because it is quite intuitive and appears promising at first glance. One could ask the following question: given a data set and a significance criterion chosen a priori, what unknown true QTL heritability is most likely to have produced the observed results? One could try to address this question by, for example, equating the observed QTL-heritability estimate,  , with its expected value given an assumed true QTL heritability, h2q, and then solving the following equation, based on equation (4) above, for h2q:
 |
(If the equation has no solution, the estimate of the underlying QTL heritability in the population would be 0.) In principle, this approach would also allow computation of confidence intervals for the unknown true QTL heritability. The fundamental problem with such an approach is that the corrected QTL-heritability estimate would be very crude, with an extremely wide confidence interval. The reason is that for low-power investigations, such as most complex-trait–mapping studies, the expected value of the likelihood-ratio statistic is quite small; as a consequence, only the upper tails of different noncentral χ2 distributions would be compared with one another, and these tails overlap significantly. This is demonstrated in figure 6, which shows LOD score density functions for a data set of 1,000 two-offspring nuclear families (as before) for different underlying values of h2q, conditional on the LOD score being significant (⩾3). Note the wide overlap of the various distributions.
Figure 6.

Density functions of significant LOD scores as a function of QTL heritability. Z = LOD score; h2q = additive trait heritability attributable to QTL. The given power numbers refer to a sample of 1,000 two-offspring nuclear families. See text for details on analytical approach.
The crudeness of such bias correction is not surprising. We all know that a LOD score of, say, 3, may be a false positive (i.e., h2q=0). Of course, the LOD score may also be a true positive, giving evidence of a true locus with h2q>0. If there were a statistical technique by which the bias could be accurately corrected, this would mean, in essence, that there is information allowing us to distinguish true and false LOD score peaks from each other, on the basis of their magnitude alone. Of course, this is not possible.
Pointwise Replication
The only realistic option for bias elimination appears to be the use of independent data sets for locus mapping and for estimation of the locus-effect size (Utz et al. 2000). One or several data sets are used for model selection and others for parameter estimation. Optimally, different sampling schemes are used for these two purposes, the former being designed to maximize mapping power and the latter to be representative of the target population as a whole (see, e.g., Terwilliger et al., in press). If the locus-specific parameters are estimated in a new data set at the exact chromosomal position where a LOD score peak occurred in an earlier study, the bias from genomewide LOD score maximization is completely avoided, if we assume that the estimates are reported independent of the significance of the localization signal. In fact, because the peak in the initial study likely occurred, by chance, some distance away from the true locus position, pointwise replication in a different sample is expected to furnish a QTL-heritability estimate that is somewhat lower than the true value at the actual location of the gene, if we assume the absence of pointwise sources of bias.
There are many difficulties with replication as currently practiced in the field of gene mapping for complex human traits, however. Different data sets often come from different populations. In general, no two human pedigree samples can be genetically identical, in contrast to inbred animal species, and environmental and cultural variation is likewise unavoidable, contrary to experimental laboratory conditions (for a general discussion, see Lindsay and Ehrenberg [1993]). In addition, it is not clear, for a wide variety of reasons, whether peaks at similar chromosomal locations in separate samples necessarily point to the same underlying genetic factor. This formulation alone already points to the next problem, namely that estimates of locus effect size at a putative QTL position identified by an initial study are often only reported for those studies that replicate the earlier finding—that is, those that provide at least some evidence for a locus in that region of the genome. Furthermore, most studies use nonrandom ascertainment, leading to potentially uncorrectable pointwise biases.
Generality of Results
The most important aspect of this paper is that our findings have ramifications for joint estimation of locus position and effect in general, no matter what method is used for mapping or what locus-specific parameters are estimated. Of course, the findings are in no way limited to genetic studies but apply equally to other multiple-testing problems in epidemiology (Thomas et al. 1985) and elsewhere. QTL heritabilities estimated in VC linkage analysis were merely an example used here. In a linkage and/or association study in general, only the trait phenotypes and the marker genotypes are observed, which are correlated with each other only indirectly, via the generally unobservable trait locus genotypes (Göring 2000; Terwilliger and Göring 2000; Weiss and Terwilliger 2000). Estimation of any parameters relating marker genotypes and trait phenotypes are thus subject to genomewide sampling bias, since all tests of linkage and/or association can be conceptualized mathematically in a form equivalent to equation (1), and all genomewide scans are equivalent to equation (2). The same basic fallacy therefore also applies to estimation of locus-specific dominance effect sizes, locus-specific recurrence risk to relatives, and locus allele-/genotype-specific attributable risk. The same holds for estimation of gene × environment interactions (Melchinger et al. 1998; Utz et al. 2000) and gene × gene interactions (i.e., epistasis). In fact, because higher significance levels should arguably be employed for testing for such interactions, since there are more potential tests, the bias is expected to be even greater. The same is true for genomewide association studies and joint linkage and association studies. Estimates of trait-locus allele/genotype frequencies and penetrances, recombination fractions, etc., are also subject to bias. Obviously, the problem cannot be avoided by using one method for mapping and another for locus-specific effect-size estimation, given that all methods developed for gene mapping better be correlated, as they strive to model the same underlying biological realities. Joint estimation of locus position and effect simply does not work on the same data set, at least when power is as low as it is for complex traits, on which most of us are currently focusing our efforts.
Differential Information Content throughout the Genome
Occasionally, one might be faced with the following situation: two LOD score peaks of nearly identical magnitude are observed, but the associated locus effect-size estimates are quite different. In the absence of any other relevant information, such as the existence of candidate genes, is it reasonable to give follow-up priority to the chromosomal region with the larger QTL-heritability estimate? We argue that it is not. This hypothetical situation is only possible when the effective sample size, in terms of informative “equivalent meioses” (Edwards 1976), differs between those two chromosomal regions. We would suggest that additional markers be genotyped near the peak with the larger locus-specific effect size estimate, to bring the local information content up to that of the chromosomal region of the other peak. One would then be in a better position to decide which peak to pursue. If additional genotyping is not possible, one might even argue that the putative locus with the lower heritability estimate might be more believable, because the evidence for this locus is based on a larger number of informative meioses (i.e., a larger effective sample size).
Conclusions
We have demonstrated, by simulations and approximate analytical expressions, that QTL-heritability estimates at LOD score peaks in genomewide VC linkage analysis are grossly biased upwards, even though such estimates can have fairly small pointwise biases under certain circumstances. The bias is shown to depend on the true parameter value, the sample size, and the study design (among other factors), which together also determine the power of a study. In realistic situations, estimates of QTL effect size can be virtually independent of the true effect size. We have further shown that there appears to be no satisfactory way of correcting for the genomewide bias within a study, suggesting that pointwise estimation on an independent data set may be the only meaningful approach to improved parameter estimates. Most importantly, it is argued that the results presented here for VC linkage analysis apply to all statistical methods of gene localization and their estimates of parameters characterizing the genotype-phenotype relationship.
Given the magnitude of the bias in most real-world studies, as judged by the results presented here, statements such as our own “Also, unlike most penetrance model-free linkage analysis methods, the variance-component method can be used both for localization of QTLs and for obtaining good estimates of the relative importance of the QTL in determining phenotypic variance in the population” (Almasy and Blangero 1998) are wishful rather than realistic, at least when viewed in the context of a genomewide scan. We simply should not expect to be able to map loci and estimate their effects from a single genome scan, even when the data set is large compared with those used in most current studies. When estimates of locus-specific effect size are published after a genomewide scan is conducted, we should keep in mind that these estimates are almost certainly biased upwards, probably to a large degree. By always keeping this bias in mind, we can hope to avoid overestimation of the importance of the identified loci, as most of us are prone to do. This would also allow us make more-realistic assumptions about the likely true locus-specific effects on which to base our own power calculations for mapping of complex traits. Moreover, we would be less likely to overestimate the likely effectiveness of potential future drugs targeting the identified genes. Lastly, given the equivalence of the factors leading to bias and to replication failure, we also would no longer be surprised by how difficult it is to successfully replicate an earlier gene localization for a complex trait in an independent sample.
Acknowledgments
This work has been supported in part by National Institutes of Health grants HL45522, HL28972, GM31575, and MH59490 (to J.B.), and by National Institutes of Health grant MH63749 and a Hitchings-Elion fellowship (to J.D.T.).
References
- Allison DB, Neale MC, Zannolli R, Schork NJ, Amos CI, Blangero J (1999) Testing the robustness of the likelihood-ratio test in a variance-component quantitative-trait loci-mapping procedure. Am J Hum Genet 65:531–544 [DOI] [PMC free article] [PubMed] [Google Scholar]
- Almasy L, Blangero J (1998) Multipoint quantitative-trait linkage analysis in general pedigrees. Am J Hum Genet 62:1198–1211 [DOI] [PMC free article] [PubMed] [Google Scholar]
- Amos CI (1994) Robust variance-components approach for assessing genetic linkage in pedigrees. Am J Hum Genet 54:535–543 [PMC free article] [PubMed] [Google Scholar]
- Beaty TH, Liang KY (1987) Robust inference for variance components models in families ascertained through probands. I. Conditioning on the proband's phenotype. Genet Epidemiol 4:203–210 [DOI] [PubMed] [Google Scholar]
- Beavis WD (1994) The power and deceit of QTL experiments: lessons from comparative QTL studies. In: 49th annual corn and sorghum industry research conference. American Seed Trade Association, Washington, DC, pp 250–266 [Google Scholar]
- Beavis WD (1998) QTL analysis: power, precision, and accuracy. In: Paterson AH (ed) Molecular dissection of complex traits. CRC Press, Boca Raton, FL, pp 145–162 [Google Scholar]
- Blangero J, Williams JT, Almasy L (2000) Quantitative trait locus mapping using human pedigrees. Hum Biol 72:35–62 [PubMed] [Google Scholar]
- ——— (2001) Variance component methods for detecting complex trait loci. Adv Genet 42:151–181 [DOI] [PubMed] [Google Scholar]
- Boehnke M, Greenberg DA (1984) The effects of conditioning on probands to correct for multiple ascertainment. Am J Hum Genet 36:1298–1308 [PMC free article] [PubMed] [Google Scholar]
- Boehnke M, Lange K (1984) Ascertainment and goodness of fit of variance component models for pedigree data. Prog Clin Biol Res 147:173–192 [PubMed] [Google Scholar]
- Comuzzie AG, Williams JT (1999) Correcting for ascertainment bias in the COGA data set. Genet Epidemiol 17:S109–S114 [DOI] [PubMed] [Google Scholar]
- Crow JF, Kimura M (1970) An introduction to population genetics theory. Harper and Row, New York [Google Scholar]
- Edwards JH (1976) The interpretation of lod scores in linkage analysis. Cytogenet Cell Genet 3:289–293 [DOI] [PubMed] [Google Scholar]
- Falconer DS, Mackay TFC (1996) Introduction to quantitative genetics. 4th ed. Prentice Hall, Harlow, United Kingdom [Google Scholar]
- Faraway JJ (1992) On the cost of data analysis. J Comput Graph Stat 1:213–229 [Google Scholar]
- Fisher RA (1934) The effect of methods of ascertainment upon the estimation of frequencies. Ann Eugenics 6:13–25 [Google Scholar]
- Georges M, Nielsen D, Mackinnon M, Mishra A, Okimoto R, Pasquino AT, Sargeant LS, Sorensen A, Steele MR, Zhao X, Womack JE, Hoeschele I (1995) Mapping quantitative trait loci controlling milk production in dairy cattle by exploiting progeny testing. Genetics 139:907–920 [DOI] [PMC free article] [PubMed] [Google Scholar]
- Göring HHH (2000) Statistical aspects of human gene mapping in the presence of errors. Ph.D. thesis, Columbia University, New York [Google Scholar]
- Göring HHH, Terwilliger JD (2000a) Linkage analysis in the presence of errors. I: Complex-valued recombination fractions and complex phenotypes. Am J Hum Genet 66:1095–1106 [DOI] [PMC free article] [PubMed] [Google Scholar]
- ——— (2000b) Linkage analysis in the presence of errors. II: Marker-locus genotyping errors modeled with hypercomplex recombination fractions. Am J Hum Genet 66:1107–1118 [DOI] [PMC free article] [PubMed] [Google Scholar]
- ——— (2000c) Linkage analysis in the presence of errors. IV: Joint pseudomarker analysis of linkage and/or linkage disequilibrium on a mixture of pedigrees and singletons when the mode of inheritance cannot be accurately specified. Am J Hum Genet 66:1310–1327 [DOI] [PMC free article] [PubMed] [Google Scholar]
- Goldgar DE (1990) Multipoint analysis of human quantitative genetic variation. Am J Hum Genet 47:957–967 [PMC free article] [PubMed] [Google Scholar]
- Hopper JL, Mathews JD (1982) Extensions to multivariate normal models for pedigree analysis. Ann Hum Genet 46:373–383 [DOI] [PubMed] [Google Scholar]
- Jones DR, Rushton L (1982) Simultaneous inference in epidemiological studies. Int J Epidemiol 11:276–282 [DOI] [PubMed] [Google Scholar]
- Kearsey MJ, Farquhar AGL (1998) QTL analysis in plants: where are we now? Heredity 80:137–142 [DOI] [PubMed] [Google Scholar]
- Lande R, Thompson R (1990) Efficiency of marker-assisted selection in the improvement of quantitative traits. Genetics 124:743–756 [DOI] [PMC free article] [PubMed] [Google Scholar]
- Lander E, Kruglyak L (1995) Genetic dissection of complex traits: guidelines for interpreting and reporting linkage results. Nat Genet 11:241–247 [DOI] [PubMed] [Google Scholar]
- Lange KL, Little RJA, Taylor JMG (1989) Robust statistical modeling using the t distribution. J Am Stat Assoc 84:881–896 [Google Scholar]
- Lange K, Westlake J, Spence MA (1976) Extensions to pedigree analysis. III. Variance components by the scoring method. Ann Hum Genet 39:485–491 [DOI] [PubMed] [Google Scholar]
- Lindsay RM, Ehrenberg ASC (1993) The design of replicated studies. Am Statistician 47:217–228 [Google Scholar]
- Melchinger AE, Utz HF, Schön CC (1998) Quantitative trait locus (QTL) mapping using different testers and independent population samplex in maize reveals low power of QTL detection and large bias in estimates of QTL effects. Genetics 149:383–403 [DOI] [PMC free article] [PubMed] [Google Scholar]
- Miller AJ (1990) Subset selection in regression. Chapman and Hall, London [Google Scholar]
- Morton NE (1955) Sequential tests for the detection of linkage. Am J Hum Genet 7:277–318 [PMC free article] [PubMed] [Google Scholar]
- Mukhopadhuay N, Finegold DN, Larson M, Cupples LA, Myers RH, Ferrell R, Weeks DE (2000) Heritability of height and assortative mating in the Framingham Study. Am J Hum Genet Suppl 67:A235 [Google Scholar]
- Rao DC, Wette R, Ewens WJ (1988) Multifactorial analysis of family data ascertained through truncation: a comparative evaluation of two methods of statistical inference. Am J Hum Genet 42:506–515 [PMC free article] [PubMed] [Google Scholar]
- Risch N, Merikangas K (1996) The future of genetic studies of complex human diseases. Science 273:1516–1517 [DOI] [PubMed] [Google Scholar]
- Self SG, Liang K-Y (1987) Asymptotic properties of maximum likelihood estimators and likelihood ratio tests under nonstandard conditions. J Am Stat Assoc 82:605–610 [Google Scholar]
- Stuart A, Ord JK (1991) Kendall's advanced theory of statistics. Vol. 2: Classical interference and relationship. 5th ed. Oxford University Press, New York [Google Scholar]
- Suarez BK, Hampe CL, van Eerdewegh P (1994) Problems of replicating linkage claims in psychiatry. In: Gershon ES, Cloninger CR (eds) Genetic approaches to mental disorders. American Psychiatric Press. Washington, DC, pp 23–46 [Google Scholar]
- Terwilliger JD, Göring HHH (2000) Gene mapping in the 20th and 21st centuries: statistical methods, data analysis, and experimental design. Hum Biol 72:63–132 [PubMed] [Google Scholar]
- Terwilliger JD, Göring HHH, Magnusson PKE, Lee JH. Study design for genetic epidemiology and gene mapping: the Korean Diaspora Project. Shengming Kexue Yanjiu (in press) [Google Scholar]
- Terwilliger JD, Shannon WD, Lathrop GM, Nolan JP, Goldin LR, Chase GA, Weeks DE (1997) True and false positive peaks in genomewide scans: application of length-biased sampling to linkage mapping. Am J Hum Genet 61:430–438 [DOI] [PMC free article] [PubMed] [Google Scholar]
- Thomas DC, Siemiatycki J, Dewar R, Robins J, Goldberg M, Armstrong BG (1985) The problem of multiple inference in studies designed to generate hypotheses. Am J Epidemiol 122:1080–1095 [DOI] [PubMed] [Google Scholar]
- Utz HF, Melchinger AE (1994) Comparison of different approaches to interval mapping of quantitative trait loci. In: Van Ooijen JW, Jansen J (eds) Biometrics in plant breeding: applications of molecular markers, proceedings of the ninth meeting of the EUCARPIA section biometrics in plant breeding. CPRO-DLO, Wageningen, The Netherlands, pp 195–204 [Google Scholar]
- Utz HF, Melchinger AE, Schön CC (2000) Bias and sampling error of the estimated proportion of genotypic variance explained by quantitative trait loci determined from experimental data in maize using cross validation and validation with independent samples. Genetics 154:1839-1849 [PMC free article] [PubMed] [Google Scholar]
- Weiss KM, Terwilliger JD (2000) How many diseases do you have to study to map one gene with SNPs? Nat Genet 26:151–158 [DOI] [PubMed] [Google Scholar]
- Williams JT, Blangero J (1999) Power of variance component linkage analysis to detect quantitative trait loci. Ann Hum Genet 63:545–563 [DOI] [PubMed] [Google Scholar]
- Williams JT, Duggirala R, Blangero J (1997) Statistical properties of a variance components method for quantitative trait linkage analysis in nuclear families and extended pedigrees. Genet Epidemiol 14:1065–1070 [DOI] [PubMed] [Google Scholar]