

SUMMARY
In B cells, BLIMP1 is required for plasma cell differentiation. BLIMP1 is also expressed in some germinal center (GC) B cells (GCBC), yet the role of BLIMP1 in GCBC is not understood. Here we generated mixed bone marrow (BM) chimeric mice using Prdm1+/+ CD19Cre and Prdm1fl/fl CD19Cre BM, allowing us to examine the cell-intrinsic functions of BLIMP1 in GCBC, independent of antibody or antigen levels. Strikingly, BLIMP1-deficient B cells quickly dominate GCs and persist for a much longer time compared with wild-type cells. BLIMP1 deficiency promotes positive selection of GCBCs and enhances cell-cycle progression. Additionally, BLIMP1 deficiency alters class switching and memory B cell generation from GCBCs. Mechanistically, BLIMP1-deficient GCBCs fail to downregulate BCL6 and to upregulate IRF4, indicating that BLIMP1 controls the expression of these transcription factors that mediate exit from the GC. These studies revealed unique functions of BLIMP1 in regulating GCBC responses that impact long-lived immune compartments.
Graphical Abstract

In brief
BLIMP1 is expressed in a subset of GCBCs. Conter et al. have shown that BLIMP1 intrinsically regulates multiple key processes in GCBCs, including positive selection, cell-cycle progression, isotype switching, zonal localization, MBC differentiation, and transcriptional programming.
INTRODUCTION
The germinal center (GC) response is critical for generating high-affinity long-lived plasma cells (PCs) and memory B cells (MBCs). GC B cells (GCBCs) go through affinity-driven clonal evolution, during which high-affinity GCBCs are selected by signals from both antigen and follicular helper T cells.1 GCBCs have a unique transcriptional network that is regulated by BCL6. BCL6 antagonizes BLIMP1 to prevent premature PC differentiation.2,3 Reciprocally, BLIMP1 represses gene expression programs of mature B cells to facilitate the expression of genes associated with PC differentiation.4–7 With these critical functions, BLIMP1 is required for PC differentiation and antibody production.5,8 Intriguingly, BLIMP1 deficiency has been associated with diffuse large cell B cell lymphoma, including lymphoma types that may have a GC-like origin.9,10 However, nearly all of the studies of BCL6 and BLIMP1 interaction have been conducted in cell lines, with some conducted in B cells but not GCBCs. Given the extensive reprogramming of gene expression in GCBCs compared with naive B cells or B cell blasts derived from mature B cells, whether the relationships explored in non-GC cells apply to GCBCs remains an open question.
Indeed, from recent studies, some evidence indicates that BLIMP1 might have additional and unexpected functions in regulating GCBC activation, proliferation, and differentiation. We recently discovered that BLIMP1 can be induced by combined CD40 and B cell receptor (BCR) signals in GCBC, which at least in vitro does not ultimately lead to PC precursor differentiation. In contrast, under the same culture conditions, the combination of CD40 and interleukin (IL)-21R signals, despite less potency in inducing BLIMP1 in GCBCs, could efficiently promote GCBC differentiation toward the PC fate.11 In line with these findings, BLIMP1 has been shown to be expressed at low levels in vivo in proliferating dark zone (DZ) GCBCs,12 but there was no evidence that these cells are committed to PC differentiation. These findings highlight a possible GC-specific role of BLIMP1. Notably, conditional deletion of BLIMP1 in B cells did lead to enlarged GCs when the mice were immunized with T dependent antigen.5 However, since BLIMP1 deficiency renders the mice incapable of producing antibodies, it seemed likely that this result was attributable to decreased antibody-mediated antigen clearance, which in turn would enhance the GC response.
Therefore, there remains an important knowledge gap regarding the cell-intrinsic functions of BLIMP1 in regulating GCBC responses. To investigate this, we generated chimeric mice using equal mixtures of bone marrow (BM) from Prdm1+/+ CD19Cre and Prdm1fl/fl CD19Cre mice. We discovered unique antibody- and antigen-independent functions of BLIMP1 in regulating GCBC responses that impact long-lived immune compartments.
RESULTS
BLIMP1 controls GCBC expansion in a cell-intrinsic manner
BLIMP1 has previously been shown to be expressed in a subset of GCBCs that are not yet committed to the PC lineage.12 To directly compare DZ and light zone (LZ) GCBC, we first gated on DZ and LZ GCBC populations, followed by analysis of surface CD138 and intracellular BLIMP1 expression (Figure S1A). Consistent with the previous report,12 we observed that BLIMP1 was present in a small fraction of GCBCs, and the majority of BLIMP1-expressing GCBCs did not co-express the PC marker CD138 (Figures S1A and S1B). Interestingly, DZ GCBCs showed a slightly greater proportion of cells with low BLIMP1 expression and lacking CD138 (BLIMP1dim CD138−), whereas LZ GCBC were enriched for cells with high BLIMP1 expression, both CD138− (BLIMP1+ CD138−) and CD138+ (BLIMP1+ CD138+) (Figures S1A and S1B).
To understand the role of BLIMP1 in regulating GCBCs, it is essential to separate the indirect effects of lack of antibody secretion from B cell-intrinsic effects of BLIMP1 deficiency. To address this, we generated BM chimera mice by reconstituting irradiated CD45.1/CD45.2 mice with equal mixtures of BM from CD45 congenically marked Prdm1+/+ CD19Cre and Prdm1fl/fl CD19Cre mice (Figure 1A). In this system, WT and BLIMP1-deficient B cells, which can be tracked using their CD45 genotypes, compete in the same environment during the GC response. We then immunized these BM chimera mice with 4-hydroxy-3-nitrophenylacetyl-chicken gamma globulin (NP-CGG) in alum to induce a GC response. Strikingly, BLIMP1-deficient B cells dominated the GC response at a ratio of ∼4.5:1 as early as at day 7 after immunization, and this trend continued to the peak GC time point at day 12 after immunization (Figure 1B). There was no such difference among non-GCBCs at day 7, representing the baseline in the overall B cell compartment. A small advantage (∼1.3:1 ratio) was observed at day 12, perhaps reflecting products of the immune response such as MBCs (Figure 1B). Further, BLIMP1-deficient B cells continued to dominate the GC response even 2 months after immunization (Figure 1B). Histological analyses revealed that B cells from both genotypes coexisted within the same GCs, with BLIMP1-deficient B cells showing a dominant presence (Figures 1C and S2A).
Figure 1. BLIMP1 controls GCBC expansion in a cell-intrinsic manner.

(A) Schematic of the BM chimera design.
(B) BM chimera mice were immunized with NP-CGG in alum. The frequency of BLIMP1 KO and WT donor cells among GCBCs and non-GCBCs in the spleen at days 7 and 12 and week 8 after immunization was examined by flow cytometry. Day 7 consists of two independent experiments (n = 13), day 12 consists of four independent experiments (n = 30), and week 8 consists of three independent experiments (n = 21). p values were determined by two-tailed paired t test. Bars show mean ± SD.
(C) Immunofluorescence staining of GC with CD45.1 and CD45.2 markers (see additional image examples in Figure S2A). Spleen sections from three mice on day 12 after NP-CGG in alum were imaged and four to nine GCs per mouse were analyzed. Graph shows fraction of PNA+ pixels that are BLIMP1 KO or WT. p values were determined by two-way repeated measures ANOVA.
To determine whether this GC dominance was due to differences in GC seeding during initiation, we examined mice at days 4 and 5 after immunization, time points corresponding with the earliest detectable GC initiation. Notably, when appropriately normalized to total B cell numbers, BLIMP1-deficient antigen-specific B cells showed no advantage in GC seeding (Figure S2B), suggesting that their later dominance was likely driven by GCBC expansion rather than recruitment. Indeed, at these early GC time points, BLIMP1-deficient GCBCs had already begun to exhibit accelerated progression into S phase (Figure S2C). Further analysis of mesenteric lymph nodes and Peyer’s patches containing chronic GCs under steady-state conditions revealed a similar pattern, with BLIMP1-deficient cells dominating the GCBC population (Figure S2D). Collectively, these findings indicate that BLIMP1 exerts a cell-intrinsic role in restricting GCBC expansion and persistence, independent of external factors such as antibody or antigen levels.
BLIMP1 deficiency affects GCBC cell-cycle progression, zonal distribution, and positive selection
To better understand how BLIMP1 restrains GCBC expansion, we focused on determining whether the expanded GCBCs in BLIMP1 deficiency is due to altered cell-cycle progression and/or apoptotic cell death. To analyze the cell cycle of GCBCs, we immunized BLIMP1 BM chimera mice with NP-CGG and injected EdU into the mice at a peak GC response time point, to label the cells in S-phase. DAPI staining of DNA content was used to further separate the S, G1, and G2/M phases. We discovered that, compared with WT GCBCs, BLIMP1-deficient GCBCs have an increased percentage of cells in S-phase, which is associated with decreased G1 and G2/M phase frequencies (Figure 2A). The absence of BLIMP1 did not impact the G1 or G2/M phases in non-GCBCs. BLIMP1 deficiency statistically raised the frequency of cells in S-phase among non-GCBCs, although very few such cells were in cycle and the fold difference was small (Figure S3).
Figure 2. BLIMP1 deficiency affects GCBC cell-cycle progression, zonal distribution, and positive selection.

BM chimera mice were immunized with NP-CGG in alum and splenic BLIMP1 KO and WT donor cells were examined by flow cytometry at day 12 after immunization.
(A) Mice were treated with EdU 1 h before analysis. Data show representative flow plots and frequencies of G1, S, and G2/M subsets in BLIMP1 KO and WT GCBC as determined by DAPI and EdU staining. Data are from two independent experiments (n = 15). p values were determined by two-tailed paired t test. Bars show mean ± SD.
(B) Representative flow plots of LZ and DZ distribution among BLIMP1 KO and WT GCBCs and quantitation of the ratio of DZ to LZ from four independent experiments (n = 29). p value was determined by two-tailed paired t test.
(C) Representative flow plots and quantitation of the frequency of cleaved caspase3+ among BLIMP1 KO and WT GCBCs. Data are from two independent experiments (n = 15). p values were determined by two-tailed paired t test. Bars show mean ± SD.
(D) Frequency of c-MYC+ splenic BLIMP1 KO and WT GCBC from BM chimeric mice at day 12 and week 8 after NP-CGG immunization. Shown are representative flow plots with statistical analysis of four independent experiments (n = 30) for day 12 and three independent experiments (n = 21) for week 8. p values were determined by two-tailed paired t test.
(E) Isolated B cells from immunized BLIMP1 KO and WT mice t day 12 after NP-CGG in alum were stimulated for 2 h as indicated. c-MYC expression in GCBCs were examined by flow cytometry. Data are from two independent experiments (n = 9). Bars show mean ± SD. p values were determined by two-tailed unpaired t test. NP-Ficoll stimulation gated on NP-Ficoll FITC+ cells.
GCBCs proliferation mainly takes place in the DZ.13 In line with this, BLIMP1-deficient GCBCs were found disproportionately within the DZ, as measured by an increase of the ratio of DZ to LZ (Figure 2B). BLIMP1 deficiency also slightly increased apoptosis in GCBC (Figure 2C). Together, these observations suggest that BLIMP1 negatively regulates GCBC cell-cycle progression, possibly by altering zonal developmental progression from DZ to LZ. Commensurate with greater cell cycling among BLIMP1-deficient GCBCs, the percentage of these cells expressing c-MYC, a marker of positive selection,1,14,15 was also significantly increased (Figure 2D). Since c-MYC is induced by signals in the LZ and is thought to proportionately license cell proliferation in the DZ, even as its own expression is extinguished,1,16 the higher percentage of c-MYC+ cells could be upstream of the higher fraction of DZ cells in the cell cycle in BLIMP1-deficient B cells. Indeed, during PC development BLIMP1 has been shown to repress c-MYC expression.7 Together, these data suggest that the increased cell-cycle progression in GCBCs with BLIMP1 deficiency offset the effects on apoptosis, leading to greater total cellular accumulation of BLIMP1-deficient vs. WT GCBCs.
Next, we addressed what signals drive the elevated c-MYC expression in BLIMP1-deficient GCBCs. Our previous studies demonstrated that CD40 signaling, combined with either BCR or IL-21R signaling, synergistically induces c-MYC expression in GCBCs.1,11 Building on this, we isolated and stimulated GCBCs from WT and BLIMP1 conditional knockout (KO) mice with defined combinations of CD40, BCR, and IL-21R signals. Interestingly, combined CD40/BCR stimulation, but not CD40/IL-21R or CD40 alone, resulted in significantly higher c-MYC expression in BLIMP1-deficient GCBCs compared with WT GCBCs (Figure 2E). Notably, our previous findings also showed that combined CD40/BCR signaling more robustly induces BLIMP1 in GCBCs.11 Together, these results suggest that GCBCs have a regulatory feedback loop in which CD40/BCR signals promote both BLIMP1 and c-MYC expression, with BLIMP1 acting to limit GCBC expansion by modulating the expression of c-MYC.
Regulation of isotype switching by BLIMP1
A prominent feature of the T cell-dependent B cell response is isotype switching, which occurs both before and during the GC response. To determine whether BLIMP1 deficiency affects isotype switching, we compared WT and BLIMP1-deficient GCBCs at the peak of the GC response in mixed BM chimera mice. BLIMP1-deficient GCBCs had a significantly greater percentage of both immunoglobulin (Ig)G+ and IgA+ cells, compared with WT GCBCs; conversely, WT GCBC had an almost 2-fold higher percentage of IgM+ cells (Figure 3A). These data suggested that BLIMP1 deficiency enhanced isotype switching to IgG. Interestingly, despite more total IgG+ cells among BLIMP1-deficient GCBCs, there was a lower percentage of IgG1 subtypes in BLIMP1-deficient GCBCs compared with WT GCBCs (Figure 3B), suggesting BLIMP1 expression could control the subtype of IgG isotype switching. Further, BLIMP1-deficient GCBCs harbored a larger fraction of IgM−/IgG1− cells (Figure 3B). These data highlight a previously unrecognized function of BLIMP1 in regulating B cell isotype-switching during the GC response.
Figure 3. BLIMP1-deficient GCBCs more frequently express downstream Ig isotypes.
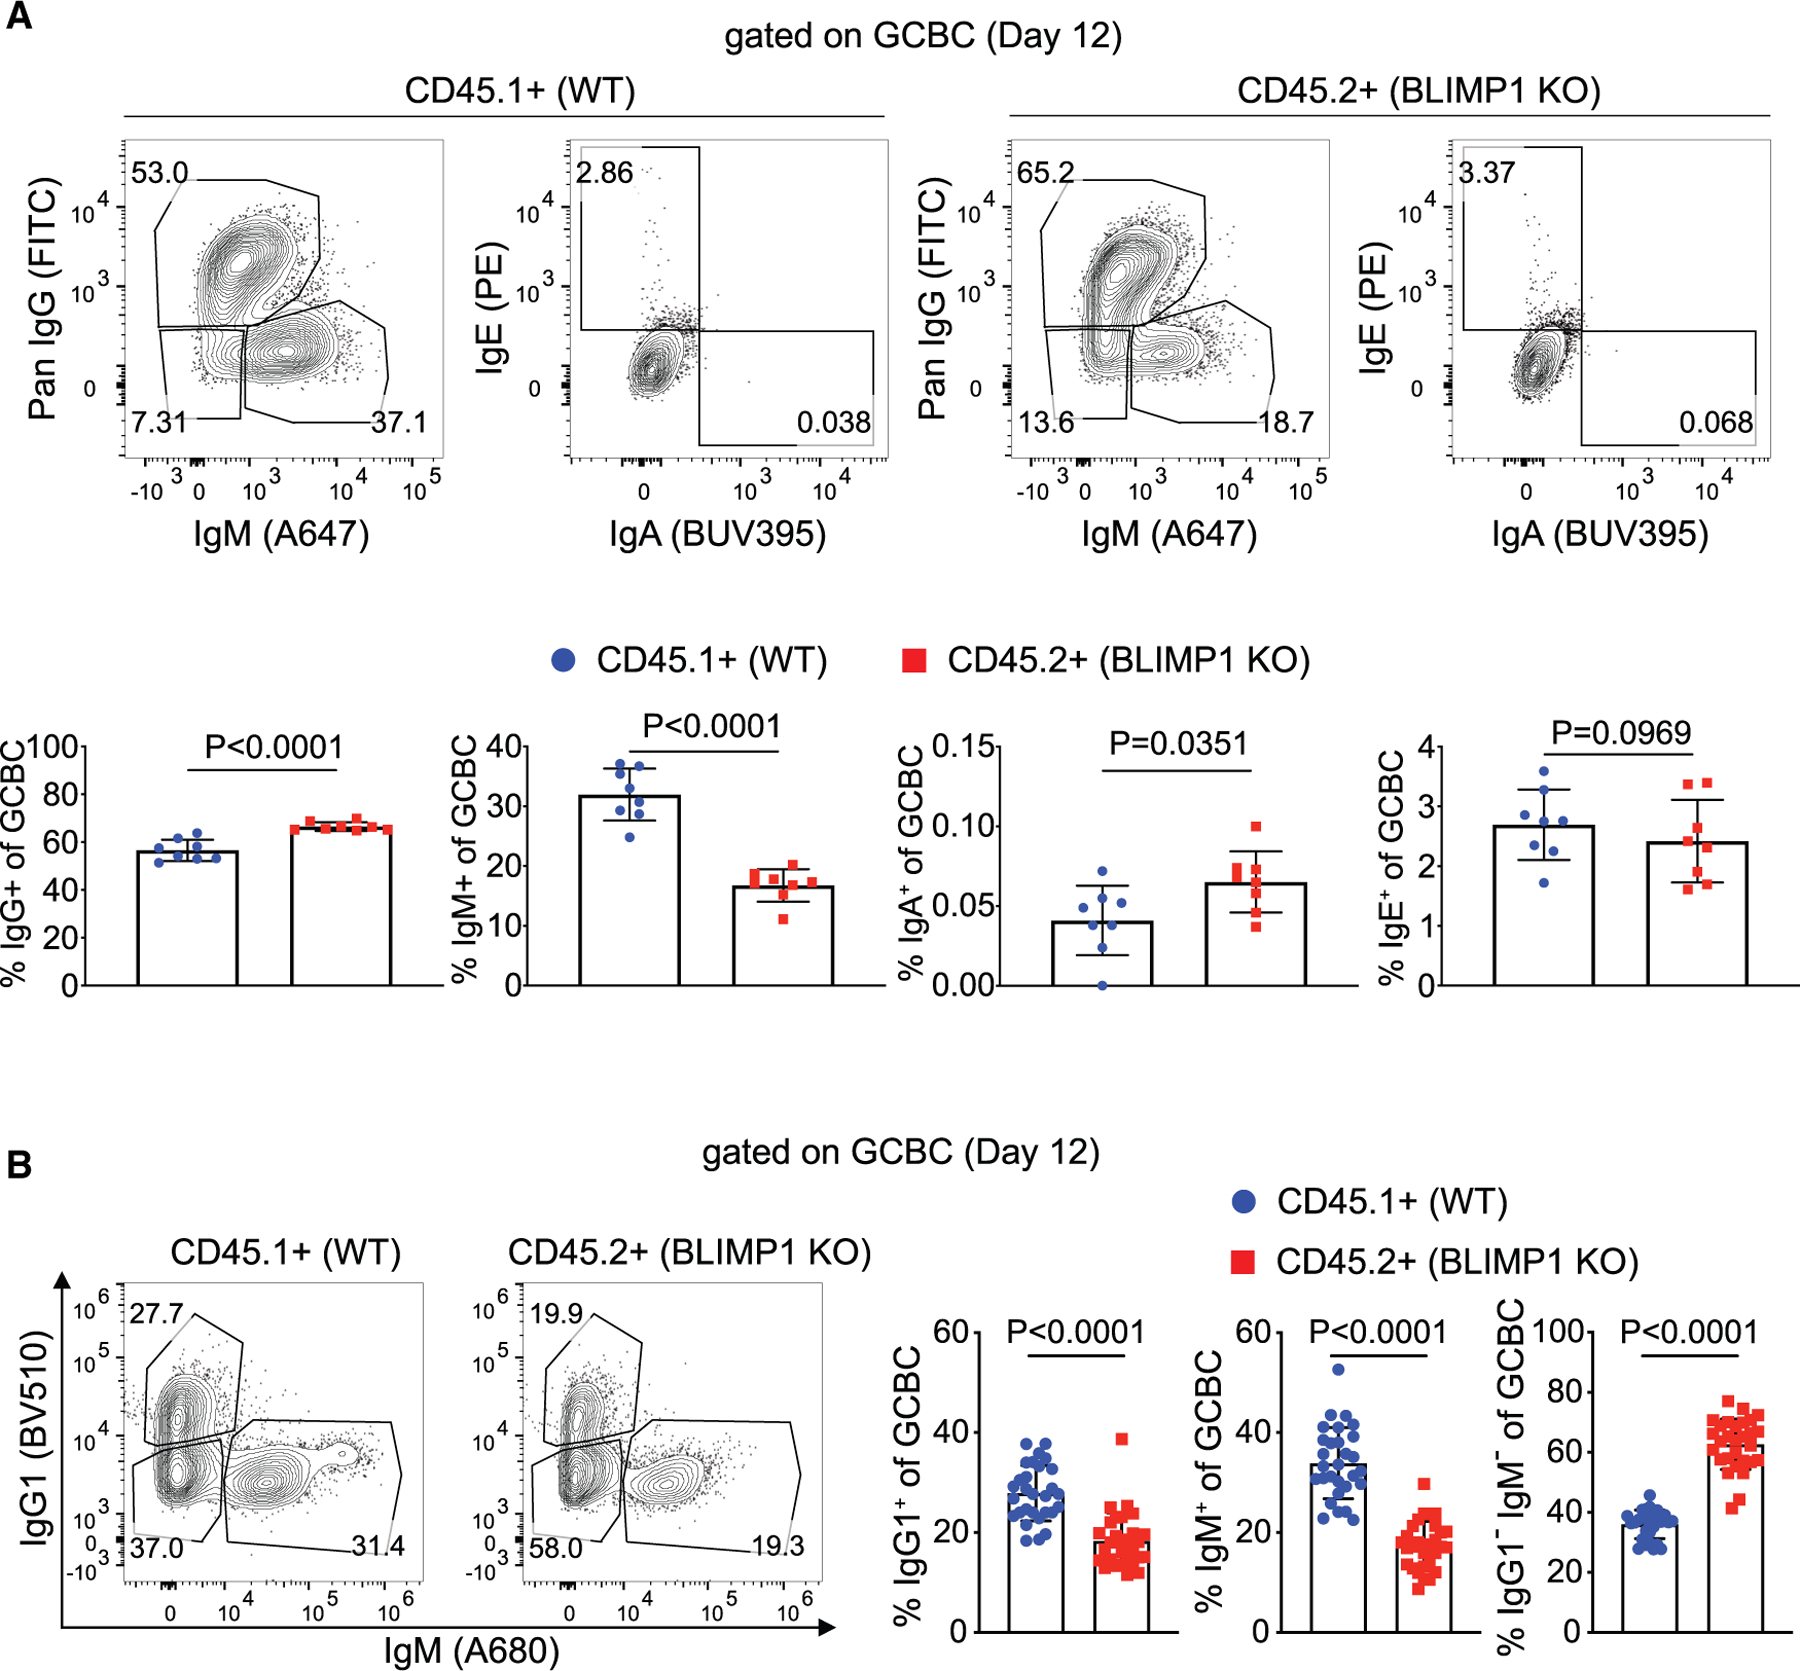
Mixed BM chimeric mice were analyzed by flow cytometry at day 12 after NP-CGG in alum immunization.
(A) Representative flow plots (top) and frequencies (bottom) of IgM, IgG, IgA, and IgE expression on BLIMP1 KO and WT GCBCs. Each dot is a single animal from one experiment (n = 8). p values were determined by two-tailed paired t test. Bars show mean ± SD.
(B) Representative flow plots and frequencies of IgM and IgG1 staining on BLIMP1 KO and WT. Data are from four independent experiments (n = 29). p values were determined by two-tailed paired t test. Bars show mean ± SD.
The effect of BLIMP1 deficiency on GCBC V region evolution
As BLIMP1 deficiency affected proliferation and expansion of GCBCs, we wanted to determine if this affected affinity maturation in the GC or whether all GCBCs, regardless of BCR affinity, were similarly restrained by BLIMP1. To this end, we isolated WT and BLIMP1 KO GCBCs from three NP-CGG-immunized chimeric mice, sorted IgM+, IgG+, and IgM−/IgG− GCBCs, and performed VH1-72-targeted, high-throughput Vh region sequencing, as described in the STAR Methods. VH1-72 is dominantly used in the response to NP. Each sample was sequenced in two to five independently amplified replicates. Samples submitted for sequencing and the number of replicates, resultant sequences, and GCBC clones that were identified are given in Table S1. At least 1,000 VH1-72 sequences of each genotype and each isotype group were analyzed. As expected, among the IgM+ and IgG+ GCBCs, the great majority of sequences were productive (in-frame and without stop codons) and contained V region mutations (Figure 4A).
Figure 4. The effect of BLIMP1 deficiency on GCBC affinity maturation.

(A) Stacked bar plots showing the number of unique VDJ sequences classified as non-productive, productive-mutated, or productive-unmutated across genotypes (WT and BLIMP1 KO) for each isotype group (IgG+, IgM+, and IgM−/IgG−).
(B) Distribution of Ighv region mutation counts (in nucleotides) among all productive rearrangements. Histograms depict the number of sequences with a given mutation load, with overlaid density plots showing smoothed distributions across genotypes and isotypes.
(C) Fraction of all sequences containing a leucine substitution at position 33 (IMGT numbering), where a conserved tryptophan is typically encoded, stratified by isotype and genotype.
(D) Posterior probability density functions for selection strength estimates (Σ) in the CDRs (top) and FWRs (bottom), calculated based on the most abundant sequence of each independent clone, using the BASELINe framework with the focused method. (Left) Selection strength distributions across isotypes in WT and BLIMP1 KO genotypes. (Right) Selection strength distributions by genotype across IgM−/IgG− B cells from three individual mice.
Notably, there were many more non-productive sequences in the IgM−/IgG− GCBC group (p < 0.001), perhaps consistent with their low to undetectable surface Ig staining. The BLIMP1 KO IgM−/IgG− GCBCs had an even higher frequency of non-productive sequences than the WT (p < 0.001) (Figure 4A). In our experience, and as shown here, all GCBC (regardless of genotype) include this population of IgM−/IgG− cells; however, we are unaware of any efforts to specifically sequence V regions of this population. As shown above, this population is selectively expanded among BLIMP1 KO GCBCs. There was a hierarchy of mutation frequency according to isotype, with IgM−/IgG− > IgG ∼ IgM for each genotype (p < 0.001 for all comparisons except IgM−/IgG− vs. IgM in the BLIMP1 KO, p = 0.002, Wilcoxon rank test). There were almost no differences in mean mutation count by genotype for each of the isotype groups, with the WT IgM−/IgG− having slightly more (4.6 per sequence) compared the BLIMP1 KO (4.1 per sequence) (Figure 4B).
Positive selection and affinity maturation were measured in two ways: by assessing the frequency of mutations of W33 to L in the H chain, which is known to increase the affinity of VH1-72/Igλ-encoded BCRs to NP, and by using Bayesian modeling (BASELINe17) to identify enrichment of R mutations in complementarity-determining regions (CDRs) and framework regions (FWRs) of the BCR. Both analyses revealed that BLIMP1 deficiency did not impact affinity maturation in IgM+ or IgG+ GCBCs. Only in the IgM−/IgG1− isotype group did we observe significant evidence for affinity selection and skewing of mutation distributions in the BLIMP1 KO compared with the WT GCBC, with a greater frequency of the W->L mutation in the IgM−/IgG− BLIMP1 KO V regions (p = 0.04, chi-square test) (Figure 4C). For the IgM−/IgG− population, BASELINe also provided evidence of more positive selection in CDRs of the combined BLIMP1 KO V sequences compared with WT V sequences (p < 0.001) (Figure 4D), but no significant differences in FWRs.
Transcriptional regulation of GCBCs by BLIMP1
To gain further insight into the molecular mechanisms driving the GC phenotype linked to BLIMP1 deficiency, we isolated both WT and BLIMP1-deficient GCBCs from immunized BM chimera mice and conducted bulk RNA sequencing (RNA-seq). There were significant alterations in the expression profiles of 253 genes in BLIMP1-deficient GCBCs compared with their WT counterparts, wherein 134 genes exhibited upregulation while 119 genes displayed downregulation (Figure 5A). Notably, the enhanced selection and cells in S phase observed in BLIMP1 KO GCBCs correlated with the upregulation of key genes facilitating this process, such as Pbx1 and Igsf3.18,19 Conversely, genes like Xist, known for their role in inhibiting the cell cycle,20 were downregulated in BLIMP1 KO GCBCs (Figure 5B). Intriguingly, in concert with Xist downregulation, in BLIMP1 KO GCBCs, X-linked genes demonstrated higher levels of expression, as assessed by gene set enrichment analysis (Figure S4).
Figure 5. Transcriptomic analysis of BLIMP1 KO and WT GCBC.

(A) Heatmap showing unbiased hierarchical clustering of differentially expressed genes (false discovery rate [FDR] of <0.05, log2 fold-change = 1) in BLIMP1 KO compared with WT samples (three replicates).
(B) Volcano plot showing top differentially expressed genes in BLIMP1 KO compared with WT GCBC. The x axis shows the log2 fold-change and the y axis shows −log10 of the FDR. Each dot is a gene. Blue dots highlight significantly differentially expressed genes (FDR < 0.05). Square shape represents TFs and triangles are genes encoding surface proteins.
(C and D) Bubble plots show the top 20 (C) TF motifs and (D) pathways enriched among upregulated (magenta) and downregulated (blue) genes from cluster 8 (BLIMP1hi GCBCs) from our previously published scRNA-seq.11 The x axis shows the −log10 FDR for the enriched terms displayed on y axis. Bubble size reflects the number genes in the pathway that are differential in cluster 8 versus the other clusters (from Luo et al.11).
To further understand effects of BLIMP1 deletion on transcription and GC differentiation, we purified GCBCs of each genotype from chimera mice and performed single-cell RNA-seq (scRNA-seq). Generally, GCBCs of both genotypes overlapped in a UMAP plot (Figure S5A), while cluster analysis revealed LZ and DZ identities, shown by overlaying scores on the UMAP clusters (Figure S5B). Cluster analysis revealed that BLIMP1 deficiency slightly increased the frequency of cells in clusters 1 and notably decreased the frequency in cluster 3. Cluster 1 exhibited high DZ scores, while cluster 3 contained cells provisionally identified as PC precursors, based on expression of Prdm1, Jchain, and Slpi (Figures S5C and S5D). To identify the impact of BLIMP1 deficiency on potential PC precursors using previously validated markers,11,21 we selected cells that were Bcl6lo/Irf4hi and analyzed their identity via subclustering (Figure S5E). Among the Bcl6lo/Irf4hi cells, only one subcluster was differentially represented, subcluster 4, which was entirely composed of WT cells (Figure S5E). This subcluster had a PC precursor gene expression pattern, including Jchain and Slpi (Figure S5F) and was notable for expression of high levels of Prdm1 and Irf4 (Figure S5G). Hence a subcluster of Bcl6lo/Irf4hi PC-precursor-like cells could not develop in the BLIMP1 KO GCBC compartment. These findings fully agree with our flow cytometry results (see Figure 7).
Figure 7. BLIMP1 signaling controls GCBC differentiation by regulating BCL6 and IRF4 expression.

(A and B) Mixed BM chimera mice were immunized with NP-CGG in alum. Splenic BLIMP1 KO and WT donor cells were examined at days 7 and 12 and week 8 after immunization by flow cytometry. (A) Representative day 12 flow staining of BCL6 and IRF4 gated on BLIMP1 KO (CD45.2) and WT (CD45.1) GCBCs. (B) Tabulation of frequencies of BCL6lo IRF4hi and BCL6lo IRF4lo among BLIMP1 KO and WT GCBCs at different time points. Day 7 consists of two independent experiments (n = 13), day 12 consists of four independent experiments (n = 30), and week 8 consists of three independent experiments (n = 21). p values were determined by two-tailed paired t test. Bars show mean ± SD.
(C) Sorted GCBC from NP-CGG-immunized BLIMP1 KO and WT mice were cultured for 48 h with α-CD40 or α-CD40 + IL-21. Flow cytometry was used to examine BCL6 and IRF4 expression after stimulation. Representative flow plots and frequencies of BCL6loIRF4hi and BCL6loIRF4lo cells are shown. Data are from three independent experiments with cells pooled from 5 to 11 mice in each experiment. p values were determined by two-tailed paired t test. Bars show mean ± SD.
We previously showed that ex vivo stimulation of GCBCs via CD40 and BCR ligation for 48 h induces substantial BLIMP1 expression in a subset of GCBCs that are mostly not committed to PC differentiation, based on lack of expression of both CD138 and IRF4.11 To further bolster the scRNA-seq data from BLIMP1 KO and WT cells of chimeric mice, we reanalyzed the scRNA-seq data derived from these stimulated WT GCBCs.11 To this end, we conducted a comparative analysis of pathways significantly distinct between the Prdm1+ (cluster 8 in Luo et al.11) and Prdm1− (the other clusters) of ex vivo stimulated GCBCs.11 Transcription factor (TF) motif enrichment analysis using TRANSFAC22 revealed that BLIMP1 induction in GCBCs was associated with significant regulation of several key TFs (Figure 5C). The Reactome pathway analysis unveiled notable differences, highlighting those critical pathways associated with cell-cycle progression—such as mitosis, DNA elongation and replication, DNA synthesis, and cell-cycle checkpoints—are downregulated in the cluster of GCBC-expressing high levels of Prdm1 in comparison with other GCBC clusters. Additionally, cytokine signaling pathways were also found to be downregulated in the Prdm1-expressing GCBC subset (Figure 5D). These analyses support that BLIMP1, induced by antigen- and T cell-derived signaling, operates both directly and indirectly to transcriptionally modulate GCBC proliferation and signaling.
GC-derived MBCs develop less efficiently without BLIMP1
To investigate whether BLIMP1 affects the formation of MBCs in a cell-intrinsic manner, we immunized BLIMP1 BM chimera mice with NP-CGG and analyzed MBC formation 8 weeks later. MBCs can be separated into functionally distinct subsets based on their CD80 and PD-L2 expression levels,23 and so we included these markers in the analysis. BLIMP1 BM chimera mice contain equal frequencies of BLIMP1-deficient and WT B cells as marked by CD45.1/CD45.2 (Figure 1B). A roughly 1:1 ratio of CD80 and PD-L2 double-negative or single-positive MBC subsets was observed between BLIMP1 KO and WT, suggesting that BLIMP1 deficiency does not impact the development of these MBC subsets, which are not GC derived24 (Figures 6A and 6B).
Figure 6. MBC development in absence of BLIMP1.

Mixed BM chimera mice were immunized with NP-CGG in alum. Eight weeks after immunization, the frequency of BLIMP1 KO (CD45.2) and WT (CD45.1) donor cells among splenic NP-specific CD80/PDL2 MBC subsets was examined by flow cytometry.
(A) Representative flow plots illustrating the gating for NP-specific MBC subsets and frequencies of BLIMP1 KO and WT cells in each subset. Each subset quadrant gate is color coded in the rightmost plot on the top row and then the CD45.1 vs. CD45.2 distribution is plotted according to the same scheme in the four plots below that.
(B) Quantification of the ratio of BLIMP1 KO to WT cells in each MBC subset normalized to the ratio of BLIMP1 KO and WT cells in the total B cell population. Data are from three independent experiments (n = 21). p values were determined by two-tailed paired t test. p values on each bar represent significance of testing the null hypothesis that the ratio is 1 (predicted value if no difference between KO and WT).
(C) Fluorescence-activated cell sorting analysis of MBC precursors in GCBCs based on CCR6 and CD38 expression levels from mixed BM chimera mice at day 12 after immunization with NP-CGG in alum. Representative flow plots and frequency of CCR6+CD38+ in BLIMP1 KO and WT GCBCs are shown. Data are from three independent experiments (n = 25). p value was determined by two-tailed paired t test.
By contrast, the CD80+ PD-L2+ (DP) MBC subset was enriched to some degree for BLIMP1-deficient cells (ratio of ∼1.7) (Figures 6A and 6B). While at first this result would seem to suggest that BLIMP1 might be a negative regulator for DP MBC development, in fact the degree of skewing is much less than the 4-5:1 ratio seen among GCBCs, which are the precursors of most DP MBCs.23–25 This suggests that BLIMP1-deficient GCBCs are less likely to differentiate into MBCs compared with their WT counterparts, despite their increased overall numbers due to greater GCBC expansion.
To further evaluate the concept that BLIMP1-deficient GCBCs are less likely to differentiate into MBCs, we used previously validated markers to examine MBC precursors (the CCR6hi CD38hi subset) directly within the (CD95+ BCL6+) GCBC population.11,26–28 As shown in Figure 6C, there was a decrease in these precursors among BLIMP1-deficient GCBCs compared with controls, supporting the conclusion that BLIMP1 is required for optimal differentiation of MBCs from GCBCs.
BLIMP1 signaling controls GCBC differentiation through regulating BCL6 and IRF4 expression
Previous studies conducted in cell lines and primary lymphocytes suggest that BCL6, IRF4, and BLIMP1 are involved in a linked regulatory network that in turn mediates lymphocyte development and differentiation.3,11,29,30 In model cell lines, high levels of BCL6 suppress PC differentiation by inhibiting BLIMP1.3 Downregulation of BCL6 and IRF4 upregulation in GCBCs is associated with their differentiation toward PCs (Figure S6A).11,29 In T cells, BLIMP1 antagonizes BCL6 to suppress T follicular helper cell differentiation.30 However, whether BLIMP1 is required to modulate BCL6 and IRF4 expression in GCBCs to impact fate choice is unknown. The BLIMP1 BM chimera system provided an opportunity to investigate this critical question by comparing WT and BLIMP1-deficient GCBCs from the same mice. In line with previous work,11,12,30 a small percentage of WT GCBCs expressed lower levels of BCL6, with some of them also expressing higher levels of IRF4, presumably reflecting commitment to PC fate (Figures 7A, 7B, and S6A). In contrast, and critically, only very few BLIMP1-deficient GCBCs had downregulated BCL6, with even fewer of these demonstrating increased IRF4 expression, resulting in markedly reduced percentages of BCL6lo IRF4lo and BCL6lo IRF4hi populations among BLIMP1-deficient GCBCs (Figures 7A and 7B). These effects were observed at both early and late GC time points (Figure 7B). Interestingly, we also found that BLIMP1 deficiency leads to higher basal levels of BCL6 expression in the BCL6hi GCBC population, as measured by BCL6 mean fluorescent intensity (Figure S6B), further suggesting that BLIMP1 can modulate BCL6 levels in GCBCs.
We previously found that culturing purified GCBCs with IL-21 and anti-CD40—but not with either reagent individually—promoted their differentiation toward a PC fate.11 This differentiation was reflected by the downregulation of BCL6 and upregulation of BLIMP1 and IRF4, but the cause-and-effect linkages within this potential TF network were undetermined. We hypothesized that BLIMP1 induction in GCBCs by these T cell-derived signals is an upstream event required for initiating this differentiation process. To test this, we isolated GCBCs from immunized Prdm1+/+ CD19Cre and Prdm1fl/fl CD19Cre mice and stimulated them for 48 h with either anti-CD40 or anti-CD40 combined with IL-21. Indeed, without BLIMP1, anti-CD40 plus IL-21 did not effectively downregulate BCL6 or induce IRF4 (Figure 7C). This result establishes an essential role of BLIMP1 in regulating GCBC fate commitment upstream of BCL6 and IRF4, in response to T cell-derived signals. Hence, GCBCs rely on BLIMP1 to enable reduction of BCL6 and subsequent increase of IRF4 expression during GCBC fate commitment.
DISCUSSION
It has long been known that BLIMP1 is essential for antibody forming cell development, but the role of BLIMP1 in GC biology, if any, has remained unclear. While mice with BLIMP1-deficient B cells developed larger GCs, this was attributed to more sustained antigenic stimulation due to lack of antibody that would clear antigen,5 a cell-extrinsic effect. Supporting a potential cell-intrinsic role in GC development were previous studies by us and others that detected BLIMP1 expression in a small subset of GCBCs.11,12 However, these studies were observational and unable to establish a definitive role for BLIMP1, as the expectation that BLIMP1+ GCBCs were specifically committed PC progenitors29,31 was not borne out.12
To address the GC-specific role of BLIMP1 and to focus on B cell-intrinsic effects, excluding antibody-mediated clearance of antigen as a mechanism, here we used a BLIMP1 BM chimera system. Via this present work, we identified multiple B cell-intrinsic functions of BLIMP1 in regulating the GC response. BLIMP1 interacts with fundamental GC-specific TF networks, since, in the absence of BLIMP1, GCBCs that naturally downregulate BCL6 were greatly reduced, while a subset of those that upregulate IRF4 was virtually absent. Critically, GCBCs lacking BLIMP1 failed to downregulate BCL6 in response to T cell-derived signals and did not generate BCL6lo IRF4hi GCBC in response to the combination of anti-CD40 and IL-21. Thus, BLIMP1 is upstream of the regulation of both BCL6 and IRF4.
BLIMP1-deficient GCBCs are markedly more competitive in the GC. Mechanistically, these cells are more likely to be in cell cycle and to express c-MYC, a known regulator of the extent of proliferation of GCBCs.14,15 Hence, BLIMP1 negatively regulates cell-cycle progression and c-MYC expression to limit GC expansion. BLIMP1 was previously reported as a negative regulator of c-MYC in transformed B cell lines,7 consistent with a direct effect of BLIMP1 on c-MYC in the GC. Phenotypically, BLIMP1-deficient B cells were more likely to reside in the DZ, the site of most GCBC proliferation,32 which is consistent with the differences in cell cycling and expansion. Such intriguing zonal redistribution may be a direct or an indirect effect of BLIMP1.
While BLIMP1 KO GCBCs expand and proliferate more, only in the IgM−/IgG− subset of GCBC does BLIMP1 deficiency also associate with increased affinity maturation and positive selection. This subset of GCBCs is present in the WT and in other contexts (in fact in all GCs that we have analyzed) but is expanded in absence of BLIMP1. These GCBCs express low levels of BCR and have a high frequency of non-productive VH1-72 BCRs and more V mutations. They may also harbor mutations that hinder BCR expression, such as in critical framework residues. Previous studies suggest that this IgM−/IgG− subset of GCBCs may carry random mutations that damage the BCR, leading to their negative selection.33,34 We speculate that, in the absence of BLIMP1, the negative selection of these GCBCs may be impaired, allowing them to persist in the GCs and accumulate additional V region mutations.
We previously reported that IL-21R signaling, which primarily activates STAT3 in GCBCs, can cooperate with CD40 signaling to drive BCL6 downregulation and enhance IRF4 expression in a subset of GCBCs, both in vitro and in vivo, indicative of PC lineage commitment.11 The current studies now reveal that both responses require BLIMP1, highlighting it as a TF that connects critical T cell-derived signals to instruction of GCBC differentiation. Notably, our findings indicate that the GCBC TF network involving these three TFs is reprogrammed, as previous studies working with B cell lines, primary non-GCBCs, as well as T cells, indicated that IRF4 acts upstream to induce BLIMP1 during cell differentiation,35–37 whereas, in GCBCs, IRF4 induction is downstream of BLIMP1. This different relationship of BLIMP1 and IRF4 in GCBC, compared with that seen in other cell types, could be due to high BCL6 expression in GCBC. It seems likely that BLIMP1 indirectly controls IRF4 in GCBCs by first downregulating BCL6, a known inhibitor of IRF4.38,39 However, it remains possible that BLIMP1 regulates IRF4 directly40 or through other BCL6-independent pathways. If so, then a positive feedback loop may ensue once IRF4 is expressed, in which IRF4 upregulates the expression of Prdm1, much as is the case in other cell types.35–37 In GCBC this, in turn, would result in BLIMP1-mediated further upregulation of IRF4, thus helping to establish the new differentiation state. This concept is consistent with reports that BLIMP1 can directly induce IRF4 in pre-plasmablasts as well as WEHI-231 cells.40
Initial signal-induced BLIMP1 expression and consequent BCL6 downregulation may create a temporary state of plasticity in GCBCs that could also promote MBC differentiation. Although GC-derived MBCs were actually increased in BLIMP1-deficient B cells, the 1.7-fold increase was markedly less than what would have been expected given the 4- to 5-fold increase of BLIMP1-deficient GCBCs, which are MBC precursors. Furthermore, and most directly telling, among the GCBCs themselves, MBC phenotypic precursors were less frequent among BLIMP1-deficient cells. Together, these data suggest that BLIMP1-deficient GCBCs are in fact inefficient in spawning MBC progeny. This arrangement is reminiscent of the effects of BLIMP1 on CD8 T cell memory generation.41,42 We previously found that the addition of BCR signals to CD40 and IL-21R signals could favor differentiation of GCBCs cultured in vitro toward MBCs11; these combined signals also upregulate BLIMP1 and downregulate BCL6, but are much less effective in inducing IRF4. Instead, they promote CCR6 and CD38 expression, consistent with MBC differentiation. Hence, GC-derived MBCs may come from GCBCs that downregulate BCL6 in a BLIMP1-dependent manner, but that do not upregulate IRF4.11 Notably, there is a considerable population with this BCL6lo IRF4lo phenotype among native GCBCs.11,12
The positive selection signals via IL-21R and CD40, which we show here function to upregulate BLIMP1 in GCBCs, are thought to be delivered by T cells in the LZ. Our data suggest that, normally, upregulation of BLIMP1 may delay or prevent positively selected cells from expressing maximal c-MYC (also typically found in LZ GCBCs) and transiting to the DZ, where the effects of prior c-MYC expression lead proportionately to proliferation.43 We speculate that a fraction of the GCBCs that do induce BLIMP1 downstream of T cell-derived signals would differentiate into PC precursors (expressing IRF4) or MBC precursors, and may leave the GC from the LZ stage, a site that has been proposed for such differentiation.13,29,44 In the absence of BLIMP1, GCBCs would instead transit more quickly to the DZ and express more c-MYC. This would explain the DZ enlargement, higher c-MYC levels, and greater proportion of cells in S-phase seen among BLIMP1-deficient GCBCs. This regulatory circuit may also help to explain why BLIMP1 inactivation is associated with some diffuse large B cell lymphomas, some of which may derive from GC precursors and not BLIMP1-expressing pre-PCs.9,10
Together, the studies presented here illuminate novel roles of BLIMP1 in regulating GC positive selection, expansion, and zonal localization. Further, they connect these downstream effects of BLIMP1 to key T cell-derived signals, thus providing a more complete picture of the molecular and signaling mechanisms that underlie the cyclic events in the GC that control both selection and differentiation.
Limitations of the study
Our study raises additional questions about the molecular mechanisms by which BLIMP1 regulates GCBCs and the outcomes of BLIMP1 upregulation in the GC. These studies were unable to distinguish between the direct and indirect effects of BLIMP1 on GCBC transcriptional programming and fate decisions. In addition, we did not directly track the fate in vivo of GCBCs that had upregulated BLIMP1. These questions require additional technical approaches to better resolve.
RESOURCE AVAILABILITY
Lead contact
Further information and requests for resources and reagents should be directed to and will be fulfilled by the lead contact, Mark Shlomchik (mshlomch@pitt.edu)
Materials availability
The materials and reagents generated from this study are available from the lead contact upon request.
Data and code availability
RNA-seq data generated in this study have been deposited in the National Center for Biotechnology Information Gene Expression Omnibus database under accession codes GSE249811 (Bulk RNA-seq), GSE299594 (scRNA-seq) and the mouse IgH sequencing data have been deposited in the GenBank SRA under project number PRJNA1251130. Processed data will be made available via the AIRR Data Commons upon publication.
STAR★METHODS
EXPERIMENTAL MODEL AND SUBJECT PARTICIPANT DETAILS
Mouse models
B1-8i knock-in (“B1-8i”) mice were previously described45,68 and maintained on the B6 background, except Figure S1B was performed with B1-8i on a BALB/c background (7–12 week old females). Mice with both B1-8i and Vκ8R46 alleles on a CD45.1/2 background were used as recipient mice. Mice harboring Prdm1fl/fl (Strain #:008100), Cd19-Cre (Strain #:006785) and CD45.1 alleles (Strain#:002014) were originally purchased from Jackson Laboratory.
Mice were maintained under specific-pathogen-free conditions and all experiments were approved and supervised by the University of Pittsburgh Institutional Animal Care and Use Committee. For immunizations, mice were given intraperitoneally injections of 50 μg 4-hydroxy-3-nitrophenylacetyl-chicken gamma globulin (NP-CGG) precipitated in Alum.
For creation of bone marrow chimera mice, bone marrow was harvested under sterile conditions from age matched 5–8 week old female Prdm1fl/fl CD19Cre/+ CD45.2 C57BL/6 and Prdm1+/+ CD19Cre/+ CD45.1 C57BL/6 mice. Recipient B1-8i+/− Vk8R+/− CD45.1/CD45.2 C57BL/6 mice, ages 8–10 weeks (both males and females), were treated with a single dose of 900 RAD cesium irradiation. Recipient mice were rested for at least 1 h post irradiation and 8 million donor bone marrow cells, mixed 50/50, were transferred i.v. via tail vein. Six weeks post transfer, recipients were immunized with NP-CGG in alum i.p. and analyzed days 7, 12, and week 8 post immunization. For days 0, 4, 5, and 12 (histology) mice were immunized with NP-CGG in alum i.p. 12–18 weeks post transfer.
METHOD DETAILS
Cell preparation and flow cytometry
Spleens were disrupted by gently crushing between frosted glass slides in “Stem Cell Buffer” (SCB; 1x PBS-2% Fetalplex (Gemini Bio)-2mM EDTA) and cells were filtered through 100μm nylon filter (Corning). Erythrocyte lysis was achieved by resuspending spleen pellets in 2mL ACK (Lonza), incubating for 1 min, and quenching with SCB. Cell counts were determined by DeNovix Cell Drop Cell Counter (DeNovix) with Acridine Orange-Propidium Iodide (AO-PI) dual staining or counted by hand using hemocytometer and Trypan Blue (Gibco).
After erythrocyte depletion, cells were stained for viability with either Zombie NIR Fixable Viability kit (BioLegend) or Ghost Dye Violet 510 (Tonbo Biosciences) for 20 min on ice in 1x PBS-2mM EDTA. After washing out viability dye, cells were blocked with Fc receptor antibody anti-CD16/32 (clone: 2.4G2, prepared in the lab) for 5 min on ice prior to staining with fluorochrome conjugated antibodies for 20 min on ice in FACS staining buffer (1x PBS, 3% Bovine Serum, 1mM EDTA, 0.02% Sodium Azide): anti-CD95 (clone: Jo2, BD Biosciences), anti-B220 (clone: RA3-6B2, BioLegend), anti-CD38 (clone: 90, BioLegend or produced and conjugated in our laboratory), anti-CD44 (clone: IM7, BioLegend), anti-CD138 (clone: 281-2; BioLegend), anti-CCR6 (clone: 29-2L17; BioLegend), anti-IgM (goat polyclonal, Jackson ImmunoResearch or Southern Biotech), anti-IgM (clone: B7-6; conjugated in our laboratory), anti-IgG1 (clone: A85-1; BD Biosciences), anti-IgG (goat polyclonal; Southern Biotech), anti-IgE (clone: RME-1; BioLegend), anti-IgA (clone: C10-1; BD Biosciences), anti-CD45.1 (clone: A20; Thermo Fisher Scientific or produced and conjugated in our laboratory), anti-CD45.2 (clone: 104; BD Horizon or produced and conjugated in our laboratory), NIP (NIP-OSu from LGC Biosearch Technologies; conjugated in our laboratory), anti-CD80 (clone: 16-10A1; BD Biosciences), anti-PDL2 (clone: TY25; BioLegend). If biotinylated antibodies were used, cells were stained with SA (BD Biosciences) for 20 min on ice after washing out biotinylated antibody. After washing out surface stain, cells were fixed with 1% paraformaldehyde (PFA) for 20 min on ice.
For intracellular staining, cells were fixed and permeabilized in saponin-based Perm/Wash buffer (Cat#: 554732, BD Biosciences) supplemented with 1.5% PFA for 15 min at room temperature followed by 30 min on ice. Cells were then stained for 1 h on ice in Perm/Wash buffer with the following antibodies: anti-CD95 (clone: Jo2, BD Biosciences), anti-B220 (clone: RA3-6B2, BioLegend), anti-CXCR4 (clone: L276F12, BioLegend), anti-CD86 (clone: GL1, BioLegend), anti-CD38 (clone: 90, BioLegend or produced and conjugated in our laboratory), anti-IgM (goat polyclonal, Jackson ImmunoResearch), anti-IgG1 (clone: A85-1; BD Biosciences), anti-CD45.1 (clone: A20; Thermo Fisher Scientific), anti-CD45.2 (clone: 104; BD Biosciences or produced and conjugated in our lab-oratory), NIP (NIP-OSu from LGC Biosearch Technologies; conjugated in our laboratory), anti-CD44 (clone: IM7, BioLegend), anti-CD138 (clone: 281-2; BD Biosciences). If using biotinylated antibodies, after washing out biotinylated antibodies, cells were incubated for 20 min on ice with SA (BD Biosciences) in Perm/Wash buffer.
For transcription factor staining, cells were fixed with 1.5% PFA for 15 min at room temperature and then permeabilized in FACS staining buffer containing 0.1% Triton X-100 for 15 min at room temperature. Cells were then stained for 1 h on ice in 1x PBS-2mM EDTA with the following fluorochrome conjugated antibodies: c-MYC (clone: D84C12, Cell Signaling Technology), anti-IRF4 (clone: 3E4, Thermo Fisher Scientific), anti-CCR6 (clone: 29-2L17; BioLegend), anti-Bcl6 (clone: K112-91; BD Biosciences). To maximize CCR6 staining, anti-CCR6 antibody was added in both surface and intracellular antibody mixes. If using biotinylated antibodies, after washing out biotinylated antibodies, cells were incubated for 20 min on ice with SA (BD Biosciences) in 1x PBS-2mM EDTA.
Stained cells were analyzed on an BD LSRII or Cytek Aurora. Data were analyzed with FlowJo 10 software. GCBC were gated as B220+ CD95+ CD38− or B220+ CD95+ PNA+ cells.
Ex vivo stimulation and flow cytometry for differentiation
Prdm1fl/fl CD19Cre/+ CD45.2 C57BL/6 (7–9 week old males or 8–9 week old females) and Prdm1+/+ CD19Cre/+ CD45.1 C57BL/6 (6–11 week old males or 8–9 week old females) mice were immunized with NP-CGG in alum. For GCBC enrichment, splenocytes were pooled from Prdm1fl/fl CD19Cre/+ CD45.2 C57BL/6 and, separately, Prdm1+/+ CD19Cre/+ CD45.1 C57BL/6 mice day 12 post NP-CGG immunization and processed as described above. After erythrocyte depletion, splenocytes were incubated with rat serum (Equitech-Bio, Inc.) and Fc receptor antibody anti-CD16/32 (clone: 2.4G2, prepared in the lab) in SCB for 5 min on ice followed by addition of biotinylated antibody cocktail containing anti-CD43, anti-CD4, anti-CD8, anti-CD11b, anti-CD11c, anti-Gr-1, and anti-CD138. The biotin conjugated antibody cocktail was incubated with cells for 15 min on ice before washing cells thoroughly with SCB. Cells were then resuspended in SCB containing IMag Streptavidin Particles Plus (Becton Dickinson) and negative magnetic separation was performed with EasySep Magnets (Stemcell Technologies). Purified B cells were then stained for 20 min on ice in SCB with anti-B220 (clone: RA3-6B2; BD Biosciences) and anti-CD38 (clone: 90; produced and conjugated in our lab) and a small portion of cells were also stained with anti-CD95 (clone: Jo2; BD Biosciences) and then GCBC were sorted on BD FACSAria. GCBC stained directly with anti-CD95 die in 48h culture, so, in order to sort GCBC, cells stained with anti-B220, anti-CD38, anti-CD95, and 7-AAD (Tonbo Biosciences) were used to set a gate to capture GCBC, while the samples used for sorting were only stained with anti-B220, anti-CD38, and 7AAD. Sorted GCBC were warmed to 37°C with 5% CO2 in B cell medium (RPMI 1640 medium supplemented with 10% FBS, HEPES, penicillin/streptomycin, glutaMAX, and 50μM 2-mercaptoethanol) for 15–30 min and stimulated with 2.5μg/mL anti-CD40 antibody (clone: FGK45) with 10ng/mL IL21 (Peptrotech). To prepare anti-CD40 for stimulation, biotinylated anti-CD40 antibody was pre-incubated with streptavidin (Millipore-Sigma) at 5:1 molecular ratio, and then used at 2.5μg/mL for stimulation. Endotoxin was removed from antibodies used for stimulation with the ToxinEraser Endotoxin Removal Kit (GenScript), and endotoxin levels were tested with ToxinSensor Chromogenic LAL Endotoxin Assay Kit (Genscript; endotoxin <0.5EU/mL).
After 48 h of culture, cells were washed with 1x PBS-2mM EDTA and stained for viability with Ghost Dye Violet 510 (Tonbo Biosciences) for 5 min on ice in 1x PBS-2mM EDTA. Following washing out of the viability dye, cells were blocked with Fc receptor anti-body anti-CD16/32 (clone: 2.4G2, prepared in the lab) for 5 min on ice prior to staining with fluorochrome conjugated antibodies in FACS staining buffer: anti-B220 (clone: RA3-6B2, BD Horizon), PNA (Peanut Agglutinin from Vector Laboratories; conjugated in our laboratory), CD38 (clone: 90, BioLegend), anti-CD44 (clone: IM7, BioLegend), anti-CD138 (clone: 281-2; BioLegend), and anti-CCR6 (clone: 29-2L17; BioLegend). After washing out surface stain, cells were fixed with 1.5% PFA for 15 min at room temperature and then permeabilized in FACS staining buffer containing 0.1% Triton X-100 for 15 min at room temperature. Cells were then stained for 1 h on ice in 1x PBS-2mM EDTA with the following fluorochrome conjugated antibodies: anti-IRF4 (clone: 3E4, Invitrogen), anti-CCR6 (clone: 29-2L17; BioLegend), anti-Bcl6 (clone: K112-91; BD Biosciences), anti-BLIMP1 (clone: 5E7; BioLegend), anti-IgM (goat polyclonal, Jackson ImmunoResearch). To maximize CCR6 staining, anti-CCR6 antibody was added in both surface and intracellular antibody mixes. Stained cells were analyzed on a Cytek Aurora. Data were analyzed with FlowJo 10 software.
Ex vivo stimulation and flow cytometry for c-MYC
Prdm1fl/fl CD19Cre/+ CD45.2 C57BL/6 (10–12 week old females) and Prdm1+/+ CD19Cre/+ CD45.1 C57BL/6 (8–11 week old females) mice were immunized with NP-CGG in alum. Splenocytes were pooled from Prdm1fl/fl CD19Cre/+ CD45.2 C57BL/6 and, separately, Prdm1+/+ CD19Cre/+ CD45.1 C57BL/6 mice day 12 post NP-CGG immunization and B cells were purified as described above. Purified B cells were stimulated for 2 h, as indicated, with 2.5μg/mL anti-CD40 antibody (clone: FGK45), 10ng/mL IL21 (Peptrotech), and/or 200ng/mL NP-Ficoll FITC (LGC Biosearch Technologies). To prepare anti-CD40 for stimulation, biotinylated anti-CD40 antibody was pre-incubated with streptavidin (Millipore-Sigma) at 5:1 molecular ratio, and then used at 2.5μg/mL for stimulation. Endotoxin was removed from antibodies used for stimulation with the ToxinEraser Endotoxin Removal Kit (GenScript), and endotoxin levels were tested with ToxinSensor Chromogenic LAL Endotoxin Assay Kit (Genscript; endotoxin <0.5EU/mL). After 2 h, cells were washed with 1x PBS-2mM EDTA and stained for viability with Ghost Dye Violet 510 (Tonbo Biosciences) for 5 min on ice in 1x PBS-2mM EDTA. Following washing out of the viability dye, cells were blocked with Fc receptor antibody anti-CD16/32 (clone: 2.4G2, prepared in the lab) for 5 min on ice prior to staining with fluorochrome conjugated antibodies in FACS staining buffer: anti-B220 (clone: RA3-6B2, BD Biosciences), anti-CD95 (clone: Jo2; BD Biosciences), anti-CD38 (clone: 90, BioLegend), anti-CD86 (clone: GL-1, BioLegend), anti-CXCR4 (clone: L276F12, BioLegend). After washing out surface stain, cells were fixed with 1.5% PFA for 15 min at room temperature and then permeabilized in FACS staining buffer containing 0.1% Triton X-100 for 15 min at room temperature. Cells were then stained for 1 h on ice in 1x PBS-2mM EDTA with the following fluorochrome conjugated antibodies: anti-IRF4 (clone: 3E4, Invitrogen), anti-Bcl6 (clone: K112-91; BD Biosciences), anti-lambda (goat polyclonal, unconjugated from Southern Biotech and conjugated in lab), c-Myc (E5Q6W, Cell Signaling Technology). After washing out intracellular stain, cells were incubated for 30 min with an anti-rabbit IgG (donkey polyclonal, BioLegend) secondary antibody for the c-Myc. Stained cells were analyzed on a Cytek Aurora. Data were analyzed with FlowJo 10 software.
Cell-cycle analysis
Day 12 post NP-CGG in alum immunization bone marrow chimera mice were treated with 0.4mg 5-ethynyl-2′-deoxyuridine (EdU) dissolved in PBS i.v. via tail vein 1 h before harvesting spleens. Splenocytes were processed as previously described. Splenocytes were stained for viability with Zombie NIR Fixable Viability kit (BioLegend) for 5 min on ice in 1x PBS-2mM EDTA. After washing out viability dye, cells were blocked with Fc receptor antibody anti-CD16/32 (clone: 2.4G2, prepared in the lab) for 5 min on ice prior to staining with fluorochrome conjugated antibodies for 20 min on ice in SCB: anti-B220 (clone: RA3-6B2, BioLegend), anti-CD95 (clone: Jo2, BD Biosciences), anti-CD38 (clone: 90, BioLegend), anti-IgM (goat polyclonal, Jackson ImmunoResearch), anti-CD45.1 (clone: A20; Thermo Fisher Scientific), and anti-CD45.2 (clone: 104; produced and conjugated in our laboratory). After surface staining, cells were fixed and EdU detected in accordance with the Click-iT Plus EdU Alexa Fluor 488 Flow Cytometry Assay Kit (catalog #C10632; Thermo Fisher Scientific). To evaluate cell cycle analysis, cells were stained with DAPI (Thermo Fisher Scientific) for 5 min prior to running on Cytek Aurora. Data were analyzed with FlowJo 10 software.
Cleaved caspase 3 staining
Splenocytes from day 12 post NP-CGG in alum immunization bone marrow chimera mice were processed as previously described. Splenocytes were stained for viability with Zombie NIR Fixable Viability kit (BioLegend) for 5 min on ice in 1x PBS-2mM EDTA. After washing out viability dye, cells were blocked with Fc receptor antibody anti-CD16/32 (clone: 2.4G2, prepared in the lab) for 5 min on ice prior to staining with fluorochrome conjugated antibodies for 20 min on ice in FACS staining buffer: anti-B220 (clone: RA3-6B2, BD Biosciences), anti-CD95 (clone: Jo2, BD Biosciences), anti-CD38 (clone: 90, BioLegend), anti-IgM (goat polyclonal, Jackson ImmunoResearch), anti-IgG1 (clone: A85-1; BD Biosciences), anti-CD45.1 (clone: A20; Thermo Fisher Scientific), and anti-CD45.2 (clone: 104; produced and conjugated in our laboratory), NIP (NIP-OSu from LGC Biosearch Technologies; conjugated in our laboratory), anti-CXCR4 (clone: L276F12, BioLegend), anti-CD86 (clone: GL1, BioLegend). After washing out surface stain, cells were fixed with 5% formalin in PBS for 1 h on ice. Cells were then stained with Cleaved Caspase-3 (Asp175; Cell Signaling Technology) in FoxP3 Permeabilization Buffer (eBioscience Foxp3/Transcription Factor Staining Buffer Set; Cat#: 00-5523-00; Thermo Fisher Scientific) overnight at 4°C. Stained cells were analyzed on a Cytek Aurora. Data were analyzed with FlowJo 10 software.
QUANTIFICATION AND STATISTICAL ANALYSIS
Statistical analysis was performed with Prism software (GraphPad Software). For comparing two groups, p-values were determined using Student’s t-tests (two-tailed). Differences between groups were considered significant for p-values <0.05.
Immunofluorescent histology and analysis
OCT-embedded spleen biopsies from 3 bone marrow chimeric mice day 12 post NP-CGG in alum immunization were sectioned in a cryostat microtome and fixed in cold acetone for half an hour. The slides were rehydrated in 1x PBS for 20 min, then blocked with 10% rat serum (Equitech-Bio, Inc.) in Histology Staining Buffer (1x PBS, 1% BSA, 0.1% Tween 20, and 0.05% sodium azide) for 20 min in a dark, humid chamber. Slides were stained with anti-CD45.1 (clone: A20; conjugated in our laboratory), anti-CD45.2 (clone: 104; conjugated in our laboratory), PNA (Peanut Agglutinin from Vector Laboratories; conjugated in our laboratory), and anti-IgD (clone: 11-26c.2a; BioLegend) in blocking buffer for 1 h. Slides were washed with Histology Staining Buffer followed by a 1x PBS only wash. Slides were then allowed to slightly dry in a dark, dry chamber before being sealed with Fluoromount-G Mounting Medium (Thermo Fisher Scientific) and a coverslip, which was allowed to cure overnight and affixed with transparent nail polish.
The sections were imaged on an IX-83 Olympus Inverted Fluorescence Microscope. The images were processed in cellSens. Data from the collected fluorescence channels was measured in ImageJ.
Bulk RNAseq
Purified B cells, as previously described, from 3 bone marrow chimeric mice day 12 post NP-CGG in alum immunization were stained with anti-B220 (clone: RA3-6B2; BD Bioscience), anti-CD38 (clone: 90; conjugated in our laboratory), anti-CD95 (clone: Jo2, BD Biosciences), anti-CD45.1 (clone: A20; conjugated in our laboratory), and anti-CD45.2 (clone: 104; conjugated in our laboratory) in SCB. 7AAD (Tonbo Biosciences) was added for live/dead discrimination prior to sorting BLIMP1 KO and WT GCBCs on BD FACSAria. Cells were washed with 1x PBS and resuspended in 350uL RLT Plus Buffer (Qiagen) with 1% 2-Me and frozen at −80°C. RNA purification was performed using the RNeasy Micro Plus Kit (Qiagen). Libraries were generated using the SMART-Seq v4 Ultra Low Input RNA kit (Takara Bio) followed by Nextera FLEX using UDI set B indexes (Illumina). Samples were sequenced using an Illumina NestSeq 2000 and P3 flowcells to obtain 20M 2 × 101-bp reads, and aligned to the mm10 genome using the STAR aligner.63 Gene-level counts were determined using featureCounts (version v2.0.1),64 and raw counts were quantile normalized to each other for differential expression using the voom method69 in the Limma (version 3.52.2) R package.65 For normalization of the datasets, the Quantile method was used. All gene-set enrichments were performed using the rankSumTestWithCorrelation function in Limma, which explicitly corrects for correlation among genes in the gene set being interrogated. Transcription factor motif enrichment was performed using TRANSFAC database (accessed from enrichR).22 The Reactome database was utilized to perform pathway enrichment analysis. Heatmap, volcano plot and bubble plots were built using ggplot2 (version 3.2.1) in R (version 3.6.1). All RNA-seq data are deposited in the NCBI’s Gene Expression Omnibus database (GEO) with accession ID GSE249811.
scRNAseq
Purified B cells, as previously described, from 3 bone marrow chimeric mice day 12 post NP-CGG in alum immunization were stained with anti-CD19 (clone: eBio1D3; Thermo Fisher Scientific), anti-CD38 (clone: 90; conjugated in our laboratory), anti-CD95 (clone: Jo2, BD Biosciences), anti-CD45.1 (clone: A20; conjugated in our laboratory), and anti-CD45.2 (clone: 104; conjugated in our laboratory) in SCB. 7AAD (Tonbo Biosciences) was added for live/dead discrimination prior to sorting BLIMP1 KO and WT GCBCs on BD FACSAria. Sorted KO and WT GCBC were stained with Mouse TotalSeq-C hashtags (for CD45+ cells) following the “Feature Barcode” instructions from the manufacturer. Hashtagged samples were counted and pooled at equal ratios and subjected to 10x Genomics run. Resulting libraries were pooled and sequenced using Pitt Center for Advanced Genomics Single Cell Core in Pittsburgh, PA.
Single cell data was analyzed as discussed in our previous paper.11 Briefly, Cell Ranger pipeline (v7.1.0, 10X Genomics) “count” was used to align reads to the mm10 reference genome, and generate mRNA transcript and HTO unique molecular identifier (UMI) quantification tables. Downstream analysis was performed using the raw barcode matrix files generated from Cell Ranger pipeline using the Seurat package (v4.0.0) https://github.com/satijalab/seurat in R (v3.4.3).
Cells from six hash-tagged groups were analyzed, representing the BLIMP1 KO and WT samples (n = 3). For initial quality control, we filtered out cells that expressed less than 200 genes, cells with >10% mitochondrial genes. The HTO tables were added to the dataset and normalized by a centered-log ratio (CLR) method using the Seurat “NormalizeData” function and “MULTIseqDemux” function was used to determine if each GEM contained a single cell. Resulting 14,812 singlet cells were taken further for analysis and clustering (doublets and negative cells were removed from further analysis).
Gene expression values for each cell were log-normalized and scaled by a factor of 10,000. UMI, mitochondrial content, hemoglobulin gene and ribosomal gene content scores were “regressed-out” using Seurat’s “ScaleData” function. Variable genes were detected using the “mean.var.plot” method in “FindVariableFeatures” function with default cutoff and data divided into 20 bins. ElbowPlot was used to assess the first 50 principal components and first 25 were found to contribute significantly, thus used for clustering analysis. In order to identify distinct groups of cells; unsupervised clustering was performed using the “FindClusters” function by testing different resolution (“res”) parameter, ranging from 0.1 to 2 in increments of 0.1 to assess how individual cells are distributed into clusters over a range of resolutions (data not shown). Cell clusters were visualized using UMAP dimensional reduction plots.
The “FindAllMarkers” function with default settings was utilized to find DEGs in each cluster, in comparison to all other clusters, using the Wilcoxon Rank-Sum test with genes detected in a minimum of 10% of cells, a minimum of 0.25 average log-fold change, and a minimum of 0.01 Bonferroni-adjusted p-value.
All scRNA-seq data are deposited in the NCBI’s Gene Expression Omnibus database (GEO) with accession ID GSE299594.
For comparing BLIMP1+ and BLIMP1-ex vivo stimulated GCBC, reanalysis of scRNAseq (GSE197661) from our prior publication11 were performed.
BCR sequencing and analysis
Library preparation and sequencing
Splenocytes were processed, as previously described, from 3 bone marrow chimeric mice day 12 post NP-CGG in alum immunization and stained with anti-B220 (clone: RA3-6B2; BD Biosciences), anti-CD38 (clone: 90; conjugated in our laboratory), anti-CD95 (clone: Jo2, BD Biosciences), anti-CD45.1 (clone: A20; Tonbo Biosciences), anti-CD45.2 (clone: 104; Thermo Fisher Scientific), anti-IgG (goat polyclonal; Southern Biotech), and anti-IgM (clone: B7-6; produced and conjugated in our laboratory). 7AAD (Tonbo Biosciences) was added for live/dead discrimination prior to sorting. KO and WT IgM+, IgG+, and IgM−IgG- GCBCs were sorted individually, washed with 1xPBS, and resuspended in Modified Donghuis buffer (50mM Tris, 50mM KCl, 0.63mM EDTA, 0.22% Igepal, 0.22% Tween 20) with proteinase K (0.8mg/mL; Bioline) and lysed overnight in 55°C waterbath. Proteinase K was heat inactivated at 95°C on heat block for 10 min and lysates were frozen at −80°C
2 μL of the cell lysate was used directly for mouse IgH library construction. The cell input per replicate and the number of replicates performed for each sample are recorded in Table S1. To capture full-length NP specific VH1-72/JH2 rearrangements, the forward primer was designed at the leader region, approximately 100 nucleotides upstream of FR1 of VH1-72, and the reverse primer was designed at the end of the JH2 gene. Primers were modified to include adaptor sequences from the Illumina Nextera XT kit for next generation sequencing (NGS), and two versions of both the forward and reverse primers were designed to be staggered, allowing for sequence phasing during the NGS run. The primer sequences are:
NexteraR2-Mus-J558.75.
GTCTCGTGGGCTCGGAGATGTGTATAAGAGACAGTTCTTGGCAGCAACAGCTAC.
NexteraR2-Mus-J558.75-1N.
GTCTCGTGGGCTCGGAGATGTGTATAAGAGACAGNTTCTTGGCAGCAACAGCTAC.
NexteraR1-Mus-JH2.
TCGTCGGCAGCGTCAGATGTGTATAAGAGACAGTGAGGAGACTGTGAGAGTGG.
NexteraR1-Mus-JH2-1N.
TCGTCGGCAGCGTCAGATGTGTATAAGAGACAGNTGAGGAGACTGTGAGAGTGG.
The VH and JH primer mixes were used at 0.6 μM in a reaction volume of 25 μL using a Multiplex PCR kit (Qiagen, Cat. No. 206143) and amplified as follows: initial denaturation at 95°C for 10 min; 35 cycles of 95°C for 45 s, 59°C for 45 s, and 72°C for 90 s; followed by a final extension step at 72°C for 10 min.
Amplicons were purified, and the second round of Illumina barcoding was performed as previously described.70 Libraries were sequenced at the Human Immunology Core Facility at the University of Pennsylvania using the 600-cycle Illumina MiSeq Reagent Kit (Illumina Inc., Cat. No. MS-102-3003).
Data QC
Raw sequence data (fastq files) were paired and quality controlled using pRESTO version 0.6.0,48 with the following parameters:
FilterSeq.py quality -s *assemble-pass.fastq -q 30.
FilterSeq.py trimqual -s *quality-pass.fastq -q 30 -win 20.
FilterSeq.py length -s *trimqual-pass.fastq -n 100.
FilterSeq.py maskqual -s *length-pass.fastq -q 30.
FilterSeq.py missing -s *maskqual-pass.fastq -n 10.
Data analysis
Processed repertoires were annotated using IgBlast71 with the mouse IMGT reference set. Replicates from individual mice were merged into unified repertoires and analyzed using a custom R script. Annotated sequences were first filtered to retain VH1-72/JH2 rearrangements. To ensure sufficient coverage of the V and J gene segments, sequences were further filtered to include only those with a V-germline start position <9 and a J-germline end position ≥40.
Duplicate sequences were collapsed using Alakazam49 (v1.3.0) and the duplication count of each unique sequence was recorded. Only sequences with a duplication count ≥5 were retained. Somatic hypermutation was assessed by aligning sequences to a VH1-72 reference germline, and the number of nucleotide mismatches was used to quantify mutation levels.
Clonal relationships were inferred by grouping sequences with similar CDR3 regions using single-linkage hierarchical clustering, applying a distance threshold of one nucleotide mismatch. Within each clone, the most abundant sequence defined as the one with the highest duplication count was selected as the representative. These representative sequences were then used to calculate the frequency of leucine at position 33 (IMGT numbering) and to perform selection analysis. Selection pressure was assessed using the focus test from BASELINe,17 as implemented in SHazaM49 (v1.2.0).
Supplementary Material
Supplemental information can be found online at https://doi.org/10.1016/j.celrep.2025.115977.
KEY RESOURCES TABLE
| REAGENT or RESOURCE | SOURCE | IDENTIFIER |
|---|---|---|
| Antibodies | ||
|
| ||
| Rat anti-Mouse CD16/CD32 (for blocking Fc receptor) (clone: 2.4G2) | Prepared in the lab | N/A |
| Mouse anti-Mouse CD45.1 (clone: A20) PE conjugate | Tonbo Biosciences | Cat# 50–0453-U100; RRID: AB_2621765 |
| Mouse anti-Mouse CD45.1 (clone: A20) APC-eFluor 780 conjugate | Thermo Fisher Scientific | Cat# 47–0453-82; RRID: AB_1582228 |
| Mouse anti-Mouse CD45.1 (clone: A20) Alexa Fluor 647 conjugate | Prepared in the lab | N/A |
| Mouse anti-Mouse CD45.2 (clone: 104) Brilliant Ultra Violet 496 conjugate | BD Biosciences | Cat#; 741092 RRID: AB_2870691 |
| Mouse anti-Mouse CD45.20 (clone: 104) Brilliant Violet 605 conjugate | BD Biosciences | Cat# 563051; RRID: AB_2737974 |
| Mouse anti-Mouse CD45.2 (clone: 104) APC-eFluor 780 conjugate | Thermo Fisher Scientific | Cat# 47–0454-82; RRID: AB_1272175 |
| Mouse anti-Mouse CD45.2 (clone: 104) Alexa Fluor 488 conjugate | Prepared in the lab | N/A |
| Mouse anti-Mouse CD45.2 (clone: 104) Alexa Fluor 647 conjugate | Prepared in the lab | N/A |
| Rabbit anti-Mouse c-Myc (clone: D84C12) Alexa Fluor 488 conjugate | Cell Signaling Technology | Cat# 12855S; RRID: AB_2798045 |
| Rabbit anti-Mouse c-Myc (clone: E5Q6W) | Cell Signaling Technology | Cat# 18583; RRID: AB_2895543 |
| Rabbit anti-Mouse phospho-S6 (Ser235/236) (clone: D57.2.2E) PE conjugate | Cell Signaling Technology | Cat# 5316S; RRID: AB_10694989 |
| Mouse anti-Mouse Bcl6 (clone: K112–91) Alexa Fluor 647 conjugate | BD Biosciences | Cat# 561525; RRID: AB_10898007 |
| Mouse anti-Mouse Bcl6 (clone: K112–91) PE-Cy7 conjugate | BD Biosciences | Cat# 563582; RRID: AB_2738292 |
| Rat anti-Mouse B220 (clone: RA3–6B2) PerCP-Cy5.5 conjugate | BD Biosciences | Cat# 561101; RRID: AB_10565970 |
| Rat anti-Mouse B220 (clone: RA3–6B2) BUV395 conjugate | BD Biosciences | Cat# 563793; RRID: AB_2738427 |
| Armenian hamster anti-Mouse CD95 (clone: Jo2) PE-Cy7 conjugate | BD Biosciences | Cat# 557653; RRID: AB_396768 |
| Armenian hamster anti-Mouse CD95 (clone: Jo2) Biotin conjugate | BD Biosciences | Cat# 554256; RRID: AB_395328 |
| Rat anti-Mouse CD38 (clone: 90) Pacific Blue conjugate | Prepared in the lab | N/A |
| Rat anti-Mouse CD38 (clone: 90) Biotin conjugate | Prepared in the lab | N/A |
| Rat anti-Mouse CD38 (clone: 90) Alexa Fluor 594 conjugate | Prepared in the lab | N/A |
| Rat anti-Mouse CD38 (clone: 90) PE | BioLegend | Cat# 102708; RRID: AB_312929 |
| Rat anti-Mouse CD38 (clone: 90) PerCP-Cy5.5 | BioLegend | Cat# 102722; RRID: AB_2563333 |
| Rat anti-Mouse CD38 (clone: 90) APC-Cyanine7 conjugate | BioLegend | Cat#; 102728 RRID: AB_2616968 |
| Rat anti-Mouse CXCR4 (clone: L276F12) BV421 conjugate | BioLegend | Cat# 146511; RRID: AB_2562788 |
| Rat anti-Mouse CD86 (clone: GL-1) Brilliant Violet 605 conjugate | BioLegend | Cat# 105037; RRID: AB_11204429 |
| Rat anti-Mouse CD86 (clone: GL-1) Brilliant Violet 650 conjugate | BioLegend | Cat# 105036; RRID: AB_2686973 |
| Rat anti-Mouse CD138 (clone: 281–2) Brilliant Violet 605 conjugate | BD Biosciences | Cat# 563147; RRID: AB_2721029 |
| Rat anti-Mouse CD138 (clone: 281–2) PE conjugate | BioLegend | Cat# 142504; RRID: AB_10916119 |
| Rat anti-Mouse CD138 (clone: 281–2) Biotin conjugate | BD Biosciences | Cat# 553713; RRID: AB_394999 |
| Rat anti-Mouse CD44 (clone: IM7) APC-Cyanine7 conjugate | BioLegend | Cat# 103027; RRID: AB_830784 |
| Rat anti-Mouse CD44 (clone: IM7) Brilliant Violet 711 conjugate | BioLegend | Cat# 103057; RRID: AB_2564214 |
| Rat anti-Mouse IRF4 (clone: 3E4) PE-eFluor610 conjugate | Thermo Fisher Scientific | Cat# 61–9858-82; RRID: AB_2637108 |
| Armenian Hamster anti-Mouse CCR6 (clone: 29–2L17) Brilliant Violet 421 conjugate | BioLegend | Cat# 129817; RRID: AB_10898320 |
| Rat anti-Mouse Blimp-1 (clone: 5E7) Alexa Fluor 647 conjugate | BioLegend | Cat# 150003; RRID: AB_2565617 |
| Rat anti-Mouse IgD (clone: 11–26c.2a) APC-Cyanine7 conjugate | BioLegend | Cat#; 405716 RRID: AB_10662544 |
| Rat anti-Mouse IgM (clone: B7–6) Alexa Fluor 647 conjugate | Prepared in the lab | N/A |
| Goat anti-Mouse IgM, μ Chain Specific | Jackson ImmunoResearch | Cat# 115–005-020; RRID: AB_2338450 |
| Goat anti-Mouse IgM, μ Chain Specific Alexa Fluor 680 conjugate | Jackson ImmunoResearch | Cat# 115–625-075; RRID: AB_2338934 |
| Rat anti-Mouse IgG1 (clone: A85–1) Brilliant Violet 510 conjugate | BD Biosciences | Cat# 740121; RRID: AB_2739879 |
| Rat anti-Mouse IgE (clone: RME-1) PE conjugate | BioLegend | Cat# 406907; RRID: AB_493291 |
| Rat anti-Mouse IgA (clone: C10–1) BUV395 conjugate | BD Biosciences | Cat# 743299; RRID: AB_2871498 |
| Goat anti-Mouse IgG FITC conjugate | Southern Biotech | Cat# 1030–02; RRID: AB_2794291 |
| Donkey anti-Rabbit IgG PE conjugate | BioLegend | Cat# 406421; RRID: AB_2563484 |
| Armenian Hamster anti-Mouse CD80 (clone: 16–10A1) Brilliant Violet 421 conjugate | BD Biosciences | Cat# 562611; RRID: AB_2737675 |
| Goat anti-Mouse lambda Alexa Fluor 647 conjugate | Prepared in the lab; unconjugated from Southern Biotech #1060–01 | N/A |
| Goat anti-Mouse lambda Alexa Fluor 680 conjugate | Prepared in the lab; unconjugated from Southern Biotech #1060–01 | N/A |
| Rat anti-Mouse CD273 (clone: TY-25) Biotin conjugate | BioLegend | Cat# 107203; RRID: AB_345251 |
| Rat anti-Mouse CD40 (clone: FGK45) | Prepared in the lab | N/A |
| Biotin conjugate | ||
| Rat anti-Mouse CD43 (clone: S7) | Prepared in the lab | N/A |
| Biotin conjugate | ||
| Rat anti-Mouse CD11b (clone: M1/70) | Prepared in the lab | N/A |
| Biotin conjugate | ||
| Armenian hamster anti-Mouse CD11c | Prepared in the lab | N/A |
| (clone: N418) Biotin conjugate | ||
| Rat anti-Mouse CD4 (clone: GK1.5) | Prepared in the lab | N/A |
| Biotin conjugate | ||
| Rat anti-Mouse CD8 (clone: TIB105) | Prepared in the lab | N/A |
| Biotin conjugate | ||
| Rat anti-Mouse GR1 (clone: RB6.8C5) | BioLegend | Cat# 108404; |
| Biotin conjugate | RRID: AB_313369 | |
| Rabbit anti-Mouse Cleaved Caspase-3 | Cell Signaling Technology | Cat# 9603; |
| (Asp175; clone: D3E9) Alexa Fluor | RRID: AB_11179205 | |
| 488 conjugate | ||
|
| ||
| Chemicals, Peptides, and Recombinant Proteins | ||
|
| ||
| PNA Alexa Fluor 488 conjugate | Vector Laboratories and | Cat# L-1070; |
| conjugated in the lab | ||
| PNA Alexa Fluor 555 conjugate | Vector Laboratories and | Cat# L-1070; |
| conjugated in the lab | ||
| NIP PE conjugate | LGC Biosearch Technologies | Cat# N-1080–100 |
| and conjugated in lab | ||
| NIP APC conjugate | LGC Biosearch Technologies | Cat# N-1080–100 |
| and conjugated in lab | ||
| DAPI (4′, 6-Diamidino-2-Phenylindole, | Thermo Fisher Scientific | Cat# D3571; |
| Dilactate) | RRID: AB_2307445 | |
| Streptavidin | Millipore-Sigma | Cat# S4762 |
| Streptavidin, BUV395 conjugate | BD Biosciences | Cat# 564176; |
| RRID: AB_2869553 | ||
| Ghost Dye Violet 510 | Tonbo Biosciences | Cat# 13–0870-T500 |
| Zombie NIR Fixable Viability Kit | BioLegend | Cat# 423106 |
| 7-AAD (7-Aminoactinomycin D) | Tonbo Biosciences | Cat# 13–6993-T200 |
| NP-Fluorescein-Ficoll | LGC Biosearch Technologies | Cat# F-1420F |
| Recombinant Murine IL-21 | Peprotech | Cat# 210–21 |
| BD IMag Streptavidin Particles Plus-DM | BD Biosciences | Cat# 557812 |
| Triton X-100 | Thermo Fisher Scientific | Cat# AAA16046AE |
| Fluoromount-G | Thermo Fisher Scientific | Cat# 00–4958-02 |
|
| ||
| Critical Commercial Assays | ||
|
| ||
| Perm/Wash Buffer | BD Biosciences | Cat# 554723 |
| eBioscience™ Foxp3/Transcription | Thermo Fisher Scientific | Cat# 00–5523-00 |
| Factor Staining Buffer Set | ||
| Click-iT™ Plus EdU Alexa Fluor™ | Thermo Fisher Scientific | Cat# C10632 |
| 488 Flow Cytometry Assay Kit | ||
| AO/PI Cell Viability Kit for use with LUNA-FL™ Dual Fluorescence Cell Counter | Logos Biosystems | Cat# F23001 |
| ToxinEraser™ Endotoxin Removal Kit | GenScript | Cat# L00338 |
| ToxinSensor™ Chromogenic LAL | GenScript | Cat# L00350 |
| Endotoxin Assay Kit | ||
| QIAGEN Multiplex PCR Kit | Qiagen | Cat# 206143 |
| Illumina MiSeq Reagent Kit (600-cycle) | Illumina | Cat# MS-102-3003 |
|
| ||
| Deposited data | ||
|
| ||
| Raw Mouse IgH sequencing data | This Paper | PRJNA1251130 |
| Bulk RNAseq raw and analyzed data | This Paper | GSE249811 |
| Single Cell RNAseq raw and analyzed data | This Paper | GSE299594 |
| BLIMP1+ and BLIMP1- ex vivo stimulated GCBC scRNAseq | Luo et al.11 | GSE197661 |
|
| ||
| Experimental Models: Organisms/Strains | ||
|
| ||
| Mouse: Prdm1fl/fl C57BL/6 background | JAX | Strain # 008100 |
| Mouse: Cd19-Cre C57BL/6 background | JAX | Strain # 006785 |
| Mouse: CD45.1/1 C57BL/6 background | JAX | Strain # 002014 |
| Mouse: B1–8i C57BL/6 background | This paper and Sonoda et al.45 | B1–8i |
| Mouse: B1–8i Balb/c background | This paper and Sonoda et al.45 | B1–8i |
| Mouse: Vk8R+/+ C57BL/6 background | Prak and Weigert46 | Vk8R |
|
| ||
| Oligonucleotides | ||
|
| ||
| NexteraR2-Mus-J558.75: GTCTCGTGGGCTCGGAGATGTGTATAAGAGACAGTTCTTGGCAGCAACAGCTAC | This paper | N/A |
| NexteraR2-Mus-J558.75–1N: GTCTCGTGGGCTCGGAGATGTGTATAAGAGACAGNTTCTTGGCAGCAACAGCTAC | This paper | N/A |
| NexteraR1-Mus-JH2: TCGTCGGCAGCGTCAGATGTGTATAAGAGACAGTGAGGAGACTGTGAGAGTGG | This paper | N/A |
| NexteraR1-Mus-JH2-1N: TCGTCGGCAGCGTCAGATGTGTATAAGAGACAGNTGAGGAGACTGTGAGAGTGG | This paper | N/A |
|
| ||
| Software and Algorithms | ||
|
| ||
| FlowJo v10 | FlowJo, LLC | https://www.flowjo.com |
| GraphPad Prism v10 | GraphPad Software, LLC | https://www.graphpad.com/scientific-software/prism/ |
| cellSens | Olympus | https://evidentscientific.com/en/software/cellsens |
| ImageJ | Schneider et al.47 | https://imagej.net/ij/ |
| pRESTO | Vander Heiden et al.48 | https://github.com/immcantation/presto |
| R v4.4.0 | R Core Team | https://cran.r-project.org/bin/windows/base/old/4.4.0/ |
| Shazam v1.2 | Gupta et al.49 | https://github.com/immcantation/shazam/releases/tag/1.2.0 |
| TigGER v1.1 | Gadala-Maria et al.50 | https://github.com/immcantation/tigger/releases/tag/1.1.0 |
| dowser v2.2.1.999 | Hoehn et al.51 | https://github.com/immcantation/dowser/releases/tag/2.2.1 |
| ggplot2 v3.5.1 | Wickham52 | https://github.com/tidyverse/ggplot2/releases/tag/v3.5.1 |
| cowplot v1.1.3 | Wilke53 | https://github.com/wilkelab/cowplot/releases/tag/1.1.3 |
| patchwork v1.1.0 | Pedersen54 | https://github.com/thomasp85/patchwork/releases/tag/v1.1.0 |
| data.table v1.16.0 | Barrett et al.55 | https://github.com/Rdatatable/data.table/releases/tag/1.16.0 |
| ggpubr v0.6 | Kassambara56 | https://github.com/kassambara/ggpubr/releases/tag/v0.6.0 |
| gtsummary v2.1.0 | Sjoberg et al.57 | https://github.com/ddsjoberg/gtsummary/releases/tag/v2.1.0 |
| ggtext v0.1.2 | Wilke et al.58 | https://github.com/wilkelab/ggtext |
| ggpmisc v0.6.1 | Aphalo et al.59 | https://github.com/aphalo/ggpmisc |
| ggpp v0.5.8 | Aphalo et al.60 | https://github.com/aphalo/ggpp |
| fastQC | Andrews61 | https://www.bioinformatics.babraham.ac.uk/projects/fastqc/ |
| trimgalore | Krueger62 | https://github.com/FelixKrueger/TrimGalore |
| STAR Aligner | Dobin et al.63 | https://github.com/alexdobin/STAR |
| featureCounts | Liao Y et al.64 | https://subread.sourceforge.net/featureCounts.html |
| Limma | Ritchie et al.65 | https://bioconductor.org/packages/release/bioc/html/limma.html |
| Cellranger | 10X Genomics and Zheng et al.66 | https://www.10xgenomics.com/support/software/cell-ranger/latest |
| Seurat | Butler et al.67 | https://satijalab.org/seurat/ |
Highlights.
BLIMP1 has cell-intrinsic functions in regulating GCBC
BLIMP1-deficient B cells quickly dominate GCs and persist for a much longer time
BLIMP1 deficiency promotes positive selection and cell-cycle progression of GCBC
BLIMP1-deficient GCBCs fail to downregulate BCL6 and to upregulate IRF4
ACKNOWLEDGMENTS
We thank Dr. David Rothstein (University of Pittsburgh) for providing the Prdm1fl/fl CD19-Cre mice and Drs. Rothstein and Harinder Singh for helpful discussions. Supported by NIH grants R01AI105018 to M.S., R21AI175824 to W.L., and R01AI104739 to S.H.K.
Footnotes
DECLARATION OF INTERESTS
S.H.K. receives consulting fees from Peraton.
REFERENCES
- 1.Luo W, Weisel F, and Shlomchik MJ (2018). B Cell Receptor and CD40 Signaling Are Rewired for Synergistic Induction of the c-Myc Transcription Factor in Germinal Center B Cells. Immunity 48, 313–326.e5. 10.1016/j.immuni.2018.01.008. [DOI] [PMC free article] [PubMed] [Google Scholar]
- 2.Tunyaplin C, Shaffer AL, Angelin-Duclos CD, Yu X, Staudt LM, and Calame KL (2004). Direct repression of prdm1 by Bcl-6 inhibits plasmacytic differentiation. J. Immunol 173, 1158–1165. 10.4049/jimmunol.173.2.1158. [DOI] [PubMed] [Google Scholar]
- 3.Shaffer AL, Yu X, He Y, Boldrick J, Chan EP, and Staudt LM (2000). BCL-6 represses genes that function in lymphocyte differentiation, inflammation, and cell cycle control. Immunity 13, 199–212. 10.1016/s1074-7613(00)00020-0. [DOI] [PubMed] [Google Scholar]
- 4.Shaffer AL, Lin KI, Kuo TC, Yu X, Hurt EM, Rosenwald A, Giltnane JM, Yang L, Zhao H, Calame K, and Staudt LM (2002). Blimp-1 orchestrates plasma cell differentiation by extinguishing the mature B cell gene expression program. Immunity 17, 51–62. 10.1016/s1074-7613(02)00335-7. [DOI] [PubMed] [Google Scholar]
- 5.Shapiro-Shelef M, Lin KI, McHeyzer-Williams LJ, Liao J, McHeyzer-Williams MG, and Calame K (2003). Blimp-1 is required for the formation of immunoglobulin secreting plasma cells and pre-plasma memory B cells. Immunity 19, 607–620. 10.1016/s1074-7613(03)00267-x. [DOI] [PubMed] [Google Scholar]
- 6.Shaffer AL, Shapiro-Shelef M, Iwakoshi NN, Lee AH, Qian SB, Zhao H, Yu X, Yang L, Tan BK, Rosenwald A, et al. (2004). XBP1, downstream of Blimp-1, expands the secretory apparatus and other organelles, and increases protein synthesis in plasma cell differentiation. Immunity 21, 81–93. 10.1016/j.immuni.2004.06.010. [DOI] [PubMed] [Google Scholar]
- 7.Lin Y, Wong K, and Calame K (1997). Repression of c-myc transcription by Blimp-1, an inducer of terminal B cell differentiation. Science 276, 596–599. 10.1126/science.276.5312.596. [DOI] [PubMed] [Google Scholar]
- 8.Turner CA, Mack DH, and Davis MM (1994). Blimp-1, a novel zinc finger-containing protein that can drive the maturation of B lymphocytes into immunoglobulin-secreting cells. Cell 77, 297–306. 10.1016/0092-8674(94)90321-2. [DOI] [PubMed] [Google Scholar]
- 9.Pasqualucci L, Compagno M, Houldsworth J, Monti S, Grunn A, Nandula SV, Aster JC, Murty VV, Shipp MA, and Dalla-Favera R (2006). Inactivation of the PRDM1/BLIMP1 gene in diffuse large B cell lymphoma. J. Exp. Med 203, 311–317. 10.1084/jem.20052204. [DOI] [PMC free article] [PubMed] [Google Scholar]
- 10.Mandelbaum J, Bhagat G, Tang H, Mo T, Brahmachary M, Shen Q, Chadburn A, Rajewsky K, Tarakhovsky A, Pasqualucci L, and Dalla-Favera R (2010). BLIMP1 is a tumor suppressor gene frequently disrupted in activated B cell-like diffuse large B cell lymphoma. Cancer Cell 18, 568–579. [DOI] [PMC free article] [PubMed] [Google Scholar]
- 11.Luo W, Conter L, Elsner RA, Smita S, Weisel F, Callahan D, Wu S, Chikina M, and Shlomchik M (2023). IL-21R signal reprogramming cooperates with CD40 and BCR signals to select and differentiate germinal center B cells. Sci. Immunol 8, eadd1823. 10.1126/sciim-munol.add1823. [DOI] [PMC free article] [PubMed] [Google Scholar]
- 12.Radtke D, and Bannard O (2018). Expression of the Plasma Cell Transcriptional Regulator Blimp-1 by Dark Zone Germinal Center B Cells During Periods of Proliferation. Front. Immunol 9, 3106. 10.3389/fimmu.2018.03106. [DOI] [PMC free article] [PubMed] [Google Scholar]
- 13.Mesin L, Ersching J, and Victora GD (2016). Germinal Center B Cell Dynamics. Immunity 45, 471–482. 10.1016/j.immuni.2016.09.001. [DOI] [PMC free article] [PubMed] [Google Scholar]
- 14.Calado DP, Sasaki Y, Godinho SA, Pellerin A, Köchert K, Sleckman BP, de Alborán IM, Janz M, Rodig S, and Rajewsky K (2012). The cell-cycle regulator c-Myc is essential for the formation and maintenance of germinal centers. Nat. Immunol 13, 1092–1100. 10.1038/ni.2418. [DOI] [PMC free article] [PubMed] [Google Scholar]
- 15.Dominguez-Sola D, Victora GD, Ying CY, Phan RT, Saito M, Nussenzweig MC, and Dalla-Favera R (2012). The proto-oncogene MYC is required for selection in the germinal center and cyclic reentry. Nat. Immunol 13, 1083–1091. 10.1038/ni.2428. [DOI] [PMC free article] [PubMed] [Google Scholar]
- 16.Chou C, Verbaro DJ, Tonc E, Holmgren M, Cella M, Colonna M, Bhattacharya D, and Egawa T (2016). The Transcription Factor AP4 Mediates Resolution of Chronic Viral Infection through Amplification of Germinal Center B Cell Responses. Immunity 45, 570–582. 10.1016/j.immuni.2016.07.023. [DOI] [PMC free article] [PubMed] [Google Scholar]
- 17.Yaari G, Uduman M, and Kleinstein SH (2012). Quantifying selection in high-throughput Immunoglobulin sequencing data sets. Nucleic Acids Res 40, e134. 10.1093/nar/gks457. [DOI] [PMC free article] [PubMed] [Google Scholar]
- 18.Jiang Y, Liu F, Zou F, Zhang Y, Wang B, Zhang Y, Lian A, Han X, Liu Z, Liu X, et al. (2019). PBX homeobox 1 enhances hair follicle mesenchymal stem cell proliferation and reprogramming through activation of the AKT/glycogen synthase kinase signaling pathway and suppression of apoptosis. Stem Cell Res. Ther 10, 268. 10.1186/s13287-019-1382-y. [DOI] [PMC free article] [PubMed] [Google Scholar]
- 19.Sheng P, Zhu H, Zhang W, Xu Y, Peng W, Sun J, Gu M, and Jiang H (2020). The immunoglobulin superfamily member 3 (IGSF3) promotes hepatocellular carcinoma progression through activation of the NF-kappaB pathway. Ann. Transl. Med 8, 378. 10.21037/atm.2020.02.14. [DOI] [PMC free article] [PubMed] [Google Scholar]
- 20.Yang T, Ou J, and Yildirim E (2022). Xist exerts gene-specific silencing during XCI maintenance and impacts lineage-specific cell differentiation and proliferation during hematopoiesis. Nat. Commun 13, 4464. 10.1038/s41467-022-32273-5. [DOI] [PMC free article] [PubMed] [Google Scholar]
- 21.Ise W, and Kurosaki T (2019). Plasma cell differentiation during the germinal center reaction. Immunol. Rev 288, 64–74. 10.1111/imr.12751. [DOI] [PubMed] [Google Scholar]
- 22.Wingender E, Chen X, Hehl R, Karas H, Liebich I, Matys V, Meinhardt T, Prüss M, Reuter I, and Schacherer F (2000). TRANSFAC: an integrated system for gene expression regulation. Nucleic Acids Res 28, 316–319. 10.1093/nar/28.1.316. [DOI] [PMC free article] [PubMed] [Google Scholar]
- 23.Zuccarino-Catania GV, Sadanand S, Weisel FJ, Tomayko MM, Meng H, Kleinstein SH, Good-Jacobson KL, and Shlomchik MJ (2014). CD80 and PD-L2 define functionally distinct memory B cell subsets that are independent of antibody isotype. Nat. Immunol 15, 631–637. 10.1038/ni.2914. [DOI] [PMC free article] [PubMed] [Google Scholar]
- 24.Callahan D, Smita S, Joachim S, Hoehn K, Kleinstein S, Weisel F, Chikina M, and Shlomchik M (2024). Memory B cell subsets have divergent developmental origins that are coupled to distinct imprinted epigenetic states. Nat. Immunol 25, 562–575. 10.1038/s41590-023-01721-9. [DOI] [PMC free article] [PubMed] [Google Scholar]
- 25.Viant C, Wirthmiller T, ElTanbouly MA, Chen ST, Kara EE, Cipolla M, Ramos V, Oliveira TY, Stamatatos L, and Nussenzweig MC (2021). Germinal center-dependent and -independent memory B cells produced throughout the immune response. J. Exp. Med 218, e20202489. 10.1084/jem.20202489. [DOI] [PMC free article] [PubMed] [Google Scholar]
- 26.Laidlaw BJ, Schmidt TH, Green JA, Allen CDC, Okada T, and Cyster JG (2017). The Eph-related tyrosine kinase ligand Ephrin-B1 marks germinal center and memory precursor B cells. J. Exp. Med 214, 639–649. 10.1084/jem.20161461. [DOI] [PMC free article] [PubMed] [Google Scholar]
- 27.Suan D, Krautler NJ, Maag JLV, Butt D, Bourne K, Hermes JR, Avery DT, Young C, Statham A, Elliott M, et al. (2017). CCR6 Defines Memory B Cell Precursors in Mouse and Human Germinal Centers, Revealing Light-Zone Location and Predominant Low Antigen Affinity. Immunity 47, 1142–1153.e1144. 10.1016/j.immuni.2017.11.022. [DOI] [PubMed] [Google Scholar]
- 28.Laidlaw BJ, Duan L, Xu Y, Vazquez SE, and Cyster JG (2020). The transcription factor Hhex cooperates with the corepressor Tle3 to promote memory B cell development. Nat. Immunol 21, 1082–1093. 10.1038/s41590-020-0713-6. [DOI] [PMC free article] [PubMed] [Google Scholar]
- 29.Ise W, Fujii K, Shiroguchi K, Ito A, Kometani K, Takeda K, Kawakami E, Yamashita K, Suzuki K, Okada T, and Kurosaki T (2018). T Follicular Helper Cell-Germinal Center B Cell Interaction Strength Regulates Entry into Plasma Cell or Recycling Germinal Center Cell Fate. Immunity 48, 702–715.e4. 10.1016/j.immuni.2018.03.027. [DOI] [PubMed] [Google Scholar]
- 30.Johnston RJ, Poholek AC, DiToro D, Yusuf I, Eto D, Barnett B, Dent AL, Craft J, and Crotty S (2009). Bcl6 and Blimp-1 are reciprocal and antagonistic regulators of T follicular helper cell differentiation. Science 325, 1006–1010. 10.1126/science.1175870. [DOI] [PMC free article] [PubMed] [Google Scholar]
- 31.Koike T, Fujii K, Kometani K, Butler NS, Funakoshi K, Yari S, Kikuta J, Ishii M, Kurosaki T, and Ise W (2023). Progressive differentiation toward the long-lived plasma cell compartment in the bone marrow. J. Exp. Med 220, e20221717. 10.1084/jem.20221717. [DOI] [PMC free article] [PubMed] [Google Scholar]
- 32.Allen CDC, Okada T, and Cyster JG (2007). Germinal-center organization and cellular dynamics. Immunity 27, 190–202. 10.1016/j.immuni.2007.07.009.S1074-7613(07)00370-6.[pii]. [DOI] [PMC free article] [PubMed] [Google Scholar]
- 33.Stewart I, Radtke D, Phillips B, McGowan SJ, and Bannard O (2018). Germinal Center B Cells Replace Their Antigen Receptors in Dark Zones and Fail Light Zone Entry when Immunoglobulin Gene Mutations are Damaging. Immunity 49, 477–489.e7. 10.1016/j.immuni.2018.08.025. [DOI] [PMC free article] [PubMed] [Google Scholar]
- 34.Mayer CT, Gazumyan A, Kara EE, Gitlin AD, Golijanin J, Viant C, Pai J, Oliveira TY, Wang Q, Escolano A, et al. (2017). The microanatomic segregation of selection by apoptosis in the germinal center. Science 358, eaao2602. 10.1126/science.aao2602. [DOI] [PMC free article] [PubMed] [Google Scholar]
- 35.Sciammas R, Shaffer AL, Schatz JH, Zhao H, Staudt LM, and Singh H (2006). Graded expression of interferon regulatory factor-4 coordinates isotype switching with plasma cell differentiation. Immunity 25, 225–236. 10.1016/j.immuni.2006.07.009. [DOI] [PubMed] [Google Scholar]
- 36.Cretney E, Xin A, Shi W, Minnich M, Masson F, Miasari M, Belz GT, Smyth GK, Busslinger M, Nutt SL, and Kallies A (2011). The transcription factors Blimp-1 and IRF4 jointly control the differentiation and function of effector regulatory T cells. Nat. Immunol 12, 304–311. 10.1038/ni.2006. [DOI] [PubMed] [Google Scholar]
- 37.Kwon H, Thierry-Mieg D, Thierry-Mieg J, Kim HP, Oh J, Tunyaplin C, Carotta S, Donovan CE, Goldman ML, Tailor P, et al. (2009). Analysis of interleukin-21-induced Prdm1 gene regulation reveals functional cooperation of STAT3 and IRF4 transcription factors. Immunity 31, 941–952. 10.1016/j.immuni.2009.10.008. [DOI] [PMC free article] [PubMed] [Google Scholar]
- 38.Alinikula J, Nera KP, Junttila S, and Lassila O (2011). Alternate pathways for Bcl6-mediated regulation of B cell to plasma cell differentiation. Eur. J. Immunol 41, 2404–2413. 10.1002/eji.201141553. [DOI] [PubMed] [Google Scholar]
- 39.Ci W, Polo JM, Cerchietti L, Shaknovich R, Wang L, Yang SN, Ye K, Farinha P, Horsman DE, Gascoyne RD, et al. (2009). The BCL6 transcriptional program features repression of multiple oncogenes in primary B cells and is deregulated in DLBCL. Blood 113, 5536–5548. 10.1182/blood-2008-12-193037. [DOI] [PMC free article] [PubMed] [Google Scholar]
- 40.Minnich M, Tagoh H, Bönelt P, Axelsson E, Fischer M, Cebolla B, Tarakhovsky A, Nutt SL, Jaritz M, and Busslinger M (2016). Multifunctional role of the transcription factor Blimp-1 in coordinating plasma cell differentiation. Nat. Immunol 17, 331–343. 10.1038/ni.3349. [DOI] [PMC free article] [PubMed] [Google Scholar]
- 41.Rutishauser RL, Martins GA, Kalachikov S, Chandele A, Parish IA, Meffre E, Jacob J, Calame K, and Kaech SM (2009). Transcriptional repressor Blimp-1 promotes CD8(+) T cell terminal differentiation and represses the acquisition of central memory T cell properties. Immunity 31, 296–308. 10.1016/j.immuni.2009.05.014. [DOI] [PMC free article] [PubMed] [Google Scholar]
- 42.Kallies A, Xin A, Belz GT, and Nutt SL (2009). Blimp-1 transcription factor is required for the differentiation of effector CD8(+) T cells and memory responses. Immunity 31, 283–295. 10.1016/j.immuni.2009.06.021. [DOI] [PubMed] [Google Scholar]
- 43.Finkin S, Hartweger H, Oliveira TY, Kara EE, and Nussenzweig MC (2019). Protein Amounts of the MYC Transcription Factor Determine Germinal Center B Cell Division Capacity. Immunity 51, 324–336.e5. 10.1016/j.immuni.2019.06.013. [DOI] [PMC free article] [PubMed] [Google Scholar]
- 44.Inoue T, Shinnakasu R, Kawai C, Ise W, Kawakami E, Sax N, Oki T, Kitamura T, Yamashita K, Fukuyama H, and Kurosaki T (2021). Exit from germinal center to become quiescent memory B cells depends on metabolic reprograming and provision of a survival signal. J. Exp. Med 218, e20200866. 10.1084/jem.20200866. [DOI] [PMC free article] [PubMed] [Google Scholar]
- 45.Sonoda E, Pewzner-Jung Y, Schwers S, Taki S, Jung S, Eilat D, and Rajewsky K (1997). B cell development under the condition of allelic inclusion. Immunity 6, 225–233. [DOI] [PubMed] [Google Scholar]
- 46.Prak EL, and Weigert M (1995). Light chain replacement: a new model for antibody gene rearrangement. J. Exp. Med 182, 541–548. 10.1084/jem.182.2.541. [DOI] [PMC free article] [PubMed] [Google Scholar]
- 47.Schneider CA, Rasband WS, and Eliceiri KW (2012). NIH Image to ImageJ: 25 years of image analysis. Nat. Methods 9, 671–675. 10.1038/nmeth.2089. [DOI] [PMC free article] [PubMed] [Google Scholar]
- 48.Vander Heiden JA, Yaari G, Uduman M, Stern JNH, O’Connor KC, Hafler DA, Vigneault F, and Kleinstein SH (2014). pRESTO: a toolkit for processing high-throughput sequencing raw reads of lymphocyte receptor repertoires. Bioinformatics 30, 1930–1932. 10.1093/bioinformatics/btu138. [DOI] [PMC free article] [PubMed] [Google Scholar]
- 49.Gupta NT, Vander Heiden JA, Uduman M, Gadala-Maria D, Yaari G, and Kleinstein SH (2015). Change-O: a toolkit for analyzing largescale B cell immunoglobulin repertoire sequencing data. Bioinformatics 31, 3356–3358. 10.1093/bioinformatics/btv359. [DOI] [PMC free article] [PubMed] [Google Scholar]
- 50.Gadala-Maria D, Yaari G, Uduman M, and Kleinstein SH (2015). Automated analysis of high-throughput B-cell sequencing data reveals a high frequency of novel immunoglobulin V gene segment alleles. Proc. Natl. Acad. Sci. USA 112, E862–E870. 10.1073/pnas.1417683112. [DOI] [PMC free article] [PubMed] [Google Scholar]
- 51.Hoehn KB, Pybus OG, and Kleinstein SH (2022). Phylogenetic analysis of migration, differentiation, and class switching in B cells. PLoS Comput. Biol 18, e1009885. 10.1371/journal.pcbi.1009885. [DOI] [PMC free article] [PubMed] [Google Scholar]
- 52.Wickham H (2016). Toolbox. ggplot2: Elegant Graphics for Data Analysis (Springer International Publishing; ). 10.1007/978-3-319-24277-4. [DOI] [Google Scholar]
- 53.Wilke CO cowplot: Streamlined Plot Theme and Plot Annotations for ‘ggplot2’. R package version 1.1.3. https://CRAN.R-project.org/package=cowplot.
- 54.Pedersen TL. patchwork: The Composer of Plots. R package version 1.3.0. https://CRAN.R-project.org/package=patchwork. [Google Scholar]
- 55.Barrett T, Dowle M, Srinivasan A, Gorecki J, Chirico M, Hocking T, and Schwendinger B data.table: Extension of ‘data.frame’. R package version 1.16.0. https://CRAN.R-project.org/package=data.table. [Google Scholar]
- 56.Kassambara A. ggpubr: ‘ggplot2’ Based Publication Ready Plots. R package version 0.6.0. https://CRAN.R-project.org/package=ggpubr. [Google Scholar]
- 57.Sjoberg DD, Whiting K, Curry M, Lavery JA, and Larmarange J (2021). Reproducible summary tables with the gtsummary package. The R Journal. 10.32614/RJ-2021-053. [DOI] [Google Scholar]
- 58.Wilke CO, and Wiernik BM (2022). ggtext: Improved Text Rendering Support for ‘ggplot2’. R package version 0.1.2. https://CRAN.R-project.org/package=ggtext. [Google Scholar]
- 59.Aphalo PJ, Slowikowski K, and Mouksassi S (2024). ggpmisc: Miscellaneous Extensions to ggplot2. R package version 0.6.1. https://CRAN.R-project.org/package=ggpmisc. [Google Scholar]
- 60.Aphalo PJ, Slowikowski K, Krassowski M, Bové DS, and Banjo S (2024). ggpp: Grammar Extensions to ggplot2. R package version 0.5.8–1. https://CRAN.R-project.org/package=ggpp. [Google Scholar]
- 61.Andrews S FastQC: A Quality Control Tool for High Throughput Sequence Data. https://www.bioinformatics.babraham.ac.uk/projects/fastqc/. [Google Scholar]
- 62.Krueger F. Trim Galore: a wrapper tool around Cutadapt and FastQC to consistently apply quality and adapter trimming to FastQ files, with some extra functionality for MspI-digested RRBS-type (Reduced Representation Bisufite-Seq) libraries. https://github.com/FelixKrueger/TrimGalore?tab=readme-ov-file. [Google Scholar]
- 63.Dobin A, Davis CA, Schlesinger F, Drenkow J, Zaleski C, Jha S, Batut P, Chaisson M, and Gingeras TR (2013). STAR: ultrafast universal RNA-seq aligner. Bioinformatics 29, 15–21. 10.1093/bioinformatics/bts635. [DOI] [PMC free article] [PubMed] [Google Scholar]
- 64.Liao Y, Smyth GK, and Shi W (2014). featureCounts: an efficient general purpose program for assigning sequence reads to genomic features. Bioinformatics 30, 923–930. 10.1093/bioinformatics/btt656. [DOI] [PubMed] [Google Scholar]
- 65.Ritchie ME, Phipson B, Wu D, Hu Y, Law CW, Shi W, and Smyth GK (2015). limma powers differential expression analyses for RNA-sequencing and microarray studies. Nucleic Acids Res 43, e47. 10.1093/nar/gkv007. [DOI] [PMC free article] [PubMed] [Google Scholar]
- 66.Zheng GX, Terry JM, Belgrader P, Ryvkin P, Bent ZW, Wilson R, Ziraldo SB, Wheeler TD, McDermott GP, Zhu J, et al. (2017). Massively parallel digital transcriptional profiling of single cells. Nat. Commun. 8, 14049. 10.1038/ncomms14049. [DOI] [PMC free article] [PubMed] [Google Scholar]
- 67.Butler A, Hoffman P, Smibert P, Papalexi E, and Satija R (2018). Integrating single-cell transcriptomic data across different conditions, technologies, and species. Nat. Biotechnol 36, 411–420. 10.1038/nbt.4096. [DOI] [PMC free article] [PubMed] [Google Scholar]
- 68.Hannum LG, Haberman AM, Anderson SM, and Shlomchik MJ (2000). Germinal center initiation, variable gene region hypermutation, and mutant B cell selection without detectable immune complexes on follicular dendritic cells. J. Exp. Med 192, 931–942. 10.1084/jem.192.7.931. [DOI] [PMC free article] [PubMed] [Google Scholar]
- 69.Law CW, Chen Y, Shi W, and Smyth GK (2014). voom: Precision weights unlock linear model analysis tools for RNA-seq read counts. Genome Biol 15, R29. 10.1186/gb-2014-15-2-r29. [DOI] [PMC free article] [PubMed] [Google Scholar]
- 70.Meng W, Zhang B, Schwartz GW, Rosenfeld AM, Ren D, Thome JJC, Carpenter DJ, Matsuoka N, Lerner H, Friedman AL, et al. (2017). An atlas of B-cell clonal distribution in the human body. Nat. Biotechnol 35, 879–884. 10.1038/nbt.3942. [DOI] [PMC free article] [PubMed] [Google Scholar]
- 71.Ye J, Ma N, Madden TL, and Ostell JM (2013). IgBLAST: an immunoglobulin variable domain sequence analysis tool. Nucleic Acids Res 41, W34–W40. 10.1093/nar/gkt382. [DOI] [PMC free article] [PubMed] [Google Scholar]
Associated Data
This section collects any data citations, data availability statements, or supplementary materials included in this article.
Supplementary Materials
Data Availability Statement
RNA-seq data generated in this study have been deposited in the National Center for Biotechnology Information Gene Expression Omnibus database under accession codes GSE249811 (Bulk RNA-seq), GSE299594 (scRNA-seq) and the mouse IgH sequencing data have been deposited in the GenBank SRA under project number PRJNA1251130. Processed data will be made available via the AIRR Data Commons upon publication.