Abstract
Background
Cervical cancer exhibits heterogeneous clinical outcomes, requiring improved prognostic tools. Single-cell RNA sequencing enables high-resolution analysis of tumor microenvironment cellular heterogeneity. This study developed a prognostic model for cervical cancer through single-cell transcriptomic analysis and immune infiltration characterization, focusing on PTK6 as a key biomarker.
Methods
We analyzed TCGA and GEO transcriptomic data with single-cell RNA sequencing datasets. Fifteen machine learning algorithms constructed prognostic models using immune infiltration-related genes. Single-cell analysis employed Seurat for cell clustering and annotation. PTK6 expression was validated in H8 and HeLa cell lines via RT-qPCR and siRNA knockdown experiments.
Results
Single-cell sequencing revealed distinct cellular populations including CD8T cells, CD4Tconv cells, and fibroblasts. The prognostic model achieved excellent performance with AUC values of 0.737–0.757 across 1–5 years. PTK6 showed significantly elevated expression in tumors and strong correlations with immune infiltration. Single-cell analysis confirmed PTK6 expression across multiple cell types. Functional validation demonstrated that PTK6 knockdown reduced HeLa cell proliferation, confirming its oncogenic role.
Conclusion
PTK6 emerges as a critical immune infiltration-related prognostic biomarker through single-cell transcriptomic analysis.
Keywords: Cervical cancer, Single-cell RNA sequencing, PTK6, Immune infiltration, Machine learning, Prognostic biomarker
Introduction
Among gynecological cancers, cervical carcinoma represents one of the most frequently diagnosed malignancies, distinguished by marked variability in patient outcomes and treatment responses. This clinical heterogeneity emphasizes the urgent need to establish reliable prognostic instruments that can guide personalized patient management strategies [1–3]. Despite considerable advances in treatment modalities, comprehensive understanding of underlying molecular mechanisms continues to be essential for improving prognostic accuracy and informing clinical therapeutic decisions.
Within the tumor microenvironment, the presence and composition of infiltrating immune populations have gained recognition as crucial determinants of disease trajectory and therapeutic response. Examining how gene expression patterns interact with immune cell populations that penetrate the tumor microenvironment could uncover essential biological processes driving cervical cancer development and progression [4–6].
Machine learning methodologies have become essential tools for analyzing complex, high-dimensional biological data, uncovering sophisticated patterns and relationships that traditional statistical methods might fail to detect. In cervical cancer studies, these advanced computational approaches enable the integration of transcriptomic data with immunological profiles to construct powerful predictive models. These frameworks improve patient risk classification, enhance prognostic accuracy, and support the development of targeted therapeutic strategies, thereby elevating standards of clinical care [7–9].
This study aimed to develop an integrated prognostic system for cervical cancer by combining transcriptomic biomarkers with immune infiltration profiles. Through the deployment of sophisticated machine learning approaches, we endeavored to identify genetic and immune-related indicators that could deliver accurate predictions of patient outcomes. This approach not only deepens our comprehension of cervical cancer’s molecular landscape but also provides a platform for personalized risk assessment and the design of targeted treatment protocols. Our findings validate the potential for creating advanced predictive models that effectively merge genomic and immunological data in cancer research applications.
Methods
Data source
Transcriptomic expression data and corresponding clinical parameters for cervical cancer patients were retrieved from TCGA and GEO repositories. Single-cell RNA sequencing datasets were also obtained from GEO database resources [10, 11].
Selection of core hub genes
The identification of central hub genes involved determining intersections among disease-associated genes, with visualization through Venn diagram construction. Subsequently, protein-protein interaction network analysis of intersected genes was conducted via the STRING platform, followed by Cytoscape-based analysis to pinpoint six pivotal hub genes [12–14].Functional annotation of these central hub genes was performed using the Metascape platform.
Establishment of the model
Prognostically relevant differentially expressed genes were analyzed based on patient survival outcomes and duration. Unsupervised clustering approaches were applied to stratify patients into distinct groups for subsequent investigation. A scoring framework was developed utilizing principal component analysis methodology, incorporating the initial two principal components for score calculation.
Clinical functional assessment
Prognostically relevant differentially expressed genes were analyzed based on patient survival outcomes and duration. Unsupervised clustering approaches were applied to stratify patients into distinct groups for subsequent investigation. A scoring framework was developed utilizing principal component analysis methodology, incorporating the initial two principal components for score calculation [15, 16].
Immune infiltration analysis
Following variable stratification, statistical analyses were conducted to characterize group distributions within each classification. Data visualization was accomplished using ggplot2 for generating overlay bar plots. Immune infiltration quantification utilized CIBERSORT methodology (via CIBERSORT.R script) with 22 immune cell markers from CIBERSORTx platform (https://cibersortx.stanford.edu/). Stromal and immune scoring for TCGA cervical cancer samples was performed using the “estimate” R package [17, 18].
Machine learning
TCGA cervical cancer datasets and corresponding GTEx normal tissue controls were partitioned into training cohort (DatasetA) and three testing cohorts (DatasetB, DatasetC), plus internal validation set (DatasetD) using 1:1:1 allocation. Fifteen computational algorithms were applied, encompassing neural networks, Lasso regression, and naive Bayes approaches. Performance metrics including C-index were computed across test and validation sets. Model ranking was based on mean C-index, AUC, recall, and F-score values [19, 20].
Single-cell level validation
Single-cell RNA sequencing analysis utilized the ‘Seurat’ R package. Quality control procedures excluded cells containing fewer than 200 detected features and mitochondrial gene percentages exceeding 20%. Multi-sample integration was performed with batch effect correction. Cell clustering employed ‘LogNormalization’ methodology followed by PCA and t-SNE dimensional reduction for visualization. Cell type identification was achieved through ‘SingleR’ package annotation, while ‘FindAllMarkers’ identified differentially expressed marker genes across cellular populations.Dimensionality reduction was performed through a sequential approach beginning with principal component analysis (PCA) using the identified highly variable genes. We retained the first 50 principal components based on elbow plot analysis and jackstraw statistical testing to capture the majority of biological variation while reducing computational complexity. For visualization purposes, we applied t-distributed stochastic neighbor embedding (t-SNE) with perplexity parameter set to 30 and 1,000 iterations, alongside Uniform Manifold Approximation and Projection (UMAP) with default parameters (n_neighbors = 30, min_dist = 0.3) to generate two-dimensional representations of cellular relationships.
Cell clustering was performed using the Leiden algorithm implemented through the FindClusters function, with resolution parameters ranging from 0.1 to 1.0 to identify optimal cluster granularity. We selected the resolution yielding the most biologically interpretable clusters based on silhouette analysis and assessment of known cell type markers. The final clustering utilized a shared nearest neighbor (SNN) graph construction with k = 20 nearest neighbors and Jaccard similarity calculation [21, 22].
Cell lines
H8 and HeLa cell lines were obtained from ATCC and cultured in DMEM medium containing 10% FBS (Gibco, Thermo Fisher Scientific Inc.), 1% L-glutamine (Gibco, Thermo Fisher Scientific Inc.), and 1% penicillin-streptomycin (Gibco, Thermo Fisher Scientific Inc.).
SiRNA transfection
RNA interference experiments employed Lipofectamine 3000 (Invitrogen) for siRNA delivery following manufacturer protocols. Target gene siRNA (20 nM) was combined with transfection reagent in Opti-MEM medium (Gibco), then incubated 10–15 min at ambient temperature for complex assembly. HeLa cells were plated in 6-well formats at 1 × 10⁵ cells/well density 24 h before transfection. On transfection day, cells underwent PBS washing followed by siRNA-lipid complex treatment in antibiotic-free complete medium. Following 6-hour incubation at 37 °C with CO2, transfection medium was exchanged with fresh antibiotic-containing complete medium.
RT-qPCR
H8 and HeLa cells were processed for RNA extraction using TRIzol reagent. cDNA synthesis from 1 mg RNA was performed using PrimeScript RT-PCR kit. Quantitative PCR utilized SYBR Green SuperMix with GAPDH serving as the normalization control for mRNA quantification.
Statistics
All statistical analyses were performed using the R programming language (Version 4.0.3). A p-value of less than 0.05 was considered statistically significant unless otherwise specified.
Results
The differences in gene expression between normal and tumor tissues
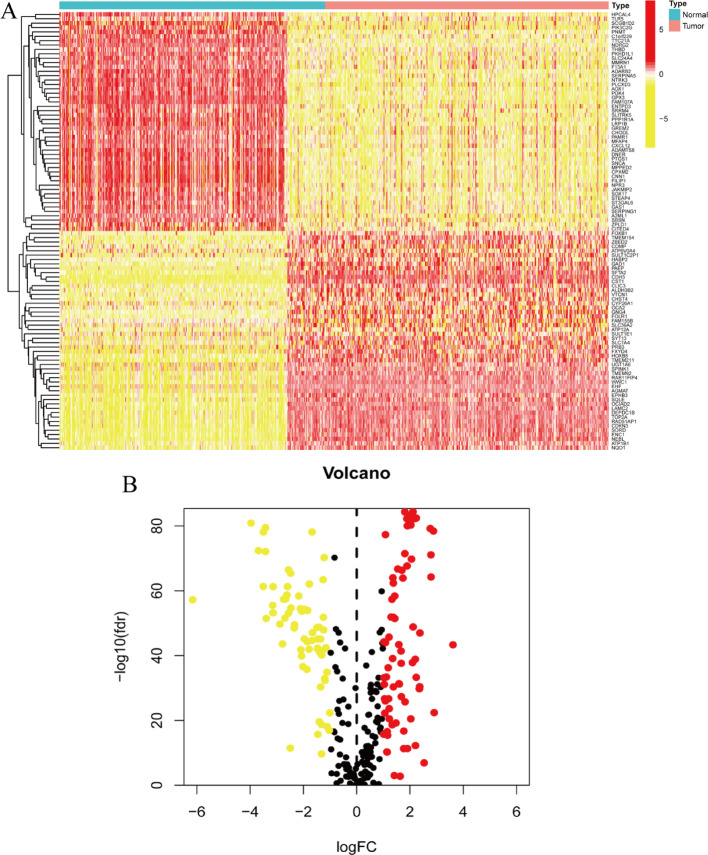
Figure 1A: The heatmap illustrates gene expression profiles across two distinct sample categories: normal and tumor tissues. Sample clustering is performed based on transcriptomic expression similarities. A color spectrum from red to yellow represents differential gene expression intensities, where red indicates elevated expression levels and yellow denotes reduced expression. The visualization separates samples into two distinct clusters, positioning normal specimens on one side and malignant specimens on the opposite side. Figure 1B: The volcano plot demonstrates differential gene expression analysis comparing normal versus tumor specimens. The horizontal axis depicts log fold change (logFC) values representing expression alterations, while the vertical axis shows the negative logarithm base 10 of the false discovery rate (FDR), reflecting statistical significance levels. Significantly upregulated genes in tumor samples are marked in red, significantly downregulated genes are indicated in yellow, and statistically non-significant genes appear in black. This visualization facilitates identification of the most substantially altered genes between sample categories.
Fig. 1.
The differences in gene expression between normal and tumor tissues. A Heatmap displays the differential gene expression between normal and tumor samples. B Volcano plot visualizes the statistical significance and magnitude of differential gene expression between normal and tumor samples. B Volcano Plot
The volcano plot highlights genes that are significantly differentially expressed between tumor and normal samples
Different types of data related to gene expression and prognostic analysis
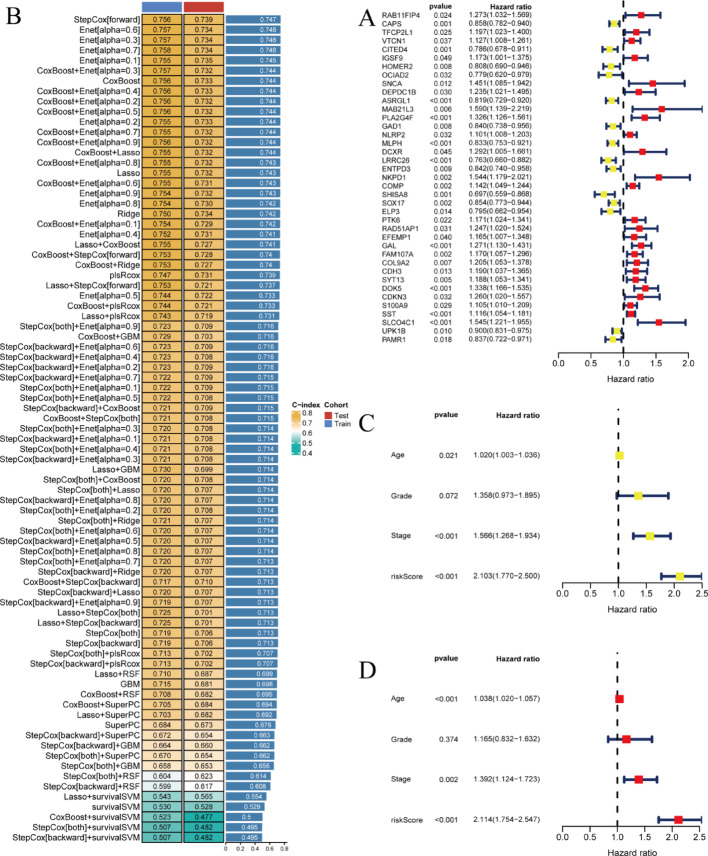
Figure 2A displays a forest plot illustrating hazard ratios for multiple genes. Each gene entry includes associated p-values, hazard ratios, and confidence intervals. Genes demonstrating significant associations are emphasized, revealing their potential influence on patient survival outcomes. Figure 2B presents a coefficient heatmap for various prognostic model features. Features are color-coded according to their coefficient values, with distinct colors representing the magnitude and directional influence. This visualization identifies features with the greatest model contribution. Figure 2C depicts hazard ratios for clinical parameters including age, grade, and stage. Each parameter displays corresponding p-values and hazard ratios, demonstrating their prognostic significance. Figure 2D incorporates identical clinical variables while additionally including a risk score component. The risk score’s hazard ratio demonstrates its predictive capacity relative to other clinical parameters.
Fig. 2.
Different types of data related to gene expression and prognostic analysis. A Forest plot of hazard ratios for genes shows the hazard ratios (HR) and confidence intervals (CI) for various genes, indicating their impact on survival. B Model performance table compares the performance of different predictive models. C Forest plot for clinical factors shows the impact of clinical factors (age, grade, stage, risk score) on survival in the training cohort. D Forest plot for clinical factors shows the impact of clinical factors (age, grade, stage, risk score) on survival in the test cohort
Survival analysis and prognostic model assessment
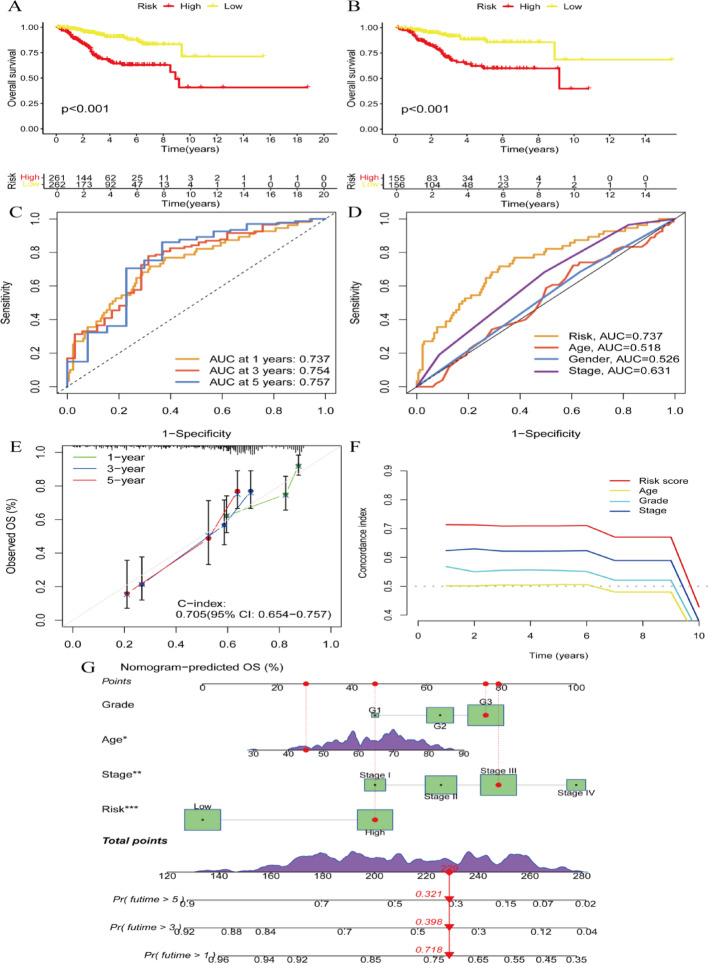
Kaplan-Meier survival curves demonstrate overall survival comparisons between high-risk and low-risk cohorts. Both panels reveal significant survival differences (p < 0.001), with high-risk cohorts exhibiting inferior outcomes (Fig. 3A and B). Time-dependent ROC analysis illustrates the model’s predictive accuracy across 1, 3, and 5-year intervals. AUC values demonstrate robust predictive performance at 0.737, 0.754, and 0.757, respectively (Fig. 3C). ROC curve comparison evaluates risk score predictive power against clinical factors including age, gender, and stage. The risk score achieves the highest AUC (0.737), indicating superior predictive capacity (Fig. 3D). Calibration plots demonstrate concordance between observed and predicted overall survival at 1, 3, and 5-year timepoints. The C-index of 0.705 indicates satisfactory model calibration (Fig. 3E). Time-dependent concordance index analysis for risk score and clinical variables across 10 years demonstrates consistent predictive performance over time (Fig. 3F). The nomogram integrates clinical parameters including grade, age, stage, and risk score for overall survival probability prediction. This visualization provides a practical tool for patient-specific survival estimation based on cumulative factor points (Fig. 3G).
Fig. 3.
Survival analysis and model evaluation for a prognostic study. A and B Kaplan-Meier survival curves compare overall survival between high-risk and low-risk groups. C and D ROC curves evaluate the performance of the risk model in predicting survival at different time points. C ROC curves for the risk model at 1, 3, and 5 years. D Comparison of ROC curves for risk score, age, gender, and stage. E Calibration plot assess the agreement between predicted and observed survival probabilities. F Time-Dependent C-index shows the model’s predictive accuracy over time. G Nomogram provides a visual tool to predict individual patient survival probabilities based on multiple factors
Immune cell infiltration and risk group associations
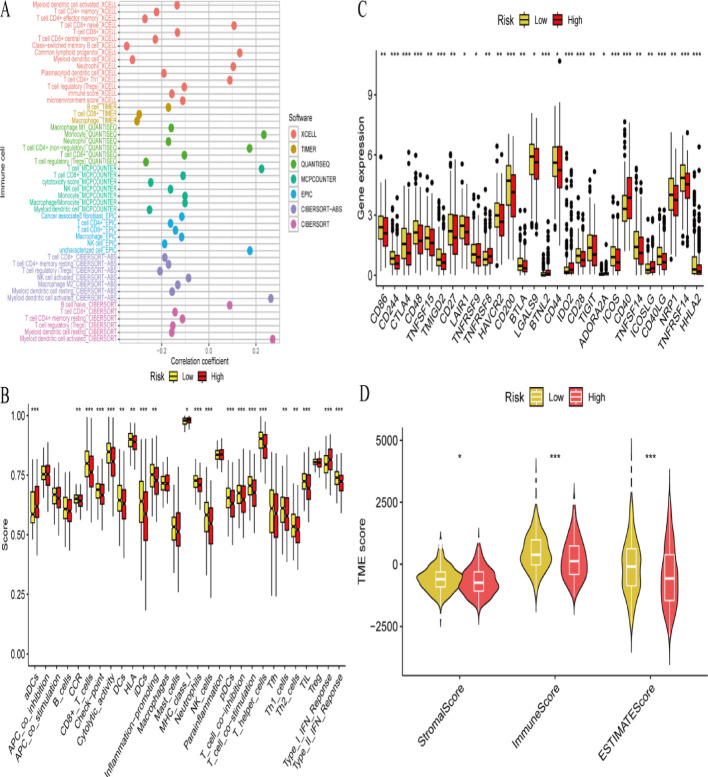
Bubble plot visualization shows correlations between immune cell populations and risk scores. Individual bubbles represent specific immune cells, with bubble size indicating correlation strength and color denoting significance levels (Fig. 4A). Bar chart presentation displays estimated immune cell proportions across low-risk and high-risk cohorts. Immune infiltration differences between groups are highlighted, with significant variations marked by asterisks (Fig. 4B). Box plot comparisons illustrate immune-related gene expression levels between risk cohorts. Asterisks indicate significant differences, suggesting distinct immune profiles for each risk category (Fig. 4C). Violin plot distributions show tumor microenvironment scores, including stromal, immune, and ESTIMATE scores, across risk groups. Significant TME compositional differences between groups are demonstrated (Fig. 4D).
Fig. 4.
Immune cell infiltration and its correlation with risk groups. A Bubble plot of immune cell infiltration shows the correlation between immune cell infiltration and risk scores using different software tools. B Box plot of immune cell scores compares the scores of various immune cells between low-risk and high-risk groups. C Box plot of gene expression compares the expression levels of specific genes between low-risk and high-risk groups. D Violin plot of tumor microenvironment scores compares tumor microenvironment (TME) scores between low-risk and high-risk groups
Biological pathways and processes in risk groups
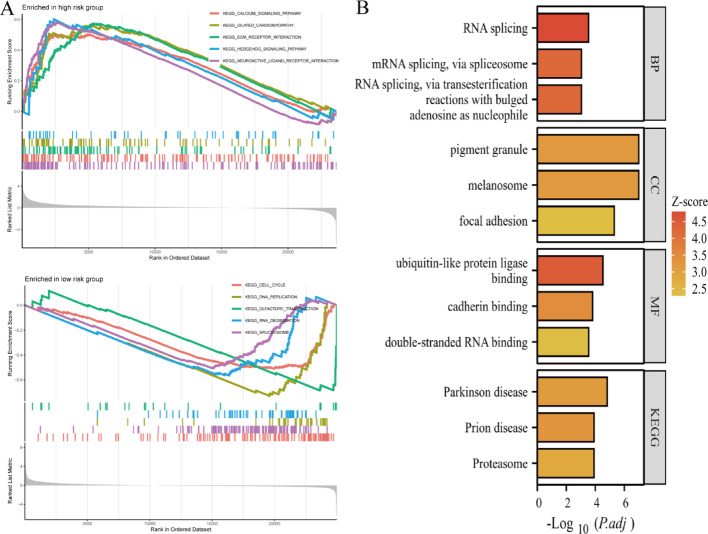
Figure 5A presents dual GSEA plots for genes enriched in high-risk and low-risk cohorts. High-risk group enrichment displays enrichment scores for significantly upregulated gene sets. Enrichment scores (y-axis) indicate gene set overrepresentation in ranked gene lists. Gene rank order appears on the x-axis. Colored lines represent different gene sets, with peaks showing maximum enrichment points. Low-risk group enrichment shows similar information for enriched gene sets. Layout and interpretation mirror the high-risk plot, emphasizing distinct biological processes active in low-risk cohorts. Figure 5B summarizes pathway analysis results, displaying significantly enriched biological processes (BP), cellular components (CC), molecular functions (MF), and KEGG pathways. RNA splicing via transesterification reactions with bulged adenosine, pigment granule and melanosome encompassing focal adhesion, ubiquitin-like protein ligase binding including cadherin binding and double-stranded RNA binding, Parkinson’s disease, prion disease, and proteasome pathways (Fig. 5B).
Fig. 5.
Biological processes and pathways associated with different risk groups. A Gene Set Enrichment Analysis (GSEA) plots identify pathways and biological processes that are significantly enriched in high-risk and low-risk groups. B Bar plots of functional enrichment analysis summarize the results of functional enrichment analysis, highlighting key biological processes, cellular components, molecular functions, and pathways
Gene expression comparative analysis and network interactions
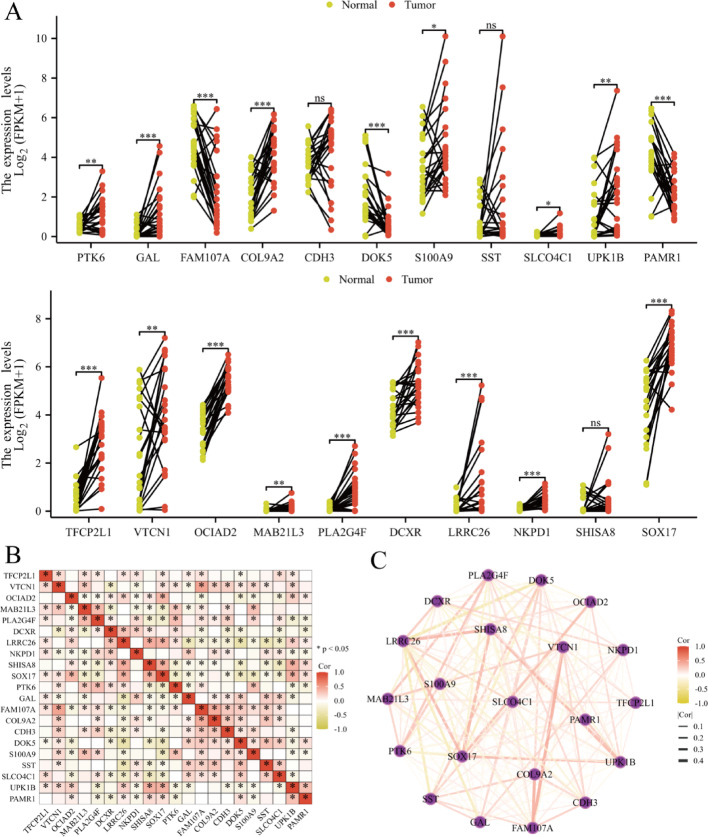
Paired box plots compare gene expression levels between normal (yellow) and tumor (red) tissues. Connected dots represent individual sample comparisons. Asterisks mark significant expression differences, with “***” indicating high statistical significance. Genes including PTK6, GAL, and FAM107A demonstrate notable normal-tumor expression differences (Fig. 6A). Correlation heatmap illustrates relationships between analyzed gene expression levels. Color gradients represent correlation strength, with red indicating strong positive correlations and green showing negative correlations. Correlation significance is marked by asterisks (Fig. 6B). Network diagram visualizes gene interactions based on correlation coefficients. Nodes represent individual genes, while edges indicate significant correlations. Edge color and thickness reflect correlation strength, with darker, thicker lines representing stronger correlations (Fig. 6C).
Fig. 6.
Analyze gene expression differences between normal and tumor tissues, along with correlation and network analyses. A Differential gene expression analysis compare the expression levels of specific genes between normal and tumor samples. B Correlation heatmap show the correlation between the expression levels of the selected genes. C Gene co-expression network visualize the co-expression relationships among the selected genes
PTK6/GAL gene expression in cell lines
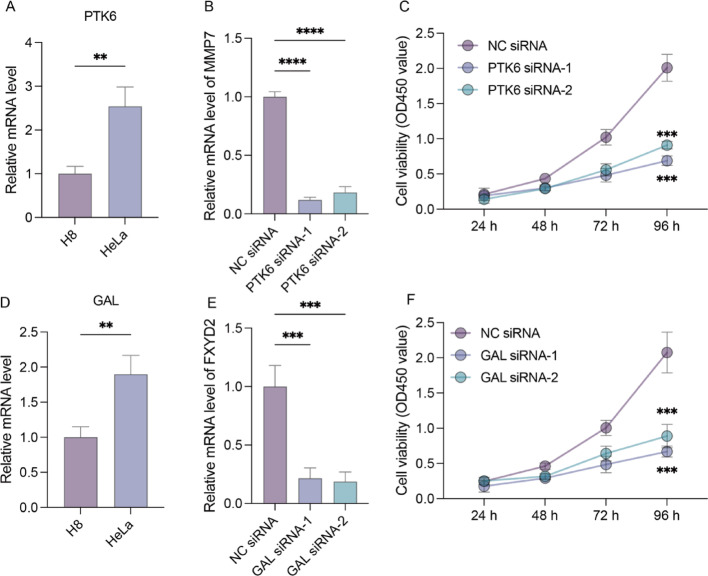
Quantitative RT-qPCR analysis examined PTK6/GAL gene expression in H8 and HeLa cell lines. Compared to H8 cells, PTK6/GAL expression levels were significantly elevated in HeLa cells, suggesting involvement in cervical cancer development regulation (Figs. 7A, D). siRNA design targeted each gene for mRNA knockdown in HeLa cells (Figs. 7B, E). Proliferation assays demonstrated that PTK6/GAL mRNA knockdown effectively reduced HeLa cell proliferation compared to controls (Figs. 7C, F).
Fig. 7.
The expression of PTK6/GAL gene in the H8 and HeLa cell lines. A, D, Relative human PTK6/GAL mRNA expression measured by RT-qPCR in the H8 and HeLa cell lines (n = 3 biological replicates). B, E, Relative human PTK6/GAL mRNA expression measured by RT-qPCR in the HeLa cell line after specified treatments (n = 3 biological replicates). C, F, Quantification of cell proliferative capacity in the HeLa cell line after specified treatments (n = 3 biological replicates)
Drug sensitivity and mRNA expression correlations
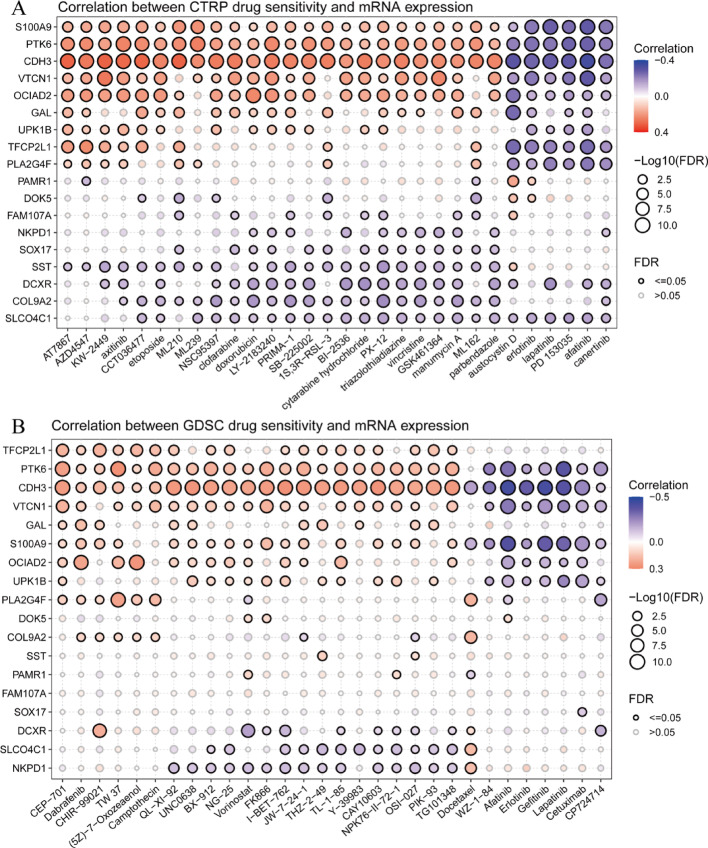
Figure 8A presents bubble plots showing correlations between gene mRNA expression and drug sensitivity from CTRP database. The x-axis displays various drugs, while the y-axis lists genes including S100A9, PTK6, and CDH3. Bubble colors represent correlation coefficients, with red indicating positive correlations and blue showing negative correlations. Bubble size reflects -log10 FDR values, indicating correlation significance. Larger bubbles represent more significant correlations. Black-outlined bubbles denote FDR ≤ 0.05 correlations, highlighting significant interactions. Figure 8B displays similar bubble plots from GDSC database. Layout and interpretation parallel Panel A, with drugs on x-axis and genes on y-axis. Correlation and significance follow identical color-coding and sizing, providing insights into gene expression-based drug sensitivity prediction.
Fig. 8.
Explore the correlation between drug sensitivity and mRNA expression. A and B panels provide a comprehensive analysis of the relationship between gene expression and drug sensitivity in cancer cells. By comparing data from two different drug sensitivity datasets (CTRP and GDSC)
Genomic and epigenomic factors in cancer prognosis
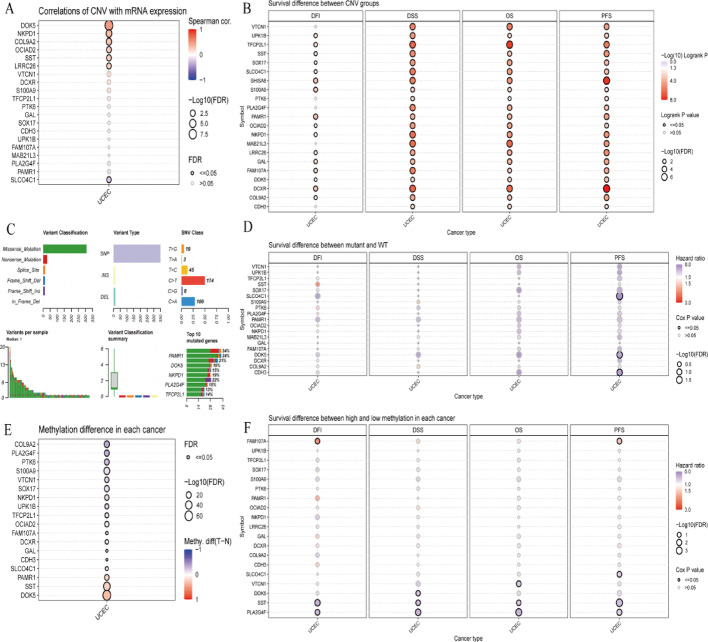
Figure 9A illustrates correlations between copy number variations and mRNA expression across genes. Figure 9B demonstrates survival differences between differentially methylated region groups. Figure 9C provides mutation classification and frequency overview across cancer types. The chart displays mutation distributions, highlighting common mutations per cancer type. Figure 9D presents bubble plots illustrating survival differences between mutant and wild-type groups across cancer types and genes. Figure 9E shows bubble plots displaying methylation differences for specific genes across cancers. Figure 9F examines survival differences between high and low methylation groups within cancer types.
Fig. 9.
Various genomic and epigenomic factors in relation to cancer prognosis and gene expression. A shows how CNVs correlate with gene expression. B highlights the impact of CNVs on survival outcomes. C provides a mutation overview. D compares survival between mutant and WT groups. E analyzes methylation differences. F evaluates the impact of methylation on survival
Gene expression and immune cell infiltration correlations
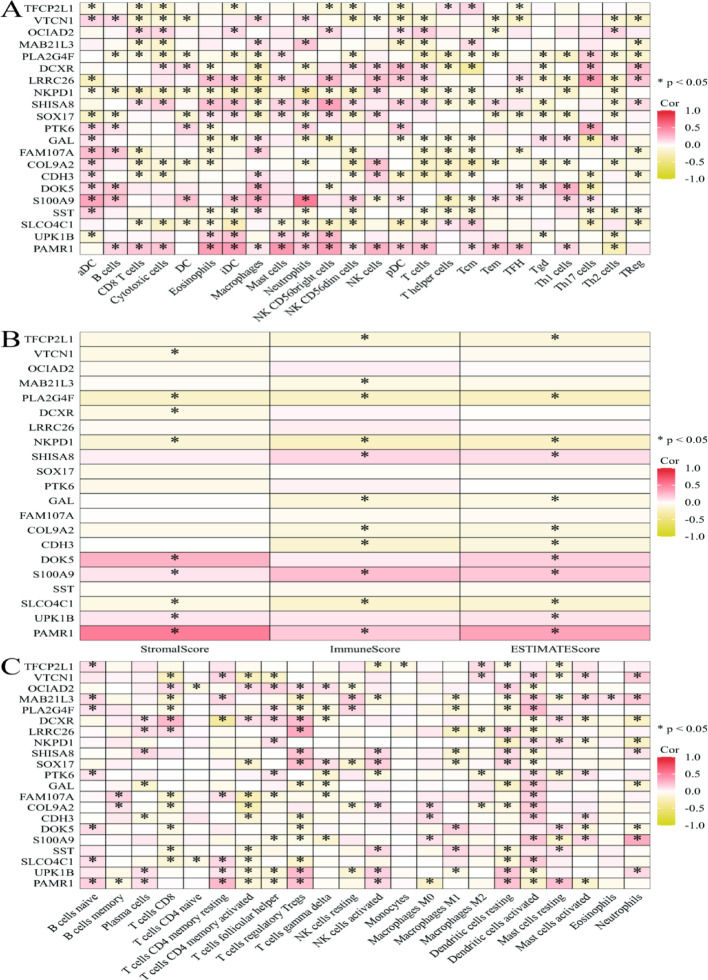
Figure 10A displays correlations between gene expression and immune cell infiltration levels. The x-axis lists immune cell types including B cells, T cells, macrophages, and NK cells. The y-axis presents genes such as TPCN1, VTCN1, and S100A9. Color gradients represent correlation coefficients, with red indicating positive correlations and yellow showing negative correlations. Figure 10B presents correlations between gene expression and StromalScore, ImmuneScore, and ESTIMATEScore. Figure 10C provides similar heatmap analysis focusing on different immune cell types and additional genes. The x-axis includes various immune cell types and T cell subsets, dendritic cells, and neutrophils. The y-axis lists genes including TPCN1, VTCN1, and S100A9. Color gradients represent correlation coefficients with identical color schemes.
Fig. 10.
The correlation between gene expression and immune cell infiltration. A Highlights correlations with various immune cells, suggesting potential roles in immune modulation. B Shows how gene expression correlates with stromal and immune components, indicating their influence on the tumor microenvironment. C Offers a detailed view of correlations with specific immune cell subtypes, providing deeper insights into immune interactions
Single-cell RNA sequencing cell clustering and composition
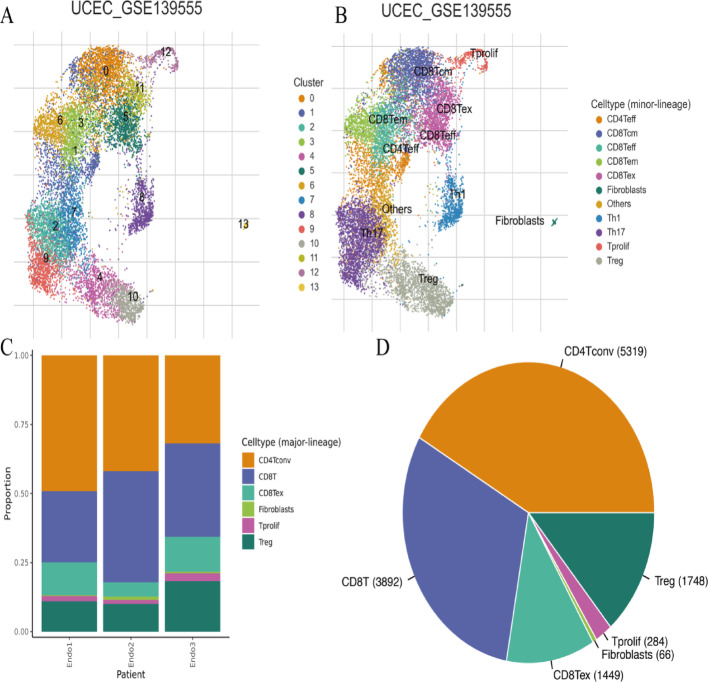
Figure 11A shows cell clustering based on gene expression profiles. Individual points represent single cells, with colors indicating distinct clusters. Numerical cluster labels identify distinct cell populations within the dataset. Figure 11B presents UMAP plots with cell type annotations. Colors represent different cell types including CD8T cells, CD4Tconv cells, fibroblasts, and others. This visualization provides tumor microenvironment cellular composition insights. Figure 11C displays bar plots showing major cell lineage proportions across patients. The x-axis lists patient samples, while the y-axis indicates cell type proportions. Colors correspond to major lineages including CD8T cells, CD4Tconv cells, fibroblasts, and Tregs. Figure 11D presents pie charts illustrating overall cell type distribution. Each slice represents individual cell types, with size indicating proportional representation. Major cell types include CD4Tconv, CD8T, Tregs, and fibroblasts.
Fig. 11.
Cell clustering and composition by single-cell RNA sequencing. A Shows the clustering of cells based on gene expression, indicating diversity in cell populations. B Annotates clusters with specific cell types, providing insights into the functional roles of these cells. C Highlights the variability in cell type proportions across different patients, indicating patient-specific immune landscapes. D Summarizes the overall distribution of cell types, showing the predominance of certain immune cells
Single-cell gene expression analysis
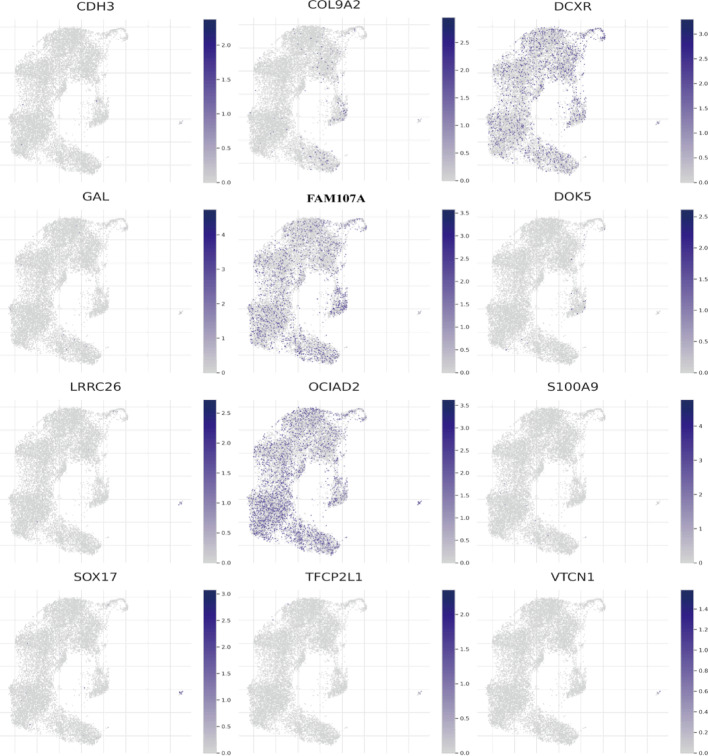
These visualizations illustrate spatial gene expression distribution, providing insights into functional roles and potential cellular subpopulations. This information proves crucial for understanding gene-specific contributions to cellular behavior and disease processes. Analysis includes genes CDH3, COL9A2, DCXR, GAL, FAM107A, DOK5, LRRC26, OCIAD2, S100A9, SOX17, TFCP2L1, and VTCN1. Each UMAP plot represents individual cells as dots, with gene expression levels indicated by color intensity (Fig. 12).
Fig. 12.
The expression of specific genes across cells in a single-cell RNA sequencing dataset. These UMAP plots provide a visual representation of the expression patterns of various genes across a dataset of cells. By examining these plots, one can identify which genes are highly expressed in specific cell clusters, which can provide insights into the roles of these genes in different cell types
Discussion
The development of cervical carcinoma may be linked to particular molecular and environmental determinants that share common pathways with endometrial physiology and reproductive health preservation. Both pathological states involve the immune microenvironment as a fundamental element [23, 24]. Disrupted immune regulation can lead to impaired implantation processes while concurrently facilitating carcinogenesis through modified interactions between malignant cells and immune components. We established a novel prognostic system for cervical cancer by incorporating genes associated with immune cell infiltration, which constitutes a pioneering investigative strategy. These genetic factors, initially recognized for their roles in reproductive biology, have emerged as significant contributors to malignant transformation and tumor advancement, as evidenced by our research outcomes.
Through gene set enrichment analysis, we identified contrasting pathway activation signatures distinguishing high-risk from low-risk patient groups. Patients classified as high-risk displayed enhanced activity in molecular pathways characteristic of tumor aggressiveness, particularly those governing cellular replication and motility processes. In contrast, the low-risk cohort showed preferential activation of pathways associated with positive prognostic indicators, notably cellular attachment mechanisms and immunological response networks. These findings highlight the critical role of particular biological mechanisms in malignant behavior, especially processes related to RNA processing and cell-matrix interactions, thereby revealing promising avenues for therapeutic intervention.
Protein tyrosine kinase 6 (PTK6), also known as BRK (breast tumor kinase), functions as a cytoplasmic tyrosine kinase involved in multiple cellular regulatory networks [25–27]. This enzymatic protein facilitates malignant cell expansion and multiplication by triggering signaling networks that accelerate cell division cycles. PTK6 promotes cellular migration and invasive capacity, thereby supporting metastatic spread through regulation of cytoskeletal organization and adhesive properties. The protein demonstrates contextual versatility in its function, either stimulating or inhibiting programmed cell death depending on the specific cellular context and tumor characteristics. PTK6 forms functional relationships with numerous signaling effectors, affecting crucial molecular cascades such as EGFR, HER2, and STAT3 pathways, all of which are fundamental to malignant transformation and disease advancement. Due to its involvement in oncogenic processes, PTK6 represents an attractive target for therapeutic intervention, with current investigations concentrating on the development of specific inhibitory compounds designed to neutralize its cancer-promoting functions.
Expression analysis revealed substantial differences in PTK6 and GAL levels when comparing healthy cervical tissue with malignant specimens, suggesting their critical involvement in cervical carcinogenesis. In addition to differential expression patterns, network correlation studies uncovered important gene interaction networks and identified key regulatory relationships that may drive disease progression. Elucidating these molecular connections could advance biomarker discovery for early detection strategies and tumor monitoring applications. The correlation between these genes’ expression profiles and pharmaceutical sensitivity profiles in CTRP and GDSC repositories indicates their potential as predictive markers for treatment response. Establishing these genetic factors as therapeutic response indicators represents a significant advancement for individualized cancer care protocols. Such molecular profiling could optimize drug selection strategies, potentially enhancing treatment efficacy while reducing toxicity profiles.
We discovered complex regulatory mechanisms involving copy number variations and differentially methylated regions that govern both genetic and epigenetic control of gene expression and clinical outcomes. These observations suggest that comprehensive prognostic models should incorporate both hereditary and epigenetic variables. Copy number analysis reveals oncogenic mechanisms mediated by gene dosage effects, while DNA methylation studies provide insights into transcriptional regulation and identify novel therapeutic possibilities.
Analysis of immune cell populations within tumors revealed that the composition of the tumor microenvironment significantly influences disease prognosis in our investigation. The interplay between genetic expression patterns and immunological activity identifies potential targets for immune-based therapies and underscores the significance of immune characterization in patient stratification [28–30]. The effectiveness of precision molecular therapies targeting cervical cancer-related oncogenes may be influenced by their crosstalk with particular immune cell subsets, making this knowledge essential for understanding disease progression pathways and resistance mechanism development. High-resolution single-cell transcriptomic analysis uncovered the cellular diversity within tumor ecosystems, enhancing our comprehension of intratumoral communication networks and facilitating the design of precision treatment strategies targeting specific genetic signatures and cell populations that respond to oncogenic signals. This detailed cellular analysis allows identification of minority cell populations that promote disease advancement and contribute to treatment resistance.
Limitations
Our research presents certain constraints that warrant consideration. Initially, our analysis predominantly utilized publicly available repositories including TCGA and GEO, potentially introducing sampling biases and restricting the applicability of our findings across diverse patient populations. Additionally, despite employing multiple validation datasets, our study lacked access to extensive prospective clinical trials necessary to confirm the practical predictive performance of our developed model.
Conclusion
In summary, this investigation highlights the potential of incorporating immune profiling to strengthen cervical cancer prognostic models. Through enhanced understanding of the molecular and immunological landscape, we establish foundations for personalized risk assessment and targeted therapeutic intervention strategies.
Author contributions
F.Z. wrote the main manuscript text and H.Z. prepared figures1-3. L.Y. prepared figures4-7. Y.D. prepared figures8-10.C.H. prepared figures11-12. All authors reviewed the manuscript.
Funding
This work was supported by Medical Science and Technology Project of Zhejiang Province(No.2025KY196).
Data availability
The datasets generated and analyzed in the current study are available in the TCGA repositories, and GEO Datasets.
Declarations
Ethics approval
Not available.
Consent to publish
All authors reviewed and approved the final manuscript.
Consent to participate
Not available.
Competing interests
The authors declare no competing interests.
Footnotes
Publisher’s note
Springer Nature remains neutral with regard to jurisdictional claims in published maps and institutional affiliations.
References
- 1.Dirakwaranon W, Suwannarurk K, Chitkoolsamphan Y, Wisarnsirirak P, Bhamarapravatana K, Pattaraarchachai J. Sexual dysfunction in patient’s diagnosed with cervical cancer in comparison to the healthy female population. Asian Pac J Cancer Prev. 2024;25(12):4391–6. [DOI] [PMC free article] [PubMed] [Google Scholar]
- 2.Shamsutdinova A, Kulkayeva G, Karashutova Z, Tanabayev B, Tanabayeva S, Ibrayeva A, Fakhradiyev I. Analysis of the effectiveness and coverage of breast, cervical, and colorectal cancer screening programs in Kazakhstan for the period 2021–2023: regional disparities and coverage dynamics. Asian Pac J Cancer Prev. 2024;25(12):4371–80. [DOI] [PMC free article] [PubMed] [Google Scholar]
- 3.Wu Z, Lu L, Xu C, Wang D, Zeng B, Liu M. Development and external validation of a multi-task feature fusion network for CTV segmentation in cervical cancer radiotherapy. Radiother Oncol 2024:110699. [DOI] [PubMed]
- 4.Guo S, Jiang H, Deng Y, Dong Y, Yin A, Wang Q, Lan Q, Zhang Y, Xu C. Reduced 2,4-dienoyl-CoA reductase 1 is served as an unfavorable biomarker and is related to immune infiltration in cervical cancer. J Obstet Gynaecol Res. 2023;49(10):2475–86. [DOI] [PubMed] [Google Scholar]
- 5.Wei HF, Zhang RF, Zhao YC, Tong XS. SERPINB7 as a prognostic biomarker in cervical cancer: association with immune infiltration and facilitation of the malignant phenotype. Heliyon. 2023;9(9):e20184. [DOI] [PMC free article] [PubMed] [Google Scholar]
- 6.Zhao YC, Wang TJ, Qu GH, She LZ, Cui J, Zhang RF, Qu HD. TPM3: a novel prognostic biomarker of cervical cancer that correlates with immune infiltration and promotes malignant behavior in vivo and in vitro. Am J Cancer Res. 2023;13(7):3123–39. [PMC free article] [PubMed] [Google Scholar]
- 7.Kolasseri AE. Comparative study of machine learning and statistical survival models for enhancing cervical cancer prognosis and risk factor assessment using SEER data. Sci Rep. 2024;14(1):22203. [DOI] [PMC free article] [PubMed] [Google Scholar]
- 8.Song H, Lee HY, Oh SA, Seong J, Hur SY, Choi YJ. Application of machine learning algorithms for risk stratification and efficacy evaluation in cervical cancer screening among the ASCUS/LSIL population: evidence from the Korean HPV cohort study. Cancer Res Treat 2024. [DOI] [PMC free article] [PubMed]
- 9.Zhao H, Wang Y, Sun Y, Wang Y, Shi B, Liu J, Zhang S. Hematological indicator-based machine learning models for preoperative prediction of lymph node metastasis in cervical cancer. Front Oncol. 2024;14:1400109. [DOI] [PMC free article] [PubMed] [Google Scholar]
- 10.Bansal R, Sener H, Ganguly A, Shields JA, Shields CL. Metastasis-free survival of uveal melanoma by tumour size category based on the cancer genome atlas (TCGA) classification in 1001 cases. Clin Exp Ophthalmol 2024. [DOI] [PubMed]
- 11.Zhang H, Zhuo C, Lin R, Ke F, Wang M, Yang C. Identification and verification of key genes in colorectal cancer liver metastases through analysis of Single-Cell sequencing data and TCGA data. Ann Surg Oncol 2024. [DOI] [PMC free article] [PubMed]
- 12.Dai H, Chung K, Liang F, Xie Y, Zhang Q, Qiu M, Yang H, Zhou J, Feng Y, Du Z. Safety and aesthetic outcomes of double purse-string suture nipple reconstruction in early breast cancer patients undergoing nipple resection and endoscopic skin-sparing mastectomy with breast reconstruction. Front Oncol. 2024;14:1462850. [DOI] [PMC free article] [PubMed] [Google Scholar]
- 13.Mehryary F, Nastou K, Ohta T, Jensen LJ, Pyysalo S. STRING-ing together protein complexes: corpus and methods for extracting physical protein interactions from the biomedical literature. Bioinformatics 2024, 40(9). [DOI] [PMC free article] [PubMed]
- 14.Yuan QL, Xu X, Douglas JF, Xu WS. Understanding relaxation in the Kob-Andersen liquid based on entropy, string, shoving, localization, and parabolic models. J Phys Chem B 2024. [DOI] [PubMed]
- 15.Li H, Yang B, Wang C, Li B, Han L, Jiang Y, Song Y, Wen L, Rao M, Zhang J, et al. Construction of an interpretable model for predicting survival outcomes in patients with middle to advanced hepatocellular carcinoma (>/=5 cm) using lasso-cox regression. Front Pharmacol. 2024;15:1452201. [DOI] [PMC free article] [PubMed] [Google Scholar]
- 16.Niu X, Chang T, Zhang Y, Liu Y, Yang Y, Mao Q. Variable screening and model construction for prognosis of elderly patients with lower-grade gliomas based on LASSO-Cox regression: a population-based cohort study. Front Immunol. 2024;15:1447879. [DOI] [PMC free article] [PubMed] [Google Scholar]
- 17.Lu Q, Jiang Y, Cang X, Pan J, Shen X, Tang R, Zhou Z, Zhu Y. Study of the immune infiltration and Sonic Hedgehog expression mechanism in synovial tissue of rheumatoid Arthritis-Related interstitial lung disease under machine learning CIBERSORT algorithm. Mol Biotechnol 2024. [DOI] [PubMed]
- 18.Xu D, Chu M, Chen Y, Fang Y, Wang J, Zhang X, Xu F. Identification and verification of ferroptosis-related genes in the pathology of epilepsy: insights from CIBERSORT algorithm analysis. Front Neurol. 2023;14:1275606. [DOI] [PMC free article] [PubMed] [Google Scholar]
- 19.Arab A, Kashani B, Cordova-Delgado M, Scott EN, Alemi K, Trueman J, Groeneweg G, Chang WC, Loucks CM, Ross CJD, et al. Machine learning model identifies genetic predictors of cisplatin-induced ototoxicity in CERS6 and TLR4. Comput Biol Med. 2024;183:109324. [DOI] [PubMed] [Google Scholar]
- 20.C PR, Krishnan M, Raveendran V, Chaudhari L, Laskar S. Assessment of pencil beam scanning proton therapy beam delivery accuracy through machine learning and log file analysis. Phys Med. 2024;127:104854. [DOI] [PubMed] [Google Scholar]
- 21.Tasis A, Papaioannou NE, Grigoriou M, Paschalidis N, Loukogiannaki K, Filia A, Katsiki K, Lamprianidou E, Papadopoulos V, Rimpa CM et al. Single-cell analysis of bone marrow CD8 + T cells in myeloid neoplasms reveals pathways associated with disease progression and response to treatment with Azacitidine. Cancer Res Commun 2024. [DOI] [PMC free article] [PubMed]
- 22.Zhang B, Zhang B, Wang T, Huang B, Cen L, Wang Z. Integrated bulk and single-cell profiling characterize sphingolipid metabolism in pancreatic cancer. BMC Cancer. 2024;24(1):1347. [DOI] [PMC free article] [PubMed] [Google Scholar]
- 23.Agarwal N, Mishra PK, Das S, Kumar A, Sharma M, Panwar D, Rai N, Bakshi AK, Tiwari P, Mishra PR. Emerging trends in cervical cancer treatment: transitioning from traditional to innovative delivery strategies. Int J Pharm 2025:125878. [DOI] [PubMed]
- 24.Ndjengue Bengone BC, Toniolo J, Filankembo Kava AC, Ngoungou EB, Belembaogo E, Preux PM. Psychological repercussions of breast or uterine cervical cancer disclosure to women in Gabon. PLoS ONE. 2025;20(6):e0326378. [DOI] [PMC free article] [PubMed] [Google Scholar]
- 25.Li J, Yang N, Tian X, Ouyang L, Jiang M, Zhang S. Interference of PTK6/GAB1 signaling inhibits cell proliferation, invasion, and migration of cervical cancer cells. Mol Med Rep 2022, 26(3). [DOI] [PMC free article] [PubMed]
- 26.Lin L, Gong S, Deng C, Zhang G, Wu J. PTK6: an emerging biomarker for prognosis and immunotherapeutic response in clear cell renal carcinoma (KIRC). Heliyon. 2024;10(7):e29001. [DOI] [PMC free article] [PubMed] [Google Scholar]
- 27.Xiong RH, Yang SQ, Li JW, Shen XK, Jin LM, Chen CY, Yue YT, Yu ZC, Sun QY, Jiang W, et al. Identification of immune-associated biomarker for predicting lung adenocarcinoma: bioinformatics analysis and experiment verification of PTK6. Discov Oncol. 2024;15(1):102. [DOI] [PMC free article] [PubMed] [Google Scholar]
- 28.Su L, Xu R, Ren Y, Zhao S, Song L, Meng C, Liu W, Zhou X, Du Z. 5-Methylcytosine methylation predicts cervical cancer prognosis, shaping immune cell infiltration. J Int Med Res. 2025;53(4):3000605251328301. [DOI] [PMC free article] [PubMed] [Google Scholar]
- 29.Sun F, Sun Y, Tian H. An Immunogenic cell Death-Related gene signature predicts the prognosis and immune infiltration of cervical cancer. Cancer Inf. 2025;24:11769351251323239. [DOI] [PMC free article] [PubMed] [Google Scholar]
- 30.Xu F, Lai J. Commentary: immune cell infiltration and prognostic index in cervical cancer: insights from metabolism-related differential genes. Front Immunol. 2024;15:1446741. [DOI] [PMC free article] [PubMed] [Google Scholar]
Associated Data
This section collects any data citations, data availability statements, or supplementary materials included in this article.
Data Availability Statement
The datasets generated and analyzed in the current study are available in the TCGA repositories, and GEO Datasets.


