

Abstract
This research aims to optimize the fabrication of polyethersulfone (PES)-based composite hollow fiber membranes via phase inversion. For this purpose, MgO-modified activated carbon (AC) particles were synthesized and incorporated into the polymer matrix. High-resolution transmission electron microscopy (HR-TEM), scanning electron microscopy (SEM), and X-ray diffraction (XRD) were utilized to examine the morphological and chemical properties of the AC-MgO particles. To optimize the fabrication process, the effects of four key parameters: AC-MgO particle concentration (0.09–0.36 wt%), bore fluid flow rate (3.5–9.5 ml/min), dope solution flow rate (1.5–3.5 ml/min), and air gap distance (2–42 cm), were analyzed using response surface methodology (RSM) with a central composite design. The performance of the membranes was assessed in terms of pure water permeability (PWP). The results of experimental tests conducted under the optimal conditions obtained using the RSM method for particle concentration and process parameters were in close agreement with the model predictions, confirming the model’s accuracy. Moreover, it was found that particle concentration and air gap distance significantly influenced membrane performance. The AC-MgO particles significantly enhanced membrane properties by reducing the water contact angle, indicating improved hydrophilicity, and promoting the formation of a more porous membrane structure.
Keywords: Hollow fiber membrane, Morphology, AC-MgO particles, Spinning parameters, RSM
Subject terms: Polymers, Polymers
Introduction
Membrane technology plays a crucial role in a wide range of applications, including hemodialysis, pharmaceutical purification, water treatment, gas separation, and food processing1. The growing demand for efficient separation processes has driven the development of innovative, high-performance membranes2. The selection of materials and the structural design of a membrane critically determine its separation performance, with permeate and selectivity being two key parameters governing membrane efficiency3,4. Hollow fiber membranes (HFMs), which offer high surface area-to-volume ratios and excellent mechanical properties, are a predominant choice for ultrafiltration processes5. Spinning is a widely employed fabrication method for producing hollow fibers with desired structural properties. Studies have demonstrated that spinning parameters critically influence pore distribution and membrane geometry, consequently affecting the membrane’s mechanical strength, separation performance, rejection efficiency, and permeability characteristics6,7. Polyethersulfone (PES) is a polymeric material that is widely used in separation processes due to its excellent thermal, chemical, and mechanical stability7–9. PES-based membranes are naturally hydrophobic; therefore, they require modification to improve their hydrophilicity and thus increase the efficiency of the separation process10. The incorporation of nano/microparticles into polymer membranes is a promising method to enhance their hydrophilicity11–14. In this regard, various organic and inorganic fillers such as ZnO, Al2O3, SiO2, TiO2, MgO, carbon nanotubes (CNTs), graphene oxide (GO), activated carbon (AC), two dimensional transition metal carbides and nitrides (MXenes), and metal-organic frameworks (MOFs) have been incorporated into polymeric membranes so far15–23. Among them, magnesium oxide nanoparticles have attracted significant interest owing to their cost-effectiveness, wide band gap, and large surface area, which can significantly enhance the filtration performance and selectivity of the membranes. Additionally, MgO nanoparticles can overcome the challenge of non-uniform distribution, which is commonly encountered when using nanoparticles in polymer matrices, by exhibiting a more homogeneous dispersion in dope solutions. This results in membranes with relatively uniform structural properties22,23. It is noteworthy that incorporating oxide nanoparticles into polymer membranes alters pore size and morphology, thereby enhancing membrane permeability24,25. Additionally, the presence of these nanoparticles improves the mechanical strength of the membranes26. For instance, Kumar et al.27 investigated the effect of ZnO-MgO nanoparticle concentration in dope solution on the characteristic features of polyphenylsulfone/cellulose acetate derivative hollow fiber membranes. The results showed that hydrophilicity and pure water permeability (PWP) of modified membranes increased with an increase in the dosage of ZnO-MgO in the dope solution. Said et al.28 showed that incorporating iron oxide nanoparticles into polysulfone membranes improved surface hydrophilicity, consequently increasing the PWP of the membranes. In fact, these nanoparticles enhanced the interaction of the membrane with water. Kallem et al.29 demonstrated that the addition of carbon-based materials within PES membranes significantly enhanced the PWP as a result of the reduction in water contact angle. Activated carbon has been widely utilized in separation processes, for removing both organic and inorganic impurities, owing to its exceptional antifouling properties, high surface area porosity, and tunable pore structure29,30. In particular, AC exhibits strong adsorption effects towards uremic toxins, which further highlights its potential for toxin removal applications31. Moreover, incorporating AC into polymeric matrices has been demonstrated to significantly enhance membrane hydrophilicity, thereby improving water permeation performance32,33.
It has been shown that, besides the composition of membranes, production parameters such as air gap distance, polymer dope rate, and bore fluid rate have a great influence on the performance and structure of hollow fiber membranes. Optimization of these parameters is essential for identifying the optimal conditions for producing high-performance membranes34. For this purpose, statistical analysis such as response surface methodology (RSM) might be helpful. These methods significantly reduce the complexity and challenges associated with mathematical process modeling, which typically requires in-depth process knowledge and complex numerical simulations, while maintaining high accuracy and minimizing computational costs35.
From the above literature review, it is evident that adding AC and MgO individually into polymeric matrices enhances membrane performance. Therefore, fabricating composite membranes that incorporate both AC and MgO (as AC-MgO composite particles) is expected to combine their complementary features, thereby significantly improving membrane performance in various separation processes. Nevertheless, to the best of our knowledge, no study has yet reported the use of AC-MgO particles and their potential benefits on the properties and performance of hollow fiber membranes. Moreover, the incorporated particles concentration significantly impacts the optimal spinning parameters by affecting the solution’s physical properties and membrane formation36. Hence, investigating their combined effects and simultaneously optimizing both spinning parameters and particle concentration are essential for developing membranes with enhanced structure and performance. Hence, in the current study, composite membranes were developed by incorporating AC-MgO particles into PES membranes via the phase inversion method for ultrafiltration applications. The hydrophilicity and PWP of the developed membranes were evaluated using contact angle measurements and permeation test, respectively. Furthermore, the influences of four key variables air gap distance, dope solution flow rate, bore fluid flow rate, and dope solution concentration on the performance and morphological characteristics of PES-AC/MgO hollow fiber membranes were investigated. The preparation conditions for asymmetric hollow fiber membranes with permeable structures were optimized through the application of RSM.
Materials and methods
Chemicals and materials
Polyethersulfone (ULTRASON E 6020P) was obtained from Badische Anilin- & Soda-Fabrik (BASF), Germany (average molecular weight = 75000 g/mol, polydispersity index = 3.91). N-methyl-2-pyrrolidine (NMP, purity = 98%) was purchased from Samchon Company, South Korea. Magnesium chloride hexahydrate (MgCl2.6H2O, 98%) was purchased from Kimia Mavad Co., Iran. The commercial activated carbon used in this study was purchased from Merck, Germany. Ultra-high purity nitrogen gas (N₂, 99.999%) used in the synthesis was obtained from Abu Qadareh Company, Iran. Deionized water was used as internal and external coagulant, as well as in the PWP measurements.
Particles synthesis procedure
To synthesize the AC-MgO nanocomposite particles, first, 2.00 g of activated carbon was dispersed in 100 ml of deionized water. Magnesium chloride hexahydrate (1.00 g) was then slowly added to the suspension and stirred magnetically for 3 h at ambient temperature to ensure complete dissolution and homogeneity. The resulting suspension was washed thrice with deionized water. The purified solid was dried overnight in an oven at 100 °C. Then, it was calcined at 450 °C for 4 h under a flow of ultra-high purity N2 gas (99.999%) to obtain AC-MgO nanocomposite with a magnesium oxide content of 10 wt%. The morphological and chemical characteristics of the AC-MgO nanocomposite were evaluated using high-resolution transmission electron microscopy (HR-TEM), scanning electron microscopy (SEM), and X-ray diffraction (XRD) techniques.
Preparation of membrane dope solutions
For the neat PES membrane, the PES polymer was initially dried at 80 °C for 24 h to eliminate excess moisture. Then, an 18 wt% PES casting solution was prepared by dissolving the polymer in NMP solvent. For the preparation of composite membranes, the particles were dispersed in NMP. A homogeneous dispersion was achieved by ultrasonication for 10 min using a probe sonicator. Subsequently, PES was added to the particle dispersion and the solution was placed in an oven at 80 °C and magnetically stirred for 24 h to ensure complete dissolution and homogeneity. Table 1 summarizes the concentrations of dope solutions prepared in this study.
Table 1.
The dope solutions compositions of neat and PES-AC/MgO membranes.
| Membrane | PES (wt%) | AC-MgO (wt%) | NMP (wt%) |
|---|---|---|---|
| Neat PES | 18 | 0 | 82 |
| PES-AC/MgO | 18 | 0.09 | 81.91 |
| PES- (0.18 wt%) AC/MgO | 18 | 0.18 | 81.82 |
| PES- (0.27 wt%) AC/MgO | 18 | 0.27 | 81.73 |
| PES- (0.36 wt%) AC/MgO | 18 | 0.36 | 81.64 |
Hollow fiber membrane fabrication
Hollow fiber membranes were prepared utilizing a stainless steel coaxial dual-orifice spinneret with an outer/inner diameter of 0.5/0.25 mm. Two syringe pumps were used to control the flow rates of the bore fluid and the dope solution. Figure 1 illustrates the experimental setup used in this study to fabricate hollow fiber membranes, which consisted of pumps, bore fluid and dope solution circuits, coagulation bath, guide rollers, spinneret, and a collector drum.
Fig. 1.

Schematic of the hollow fiber membrane preparation setup; (1) dope solution, (2) bore fluid, (3 and 4) syringe pumps, (5) spinneret, (6) air gap, (7) guide rollers, (8) collector, and (9) coagulation bath.
HFMs were prepared using a dry-jet wet-spinning process under steady-state conditions. A dope solution of neat and composite polymers was extruded from a spinneret, and deionized water was used as a bore fluid to form the lumen. The newly formed hollow fiber was initially exposed to an air gap for phase separation. Afterwards, the fibers were first placed in a coagulation bath at room temperature for 24 h, followed by treatment in another coagulation bath for 24 h to ensure complete solvent removal and morphological stabilization.
Study of membrane morphology and surface properties
The morphology of the fabricated membranes was characterized via SEM equipped with energy dispersive X-ray spectroscopy (EDS). Membrane thickness and pore size were determined from SEM images using ImageJ software (version 1.52v). Hydrophilicity was evaluated through water contact angle measurements performed with a JIKAN/CAG-10 goniometer. For these measurements, flat-sheet membranes were prepared, with three measurements taken per sample; reported values represent the average of these triplicate determinations. Surface roughness was characterized by atomic force microscopy (AFM) using a Multimode system equipped with a 30 μm × 30 μm scanner.
Membrane permeation measurements
The PWP of the manufactured hollow fiber membranes was measured using a single-fiber ultrafiltration experiment, as illustrated in Fig. 2. This experiment was designed to quantify the water transport characteristics of the membrane at specific operating conditions. It should be noted that a similar setup was already used to evaluate the permeability of polymeric hollow fibers37. Pure water was fed into the inside of the hollow fiber membrane using a peristaltic pump. Before starting the experiment, each fiber was subjected to 1.5 bar for 30 min to saturate the pores with water and reach a steady-state permeation. At a transmembrane pressure of 1.5 bar, the permeate of each sample was measured. To assess experimental variability, each measurement was repeated three times using different fiber samples. The PWP of membranes was calculated as follows:
 |
1 |
Fig. 2.
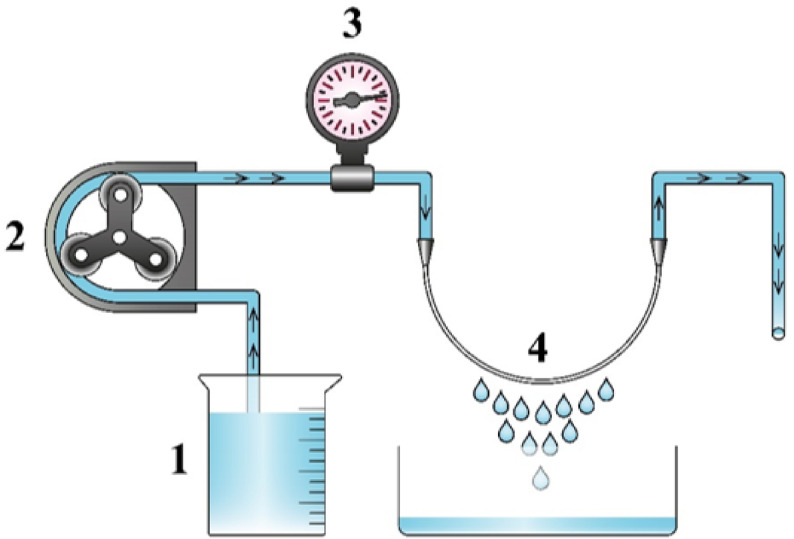
Schematic of the PWP experimental setup (1) feed, (2) peristaltic pump, (3) pressure gauge, and (4) hollow fiber membrane.
where  represents the permeate volume (
 ),
),  denotes the effective surface area of the membrane (
 ),
),  is the experimental time (
 ), and
  is the applied transmembrane pressure (
 ).
).
Design of experiments
RSM technique with central composite design was employed here to develop predictive models, assessing the effects of important variables on the performance of the hollow fiber membranes, and reducing the number of experimental trials. This technique could potentially reduce the effects of environmental noise, hence ensuring the delivery of robust and reliable experimental results38. In this study, the statistical analysis was performed using Design-Expert software (version 13.0.5.0, Stat-Ease Inc.) to develop a mathematical model and identify the input variables that influence membrane performance. The four key experimental parameters considered here are: AC-MgO concentration, air gap distance, dope solution flow rate, and bore fluid flow rate. Table 2 presents the experimental design matrix for the investigated variables, along with the corresponding measured permeation values as the response. The ranges used for the variables were determined based on initial screening experiments for the successful production of HFM samples.
Table 2.
Central composite design layout with the measured PWP values.
| Run | Dope solution flow rate (ml/min) | Bore fluid flow rate (ml/min) | Air gap distance (cm) | AC-MgO concentration (wt%) | PWP (L/m2.h.bar) | |
|---|---|---|---|---|---|---|
| S1 | 2.5 | 6.5 | 42 | 0.18 | 22.5862 ± 1.2501 | |
| S2 | 2.5 | 6.5 | 22 | 0.18 | 22.2255 ± 1.0532 | |
| S3 | 2.5 | 6.5 | 22 | 0.18 | 25.8787 ± 0.9345 | |
| S4 | 2.5 | 6.5 | 22 | 0.18 | 19.2058 ± 0.8548 | |
| S5 | 2.5 | 6.5 | 22 | 0.18 | 18.5656 ± 1.1521 | |
| S6 | 2.5 | 6.5 | 22 | 0.18 | 17.9255 ± 1.1658 | |
| S7 | 2.5 | 6.5 | 22 | 0.18 | 17.2853 ± 1.3812 | |
| S8 | 2.5 | 6.5 | 2 | 0.18 | 3.19596 ± 1.0259 | |
| S9 | 3.5 | 6.5 | 22 | 0.18 | 20.9336 ± 1.1721 | |
| S10 | 2.5 | 9.5 | 22 | 0.18 | 20.1812 ± 1.1259 | |
| S11 | 2.5 | 3.5 | 22 | 0.18 | 10.0456 ± 0.8441 | |
| S12 | 1.5 | 6.5 | 22 | 0.18 | 15.4562 ± 0.9548 | |
| S13 | 2 | 8 | 12 | 0.27 | 18.2158 ± 0.8521 | |
| S14 | 3 | 8 | 12 | 0.27 | 26.3672 ± 1.1597 | |
| S15 | 2 | 5 | 12 | 0.27 | 8.40641 ± 1.0025 | |
| S16 | 3 | 5 | 12 | 0.27 | 16.6301 ± 1.8546 | |
| S17 | 2 | 8 | 32 | 0.27 | 37.8696 ± 1.0234 | |
| S18 | 2 | 5 | 32 | 0.27 | 25.7778 ± 1.2255 | |
| S19 | 3 | 5 | 32 | 0.27 | 37.9751 ± 0.8155 | |
| S20 | 3 | 8 | 32 | 0.27 | 47.7107 ± 0.7544 | |
| S21 | 3 | 8 | 12 | 0.09 | 12.4712 ± 1.1288 | |
| S22 | 3 | 5 | 12 | 0.09 | 15.2051 ± 1.0033 | |
| S23 | 2 | 8 | 12 | 0.09 | 10.4522 ± 0.9547 | |
| S24 | 2 | 5 | 12 | 0.09 | 16.7426 ± 1.2537 | |
| S25 | 2 | 5 | 32 | 0.09 | 24.3416 ± 0.8546 | |
| S26 | 3 | 5 | 32 | 0.09 | 22.4909 ± 1.2351 | |
| S27 | 3 | 8 | 32 | 0.09 | 31.1026 ± 1.1565 | |
| S28 | 2 | 8 | 32 | 0.09 | 24.6475 ± 1.3021 | |
| S29 | 2.5 | 6.5 | 22 | 0.36 | 50.7385 ± 0.9658 | |
| S30 | 2.5 | 6.5 | 22 | 0 | 29.987 ± 1.2026 | |
Results and discussion
Morphological and structural characterization of AC and AC-MgO particles
Figure 3 shows the XRD patterns of activated carbon, pure MgO, and AC-MgO particles. The XRD pattern of pure MgO particles exhibits sharp characteristic peaks at 2θ angles of 36.8°, 42.7°, 62°, 74.2°, and 78.3°, corresponding to the (111), (200), (220), (311), and (222) planes, respectively39. The two broad peaks observed at around 22° and 44° in the XRD patterns of both pure AC and AC-MgO particles are attributed to the (100) and (101) diffraction planes of the carbon structure40. By comparing the diffraction patterns, it is seen that the XRD patterns of pure AC and the cubic crystalline structure of MgO are superimposed in the XRD pattern of the AC-MgO nanocomposite, indicating that the synthesis was successful.
Fig. 3.

X-ray diffraction patterns of pure MgO, AC, and AC-MgO particles.
Figure 4a shows the SEM image of activated carbon particles used in this study, indicating particles with a clear, crack-free, and smooth surface. The SEM micrograph and the corresponding EDS analysis from the AC-MgO nanocomposite particle are presented in Figs. 4b–d. As could be seen from Fig. 4b, a significant change in the surface morphology of the AC particles occurred after their modification with MgO nanoparticles. Additionally, the SEM image at higher magnification (Fig. 4c) confirms the presence of MgO nanoparticles on the nanocomposite surface, exhibiting a small spherical morphology and partial overlap with each other. From the EDS analysis results presented in Fig. 4d, it can be observed that the Mg and O elements were uniformly distributed, indicating that the MgO nanoparticles were dispersed well on the activated carbon.
Fig. 4.

SEM images of (a) AC powder, (b) AC-10 wt% MgO nanocomposites, (c) Fig. (b) at higher magnification, (d) EDS spectroscopy and EDS mapping elements of carbon, magnesium and oxygen of the AC–MgO-10% nanocomposite.
The microstructure of the AC-MgO nanocomposites was also revealed by TEM and selected area electron diffraction (SAED) images (Fig. 5a, b). The discontinuous ring pattern in the SAED image confirms the polycrystalline nature of MgO nanoparticles. The SAED image shows concentric rings corresponding to the (111), (200), (220), (311), and (222) reflections of MgO particles. HR-TEM imaging (Fig. 5c) reveals lattice fringes with spacings of 0.21 nm, which are attributed to (200). These results align well with the XRD data.
Fig. 5.

(a) TEM image showing the morphology and dispersion of AC-10 wt% MgO nanocomposites; (b) SAED pattern confirming the crystalline structure of MgO nanoparticles within the composite; (c) HR-TEM image revealing the lattice fringes and detailed nanostructure of the AC-10 wt% MgO nanocomposites.
Surface analysis of the membranes
Characterizing the surface properties of ultrafiltration membranes is essential for improving their performance for separation applications. In this study, the effect of adding AC-MgO particles on the surface properties of PES membranes was analyzed in terms of surface roughness and contact angles. As illustrated by the AFM images in Fig. 6, the surface roughness of the composite membranes is higher compared to the pristine PES membrane, with Ra values of 6.94 ± 0.125 nm and 16.59 ± 0.487 nm for the pristine PES and PES-AC/MgO membranes, respectively. The addition of particles resulted in a rougher surface, which facilitated filtration by increasing both the effective filtration area and pore size27. Figure 7 shows the contact angles of the pure PES membrane and the membrane containing 0.354 wt% AC-MgO. The results confirm an improvement in hydrophilicity after incorporation of AC-MgO particles into the membrane. This improvement resulted from the presence of polar functional groups (–OH and –COOH) on the surface of AC-MgO, which migrated toward the membrane surface during membrane formation and allowed greater interaction with water molecules41,42. Furthermore, as evident from the AFM results, the membrane roughness increased with the addition of particles, which could make the hydrophilic surface even more water-attracting43.
Fig. 6.

Surface roughness analysis of PES membranes containing (a) 0 wt% and (b) 0.354 wt% AC-MgO particles.
Fig. 7.

Water contact angle for PES based hollow fiber membranes.
Response surface methodology
Results of ANOVA
Summary of ANOVA results of the RSM model for PWP of the developed membranes is shown in Table 3. An F-value of 1.13 for lack of fit indicates that it is not significant relative to the pure error. Given that at the 95% confidence level, variables with p-values less than 0.05 are generally considered statistically significant44, the model is highly significant due to having a p-value less than 0.0001, while the lack-of-fit with a p-value of 0.47 is not significant. These results confirm that the model adequately fits the experimental data and is appropriate for predicting the response within the studied range of variables.
Table 3.
ANOVA results of RSM model for pure water permeability.
| Source | Sum of Squares | Degree of Freedom | Mean Square | F-value | p-value | |
|---|---|---|---|---|---|---|
| Model | 3151.00 | 14 | 225.07 | 19.24 | < 0.0001 | Significant |
| A-Dope solution rate | 123.55 | 1 | 123.55 | 10.56 | 0.0054 | |
| B-Bore fluid rate | 157.79 | 1 | 157.79 | 13.49 | 0.0023 | |
| C-Air gap distance | 1151.01 | 1 | 1151.01 | 98.38 | < 0.0001 | |
| D-Concentration | 442.06 | 1 | 442.06 | 37.78 | < 0.0001 | |
| AB | 5.56 | 1 | 5.56 | 0.4754 | 0.5010 | |
| AC | 5.99 | 1 | 5.99 | 0.5116 | 0.4854 | |
| AD | 69.42 | 1 | 69.42 | 5.93 | 0.0278 | |
| BC | 25.56 | 1 | 25.56 | 2.18 | 0.1601 | |
| BD | 107.54 | 1 | 107.54 | 9.19 | 0.0084 | |
| CD | 64.01 | 1 | 64.01 | 5.47 | 0.0336 | |
| A² | 0.9125 | 1 | 0.9125 | 0.0780 | 0.7839 | |
| B² | 24.90 | 1 | 24.90 | 2.13 | 0.1652 | |
| C² | 62.40 | 1 | 62.40 | 5.33 | 0.0356 | |
| D² | 787.88 | 1 | 787.88 | 67.34 | < 0.0001 | |
| Residual | 175.50 | 15 | 11.70 | |||
| Lack of Fit | 121.82 | 10 | 12.18 | 1.13 | 0.4725 | not significant |
| Pure Error | 53.68 | 5 | 10.74 | |||
| Cor Total | 3326.50 | 29 |
A predictive second-order polynomial model was established using multiple regression analysis within the RSM framework to quantify the effects of four key factors on the pure water permeability, as expressed by the following equation:
 |
2 |
To further evaluate the model’s accuracy, the predicted values are plotted against the experimental data in Fig. 8. As shown in this figure, the data points lie very close to the diagonal line, indicating strong consistency and close agreement between the observed and the predicted values. This alignment indicates the adequacy of the model fit. Additionally, the fit is confirmed through the coefficient of determination ( ), where a high
  value of 0.94 demonstrates a strong correlation between the predicted and observed values. Furthermore, the minimal difference (less than 0.2) between the predicted
  (
( ) and the adjusted
  (
( ) confirms the validity of the model. Based on these statistically significant results, it can be confidently concluded that this model is effective in predicting optimal operating conditions.
Fig. 8.

Comparison between predicted and measured pure water permeability values.
Figure 9a presents the normal probability plot of residuals for the PWP responses. Residuals represent the difference between the measured and the predicted values. From this figure, the distribution of points closely following a straight line indicates that the residuals are approximately normally distributed. Figure 9b displays the residuals plotted versus the predicted PWP values. In this figure, the studentized residues are randomly scattered, indicating that the residuals are independent of the predicted response. The absence of any discernible pattern further supports the assumption of residual independence. Additionally, the slight fluctuation of residuals around the x-axis confirms the assumption of constant variance. These results collectively demonstrate the predictive accuracy of the model.
Fig. 9.

(a) Normal probability plots of studentized residuals for pure water permeability (PWP), and (b) variation of residuals versus predicted PWP values.
From the above results, the model predictions for water permeability are reasonably accurate and reliable. The optimal processing parameters predicted by the model are: AC-MgO concentration of 0.354 wt%, air gap distance of 18.933 cm, dope solution flow rate of 2.981 ml/min, and bore fluid flow rate of 7.775 ml/min. The maximum theoretical water permeability of the hollow fiber membrane under the optimal processing conditions was estimated to be approximately 56.715 L/(m2.h.bar), and the experimentally measured permeability at this condition was found to be 52.49 L/(m2.h.bar). This result suggests that the employed model has good predictive capability of the variables for achieving the optimal response.
Impact of particle concentration and process parameters on PWP
Figures 10 and 11a, d, and f illustrate the correlation between the concentration of AC-MgO particle in dope solution and the pure water permeability. As the content of AC-MgO increases, the PWP of membranes increases; however, a slight decrease is observed at low concentrations of particles. From these results, the higher concentration of particles in the fluid has a more pronounced positive effect on PWP. Such improvement is mainly ascribed to the synergistic effects of increased porosity and hydrophilicity due to the added particles45. The relationship between PWP and air gap distance, as shown in Figs. 10 and 11a, c, and e, reveals that permeability increases with the rising air gap, which is attributed to the formation of longer finger-like structures46. Figure 10 and 11b, c, and d also show that PWP increases with increasing dope solution flow rate, which is attributed to the significant formation of large macrovoids47. Additionally, as depicted in Fig. 10 and 11b, e, and f, the PWP increases by increasing the bore fluid flow rate, likely due to the greater thickness of the layer with the finger-like structures48. Further details will be described in the following sections.
Fig. 10.

Variation of pure water permeability (PWP) with (a) air gap and particle concentration in solution (b) bore fluid rate and dope solution rate, (c) air gap and dope solution rate, (d) particle concentration and dope solution rate, (e) air gap and bore fluid rate, and (f) particle concentration and bore fluid rate (The plots generated using Design-Expert software, version 13.0.5.0 (Stat-Ease, Inc.). For more details, visit https://www.statease.com/software/design-expert/).
Fig. 11.

Contour plot of pure water permeability variation with (a) particle concentration in solution and air gap, (b) bore fluid rate and dope solution rate, (c) air gap and dope solution rate, (d) particle concentration and dope solution rate, (e) air gap and bore fluid rate, and (f) particle concentration and bore fluid rate (The plots generated using Design-Expert software, version 13.0.5.0 (Stat-Ease, Inc.). For more details, visit https://www.statease.com/software/design-expert/).
Microstructure analysis of manufactured HFM cross section
To investigate the effect of the studied parameters on HFM morphology, SEM micrographs were taken from the transverse cross-section of the manufactured membranes. These images reveal that the cross-section of the membranes generally consisted of three distinct layers, with pore morphology varying depending on the process parameters, as discussed below.
Effect of particle concentration
The SEM images of the manufactured HFM cross-section with various AC-MgO particle content are shown in Fig. 12. As observed from this figure, the membrane cross-section typically comprised three distinct layers: an outer layer, which is generally dense with minimal porosity; a middle layer characterized by a macro-porous structure that influences permeability49; and an inner layer composed of micro- and meso-porous structures. Additionally, Fig. 12 illustrates that increasing the AC-MgO content led to the formation of larger finger-like pores. These particles acted as nucleation sites for pore formation by providing surfaces where the non-solvent preferentially interacted with the dope solution. The improved hydrophilicity of the dope solution, resulting from the presence of AC-MgO, accelerated the solvent–water exchange rate and facilitated the development of larger pores and an increase in the thickness of the finger-like structured layer12,50. These morphological changes, along with increased hydrophilicity due to the presence of AC-MgO particles, which allowed water molecules to more easily wet the membrane surface and penetrate the pores51, significantly enhanced the PWP of the membrane. These findings are in excellent agreement with the data presented in Figs. 10 and 11.
Fig. 12.

SEM micrographs of the hollow fiber cross-sections prepared with varying concentrations of AC-MgO particles in the dope solution: (a) 0%, (b) 0.18%, and (c) 0.36% wt.
Effect of air gap
The effect of air gap distance on the thickness of the layer with the finger-like structure in the HFM, are presented in Fig. 13. It is shown that by increasing the distance from 2 cm to 12 cm and 42 cm, while keeping other parameters constant, the size of this layer in samples S8, S2, and S1 increased from 30 μm to 43 μm and 60 μm, respectively (Fig. 13a–c). Similarly, the thickness of the finger-like structured layer changed from 38 μm to 60 μm for the samples S15 and S18, respectively (Fig. 13d, e). Moreover, increasing the air gap distance caused greater pore diameters, as the fibers were exposed to air for a longer time before being submerged in the coagulation bath, allowing water vapor to induce phase inversion more extensively52,53. According to the SEM micrograph presented in Fig. 13, the improved PWP of the composite hollow-fiber membranes can be ascribed to the combined effects of longer finger-like structures in the middle layer, and a shorter dense structure on the outer layer compared to membranes fabricated with a shorter air gap6. All these factors contributed to the increase in water permeability through the membrane, indicating a direct relationship between PWP and air gap distance, as is also evident in Figs. 10 and 11.
Fig. 13.

SEM micrograph of hollow fiber cross-sections for various air gap distance. (a) 2 cm, (b) 22 cm, (c) 42 cm, (d) 12 cm, and (e) 32 cm.
Effect of dope solution flow rate
It has been demonstrated that the flow rate of the dope solution during the fabrication of hollow fiber membranes significantly influences their structural morphology. In this study, four different flow rates were used to investigate the effects of dope solution flow rate on the PWP and morphology of hollow fiber membranes. As can be seen, increasing the flow rate from 2 to 3 ml/min for samples S28 and S27, resulted in an increase in the outer diameter of hollow fibers from 473 to 534 μm, and a significant increase in their wall thickness from 34 μm to 90 μm (Fig. 14a, b). Similarly, increasing the dope flow rate from 1.5 ml/min to 2.5 ml/min for samples S12 and S2 resulted in the outer diameter increasing from 539 to 609 μm and the wall thickness rising by 54% from 52 to 80 μm, respectively (Fig. 14c, d). These findings indicate that increasing the polymer dope solution flow rate mainly affects the outer dimension of the hollow fiber, leading to a notable thickening of the fiber wall. These observations are consistent with previous studies on PES hollow fiber membranes47, which reported that higher flow rates produce fibers with thicker walls. Moreover, the outer surface of membranes fabricated with higher dope solution flow rates exhibited the largest pore sizes. This is attributed to the shorter residence time, which limited solvent evaporation into the air. Consequently, phase inversion of the membrane’s outer surface occurred entirely within the external coagulation bath. In this environment, rapid demixing between the solvent and water led to the formation of larger surface pores compared to membranes exposed to longer evaporation-induced phase inversion54. As illustrated in Fig. 14, an increase in the outer diameter of the membrane is also associated with a greater wall thickness and the development of larger finger-like pores. These structural changes contribute to an enhancement in PWP.
Fig. 14.

Effect of the dope solution flow rate on hollow fiber pore morphology. (a) 2 ml/min, (b) 3 ml/min, (c) 1.5 ml/min, and (d) 2.5 ml/min.
Effect of bore fluid flow rate
The effect of flow rate of bore fluid on fiber morphology, while other process parameters were held constant, is also illustrated in Fig. 15. For samples S19 and S20, increasing the flow rate from 5 ml/min to 8 ml/min increased the thickness of the middle layer with the finger-like structure from 30 μm to 35 μm and the inner diameter from 344 to 358 μm, respectively (Fig. 15a, b). Similarly, for samples S2 and S10, increasing the flow rate from 6.5 ml/min to 9.5 ml/min increased the inner diameter from 458 μm to 470 μm and the thickness of the middle layer from 43 μm to 56 μm, respectively (Fig. 15c, d). These data indicate that increasing the bore fluid flow rate through the spinneret led to elongated voids and produced a thinner fiber wall, resulting in enhanced PWP. This observation is attributed to increased internal pressure caused by a higher bore fluid flow rate on the inner surface of the hollow fiber during spinning, which in turn leads to a reduction in membrane wall thickness55. Additionally, at high flow rates, the bore fluid rapidly diffused into the doper solution. Consequently, phase inversion occurred faster throughout the dope solution relative to polymer migration towards the bore fluid. This led to the formation of a more homogeneous void distribution56.
Fig. 15.

Effect of the bore fluid flow rate on morphology of hollow fiber cross section: (a) 5 ml/min, (b) 8 ml/min, (c) 6.5 ml/min, and (d) 9.5 ml/min.
As explained above, the improved PWP of the developed HFMs can be attributed to their enhanced hydrophilicity and the presence of large finger-like pore structures in the middle layer. Meanwhile, the inner layer, characterized by its small pore size, is primarily responsible for the selectivity and separation performance of the membrane. For potential application in hemodialysis, this membrane design allows small solutes such as urea to pass freely, enabling effective removal of uremic toxins. At the same time, larger molecules, including proteins (e.g., albumin) and blood cells, are efficiently retained by the inner layer, thus preventing their leakage into the dialysate solution 57,58. Therefore, despite increased permeability, selective filtration is maintained.
Conclusion
In this study, MgO-modified activated carbon particles were synthesized and incorporated into a polyethersulfone matrix to fabricate composite hollow fiber membranes using the non-solvent induced phase separation process. The effects of various process parameters and particle concentration on the performance and microstructure of the membranes were investigated. The main findings of this research are summarized below:
AFM and contact angle measurements showed that the addition of AC–MgO particles into the PES membrane, compared to the pure PES membrane, increased surface roughness and hydrophilicity, thereby enhancing membrane performance.
The effects of bore fluid and dope solution flow rates, air gap distance, and AC–MgO concentration on PWP were investigated using RSM. To quantify the influence of these four key factors on permeability, a predictive second-order polynomial model was established through regression analysis within the RSM framework.
All investigated parameters positively influenced PWP by modifying membrane morphology and pore distribution. Among them, air gap distance, and AC–MgO particle concentration had the most significant impact on overall membrane performance, underscoring their critical role in optimizing membrane structure and permeability.
The RSM-guided optimization process predicted a maximum PWP of 56.715 L/(m2.h.bar), with optimal parameters identified as: AC-MgO concentration at 0.354 wt%, air gap distance at 18.933 cm, dope solution flow rate at 2.981 ml/min, and bore fluid flow rate at 7.775 ml/min. The experimentally measured permeability under these conditions was 52.49 L/(m2.h.bar), corresponding to a prediction error of only 7.45%. This low error margin demonstrated the high accuracy and strong predictive capability of the developed model.
The improved PWP of the synthesized composite HFMs is attributed to the enhanced hydrophilicity and the presence of large finger-like pore structures in the middle layer. Meanwhile, the presence of a thin inner layer with small pore size ensures high selectivity and separation efficiency. Hence, this membrane design has great potential for application in various purification processes including hemodialysis, as it allows small solutes like urea to pass freely, while retaining larger molecules such as proteins and blood cells.
Further studies are recommended to evaluate the membrane behavior under real operating conditions, assess long-term antifouling stability, and investigate surface modifications to enhance antifouling properties, membrane performance, and durability.
Author contributions
F. Arabloo designed the experiments, performed the experimental work and data analysis, and wrote the original manuscript draft. S. Javadpour supervised the study and contributed to manuscript review and editing. All authors reviewed the manuscript.
Data availability
All data that support the findings of this study are included within the article and there are no any additional supplementary files.
Declarations
Competing interests
The authors declare no competing interests.
Footnotes
Publisher’s note
Springer Nature remains neutral with regard to jurisdictional claims in published maps and institutional affiliations.
References
- 1.Baker, R. W. Membrane Technology and Applications 3rd edn 303–324 (Wiley, 2012).
- 2.Siagian, U. W. R. et al. High-performance ultrafiltration membrane: recent progress and its application for wastewater treatment. Curr. Pollut Rep.7, 448–462 (2021). [Google Scholar]
- 3.Mousa, H. M., Fahmy, H. S., Ali, G. A. M., Abdelhamid, H. N. & Ateia, M. Membranes for oil/water separation: A review. Adv. Mater. Interfaces9, (2022). [DOI] [PMC free article] [PubMed]
- 4.Ding, X. et al. The enhancement of separation performance of Hollow fiber membrane modules: From the perspective of membranes and membrane modules structural optimization design. Chem. Eng. Sci.280, 2023).
- 5.Palmer, S. C. et al. High-flux versus low-flux membranes for end-stage kidney disease. Cochrane Database Syst. Rev. (2016). [DOI] [PMC free article] [PubMed]
- 6.Mansur, S. et al. Investigation on the effect of spinning conditions on the properties of Hollow fiber membrane for Hemodialysis application. J. Appl. Polym. Sci.133, (2016).
- 7.Kianfar, E. & Cao, V. Polymeric membranes on base of polymethyl methacrylate for air separation: A review. J. Mater. Res. Technol.10, 1437–1461 (2021). [Google Scholar]
- 8.Sahu, L. R. et al. Polymeric membranes for liquid separation: Innovations in materials, fabrication, and industrial applications. Polym16, 3240 (2024). [DOI] [PMC free article] [PubMed] [Google Scholar]
- 9.Shen, J., nan, Ruan, H., min, Wu, L. & Gao, C. jie. Preparation and characterization of PES–SiO2 organic–inorganic composite ultrafiltration membrane for Raw water pretreatment. Chem. Eng. J.168, 1272–1278 (2011). [Google Scholar]
- 10.Machodi, M. J. & Daramola, M. O. Synthesis and performance evaluation of pes/chitosan membranes coated with polyamide for acid mine drainage treatment. Sci. Rep.9, 1–14 (2019). [DOI] [PMC free article] [PubMed] [Google Scholar]
- 11.Marjani, A., Nakhjiri, A. T., Adimi, M., Jirandehi, H. F. & Shirazian, S. Effect of graphene oxide on modifying polyethersulfone membrane performance and its application in wastewater treatment. Sci. Rep.10, 1–11 (2020). [DOI] [PMC free article] [PubMed] [Google Scholar]
- 12.Navarro-Tovar, R., Gorgojo, P., Jobson, M., Martin, P. & Perez-Page, M. Innovations in water desalination: Enhancing air gap membrane distillation performance by the incorporation of clay nanoparticles into PVDF matrix membranes. Environ. Sci. Water Res. Technol.10, 2418–2431 (2024). [Google Scholar]
- 13.Ng, L. Y., Mohammad, A. W. & Leo, C. P. Hilal, N. Polymeric membranes incorporated with metal/metal oxide nanoparticles: A comprehensive review. Desalination308, 15–33 (2013). [Google Scholar]
- 14.Khdary, N. H. & Almuarqab, B. T. El enany, G. Nanoparticle-embedded polymers and their applications: A review. Membr13, 537 (2023). [DOI] [PMC free article] [PubMed] [Google Scholar]
- 15.Choi, O., Veetil, K. A., Park, C. H., Kim, H. & Kim, T. H. Fabrication of a high-performance MOF-COP-based porous Hollow fiber membrane for carbon dioxide separation. Chem. Eng. J.497, 154746 (2024). [Google Scholar]
- 16.Alshahrani, A. A. et al. Nanofiltration membranes prepared from pristine and functionalised multiwall carbon nanotubes/biopolymer composites for water treatment applications. J. Mater. Res. Technol.9, 9080–9092 (2020). [Google Scholar]
- 17.Wei, G., Chen, S., Fan, X., Quan, X. & Yu, H. Carbon nanotube Hollow fiber membranes: High-throughput fabrication, structural control and electrochemically improved selectivity. J. Memb. Sci.493, 97–105 (2015). [Google Scholar]
- 18.Makhetha, T. A. & Moutloali, R. M. Antifouling properties of Cu(tpa)@GO/PES composite membranes and selective dye rejection. J. Memb. Sci.554, 195–210 (2018). [Google Scholar]
- 19.Amjad-Iranagh, S. & Mahimani, P. In The Effect of Nanofillers in Pollution and Environment. 1–59 (eds Mallakpour, S. & Hussain, C. M.) (Springer, 2024).
- 20.Ma, W. et al. Zwitterion-functionalized graphene oxide incorporated polyamide membranes with improved antifouling properties. Langmuir35, 1513–1525 (2019). [DOI] [PubMed] [Google Scholar]
- 21.Abood, T. W. et al. Effect of MXene Ti3C2 on the PVDF ultrafiltration membrane properties and performance. Eng. Technol. J.42, 754–767 (2024). [Google Scholar]
- 22.Kumar, M. et al. Effect of binary zinc-magnesium oxides on polyphenylsulfone/cellulose acetate derivatives Hollow fiber membranes for the decontamination of arsenic from drinking water. Chem. Eng. J.405, 126809 (2021). [Google Scholar]
- 23.Perera, H. C. S. et al. Magnesium oxide (MgO) nanoadsorbents in wastewater treatment: A comprehensive review. J. Magnes Alloy. 12, 1709–1773 (2024). [Google Scholar]
- 24.Alsalhy, Q. F., Al-Ani, F. H., Al-Najar, A. E. & Jabuk, S. I. A. A study of the effect of embedding ZnO-NPs on PVC membrane performance use in actual hospital wastewater treatment by membrane bioreactor. Chem Eng. Process. Process. Intensif130, (2018).
- 25.Behboudi, A., Mohammadi, T. & Ulbricht, M. High performance antibiofouling Hollow fiber polyethersulfone nanocomposite membranes incorporated with novel surface-modified silver nanoparticles suitable for membrane bioreactor application. J. Ind. Eng. Chem.119, (2023).
- 26.Said, N. et al. Enhanced hydrophilic polysulfone Hollow fiber membranes with addition of iron oxide nanoparticles. Polym. Int.66, (2017).
- 27.Kallem, P., Ouda, M., Bharath, G., Hasan, S. W. & Banat, F. Enhanced water permeability and fouling resistance properties of ultrafiltration membranes incorporated with hydroxyapatite decorated orange-peel-derived activated carbon nanocomposites. Chemosphere286, (2022). [DOI] [PubMed]
- 28.Lewis, J., Al-sayaghi, M. A. Q., Buelke, C. & Alshami, A. Activated carbon in mixed-matrix membranes. Sep. Purif. Rev.50, (2021).
- 29.Lee, S., Sirich, T. L., Blanco, I. J., Plummer, N. S. & Meyer, T. W. Removal of uremic solutes from dialysate by activated carbon. Clin. J. Am. Soc. Nephrol.17, 1168–1175 (2022). [DOI] [PMC free article] [PubMed] [Google Scholar]
- 30.Prihandana, G. S. et al. Preparation and characterization of polyethersulfone/activated carbon composite membranes for water filtration. Membranes (Basel)13, (2023). [DOI] [PMC free article] [PubMed]
- 31.Mompó-Curell, R. et al. Activated-carbon-doped non-solvent-induced phase-inversion membranes: A comprehensive study on synthesis, characterisation, and performance evaluation. Sustain16, (2024).
- 32.Wojciechowski, C., Wasyłeczko, M., Lewińska, D. & Chwojnowski, A. A comprehensive review of hollow-fiber membrane fabrication methods across biomedical, biotechnological, and environmental domains. Mol29, 2637 (2024). [DOI] [PMC free article] [PubMed] [Google Scholar]
- 33.Bakeri, G., Ismail, A. F., Rana, D., Matsuura, T. & Shariaty, M. Investigation on the effects of fabrication parameters on the structure and properties of surface-modified membranes using response surface methodology. J. Appl. Polym. Sci.123, 2812–2827 (2012). [Google Scholar]
- 34.Li, J. F., Xu, Z. L., Yang, H., Yu, L. Y. & Liu, M. Effect of TiO2 nanoparticles on the surface morphology and performance of microporous PES membrane. Appl. Surf. Sci.255, 4725–4732 (2009). [Google Scholar]
- 35.Mansur, S. et al. Enhanced adsorption and biocompatibility of polysulfone Hollow fibre membrane via the addition of silica/alpha-mangostin hybrid nanoparticle for uremic toxins removal. J. Environ. Chem. Eng.9, 106141 (2021). [Google Scholar]
- 36.Lamidi, S. et al. Applications of response surface methodology (RSM) in product design, development, and process optimization. Response Surf. Methodol. Res. Adv. Appl.. (IntechOpen, 2023).
- 37.Muhaymin, A. et al. Green synthesis of magnesium oxide nanoparticles using hyphaene Thebaica extract and their photocatalytic activities. Sci. Rep.14, 1–12 (2024). [DOI] [PMC free article] [PubMed] [Google Scholar]
- 38.Xie, Z., Guan, W., Ji, F., Song, Z. & Zhao, Y. Production of biologically activated carbon from orange peel and landfill leachate subsequent treatment technology. J. Chem. 491912 (2014).
- 39.Kim, S., Kim, S. & Lee, S. Activated carbon modified with polyethyleneimine and mgo: Better adsorption of aldehyde and production of regenerative VOC adsorbent using a photocatalyst. Appl. Surf. Sci.631, 157565 (2023). [Google Scholar]
- 40.Mogale, T. W., Bezza, F. A. & Chirwa, E. M. N. Graphene oxide grafted MgO doped activated carbon for efficient [cr(vi)]emediation of hexavalent chromium [Cr(VI)] contaminated water. Chem. Eng. Trans.111, 613–618 (2024). [Google Scholar]
- 41.Bildyukevich, A. V., Plisko, T. V., Lipnizki, F. & Pratsenko, S. A. Correlation between membrane surface properties, polymer nature and fouling in skim milk ultrafiltration. Colloids Surf. Physicochem. Eng. Asp. 605, 125387 (2020). [Google Scholar]
- 42.Wang, M., Liu, C., Fan, M., Liu, M. & Shen, S. Optimization of nanofiltration Hollow fiber membrane fabrication process based on response surface method. Membr12, 374 (2022). [DOI] [PMC free article] [PubMed] [Google Scholar]
- 43.Dlamini, D. S., Mamba, B. B. & Li, J. The role of nanoparticles in the performance of nano-enabled composite membranes—A critical scientific perspective. Sci. Total Environ.656, 723–731 (2019). [DOI] [PubMed] [Google Scholar]
- 44.Zakria, H. S. et al. Fabrication of high performance PVDF Hollow fiber membrane using less toxic solvent at different additive loading and air gap. Membr. (Basel). 11, 843 (2021). [DOI] [PMC free article] [PubMed] [Google Scholar]
- 45.Ismail, A., Ibrahim, S. M. & Nasri, N. Effects of dope extrusion rate on the morphology and gas separation performance of asymmetric polysulfone Hollow fiber membranes for O2/N2 separation. 24, (2002).
- 46.Alobaidy, A. A., Sherhan, B. Y., Barood, A. D. & Alsalhy, Q. F. Effect of bore fluid flow rate on formation and properties of Hollow fibers. Appl. Water Sci.7, 4387–4398 (2017). [Google Scholar]
- 47.Han, G., Feng, Y., Chung, T. S., Weber, M. & Maletzko, C. Phase inversion directly induced tight ultrafiltration (UF) Hollow fiber membranes for effective removal of textile dyes. Environ. Sci. Technol.51, 14254–14261 (2017). [DOI] [PubMed] [Google Scholar]
- 48.Khayet, M. et al. Effects of gas gap type on structural morphology and performance of Hollow fibers. J. Memb. Sci.311, 259–269 (2008). [Google Scholar]
- 49.Rosid, S. M. et al. Effect of air gap distance of PSF/IONPs/ALG hollow fiber membrane on morphology and antifouling properties. Mater. Today Proc.46, 1929–1933 (2021).
- 50.Said, N., Mansur, S., Abidin, M. N. Z. & Ismail, A. F. Fabrication and characterization of polysulfone/iron oxide nanoparticle mixed matrix Hollow fiber membranes for hemodialysis: effect of dope extrusion rate and air gap. J. Membr. Sci. Res.9, (2023).
- 51.Nazif, A., Karkhanechi, H., Saljoughi, E., Mousavi, S. M. & Matsuyama, H. Effective parameters on fabrication and modification of braid Hollow fiber membranes: A review. Membr11, 884 (2021). [DOI] [PMC free article] [PubMed] [Google Scholar]
- 52.Geremia, I. et al. New mixed matrix membrane for the removal of Urea from dialysate solution. Sep. Purif. Technol.277, 119408 (2021). [Google Scholar]
- 53.Raharjo, Y. et al. Selectively mixed matrix Hemodialysis membrane for adequate clearance of p-cresol by the incorporation of imprinted zeolite. RSC Adv.13, 2972–2983 (2023). [DOI] [PMC free article] [PubMed] [Google Scholar]
Associated Data
This section collects any data citations, data availability statements, or supplementary materials included in this article.
Data Availability Statement
All data that support the findings of this study are included within the article and there are no any additional supplementary files.