

Abstract
Multiple genetic association studies have correlated a common allelic block linked to the BAG3 gene with a decreased incidence of heart failure, but the molecular mechanism remains elusive. Here, we use induced pluripotent stem cells (iPSC) to test if the only coding variant in this allele block, BAG3C151R, alters protein and cellular function in human cardiomyocytes. Quantitative protein interaction analysis identified changes in BAG3C151R protein partners specific to cardiomyocytes. Knockdown of genes encoding for BAG3 interacting factors in cardiomyocytes followed by myofibrillar analysis revealed that BAG3C151R associates more strongly with proteins involved in the maintenance of myofibrillar integrity. Finally, we demonstrate that cardiomyocytes expressing the BAG3C151R variant have improved response to proteotoxic stress in a dose-dependent manner. This study suggests that BAG3C151R could be responsible for the cardioprotective effect of the haplotype block, by increasing cardiomyocyte protection from stress. Preferential binding partners of BAG3C151R may reveal potential targets for cardioprotective therapies.
Introduction
Heart failure is a major cause of mortality, with increasing incidence each year1. One of the main causes of non-ischemic heart failure is dilated cardiomyopathy (DCM), which has a strong genetic component1-3. Although many genetic association studies have identified risk loci associated with DCM, the translation of these discoveries into therapeutic strategies remains challenging. This is partly due to a lack of mechanistic insights at the molecular level, making it difficult to progress from correlation to causality. In addition, most of the genetic variants identified in genetic association studies are rare and disease-causing, so the mechanistic information is applicable to only a small subset of patients. On the contrary, variants associated with a decreased risk of disease (protective) have the potential to be utilized for the development of therapeutic strategies that are applicable to a much broader range of subjects4. Recently, multiple large genome wide association studies have implicated a common haplotype block, which overlaps with the BAG3 (Bcl-2 associated athanogene 3) gene, with an apparent decreased incidence of DCM or with improved cardiac ejection fraction5-13 (for a summary of these studies, see Table 1). Despite the strong genetic association, the molecular basis of the apparent protective effect remains unknown. A mechanistic understanding of this protective allele could aid in the development of novel cardioprotective therapies.
Table 1.-.
Summary of genome wide association studies supporting the putative cardioprotective effect of the BAG3 haplotype block.
| Study | Phenotype | SNP* | MAF | Odds Ratio |
p-value |
|---|---|---|---|---|---|
| DCM/Heart Failure studies | |||||
| Villard et al, 20115 | DCM | rs2234962 | 0.17 | 0.66 | 4.00E-12 |
| Esslinger et al, 20176 | DCM | rs2234962 | 0.19 | 0.62 | 1.70E-25 |
| Aragam et al, 2018 (UK Biobank)7 | Non Ischemic Cardiomyopathy | rs2234962 | 0.22 | 0.77 | 3.55E-07 |
| Aragam et al, 2018 (BioVU)7 | Non Ischemic Cardiomyopathy | rs2234962 | 0.21 | 0.67 | 3.12E-03 |
| Aragam et al, 2018 (GRADE)7 | Non Ischemic Cardiomyopathy | rs2234962 | 0.21 | 0.72 | 1.00E-02 |
| Shah et al, 20208 | Heart Failure | rs17617337 | 0.22 | 0.94 | 3.65E-09 |
| Choquet et al, 20209 | HF/Cardiomyopathy | rs17617337 | 0.2 | 0.9 | 2.90E-02 |
| Verweij et al, 202010 | Heart Failure | rs2234962 | 0.21 | 0.71 | 6.69E-05 |
| de Denus et al, 202011 | Idiopathic DCM | rs2234962 | 0.22 | 0.42 | 5.00E-04 |
| Garnier et al, 202112 | DCM | rs61869036 | 0.18 | 0.67 | 5.60E-14 |
| LVEF/ECG studies | |||||
| Aung et al, 201913 | LVEF on non-HF patients | rs2234962 | Improved LVEF 0.5%/allele (p-val=2.00E-14) | ||
| Choquet et al, 20209 | LVEF (all patients) | rs17617337 | Improved LVEF 0.8%/allele (p-val=8.24E-17) | ||
| Verweij et al, 202010 | Electrocardiogram (all patients) | rs2234962 | Change in Q-R phase** (p-val = 4.80E-54) | ||
Abbreviations: MAF - Minor Allele Frequency; DCM - Dilated Cardiomyopathy; LVEF - Left Ventricular Ejection Fraction; HF - Heart Failure
SNPs rs17617337, rs61869036 and rs2234962(BAG3C151R) are in complete LD (r2>0.99)
Q-R phase of ECG corresponds to ventricular depolarization and contraction
A combination of clinical case reports and large genetic association studies have implicated BAG3 loss-of-function variants with DCM5,7,14-16. BAG3 was first described as an HSP70 co-chaperone, while successive studies have found it to be a multifunctional hub for a diverse set of cellular processes, mostly centered around protein quality control and selective autophagy17-19. In cardiac and skeletal muscle, a functioning protein quality control network is essential to dynamically maintain myofibrillar structures through constant cycles of contraction20. Accordingly, BAG3 impairment results in heart and skeletal muscle pathology21-24. These studies indicate the BAG3 protein has an essential role in muscle, particularly in cardiomyocytes, which lack replicative potential. In particular, BAG3 binding to the HSP70 chaperones is essential for cardiac health, as indicated by multiple pathogenic mutations that reduce this interaction14,25-28. Interestingly, the cardioprotective BAG3 allele block contains one coding variant, rs2234962, which leads to the BAG3C151R amino acid transition. However, the C151R change is located distant from the HSP70 binding domain, in an intrinsically disordered region with no known function. Based on these observations, we hypothesize that the BAG3C151R could induce a novel functional effect in the BAG3 protein and contribute to the cardioprotective effects of the haplotype block.
Recent studies have demonstrated that induced pluripotent stem cell (iPSC) modeling can be used to elucidate the functional effects of disease risk variants identified in genetic association studies29-32. Here, we have leveraged the power of iPSC technology and genome editing to examine the impact of the C151R aminoacid change in the function of the BAG3 protein, and on the response of iPSC-derived cardiomyocytes to stress. Our findings confirm that the BAG3C151R variant has a protective effect in vitro, and could be responsible for the effect of the cardioprotective haplotype block. We also catalogued cardiomyocyte-specific alterations in the protein interactome associated with the BAG3C151R change, which provide a hint at novel mechanisms for cardioprotection that are potential targets for future investigation.
Results
BAG3C151R alters BAG3 interaction partners in cardiomyocytes
The BAG3 allele block associated with reduced incidence of heart failure comprises at least seven common variants in almost complete linkage disequilibrium across an ~18Kb region, of which only the rs2234962 variant is exonic (Fig 1A; ED Fig.1A). The block presents with an allele frequency of roughly 20% in European and South Asian populations (Fig 1B; ED Fig.1B). The rs2234962 variant results in the BAG3C151R amino acid change, which is located in a region of the protein with no annotated domain or function (Fig 1C; ED Fig.1C-D). Since BAG3 is a scaffold protein with a wide range of binding partners, we reasoned that if this variant indeed alters BAG3 function, it would likely do so via alterations in the profile of protein interactions. Presumably, these changes would be different from those caused by a pathogenic variant such as the BAG3E455K, which lies in a highly conserved region of the protein (ED Fig.1E) and has been shown to disrupt protein interactions in the mouse heart33,23.
Figure 1. The putative cardioprotective variant rs2234962-BAG3C151R results in a change in the profile of BAG3 co-precipitation partners in a cardiomyocyte background.

(A) Top: linkage disequilibrium plot centered around the rs2234962 variant (green) showing six other genetic variants (blue) in complete disequilibrium that form a haplotype block. *: Variants used in genetic association studies. Data for Central European population (CEU). Bottom: gene structure of the overlapping BAG3 gene (light blue: introns, dark blue: exons). (B) Allele frequencies across different super populations from the 1000 Genomes database. (AFR: African, AMR: Ad Mixed American, EAS: East Asian, EUR: European, SAS: South East Asian). (C) Schematic of BAG3 protein domain structure, highlighting some relevant interaction partners and indicating the location of the variants used in this study (arrows). Numbers indicate amino acid boundaries for annotated domains. Dashed lines indicate exon-exon boundaries. Areas of unknown function are colored in grey. Data compiled from multiple studies and literature reviews, as referenced in-text (references 21-26). (D-F) Interaction analyses for three different BAG3 variants (BAG3WT, BAG3C151R, BAG3E455K). (D) Bar plot of the number of differential interactors (co-precipitation partners that interacted significantly more or less with BAG3 in either variant compared to BAG3WT) identified using APMS in three different cell backgrounds - HEK293T cells (*: indicates BAG3 variant overexpression), undifferentiated human iPSC, and differentiated iPS-CM. Significantly different binding partners of BAG3C151R were only identified in the iPS-CM background. N=4. (E) Volcano plot depicting the intensity ratio of co-precipitation of each protein partner with BAG3E455K-3xFLAG relative to BAG3WT-3xFLAG in iPS-CM. (F) Volcano plot depicting the intensity ratio of co-precipitation of each co-immunoprecipitation partner with BAG3C151R-3xFLAG relative to BAG3WT-3xFLAG in iPS-CMs. Horizontal dashed line indicates statistical significance threshold (p-val<0.01) and vertical dashed line indicates no ratio change. BAG3C151R results in a significant change of interactions that are different from those affected by the pathogenic variant. N=4 biological replicates from separate differentiation batches. Analysis performed using a hypervariate linear model analysis, and p-values were adjusted for multiple comparisons (see Methods section).
To test this hypothesis, we first performed affinity purification coupled to mass spectrometry (APMS) to characterize the stable protein interaction partners of a set of BAG3 variants overexpressed in a non-muscle immortalized cell line, HEK293T. We observed a significant loss of co-precipitation partners (mostly HSP70 family members) for the pathogenic BAG3 variants (Fig 1D; ED Fig.2). This result validated our approach, however no changes in protein interactions were observed for BAG3C151R. We postulated that to see a difference for this variant we needed to perform these experiments in a more relevant cell type, the cardiomyocyte. We also reasoned that since BAG3 protein levels are tightly regulated, it would be important to use endogenous levels of expression to study interaction partners. We therefore generated a series of isogenic induced pluripotent stem cell (iPSC) lines bearing the BAG3C151R variant, the pathogenic variant BAG3E455K, or the non-disease associated ‘wild-type’ variant (BAG3WT), with a 3xFLAG epitope tag fused to the endogenous BAG3 gene (ED Fig.3). The cell lines were differentiated into cardiomyocytes (iPS-CMs) and we used APMS to analyze the BAG3 protein complexes in both iPSCs and iPS-CMs. As expected, we observed a difference in the significant stable partners of the BAG3E455K-3xFLAG variant compared to BAG3WT-3xFLAG in both iPSCs and IPS-CMs (Fig 1D). In comparison to the HEK293T APMS results, we were also able to characterize both increasing and decreasing protein interactions for the BAG3C151R-3xFLAG variant, but only in the iPS-CM background and not in undifferentiated iPSCs (Fig 1D). This hints at a cell type-specific effect of the BAG3C151R variant function. In addition, we performed this APMS analysis for BAG3WT-3xFLAG partners in iPS-CMs under proteotoxic stress (using proteasome inhibitor bortezomib), and in an engineered inducible cell line overexpressing BAG3WT-3xFLAG(ED Fig.4). This comprehensive characterization allowed us to obtain a refined list of stable BAG3 coimmunoprecipitation partners in a cardiomyocyte background (ED Fig.5). This list included HSP70 chaperones and co-chaperones as well as other partners such as small heat shock proteins, sarcomeric factors and actin-associated proteins. It also showed a large difference in interactions identified when BAG3 was overexpressed, highlighting the importance of performing functional analyses with proteins expressed at endogenous levels (ED Fig.5D).
To quantify the changes in co-precipitation efficiencies of BAG3 interaction partners across variants, we performed a quantitative targeted proteomics analysis on the iPS-CM APMS samples. While the pathogenic variant BAG3E455K-3xFLAG resulted in a generalized loss of protein interactions compared to BAG3WT (mostly HSP70 chaperones and co-chaperones) (Fig 1E), the BAG3C151R-3xFLAG variant displayed a significant change in a different subset of binding partners (Fig 1F). In particular, there was an increase in the interaction with actin-binding protein Filamin A, hippo pathway kinase STK38, and E3 ubiquitin protein ligases DDB1 and TRIM21, while interaction with small heat shock protein HSPB7 and co-chaperone DNAJB1 were decreased compared to BAG3WT.
Taken together, these results suggest that the putative protective variant BAG3C151R influences BAG3 protein function by modifying its cardiomyocyte-specific profile of protein interactions.
BAG3C151R engages factors involved in sarcomeric homeostasis
Many stable BAG3 interaction partners identified here (such as those that significantly changed in the BAG3C151R background) have no known roles in cardiomyocyte function, particularly in the context of BAG3 mediated protein homeostasis. Cardiomyocytes are contractile cells and the structure and integrity of their myofibrils is closely associated to their functional output and pathological status. Correspondingly, myofibrillar disarray is a hallmark of BAG3-related disease16,21,34. We therefore hypothesized that some BAG3 partners might also play a role in the maintenance of sarcomeric integrity in iPS-CMs. To test this hypothesis in an unbiased manner, and with a focus on BAG3-specific features, we set up a pipeline for systematic iPS-CM gene knockdown using siRNA, followed by unbiased sarcomere structure analysis of microscopy images (Fig 2A). Images from different gene knockdowns were scored using a supervised learning classifier that ranked sarcomere staining images by similarity to a BAG3 knockdown phenotype or a control phenotype, generating a ‘BAG3 sarcomere score’. Visual inspection of these two training conditions revealed that iPS-CMs with a BAG3 knockdown were more likely to collapse (with completely aggregated myofibrils) and generally presented a lower myofibril density accompanied with increased sarcomere disarray and staining gaps (Fig 2B; ED Fig.6A-C). Our scoring scheme accurately classified BAG3 knockdown and control test images using only sarcomere staining images as input, and the obtained score correlated with BAG3 protein levels (Fig 2C, ED Fig.7A-C). Discrimination of BAG3 knockdowns was effective across diverse myofibrillar stains, and knockdown of the factor used for myofibrillar staining (MYBPC3) did not affect BAG3 sarcomere score or protein levels (Fig 2C, ED Fig.7D-E).
Figure 2. BAG3C151R favors binding to factors required for maintenance of myofibrillar integrity.
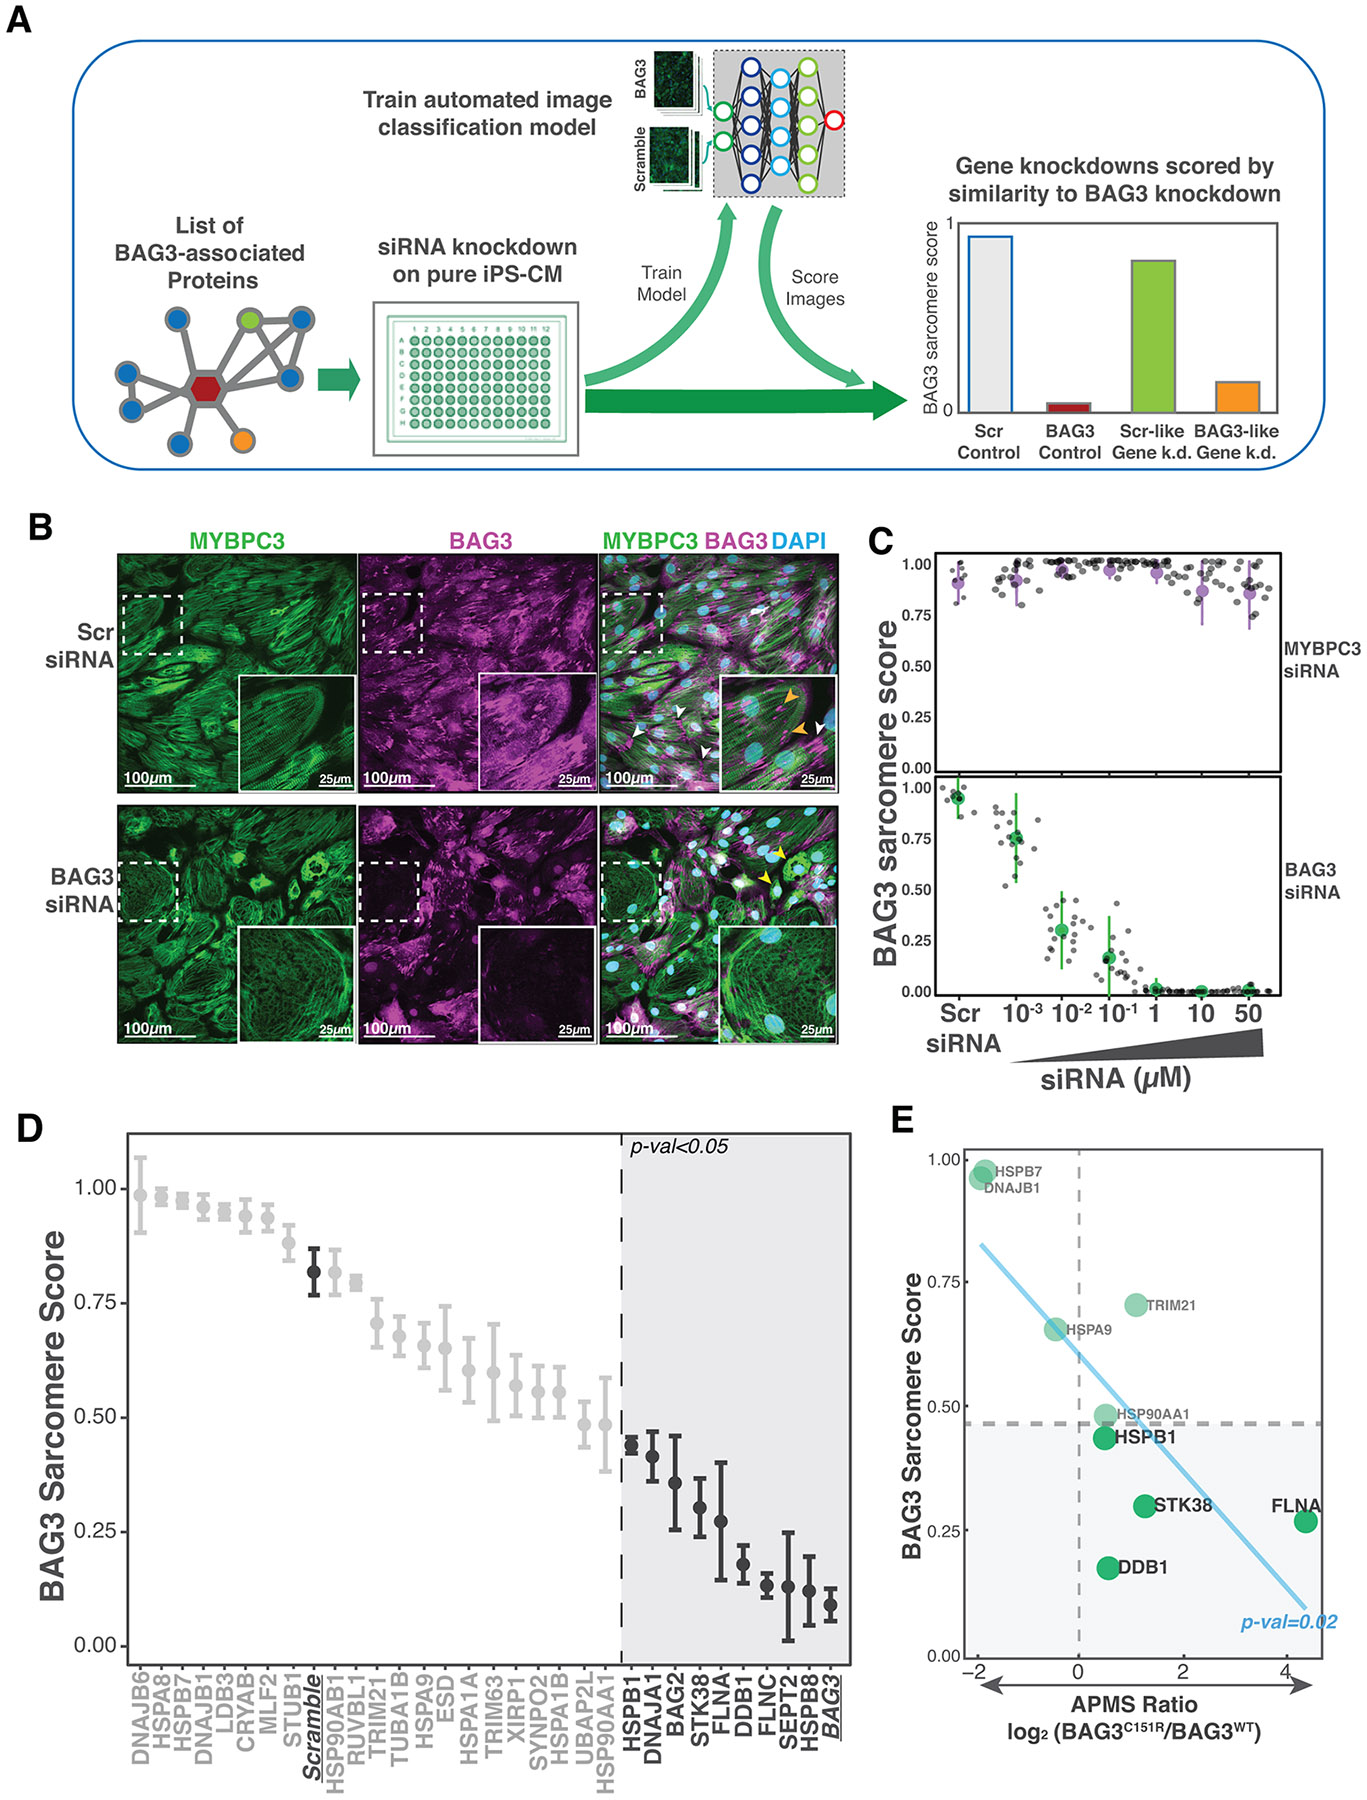
(A) Diagram of the pipeline for automated analysis of myofibrillar staining images in iPS-CM. First, BAG3 associated genes are knocked down using siRNA. Then images are put through a supervised learning scoring scheme trained on myofibrillar staining images of iPS-CM treated with Scramble (control) or BAG3 siRNA. Scores are closer to 0 if similar to a BAG3 knockdown, as shown in the mock graph. (B) Representative images of iPS-CMs treated with control or BAG3 siRNA. BAG3 staining localized to the sarcomeric z-disk region and with high intensity in the MYBPC3 staining gaps (presumably myofibrillar breaks; orange arrowheads) and, in some cases, to the polar ends of cardiomyocytes (white arrowheads). BAG3 knockdown cardiomyocytes display a reduced density of myofibrils, which are also more disorganized, and more cells with collapsed/aggregated sarcomere staining (yellow arrowheads). Cells with the lowest BAG3 staining displayed a particularly disorganized sarcomere structure, with numerous gaps in MYBPC3 staining (see insert). (C) BAG3 sarcomere score obtained for dose titration of siRNA targeting MYBPC3 (top) and BAG3 (bottom). Image score was inversely correlated with the amount of BAG3 siRNA used, but didn’t change substantially when MYBPC3 siRNA was used. N= 9 images for Scr siRNA conditions, N=18 for the rest. Data is presented as mean values +/− 2x standard deviation. (D) BAG3 sarcomere score for all the BAG3 co-precipitation partners identified in this study. Internal controls Scramble and BAG3 are underlined. Vertical dashed line marks the threshold beyond which a knockdown scored significantly lower than the internal Scr. Dots represent mean of 3 replicates from separate wells, each being the median score of 9 images from the same well. Error bars: SEM. P-val cutoff: 0.05 using a one-way ANOVA with post-hoc Dunnett test. (E) Knocking down proteins that interact stronger with BAG3C151R than BAG3WT phenocopies BAG3 insufficiency. Plot depicting the relationship between the sarcomeric score of a gene knockdown and the corresponding protein’s BAG3C151R/BAG3WT co-precipitation intensity ratio. P-value obtained fitting a linear model. Pearson’s product-moment correlation: −0.75.
We then applied this phenotypic analysis pipeline to gene expression knockdowns of all the co-immunoprecipitation partners identified in our BAG3 interactome in addition to some other high-confidence BAG3-related proteins extracted from previous studies but not detected in our APMS dataset (Supplementary Data Table S4). We found that siRNA treatment for 9 of the 30 genes encoding BAG3 iPS-CM high confidence protein interactions (and 6/18 BAG3 associated genes from previous studies) phenocopied BAG3 insufficiency (Fig 2D, ED Fig.7F, sample micrographs in ED Fig.8A-B). None of these knockdowns significantly affected cardiomyocyte viability, and only one (HSPB8, a well-known BAG3 partner in protein quality control22) significantly decreased BAG3 protein levels (ED Fig.7G-H). Similarly, BAG3 localization was not altered in an obvious manner by visual inspection. Interestingly, knockdown of FLNA, STK38, DDB1 and HSPB1, proteins that more strongly co-precipitated with BAG3C151R-3xFLAG than BAG3WT, were among the phenotypes that most closely resembled BAG3 insufficiency. In fact, among the BAG3C151R differential interactors a significant change in sarcomere score after knockdown was observed only in interactors identified with increased binding. By comparing the knockdown sarcomere score to the magnitude and direction of differential protein binding we observed a significant correlation, with an inverse relationship between the BAG3 sarcomere scores and the change in co-precipitation intensity for all BAG3C151R-3xFLAG differential partners (Fig 2E). Although a subset of BAG3E455K differential interactors also led to decreased sarcomere score after knockdown, there was no significant correlation between sarcomere score and co-precipitation intensity in this group overall (ED Fig.7I).
Altogether, this data implicates a specific subset of BAG3 interactors as particularly important for the maintenance of myofibrillar integrity. It also suggests that BAG3C151R variant has an increased ability to engage some of these factors, presumably improving their BAG3-associated role in the maintenance of the sarcomeric structure.
BAG3C151R protects cardiomyocytes against proteotoxic stress
Since BAG3 is a well-known stress responsive factor with a role in the maintenance of cell homeostasis under proteotoxic conditions, we next wanted to elucidate whether the BAG3C151R variant had a measurable effect in cardiomyocyte response to stress. To this end, we generated two additional isogenic iPSC lines bearing the rs2234962/BAG3C151R variant in either heterozygosity or homozygosity. We exposed iPS-CMs from these cell lines to increasing doses of the proteasomal inhibitor bortezomib, a well-known cardiotoxic drug35,36 to which BAG3-deficient cells are particularly sensitive21,34. Interestingly, iPS-CMs bearing BAG3C151R variants showed a higher EC50 than BAG3WT cardiomyocytes did, indicating a greater resilience to the inhibitor. This effect was stronger in BAG3C151R homozygous cardiomyocytes than in heterozygous ones, suggesting a response influenced by gene dose (Fig 3A, ED Fig.9A-C). This effect was not recapitulated in undifferentiated iPSc for the same cell lines, suggesting some degree of cell type specificity for this BAG3C151R-induced protection and consistent with the lack of differential interactions by APMS in BAG3C151R iPSC (ED Fig.9D-E). By contrast, cardiomyocytes expressing the pathogenic BAG3E455K-3xFLAG variant were significantly more susceptible to bortezomib than BAG3WT cardiomyocytes (Fig 3A, ED Fig.9A), and had an EC50 similar to that of BAG3−/− cell lines, consistent with observations that pathological BAG3 mutations that impact the BAG domain can have a dominant negative effect28. We also noted that BAG3 overexpression in cardiomyocytes was able to rescue the BAG3−/− phenotype and provide an additional level of resistance over BAG3WT (ED Fig.9F-G), in agreement with studies using BAG3 overexpression as a potential cardioprotective strategy37,38.
Figure 3. The rs2234962/BAG3C151R variant provides enhanced resistance to the proteotoxic drug bortezomib in iPS-CM.

(A) Calculated EC50 and 95% confidence intervals for Bortezomib in control (WT/WT), BAG3C151R heterozygous (C151R/WT) and BAG3C151R homozygous (C151R/C151R) iPS-CMs. Cells bearing the pathogenic variant BAG3E455K (along with a 3xFLAG epitope) and cells lacking BAG3 expression were used as a positive control for increased sensitivity to bortezomib. N=3 separate sets of cells measured in parallel. ****: P-value<0.0001 and *: p-value<0.05 using one-way ANOVA with post-hoc Zidak correction. Data is presented as EC50 and error bars denote 95% confidence intervals. (B) Graphic summary of the data presented in this study: BAG3C151R changes the profile of BAG3 protein interactions (mediated by a hypothetical structure conformational change or stabilization of a particular structural state or transition) toward factors required for cardiomyocyte myofibrillar quality control (DDB1, STK38, Filamin). This in turn results in an enhanced resistance to proteotoxic insult. It is unclear if the increased binding of myofibril quality control factors is driven by a direct interaction with the local amino acid sequence or by an allosteric effect.
Finally, to rule out that the change in cardiomyocyte response to stress was due to an increase in BAG3 protein levels, we quantified protein expression in iPS-CM from the cell lines bearing BAG3C151R and BAG3E455K variants, both untreated and under bortezomib exposure. We found no significant changes in baseline protein levels compared to BAG3WT, and only a significant change in the BAG3E455K cells for the bortezomib treated condition (ED Fig.10).
These results show that the BAG3C151R variant provides an enhanced, dose-dependent resistance to proteotoxic stress in cardiac muscle cells in vitro, and that a single amino acid change rather than a change in protein levels is responsible for this effect. A proposed model for the influence of single nucleotide variants on BAG3 interactions and iPS-CM response to stress is show in (Fig 3B).
Discussion
In this study, we report that the common variant rs2234962—which results in the BAG3C151R amino acid change—causes a change in the interaction profile of the BAG3 protein and is directly associated with a heightened resistance of human cardiomyocytes to proteotoxic stress in vitro. Although numerous studies have associated the haplotype block containing this variant to a lower incidence of DCM, direct causality has been hard to infer from genetic association studies alone, in part due to the multiple linked nucleotide variants in this region, and the lack of physiological relevant models to study such cardioprotective effects. Since increasing BAG3 protein levels has been shown to have a cardioprotective effect37,38, we considered two hypotheses: 1) that the C151R amino acid change directly modifies BAG3 function in a manner leading to cardioprotective effects and 2) that the haplotype block functions primary by regulating BAG3 expression. Here, we sought to test the first hypothesis. We utilized genome engineering to precisely insert the BAG3C151R variant in an otherwise unchanged genetic background, and used disease modeling powered by iPSCs to identify a protective effect on cardiomyocytes exposed to a cardiotoxic drug. Although we have not tested the effect of other genetic variants in the same haplotype block and cannot rule out their effect on the cardioprotective effect observed in genetic association studies, our observation that BAG3C151R is sufficient for a functional change without a significant change in protein levels strongly suggests that this coding change is driving at least some of the cardioprotective effect observed in genetic association studies. Our data also indicates an allele dosage effect for this protection, in agreement with some genetic studies that suggest homozygous individuals have an even lesser risk of disease than heterozygous individuals5,13.
This study demonstrates the strength of genetically engineered iPSCs to dissect the effects of human genetic variants on cardiac myopathies. The ability to perform genome engineering techniques on iPSCs and the increasing breadth of functional information that can be obtained from iPS-CMs enables prospective studies in a cost- and time-efficient manner. Here, in addition to characterizing cardiomyocyte-specific protein interactions, we used an automated machine learning pipeline to objectively analyze microscopy images from different BAG3 -associated gene knockdowns. This technique overcomes the most technically challenging steps in automated myofibril analysis (such as cell and fibril/sarcomere segmentation) while still providing a quantitative metric. Previous studies have reported this analysis framework to yield equivalent or improved sensitivity compared to other targeted functional assays in iPS-CM. The main limitation of this method is that the results are obtained without any insight on what cellular features are used to compute the distance score. However, since the scoring system used here is trained to evaluate images in their similarity to a BAG3 knockdown condition, it focuses on BAG3-specific features by design. As an example, knockdown of the gene encoding for the myofibrillar protein used for scoring (MYBPC3) or of other cardiomyopathy-related but BAG3-unrelated genes (splicing factor RBM20 and sarcomeric component MYH7) did not yield a low BAG3 sarcomere score (Fig 2C; ED Fig.7D). This data adds a layer of information to the putative interaction list by quantifying the contribution of each one of the factors to the myofibrillar structure, allowing us to prioritize targets by identifying which ones are involved in BAG3-associated maintenance of sarcomeric integrity. A similar approach has been used to study small molecule perturbations on iPS-CMs and other cell types39,40. Although we were not able to quantify the efficiency of the gene knockdowns for each one of our targets, the use of siRNA technology for successful gene knockdown in differentiated iPS-CM has been validated in this and other studies41-43. While we cannot rule out false negative results from ineffective knockdown for some genes, we identified a number of positive hits among high-confidence BAG3 interactors that recapitulated the BAG3-deficient phenotype.
The use of iPS-CMs as a model for cardiomyopathies is not without limitations: iPS-CMs are known to lack some important features of mature myocytes and are not exposed to mechanical stress from pressure load, which is a predominant factor in the challenging of the myocardial protein quality control machinery24,44-46. In fact, multiple studies have reported that cardiac BAG3 loss-of-function in mice results in normal development but quickly gives rise to contractile impairment and heart failure, a process that is accentuated by contractile stress16,23,24. This suggests that BAG3 is required for the maintenance of myofibrillar structure and response to stress, but not for myofibrillar development. Consequently, the use iPS-CM could influence the profile of BAG3 interactions and might explain the lower representation of structural and sarcomeric proteins in our BAG3 interactome compared to other similar studies using primary heart tissue23,24. Despite the highlighted differences between iPS-CMs and mature cardiomyocytes, we and others have been able to identify functional changes in genome-edited iPS-CMs that are consistent with the observations from human genetic association studies and murine models21,34,45,46. Here, we used the proteasome inhibitor bortezomib as an inducer of proteotoxic stress. Bortezomib is a chemotherapy drug with a marked cardiotoxic effect, which acts by stalling the proteasome networks and increasing the accumulation of misfolded proteins47. This buildup of toxic protein species is also a hallmark of the aging and heart failure myocardium, presenting bortezomib insult as a useful tool to study cardiac protein quality control. This correlation between in vitro results and genetic studies suggests that the role of BAG3 in iPS-CM is at least partially representative of its function in the adult human heart muscle. In addition, we were only able to identify significant changes in co-precipitation with the BAG3C151R when using a cardiomyocyte background, pointing at this residue being involved in a cell-specific BAG3 function, contrary to the BAG3E455K variant which results in an impairment of the general co-chaperone function of the protein. It also highlights the importance of using a disease-relevant cell model for the functional study of cardiomyopathy disease variants.
The differences in co-precipitation partners between the BAG3C151R and the wild type protein provide hints towards a potential molecular mechanism for the cardioprotection observed in genetic association studies. The largest increase in binding was observed for Filamin A (FLNA). The gene for FLNA is expressed at high level in embryonic cardiomyocytes, but its expression goes down in the adult striated muscle in favor of a paralog, Filamin C48,49. Although we also identified FLNC in our pulldown samples, the high abundance of Filamin A in iPS-CM could be facilitating an interaction in this cellular background. The importance of FLNA in iPS-CM is also highlighted by the strong phenotype observed in our gene knockdown analyses. The BAG3C151R variant also showed a significant (~2-fold) enrichment on ubiquitin ligases DDB1 and TRIM21, which could potentially aid in the BAG3-mediated disposal of ubiquitinated defective proteins22, and on the hippo pathway kinase STK38/NDR1. Both HSPB1 and STK38/STK38L have been independently described to mediate Filamin phosphorylation50,51. Interestingly, the STK38-BAG3 interaction has been recently described to inhibit BAG3-triggered autophagy of client proteins including Filamin52, which seems counterintuitive to the increased binding of a cardioprotective variant. While this disparity could be explained by the different cell types used (rat smooth muscle cells vs human iPSc-CM), it can also be hypothesized that increased STK38 binding could yield cardioprotection by (a) inhibiting autophagy while preserving the chaperone (refolding) function of the BAG3 complex; (b) redirecting the autophagy action of BAG3 to other targets; and/or (c) promoting cytoskeleton assembly instead of BAG3-mediated degradation. We also observe a reduction in the co-precipitation of cardiac-specific small heat shock protein HSPB7. Although this protein has been previously described to not interact directly with BAG353, we identify it in our co-precipitation purification studies, suggesting it may be an indirect interaction through other interaction partners (for example, HSPB854) and that the BAG3C151R change may tilt the sHSP composition of BAG3 complexes in favor of other members (such as HSPB1). Residue 151 is located in a conserved region of the BAG3 protein with no known domain or function (see Figure S1A). Due to its proximity to the IPV domains, which mediate interaction with sHSPs55, the BAG3C151R transition could be directly affecting the binding of these. Alternatively, due to the predicted intrinsically disordered nature of this segment of BAG3, it is possible that such change could have an effect on distant regions of the protein, such as the BAG domain that is responsible for indirectly binding of BAG3 protein targets for quality control. Similarly, we found it surprising that HSP40 family co-chaperone DNAJB1, which is ubiquitously expressed across cell types, showed differential coprecipitation with BAG3C151R in iPS-CM and not in iPSC or HEK293T cells. We reasoned that this change can be due to the dynamic nature of BAG3-HSP70 complexes, which can be altered by myocyte-specific factors and promote a reduced engagement of DNAJB1 by BAG3C151R. Overall, it is important to note that the APMS technique provides an incomplete picture of protein interaction complexes, presenting a strong bias for more stable interactions. While the change in interaction factors outlined in our study warrant follow-up studies, we think it likely that future studies might identify other factors associated to the BAG3 variants studied here. It is also important to note that, despite the exquisite quantitative power of the targeted proteomics approach used to quantify the differences in interactor co-immunoprecipitation, our study only provides a putative list of interaction changes associated to the BAG3C151R variant protein expressed in a single iPS-CM clone - future studies will be necessary to validate these changes in different cell lines and conditions, and to evaluate their influence towards the generation of a stress protection phenotype in cardiomyocytes and in the human heart.
It is particularly interesting that knockdown of the BAG3C151R differential co-immunoprecipitation partners scored as being closely related to BAG3 insufficiency in our myofibrillar staining image analyses. BAG3 is a known protein hub that dynamically connects different subcellular processes resulting in a broad functional spectrum17,55. We propose that the BAG3C151R protein variant tilts the balance of interactions to favor a number of factors that are required for the maintenance of myofibrillar structure in a BAG3 dependent manner (FLNA, DDB1, STK38, HSPB1 among others). This could in turn lead to enhanced function by either interaction stabilization or more effective detection and disposal of misfolded species. Future studies will be required to test these and other possible models for the BAG3C151R mechanism of action.
To our knowledge, the data presented here provides the first evidence of a functional change associated with the rs2234962/BAG3C151R variant, and the first time a putatively protective hit from a heart failure genetic association study has been validated in vitro. In the human heart, cardiomyocytes are under constant physical stress and have very limited proliferative potential, making them rely on an active proteostasis network to properly assemble and dispose of myofibrillar factors. The BAG3 co-chaperone is a key member of this machinery, and loss of protein expression or loss-of-function variants are known to lead to dilated cardiomyopathy and heart failure. Our study shows that a specific amino acid change in the BAG3 protein can also lead to the opposite effect, cardioprotection. Despite the high frequency of BAG3C151R (~20% in European and South-East Asian populations), no negative health effects have been described to date for this variant. Although future studies will be necessary to study the effect of other missense variants in this BAG3 haplotype block, this study opens an avenue for further exploration of therapeutic strategies that tackle the role of BAG3 in the heart, particularly those aiming to mimic the effect of the BAG3C151R variant, as a way to improve cardiac muscle function and aid in the treatment or prevention of hereditary and acquired heart failure.
Methods
BAG3 genetics and conservation plots
Linkage disequilibrium plots for the BAG3 putative protective allele block were generated using data downloaded from the International Genome Sample Resource (IGSR) database56 (https://www.ebi.ac.uk/gwas/variants/rs2234962), using the data for the CEU population (Utah residents with Northern and Western European ancestry). The map graphs with the geographic distribution of allele frequencies for the rs2234926 variant was obtained using the Geography of Genetic Variants (GGV) browser tool57 and edited in-house to enhance readability. Aminoacid conservation data and zoomed-in plots were obtained from Aminode database58 (http://www.aminode.org/?gene=BAG3).
iPSC culture, differentiation into iPS-CM, enrichment and cryopreservation
The WTC iPSC line was derived from a healthy male volunteer under signed consent and is widely used as a normal control. For routine maintenance, cells were cultured on Growth Factor Reduced Matrigel (8 μg/ml, BD Biosciences) and maintained in mTesr1 medium (STEMCELL Technologies) every day. Whenever the cells reached 70-90% confluence, they were harvested using Accutase Cell Detachment Solution (STEMCELL Technologies) or ReLeSR Human Pluripotent Stem Cell Passaging Reagent (STEMCELL Technologies), and maintained on media supplemented with the ROCK1 inhibitor Y-27632 (10 μM, Selleckchem) for the first 24 hours. For iPSC differentiation into cardiomyocytes, cells were seeded on Matrigel-coated plates. When cells reached 40-80% confluence (day 0), media was changed to RPMI1640 (Gibco) with B27 supplement (without insulin; ThermoFisher)) containing 6 μM or 12 μM CHIR99021 (Tocris) for 24 or 48 hours. Initial seeding, confluence level at day 0 and optimal concentration and exposure time for CHIR were optimized for each line. Cells were then incubated in RPMI/B27 (−Insulin) for 24 hours before changing media to 5 μM IWP2 (Tocris) in RPMI/B27(−Insulin). After another 48 h, media was changed to RPMI/B27 containing insulin. Fresh RPMI/B27 was exchanged every 3–4 days thereafter, and cells were monitored for beating daily.
iPS-CM enrichment and cryopreservation
At day 15, differentiation cultures that showed beating in >20% of surface area were harvested using 0.25% Trypsin (Gibco) and replated. For enrichment of iPS-CMs, we used a metabolic selection protocol21. Briefly, cells were allowed to recover for 72 hours, then media was washed with PBS and replaced with DMEM (no glucose, with sodium pyruvate, ThermoFisher Scientific) supplemented with Glutamax, Non-Essential Amino Acids, and buffered lactate (4 mM). Cells were treated with lactate media for 48 hours, three consecutive times. Then cells were allowed to recover in RPMI/B27(+Insulin). For each differentiation batch, a separate well was prepared in parallel to be used for cell counting, quantification of differentiation efficiency and genotyping. Differentiation efficiency was quantified using flow cytometry as described previously 59 using mouse monoclonal antibody against cardiac troponin-T (clone 13-11, Thermo Fisher Scientific). All iPS-CM cultures used in this study were >85% cTnT+, day 30. For cryopreservation, day-30 enriched iPS-CM cultures were harvested using 0.25% Trypsin and stored in CryoStor Cell Freezing Medium (STEMCELL Technologies) in liquid nitrogen. For thawing, cells were plated in RPMI/B27(+Insulin) supplemented with 10 μM ROCK inhibitor and 20% HyClone Fetal Bovine Serum (Fisher Scientific) and directly seeded onto cell culture plates as desired. Media was exchanged for fresh media two hours later.
Genome engineering of iPSC lines
Derivation of the BAG3−/− , BAG3WT-FLAG and BAG3C151R (no 3xFLAG fusion) from the WTC cell line is described in previous studies 21,60. For the generation of the BAG3E455K cell line, we introduced the corresponding single nucleotide mutation in the 3xFLAG donor plasmid using QuikChange Site-Directed Mutagenesis Kit (Agilent). Then this donor plasmid was used for the same process used to generate the BAG3WT-FLAG line21. To generate the inducible expression cell line BAG3−/−: TetON-BAG3WT-3xFLAG, we used a TALEN pair described elsewhere61. Two million WTC iPSC were nucleofected using an Amaxa nucleofector 2B and the Solution P3 (Lonza), 0.5 μg of each AAVS1 TALEN pair and 1 μg of the donor plasmid (see Figure S4). Cells were then selected on 1 mg/ml G418, before picking single clonal populations for genotyping. To generate the BAG3C151R/WT and BAG3C151R/C151R knock-in cell lines, 8x10⁵ WTC iPSC were nucleofected using 80 pmol Truecut v2 Cas9 (Life Technologies), 24 0pmol sgRNA (Synthego; ACACUGUUUAUCUGGCUGAG), and 400 pmol single-stranded donor (IDT; ctcagaggtcccagtcacctctgcggggcatgccagaaacaactcagccagataaacagcgtggacaggtggctgcagcggcggcagcccagcccccagcctcccacggacctgagg). A list of all the cell lines generated and used in this study can be found in Supplemental DataTable 1.
Cell line genotyping, ddPCR linkage assay and karyotyping
For sequencing validation of genotypes, target genomic regions were amplified by PCR with BioMix Red (Bioline) and sent for Sanger sequencing. Quantification of the allelic abundance of the modifications inserted and verification of the excision of selection cassettes was performed by droplet digital PCR (ddPCR). For each ddPCR reaction, 50 or 100ng of genomic DNA was mixed with 5 μM of each one of two TaqMan MGB detection probe (FAM or HEX/VIC), 18 μM of forward and reverse primers, and 1x of ddPCR Supermix for Probes (Bio-Rad). This mix was processed into droplets using a QX100 Droplet Generator (Bio-Rad) and amplifications were performed on a C1000 Thermal Cycler (Bio-Rad), using the following settings: step 1, 95°C for 10 minutes; step 2, 94°C for 30 seconds; step 3, annealing temperature (optimized for each probe pair) for 30 seconds; repeat steps 2-3 39 times; then step 4, 98°C 10 minutes. Fluorescence readouts for each droplet were obtained using a QX100 Droplet Reader (Bio-Rad). Probe pairs were designed to discriminate between original and edited sequence. For copy number variation analysis of the 3xFLAG and puromycin cassettes, droplets positive for these sequences were compared to a reference gene (RPP30 PrimePCR™ Probe Assay, BioRad). Sequences of the primers used in the genotyping reactions are described in Supplemental Data Table 2.
For allelic phasing of the BAG3 variants and the 3xFLAG sequence, a ddPCR-based assay was used (See ED Fig.2). Droplet digital PCR was performed as described above, and the linkage percentage for variants was computed as described by others 62. Briefly, assuming independence between events, then: , where NA and NB are the number of droplets positive for event A and B, respectively, while NAB are double-positive droplets due to chance and NE are empty droplets. If the case where the two events are physically linked is NAB, and using the Poisson statistics equation for where where , we obtain: ; and . The estimated % of linked molecules is then calculated as:.
Karyotyping of the cells was performed by Cell Line Genetics LLC (Madison, Wisconsin). Only cell lines with apparently normal karyotype were used in this study.
Capillary immunoassay
Cells were lysed on-plate using RIPA buffer, clarified by centrifugation and quantified using a microBCA Protein Assay Kit (Thermo Scientific). For membrane based western blot, NuPAGE LDS sample buffer, NuPAGE 4%–12% Bis-Tris gels and and run in NuPAGE MES running buffer (Thermo Fisher Scientific) were used. Proteins were transferred to nitrocellulose membranes using the iBlot transfer system (Thermo Fisher Scientific), and membranes were blocked in Odyssey blocking buffer (LiCOR). Antibodies were diluted in blocking buffer with 0.1% Tween (for primaries) or 0.1% Tween+0.01% SDS (for secondaries) and incubated at 4°C overnight (primaries) or 1h at room temperature (secondaries). All post-incubation washes were performed with PBS with 0.1% Tween, three times. Membranes were imaged immediately with an Odyssey Fc fluorescent imaging system (LI-COR). Bands were analyzed and quantified using the ImageStudio Software (Li-Cor). All protein intensities were normalized by a housekeeping gene loading control (GAPDH). Secondary antibodies were Goat Anti-Mouse IRDye 680LT (dilution 1:20000) and Donkey Anti-Rabbit IgG IRDye (dilution 1:10000) (both by Li-Cor). For capillary immunoassay, the Simple Western Wes platform (ProteinSimple) was used following the protocol from the provider. Band intensities were quantified using Compass software (ProteinSimple) and values were normalized using GAPDH as a loading control. Primary antibodies used in this study: Anti-BAG3 rabbit polyclonal (ProteinTech, 10599-9-Ap), Monoclonal ANTI-FLAG M2 (Sigma-Aldrich, F1804), polyclonal Anti-GAPDH rabbit (Abcam, ab9458), anti-HSPB8 (Abcam, ab96837). For statistical analysis of results, a Two-Way ANOVA with Sidak’s multiple comparison’s test was performed across groups using Graphpad Prism (version 8.4.3.686 for Windows, GraphPad Software).
HEK293T cell culture, protein overexpression and APMS
Immortalized Human Embryonic Kidney cells (HEK293T) were obtained from ATCC (#CRL-3216). They were cultured in DMEM (Gibco) supplemented with 10% Hyclone Fetal Bovine Serum (GE Life Sciences), GlutaMax (Gibco) and 1-00U/ml of Penicillin/Streptomycin (Gibco). Plasmids expressing BAG3 variants were generated by cloning BAG3 cDNA into an expression plasmid driven by CMV promoter and modified using QuikChange Site-Directed Mutagenesis Kit (Agilent). For affinity purification, cells were transfected using the PolyJet In Vitro DNA Transfection Reagent (SignaGen) following provider’s instructions. For controls, we used cells transfected with empty vector or a plasmid expressing the 3xFLAG peptide. Two days later, cells were harvested using Phosphate Buffer saline (PBS) with 10mM EDTA, washed twice with PBS, and resuspended in 1mL of lysis buffer (50 mM Tris-HCl pH 7.5, 150 mM NaCl, 0.5 mM EDTA, 0.5% NP-40 and 1x cOmplete protease inhibitor cocktail (Roche)). Samples were lysed by rotating at 4°C for 30 minutes, cleared by centrifugation and incubated with FLAG M2 Magnetic Bead (Sigma-Aldrich) at 4°C for 2 hours. Beads were then collected using a magnetic stand and washed 3 times with wash buffer (50 mM Tris-HCl, pH 7.5, NaCl 150 mM, EDTA 0.5 mM, supplemented with 0.05% NP-40), with an extra wash with no NP-40. Then, beads were resuspended in 30 μL of elution buffer (1% Rapigest SF Surfactant (Waters), 5 mg/ml 3xFLAG peptide (synthesized by Elim Biopharmaceuticals Inc), in wash buffer without NP-40) and eluted at room temperature for 30 minutes with shaking.
Eluted protein samples were reduced with DTT (2.5 mM) at 50°C for 30 minutes, and alkylated with iodoacetamide (2.5 mM) for 40 minutes at room temperature in the dark. After that, 0.5 μg of sequencing grade trypsin (Promega) was added to the sample and incubated overnight at 37°C. Peptides were desalted and concentrated on ZipTip C18 pipette tips (Millipore) according to the manufacturer’s protocol. Digested peptides were resuspended in 0.1% Formic Acid and analyzed by LC-MS/MS on a Velos Pro ion trap mass spectrometer (Thermo Scientific) system equipped with an Easy-nLC 1000 ultra high pressure liquid chromatography and autosampler system (Thermo Scientific). Samples were injected onto a pre-column (2 cm x 100 μm I.D. packed with ReproSil Pur C18 AQ 5 μm particles) in 0.1% formic acid and then separated with a two-hour gradient from 5% to 30% ACN in 0.1% formic acid on an analytical column (10 cm x 75 μm I.D. packed with ReproSil Pur C18 AQ 3 μm particles). Each full scan was followed by 20 collision-induced dissociation MS/MS scans of the 20 most intense peaks. Dynamic exclusion was enabled for 30 seconds. Raw data files were converted into peak lists using PAVA software63. Spectra were then searched using Protein Prospector 5.10.1 (http://prospector.ucsf.edu/) using the SwissProt database of human proteins (April 2012; https://www.uniprot.org/help/downloads). One missing cleavage was allowed. Fragment mass tolerance was set as 0.8 Da and parent mass tolerance as 1 Da. As for modifications, carbamidomethylation of cysteines was set as constant and acetylation of protein N-termini and methionine oxidation and methionine loss at N-termini were set as variable. The results from Protein Prospector were further filtered as follows: minimum Protein Score of 22.0, minimum Peptide Score of 15.0, maximum Protein E-Value of 0.01 and maximum Peptide E-Value of 0.05. All sample runs were manually curated for good values of bait count, total spectral counts and total number of unique proteins identified, leaving a total of 5 replicates per bait for downstream analysis. To filter out sample carryover across runs, we discarded each protein entry with less than half the spectral counts of the previous runs and that was present in less than 30% of all the experiments, similar to what others have described64. To deal with non-unique peptides, we took only the first protein with the most unique peptides and any other protein in the group that had at least one unique peptide across replicates. Spectral count values were then normalized to equate BAG3 counts (except for the truncation variants) and SAINTexpress v3.6.3465 was used with the sample compression option turned on to 4 samples (‘-R4’) for the statistical analysis of interactors. Control experiments were not compressed to minimize the impact of unremoved carryover. The scoring was performed independently for each bait condition. A database containing all GO terms with less than 20 members was input to boost scores of known interactors65. A final FDR cutoff of 0.1 was used. The dot plot for visualization of results was generated using the ProHits-Viz suite66. Cytoscape67 version 3.4.0 was used for the network graph generation, using the CORUM68 database (version 3.0; http://mips.helmholtz-muenchen.de/corum/) to interconnect the nodes.
Immunoprecipitation of iPS/iPS-CM samples and unbiased proteomics analysis
At day 30 of differentiation, enriched iPS-CM cultures were harvested by scraping on ice-cold PBS, washed and flash-frozen in dry ice with ethanol. For the bortezomib treatment condition, bortezomib was added to the media to 100 μM final concentration 24 hours prior to the harvesting. For iPS-CM APMS, 25-30 million cells per sample were used. For iPSC APMS, three ~90% confluent 15cm dishes were used per sample. As a negative control for nonspecific binding, WTC iPSC or iPS-CM cells were used. All the experimental conditions were performed in four replicates, each one on a different day. Cell pellets were thoroughly resuspended in lysis buffer (0.1% NP-40, 300 mM NaCl, 20% Glycerol, 2 mM MgCl2, 0.5 mM EDTA, 0.5 mM EGTA, 1 mM PMSF, 1 mM DDT in 50 mM HEPES-NaOH pH 8.0, supplemented with complete protease inhibitor cocktail (Roche) and Benzonase Nuclease (50 U/ml, Sigma-Aldrich)) and lysed by four flash freeze-thaw cycles, followed by incubation for 20 min at 4°C in constant rotation. After clearing lysates by centrifugation, protein extracts were diluted three-fold (in 0.5 mM EDTA, 0.5 mM EGTA, 1 mM PMSF in 50mM HEPES-NaOH pH 8.0) and incubated with anti-FLAG M2 Magnetic Beads slurry (Sigma-Aldrich) for 2-3 hours. Beads were then rinsed in wash buffer (3x washes in 0.01% NP-40, 1 mM PMSF, 0.5% EDTA, 0.5% EGTA in 50 mM HEPES, pH 8.0; 1x wash on buffer without NP-40), reduced (5 mM TCEP), alkylated (15 mM iodoacetamide), and digested with 1% (w/v) trypsin overnight. Resulting peptides were desalted by OMIX C18 desalting tips (Agilent) following protocol by provider and dried on a speed-vac. Peptides were resuspended in 0.1% formic acid and an iRT peptide standard mix (Biognosys) was spiked in prior to use for mass spectrometry.
For unbiased (non-targeted) analysis of samples, peptides were analyzed by liquid chromatography tandem mass spectrometry (LC MS/MS) with an Easy-nLC 1000 (Thermo Fisher, San Jose, CA) coupled to an Orbitrap Fusion Tribrid Mass Spectrometer (Thermo Fisher Scientific, San Jose, CA). Online LC separation was carried out using a 75 μm x 25 cm fused silica IntregraFrit capillary column (New Objective, Woburn, MA) packed in-house with 1.9 μm Reprosil-Pur C18 AQ reverse-phase resin (Dr. Maisch-GmbH). Peptides were eluted at a flowrate of 300 nL/min using a linear gradient of 5–30% B in 45 min, and 30–95% B for 25 min (mobile phase buffer A: 0.1% formic acid; mobile phase buffer B: 0.1% formic acid in ACN). Survey scans of peptide precursors from 400 to 1600 m/z were performed at 120K resolution in the Orbitrap, with an AGC target of 2×10⁵, and a maximum injection time of 100 ms. Tandem MS (MS2) was performed by isolation with the quadrupole, HCD fragmentation with normalized collision energy of 30%, and rapid scan MS analysis in the ion trap. The MS2 ion count target was set to 104 and the max injection time was 35 ms. Precursors with charge state 2–7 were sampled for MS2 and dynamically excluded for 20 s (tolerance of 10 ppm). Monoisotopic precursor selection was turned on, and the instrument was run in top speed mode with 3-s cycles. For protein identification and quantification, MaxQuant software v1.5.3.30 was used69. Tandem mass spectrometry (MS/MS) spectra were searched against the November 2016 release of the UniProt complete human proteome sequence database. MaxQuant was run on default parameters, allowing for 2 maximum missed cleavages, with a first search peptide tolerance of 20 ppm and a main search peptide tolerance of 4.5 ppm. Methionine oxidation and N-terminal acetylation were set as variable modifications, and carbamidomethylation of cysteines as fixed modification. The ‘match between runs’ setting was activated (window of 0.7 min) to improve peptide identification.
Peptide sequences were used to validate pulldown of intended BAG3 variants. Proteins with two or fewer peptides identified were discarded, as were typical common contaminant proteins (downloaded from http://maxquant.org/). Intensity values were normalized by median equalization of the peptide lists, and aggregated into protein intensity values. SAINTq v0.0.470 was then used to compare each experimental condition to the no FLAG control set individually. Significant putative protein interactors were selected with a Bayesian False Discovery Rate (FDR) cutoff of 0.1. Euler diagrams were generated using BioVenn71 or the R package eulerr 72.
Targeted proteomics follow-up of high confidence protein-protein interactions
A list of 118 proteins from our unbiased APMS study was chosen for targeted proteomics quantitation. To increase the number of peptides used for quantitation of these proteins, we downloaded extra peptide sequences and iRT standardized retention time values from SRMatlas 73 (www.mrmatlas.com). The isolation list of all peptides (empirical + predicted) was then used to perform a preliminary scan of a pooled sample from all conditions using a Q-Exactive Plus Mass Spectrometer (Thermo Fisher). Skyline v4.274 was used to manually select best peptides and fragments based on ppm, q-value and uniqueness to protein target. The final isolation list is in Supplemental Data Table 3. For targeted quantitation, we used a Parallel Reaction Monitoring75 method on a Thermo Fisher Q Exactive. Online LC separation was carried out using a 75 μm x 25 cm fused silica PicoTip capillary column (New Objective, Woburn, MA) packed in-house with 1.9 μm Reprosil-Pur C18 AQ reverse-phase resin (Dr. Maisch-GmbH). Peptides were eluted at a flowrate of 300 nL/min using a linear gradient of 7–36% B in 52 min, and 36–85% B for 7 min (mobile phase buffer A: 0.1% formic acid; mobile phase buffer B: 0.1% formic acid in 80% ACN). Peptides were directly injected into the mass spectrometer in positive ion mode over the course of a 75 min total acquisition time. MS2 scan were acquired in profile mode for peptides defined on the inclusion list at a resolution of 17.5K, with a 2x10⁵ AGC target, 30ms maximum injection time, a loop count of 40, an MSX count of 1, a 2 m/z isolation window, and an NCE of 27.
Raw data was loaded into Skyline to manually select best peptides and boundaries, ending on a total of 113 proteins with at least 2 good peptides. MSStats76 was then used to obtain a matrix of log intensities per sample. Missing data (0.7% of total data) was imputed by averaging remaining replicates for the same protein and condition. For analysis of the data, we used the limma package in R77,78 to generate a hypervariate linear model analysis followed by empirical bayes testing, and p-values were adjusted for multiple testing by controlling False Discovery Rate using the Benjamini-Hochberg method. A first model comparing every condition vs no-FLAG control was used to obtain a list of high-confidence interactions. Then, a second model was fit to compare the intensities for all significant hits in the BAG3 variants or bortezomib-treated sample against BAG3WT. Adjusted p-value threshold was set at 0.05 in both steps. Mass spectrometry raw data and Skyline files have been deposited to the ProteomeXchange Consortium using the Panorama Public partner repository79 (link: https://panoramaweb.org/28ZWVY.url).
Immunofluorescence staining of iPS-CM and imaging
Cells were washed with PBS and fixed with 4% Paraformaldehyde at room temperature for 20 minutes. Then cells were washed three times with PBS-Triton (0.1% of Triton X-100) and incubated with 5% Bovine Albumin Serum in PBS-Triton for 1 hour at room temperature. Then cells were incubated overnight at 4°C with a solution of primary antibody in PBS-Triton. Cells were then washed 3x with PBS-Triton and incubated in secondary antibody in PBS-Triton for 1 hour at room temperature. Cells were washed three more times with PBS-Triton. Secondary antibodies used were Goat Anti-Rabbit Alexa Fluor 594 and Goat Anti-Mouse IgG Alexa Fluor 488 (1:500; Thermo Fisher Scientific). For primary antibodies, we used rabbit polyclonal anti-BAG3 (Protein Tech, 10599-1-A), mouse monoclonal anti-FLAG M2 (Sigma-Aldrich, F1804), and mouse monoclonal anti-MYBPC3 (Santa Cruz Biotechnology, sc-137180), all at 1:200 dilution. Images used for the unbiased analysis of sarcomere structure were acquired using an ArrayScan VTI HCS Reader (ThermoFisher) at a 10x magnification. Images used for high-magnification figures in this manuscript were acquired using an ImageXpress Micro Confocal High-Content Imaging System (Molecular Devices).
For visualization, raw images were processed using the R package EBImage80 or ImageJ81 (automatic gamma transformation, automatic contrast enhancement, sharpening using a 2D high-pass convolution filter). No processed images were used for quantitation or for training the myofibrillar scoring system.
Gene knockdown on iPS-CM
For quality control and protocol optimization experiments, FlexiTube siRNA (Qiagen) oligonucleotides against BAG3 or a scramble control were used. For imaging screening and validation experiments, a Silencer Select siRNA Custom Library (Ambion) was used. For all gene targets, three different siRNA oligos were combined. High purity iPS-CM cultures (iCell Cardiomyocytes2, Lot#CMC331743, >99% cTnT+) were obtained from Cellular Dynamics International (Madison, WI). Vials were thawed as per manufacturer instructions and seeded on 96-well Black/Clear Imaging Microplate (Corning) at a density of ~53,000 cells/cm2. Cells were allowed to recover for five days and transfected with 1 μM total siRNA using Lipofectamine RNAiMAX Transfection Reagent (ThermoFisher) following protocol from provider. 48h later, media was changed for fresh cardiomyocyte maintenance media as usual. Cells were used for subsequent analyses 10 days after transfection.
Unbiased image analysis of iPS-CM knockdown images
Three biological replicates were performed for each siRNA condition. Screening plates included internal Scramble and BAG3 control conditions. Additional wells were prepared for each one of the BAG3 and Scramble siRNA conditions for training (32 wells) and validation (8 wells) of the model. Images were acquired using an ArrayScan VTI HCS Reader (ThermoFisher) at a 10x magnification. Nine images per well were used for all conditions.
Images were used to train a supervised machine learning image classification model using PhenoLearn framework (www.phenolearn.com), as described elsewhere82,83. Briefly, each image was split into 9 sub-images, which are subsequently rotated and flipped to generate 7 extra sub-images. Then these are used to train a 50-layer-deep convolutional neural network (ResNet50 architecture). 80% of the images are used to construct the scoring framework, and the remaining 20% are used for training. The optimized model is then used to classify the images from the screening plates. The output is a classification score (distance) for each image indicating the similarity to the BAG3 siRNA (score closer to 0) or Scramble siRNA (score closer to 1) training sets. For the MYBPC3 staining images, this classification score was dubbed “BAG3 Sarcomere Score”. The median score for each well was used for further analyses. Images from corner wells and conditions with less than 3 replicates were discarded. The R package EBImage80 was used for the quantification of nuclei and BAG3 staining intensities. Statistical significance for the differences across conditions was performed using a One-Way ANOVA with post-hoc multiple comparisons corrected by Dunnett test. Information on gene targets, siRNA sequences and analysis summary values can be found in Supplemental Data Table 4.
Bortezomib dose-response curve
Frozen iPS-CM or iPSc were thawed into 96-well plates. All lines were seeded in parallel at three different densities (15,000, 30,000, and 60,000 cells/well for iPS-CM; or 10,000/15,000/20,000 for iPSc), each in triplicate. Five days later (48h for iPSc), media was supplemented with the desired concentration of bortezomib (Sigma Aldrich) in DMSO. 48 hours later (24h for iPSc), wells were washed twice with PBS and added fresh media. Seven days later (24h for iPSc), resazurin blue reagent (PrestoBlue, Thermo Scientific) was used for 1 hour at 37°C. Fluorescence was read for each well using a SpectraMax i3 plate reader (Molecular Devices).
For each cell line and cell type, the seeding density that resulted in the most comparable baseline viability readout across lines for the DMSO-only condition was chosen for the calculations. Viability readout values were normalized to the range from 0 (media only) to 1 (vehicle-only) and fit on a two-parameter log-logistic dose-response model using the R package drc84. Confidence intervals were adjusted to control for family-wise error rates using the package multcomp85. Pairwise EC50 comparisons were then performed using a One-way ANOVA test with post hoc Sidak correction using Graphpad Prism (version 8.4.3.686 for Windows, GraphPad Software).
Extended Data
ED Fig.1. Expanded genetic data graphs for rs2234962, BAG3C151R, along with conservation of residues affected by BAG3C151R and BAG3E455K variants.

(A) Zoomed out version of Figure 1A, showing a window of 200KB. Dot color indicates type of nucleotide change. (B) Allele frequency map for rs2234962 depicting all 1000 Genomes populations. (C) Top: Diagram of BAG3 domain structure. Bottom: Amino acid conservation plot for matching BAG3 regions. Decreasing Relative Substitution Score regions (valleys) indicate sequences with high conservation across species and are annotated as Evolutionary Constrained Regions (ECRs). (D-E) Zoomed in regions for the ECRs around BAG3C151(D) and BAG3E455(E).
ED Fig.2. Co-precipitation profiles of different BAG3 variants overexpressed in a HEK293 cell background.

Dot size represents the amount of co-precipitated protein normalized across variants. Dot color represents absolute protein abundance (spectral counts). Dot rim represents statistical significance. Yellow colored variants are known pathogenic variants associated with DCM. Green variant is putative cardioprotective variant BAG3C151R. Red variant (BAG3P209L) is associated with skeletal myofibrillar myopathy. Black variants are not associated to DCM or any other pathology. Rightmost two columns depict data for BAG3 truncated variant without the BAG domain (BAG3_ ΔBAG) and for the BAG3 protein BAG domain only (BAG3_ΔBAG). For the truncated variants, no normalization by bait levels was performed. N=5 separate pulldown experiments. Bayesian False Discovery Rate (FDR) obtained using SAINTexpress analysis software (see Methods section).
ED Fig.3. Generation of the isogenic cell lines carrying BAG3 variants and a 3xFLAG epitope tag fusion in the endogenous copy of the BAG3 gene.

(A) Workflow for the cell line generation. (B) Strategy for the insertion of a 3xFLAG epitope fusion at the C-terminal of the BAG3 gene. The BAG3C151R-FLAG variant was generated using the same process on a preexisting cell line bearing the C151R mutation. To generate the BAG3E455K-FLAG cell line, the homology arms were engineered to contain the SNP and insert it during recombination. (C-D) Genotypes of the single-cell clones picked for 3xFLAG insertion (C) and the co-segregation of the BAG3E455K variant (D). (E) Genotyping the products of the 3xFLAG insertion by PCR. These genotyping reactions was performed at least twice with identical results. (F) Cells with a heterozygous insertion of the 3xFLAG epitope tag also had a SNP in the other allele that extended the BAG3 protein product by 4 amino acids. (G-H) A droplet digital PCR phasing test was used to select clones that contained the desired SNP variants and the 3xFLAG C-terminal sequence in the same allele. The test used different probes (G) to generate an estimate of linked molecules for each cell line and probe combination (H; See Methods for more details) (I) Insertion of the 3xFLAG fusion in the BAG3 gene did not alter the protein levels. N=4 and N=3 cell extracts from separate differentiation batches; analysis performed using a one-way ANOVA. Data is presented as mean values +/− SEM.
ED Fig.4. Generation of a cell line with inducible expression of the BAG3WT protein.

(A) Diagram of the editing strategy. On a BAG3−/− cell background, a doxycycline-activated BAG3-3xFLAG expression cassette was inserted in the PPP1R12C (AAVS1) safe-harbor locus. (B) Western blot of the BAG3 expression on BAG3−/−:TetOn-BAG3WT-3xFLAG iPSCs with and without Doxycycline addition. This immunoblotting reaction was performed twice with similar results.
ED Fig.5. Affinity purification - mass spectrometry characterization of BAG3 binding partners in a cardiomyocyte background.

(A) Venn diagram of the high confidence BAG3WT protein-protein interactions identified in three cellular backgrounds. HEK293T cells had overexpressed baits, while iPSC have much lower levels of endogenous BAG3 expression than iPS-CM, which could have influenced the results. Each cell type specific dataset was scored separately against its own matched control(s). (B) Volcano plots depicting co-precipitation intensity in BAG3WT cardiomyocytes treated with Bortezomib (100nM) relative to DMSO (1:10.000) for 24hours. Horizontal dashed line indicates statistical significance threshold (adjusted p-value <0.01) and vertical dashed lines indicate a fold change of 2. N=4 biological replicates from separate differentiation batches. Analysis performed using a hypervariate linear model analysis, and p-values were adjusted for multiple comparisons (see Methods section). (C) Network diagram of the iPS-CM co-precipitation partners identified for BAG3 in this study. Nodes in orange indicate partners that significantly changed when pulling down BAG3E455K. Nodes in Green indicate partners that significantly changed when pulling down BAG3C151R. Dashed lines: known interactions in the iRefIndex database. (D) Venn diagram comparing the BAG3 binding partners identified in an iPS-CM background when using endogenous basal levels of expression, an overexpression system, or endogenous expression under proteotoxic stress. The graph highlights the importance of using endogenous expression for accurate characterization of binding partners, and the information gained from using a stress state.
ED Fig.6. Additional sample micrographs from BAG3 knockdown iPS-CM.

(A) BAG3 silencing by siRNA was effective at reducing protein levels (~85% reduction). N=3 separate knockdown samples. Data is presented as mean values +/− SEM. (B) Additional sample micrographs from BAG3- and Scr-siRNA-treated iPS-CM, plus a no-siRNA condition. Orange arrowheads: BAG3 accumulation on myofibrillar breaks; white arrowheads: BAG3 accumulation on polar ends of cells; yellow arrowheads: iPS-CM displaying myofibrillar aggregation and collapse. These are sample micrographs from a set of randomly acquired images, 9 images per well across 3 separate wells. (C) Sample images in the same magnification used for the automated scoring analysis. Lower magnification allowed for faster acquisition and richer features to use directly in the scoring scheme, but higher magnification images were used elsewhere in this manuscript for easier viewing. These are sample micrographs from a set of 9 images per well across >20 separate wells (training wells for myofibrillar scoring).
ED Fig.7. Quality control and additional data from the myofibrillar scoring workflow.

(A) Western blot demonstrating that titration of BAG3 siRNA results in decreasing BAG3 and HSPB8 (affected by BAG3 downregulation) levels. N=2 separate knockdown experiments. (B) BAG3 sarcomere score inversely correlates with BAG3 protein levels. N = 2 biological replicates, with 9 images each. P-value and R2 obtained fitting a linear model. (C) BAG3 sarcomere score when MYBPC3 or cardiac troponin (cTnT) staining was used to train the model to score iPS-CM micrographs. Both myofibrillar protein stains resulted in clear discrimination of BAG3 and Scramble siRNA treated cells. N=63 images per siRNA from 21 separate knockdown wells. (D) MYBPC3 staining intensity for iPS-CM treated with different doses of BAG3 or MYBPC3 siRNA. N=2 separate knockdown experiments, with 9 images each. Data is presented as mean values +/− SEM. (E) Plot of the image scores that result from training based on BAG3 or DAPI staining. These stains do not display the same dynamic range as the myofibrillar (MYBPC3) staining. N=9 for scramble; 18 for the rest. Data is presented as mean values +/− 2x standard deviation. (F) BAG3 Sarcomere Score for the knockdown of selected factors that were not identified in our AP-MS studies. Dots represent mean of 3 replicates from separate wells, each being the median score of 9 images from the same well. Data is presented as mean values +/− SEM. P-val cutoff: 0.05 using a one-way ANOVA with post-hoc Dunnett test. (G-H) Plot of the nuclei count(G) and BAG3 staining(H) intensities for the gene knockdowns used in the siRNA-myofibrillar scoring analyses. Dots represent mean of 3 replicates from separate wells, each being the median score of 9 images from the same well. Data is presented as mean values +/− SEM. P-val cutoff: 0.05 using a one-way ANOVA with post-hoc Dunnett test. (I) Plotting of the APMS intensity ratio for BAG3E455K differential interactors and their BAG3 Sarcomere Score. There is no statistically significant correlation. P-value obtained fitting a linear model. Pearson’s product-moment correlation: −0.27.
ED Fig.8. Sample images from selected siRNA knockdowns.

(A) HSPB8 knockdown was the only knockdown to significantly reduce BAG3 levels. FLNA, DDB1 and STK38 are BAG3C151R differential interactors whose knockdown resulted in sarcomere scores similar to BAG3 knockdown. ACTN2 and TNNT2 are well known sarcomere components that display low sarcomere scores similar to BAG3 knockdown, possibly due to reduced sarcomeric density and increased disarray and their previously described role as BAG3 client proteins. HSPB7 and DNAJB6 knockdowns displayed high sarcomere scores (similar to Scramble control). (B) Additional micrographs from selected conditions, with stains in separate panels. HSPB8 highlighting reduction of BAG3 levels, and STUB1/CHIP resulting in an increase of BAG3 elongated aggregates. For all images, scale bar = 100 μM. Magenta/Red: BAG3; Green: MYBPC3; Cyan: DAPI. These sample micrographs were selected from a set of randomly acquired images, 9 images per well across 3 separate wells.
ED Fig.9. BAG3C151R variant does not alter Bortezomib EC50 in undifferentiated iPSc, and BAG3 overexpression rescues bortezomib sensitivity phenotype in BAG3−/− cells.

(A) Bortezomib dose-response curves for the data used for EC50 calculations in iPS-CM. (B-C) Independent replication of the dose-response curve for Bortezomib in iPS-CM expressing the BAG3C151R variant in heterozygosity or homozygosity. N=3 separate sets of cells. Data is presented as EC50 and error bars denote 95% confidence intervals. ****: P-value<0.0001 and ***: p-value<0.01 using one-way ANOVA with post-hoc Zidak correction. (D-E) Plot of calculated EC50 and dose response curves for Bortezomib in undifferentiated iPSc from different cell lines used in this study. N=3 separate sets of cells. ****: P-value<0.0001 and **: p-value<0.01 using one-way ANOVA with post-hoc Zidak correction. The higher EC50 value for the BAG3−/− cell line is explained by the faster growth rate of that iPSc line. Data is presented as EC50 and error bars denote 95% confidence intervals. (F-G) Calculated EC50 with 95% confidence intervals and dose-response curves for Bortezomib in control (WT/WT), and BAG3−/− iPS-CM with and without BAG3 overexpression. N=3 separate sets of cells. Data is presented as EC50 and error bars denote 95% confidence intervals. ****: P-value<0.0001 using one-way ANOVA with post-hoc Zidak correction. Connecting line and error bands in panels A, C, E and G are based on prediction from fitted dose-response model and 95% confidence intervals, respectively.
ED Fig.10. BAG3 variants do not change BAG3 protein levels in iPS-CMs.

Capillary immunoassay (SimpleWestern) quantification of BAG3 protein levels in iPS-CM differentiated from iPSCs heterozygous or homozygous for the indicated BAG3 alleles, untreated or treated with Bortezomib (100nM, 48h incubation). N=3 biological replicates from separate differentiation batches. ***: p-value<0.01; ****: p-value<0.0001. Two-way ANOVA with Sidak multiple comparison test. Data is presented as mean values +/− SEM.
Supplementary Material
Acknwledgements
We thank the Gladstone Stem Cell Core and the Gladstone Assay Development and Drug Discovery Core for providing their technical support and experimental expertise. We also would like to thank Dr. Reuben Thomas from the Gladstone Institutes Bioinformatics core for his advice on data analysis. We are also very grateful to Dr. Jeff Johnson, Dr. Ruth Huttenhain and Dr. Gwendolyn Jang from UC San Francisco and Gladstone Institutes for their advice on affinity purification and mass spectrometry experiments. We thank Prof. Jason Gestwicki and their team (UC San Francisco) for their scientific and technical advice. We thank Amanda Chan, Alisha Birk, Edward Shin, Chiara Marley and Serah Kang (Gladstone Institutes) for their technical support. We also thank Francoise Chanut from Gladstone Institutes Editorial Services for her feedback on manuscript preparation. We would also like to thank the scientific reviewers at Nature Cardiovascular Research for their invaluable feedback, which contributed greatly to improving this manuscript.
Funding
J.A.P.B. was supported by a Graduate Fellowship from Fundación “La Caixa” (ID 100010434, #LCF/BQ/US10/10230024), a Bristol-Myers Squibb PCO Graduate Fellowship for Assessing Early Drug Liabilities (ID No. 63376), and a Predoctoral Fellowship from the American Heart Association (15PRE2570008507 and 13PRE1612001307). B.R.C. was supported by the National Institutes of Health (R01-HL130533, R01-HL13535801, P01-HL146366) and by funding from Tenaya Therapeutics. B.R.C. acknowledges support through a gift from the Roddenberry Foundation and Pauline and Thomas Tusher. N.J.K. was supported by P01 HL146366. R.M.K. was supported by NIH fellowship F32AI127291. L.M.J. was supported by a postdoctoral fellowship from the California Institute of Regenerative Medicine (CIRM; TG2-01160) and a Career Development Award from the National Institute of Child Health and Development (1K12HD072222). The remaining authors received no specific funding for this work.
Footnotes
Competing Interests Statement
B.R.C. is a founder of Tenaya Therapeutics (www.tenayatherapeutics.com), a company focused on finding treatments for heart failure, including genetic cardiomyopathies. B.R.C. and J.J.H. hold equity in Tenaya. The Krogan Laboratory has received research support from Vir Biotechnology and F. Hoffmann-La Roche. N.J.K. has a consulting agreements with the Icahn School of Medicine at Mount Sinai, New York. He is a shareholder of Tenaya Therapeutics, Maze Therapeutics and Interline Therapeutics. The remaining authors declare no competing interests.
Data Availability Statement
Mass spectrometry raw data and Skyline files for the targeted proteomics quantification have been deposited to the ProteomeXchange Consortium using the Panorama Public partner repository (link: https://panoramaweb.org/28ZWVY.url). Any additional data used for analyses not available as Supplemental Information is available from the authors upon request.
References
- 1.Virani SS et al. Heart Disease and Stroke Statistics-2021 Update: A Report From the American Heart Association. Circulation 143, e254–e743 (2021). [DOI] [PubMed] [Google Scholar]
- 2.Burke MA, Cook SA, Seidman JG & Seidman CE Clinical and Mechanistic Insights Into the Genetics of Cardiomyopathy. J. Am. Coll. Cardiol 68, 2871–2886 (2016). [DOI] [PMC free article] [PubMed] [Google Scholar]
- 3.Weintraub RG, Semsarian C & Macdonald P. Dilated cardiomyopathy. Lancet 390, 400–414 (2017). [DOI] [PubMed] [Google Scholar]
- 4.Harper AR, Nayee S & Topol EJ Protective alleles and modifier variants in human health and disease. Nat. Rev. Genet 16, 689–701 (2015). [DOI] [PubMed] [Google Scholar]
- 5.Villard E. et al. A genome-wide association study identifies two loci associated with heart failure due to dilated cardiomyopathy. Eur. Heart J 32, 1065–1076 (2011). [DOI] [PMC free article] [PubMed] [Google Scholar]
- 6.Esslinger U. et al. Exome-wide association study reveals novel susceptibility genes to sporadic dilated cardiomyopathy. PLoS One 12, e0172995 (2017). [DOI] [PMC free article] [PubMed] [Google Scholar]
- 7.Aragam KG et al. Phenotypic refinement of heart failure in a national biobank facilitates genetic discovery. Circulation (2018). doi: 10.1161/CIRCULATIONAHA.118.035774 [DOI] [PMC free article] [PubMed] [Google Scholar]
- 8.Shah S. et al. Genome-wide association and Mendelian randomisation analysis provide insights into the pathogenesis of heart failure. Nat. Commun 11, 163 (2020). [DOI] [PMC free article] [PubMed] [Google Scholar]
- 9.Choquet H. et al. Meta-Analysis of 26 638 Individuals Identifies Two Genetic Loci Associated With Left Ventricular Ejection Fraction. Circ. Genom. Precis. Med 13, e002804 (2020). [DOI] [PMC free article] [PubMed] [Google Scholar]
- 10.Verweij N. et al. The genetic makeup of the electrocardiogram. Cell Syst. 11, 229–238.e5 (2020). [DOI] [PMC free article] [PubMed] [Google Scholar]
- 11.de Denus S. et al. A genetic association study of heart failure: more evidence for the role of BAG3 in idiopathic dilated cardiomyopathy. ESC Heart Fail. (2020). doi: 10.1002/ehf2.12934 [DOI] [PMC free article] [PubMed] [Google Scholar]
- 12.Garnier S. et al. Genome-wide association analysis in dilated cardiomyopathy reveals two new players in systolic heart failure on chromosomes 3p25.1 and 22q11.23. Eur. Heart J 42, 2000–2011 (2021). [DOI] [PMC free article] [PubMed] [Google Scholar]
- 13.Aung N. et al. Genome-Wide Analysis of Left Ventricular Image-Derived Phenotypes Identifies Fourteen Loci Associated With Cardiac Morphogenesis and Heart Failure Development. Circulation 140, 1318–1330 (2019). [DOI] [PMC free article] [PubMed] [Google Scholar]
- 14.Norton N. et al. Genome-wide studies of copy number variation and exome sequencing identify rare variants in BAG3 as a cause of dilated cardiomyopathy. Am. J. Hum. Genet 88, 273–282 (2011). [DOI] [PMC free article] [PubMed] [Google Scholar]
- 15.Feldman AM et al. Decreased levels of BAG3 in a family with a rare variant and in idiopathic dilated cardiomyopathy. J. Cell Physiol 229, 1697–1702 (2014). [DOI] [PMC free article] [PubMed] [Google Scholar]
- 16.Homma S. et al. BAG3 deficiency results in fulminant myopathy and early lethality. Am. J. Pathol 169, 761–773 (2006). [DOI] [PMC free article] [PubMed] [Google Scholar]
- 17.Behl C. Breaking BAG: The Co-Chaperone BAG3 in Health and Disease. Trends Pharmacol. Sci 37, 672–688 (2016). [DOI] [PubMed] [Google Scholar]
- 18.Knezevic T. et al. BAG3: a new player in the heart failure paradigm. Heart Fail. Rev 20, 423–434 (2015). [DOI] [PMC free article] [PubMed] [Google Scholar]
- 19.Gamerdinger M, Carra S & Behl C. Emerging roles of molecular chaperones and co-chaperones in selective autophagy: focus on BAG proteins. J. Mol. Med 89, 1175–1182 (2011). [DOI] [PubMed] [Google Scholar]
- 20.Martin TG & Kirk JA Under construction: The dynamic assembly, maintenance, and degradation of the cardiac sarcomere. J. Mol. Cell Cardiol 148, 89–102 (2020). [DOI] [PMC free article] [PubMed] [Google Scholar]
- 21.Judge LM et al. A BAG3 chaperone complex maintains cardiomyocyte function during proteotoxic stress. JCI Insight (2017). [DOI] [PMC free article] [PubMed] [Google Scholar]
- 22.Ulbricht A, Arndt V & Höhfeld J. Chaperone-assisted proteostasis is essential for mechanotransduction in mammalian cells. Commun Integr Biol 6, e24925 (2013). [DOI] [PMC free article] [PubMed] [Google Scholar]
- 23.Fang X. et al. Loss-of-function mutations in co-chaperone BAG3 destabilize small HSPs and cause cardiomyopathy. J. Clin. Invest (2017). [DOI] [PMC free article] [PubMed] [Google Scholar]
- 24.Martin TG et al. Cardiomyocyte contractile impairment in heart failure results from reduced BAG3-mediated sarcomeric protein turnover. Nat. Commun 12, 2942 (2021). [DOI] [PMC free article] [PubMed] [Google Scholar]
- 25.Franaszczyk M. et al. The BAG3 gene variants in Polish patients with dilated cardiomyopathy: four novel mutations and a genotype-phenotype correlation. J. Transl. Med 12, 192 (2014). [DOI] [PMC free article] [PubMed] [Google Scholar]
- 26.Chami N. et al. Nonsense mutations in BAG3 are associated with early-onset dilated cardiomyopathy in French Canadians. Can. J. Cardiol 30, 1655–1661 (2014). [DOI] [PubMed] [Google Scholar]
- 27.Citro R. et al. Polymorphisms of the antiapoptotic protein bag3 may play a role in the pathogenesis of tako-tsubo cardiomyopathy. Int. J. Cardiol 168, 1663–1665 (2013). [DOI] [PubMed] [Google Scholar]
- 28.Meister-Broekema M. et al. Myopathy associated BAG3 mutations lead to protein aggregation by stalling Hsp70 networks. Nat. Commun 9, 5342 (2018). [DOI] [PMC free article] [PubMed] [Google Scholar]
- 29.Lo Sardo V. et al. Unveiling the Role of the Most Impactful Cardiovascular Risk Locus through Haplotype Editing. Cell 175, 1796–1810.e20 (2018). [DOI] [PMC free article] [PubMed] [Google Scholar]
- 30.Kishore S. et al. A Non-Coding Disease Modifier of Pancreatic Agenesis Identified by Genetic Correction in a Patient-Derived iPSC Line. Cell Stem Cell 27, 137–146.e6 (2020). [DOI] [PMC free article] [PubMed] [Google Scholar]
- 31.Wang G. et al. Modeling the mitochondrial cardiomyopathy of Barth syndrome with induced pluripotent stem cell and heart-on-chip technologies. Nat. Med 20, 616–623 (2014). [DOI] [PMC free article] [PubMed] [Google Scholar]
- 32.Warren CR et al. Induced pluripotent stem cell differentiation enables functional validation of GWAS variants in metabolic disease. Cell Stem Cell 20, 547–557.e7 (2017). [DOI] [PubMed] [Google Scholar]
- 33.Domínguez F. et al. Dilated Cardiomyopathy Due to BLC2-Associated Athanogene 3 (BAG3) Mutations. J. Am. Coll. Cardiol 72, 2471–2481 (2018). [DOI] [PMC free article] [PubMed] [Google Scholar]
- 34.McDermott-Roe C. et al. Investigation of a dilated cardiomyopathy–associated variant in BAG3 using genome-edited iPSC-derived cardiomyocytes. JCI Insight (2019). [DOI] [PMC free article] [PubMed] [Google Scholar]
- 35.Orciuolo E. et al. Unexpected cardiotoxicity in haematological bortezomib treated patients. Br. J. Haematol 138, 396–397 (2007). [DOI] [PubMed] [Google Scholar]
- 36.Grandin EW, Ky B, Cornell RF, Carver J & Lenihan DJ Patterns of cardiac toxicity associated with irreversible proteasome inhibition in the treatment of multiple myeloma. J Card Fail 21, 138–144 (2015). [DOI] [PubMed] [Google Scholar]
- 37.Kieserman JM, Myers VD, Dubey P, Cheung JY & Feldman AM Current landscape of heart failure gene therapy. J. Am. Heart Assoc 8, e012239 (2019). [DOI] [PMC free article] [PubMed] [Google Scholar]
- 38.Knezevic T. et al. Adeno-associated Virus Serotype 9 - Driven Expression of BAG3 Improves Left Ventricular Function in Murine Hearts with Left Ventricular Dysfunction Secondary to a Myocardial Infarction. JACC Basic Transl. Sci 1, 647–656 (2016). [DOI] [PMC free article] [PubMed] [Google Scholar]
- 39.Grafton F. et al. Deep learning detects cardiotoxicity in a high-content screen with induced pluripotent stem cell-derived cardiomyocytes. Elife 10, (2021). [DOI] [PMC free article] [PubMed] [Google Scholar]
- 40.Maddah M. et al. Quantifying drug-induced structural toxicity in hepatocytes and cardiomyocytes derived from hiPSCs using a deep learning method. J. Pharmacol. Toxicol. Methods 105, 106895 (2020). [DOI] [PubMed] [Google Scholar]
- 41.Rosales W & Lizcano F. The Histone Demethylase JMJD2A Modulates the Induction of Hypertrophy Markers in iPSC-Derived Cardiomyocytes. Front. Genet 9, 14 (2018). [DOI] [PMC free article] [PubMed] [Google Scholar]
- 42.Fine M. et al. Human-induced pluripotent stem cell-derived cardiomyocytes for studies of cardiac ion transporters. Am. J. Physiol. Cell Physiol 305, C481–91 (2013). [DOI] [PMC free article] [PubMed] [Google Scholar]
- 43.Yang J. et al. Phenotypic screening with deep learning identifies HDAC6 inhibitors as cardioprotective in a BAG3 mouse model of dilated cardiomyopathy. Sci. Transl. Med 14, eabl5654 (2022). [DOI] [PubMed] [Google Scholar]
- 44.Schroer A, Pardon G, Castillo E, Blair C & Pruitt B. Engineering hiPSC cardiomyocyte in vitro model systems for functional and structural assessment. Prog. Biophys. Mol. Biol 144, 3–15 (2019). [DOI] [PMC free article] [PubMed] [Google Scholar]
- 45.van Mil A. et al. Modelling inherited cardiac disease using human induced pluripotent stem cell-derived cardiomyocytes: progress, pitfalls, and potential. Cardiovasc. Res 114, 1828–1842 (2018). [DOI] [PMC free article] [PubMed] [Google Scholar]
- 46.Musunuru K. et al. Induced pluripotent stem cells for cardiovascular disease modeling and precision medicine: A scientific statement from the american heart association. Circ. Genom. Precis. Med 11, e000043 (2018). [DOI] [PMC free article] [PubMed] [Google Scholar]
- 47.Kane RC, Farrell AT, Sridhara R & Pazdur R. United States Food and Drug Administration approval summary: bortezomib for the treatment of progressive multiple myeloma after one prior therapy. Clin. Cancer Res 12, 2955–2960 (2006). [DOI] [PubMed] [Google Scholar]
- 48.Métais A. et al. Asb2α-Filamin A Axis Is Essential for Actin Cytoskeleton Remodeling During Heart Development. Circ. Res 122, e34–e48 (2018). [DOI] [PubMed] [Google Scholar]
- 49.Mao Z & Nakamura F. Structure and Function of Filamin C in the Muscle Z-Disc. Int. J. Mol. Sci 21, (2020). [DOI] [PMC free article] [PubMed] [Google Scholar]
- 50.Collier MP et al. HspB1 phosphorylation regulates its intramolecular dynamics and mechanosensitive molecular chaperone interaction with filamin C. Sci. Adv 5, eaav8421 (2019). [DOI] [PMC free article] [PubMed] [Google Scholar]
- 51.Waldt N. et al. Filamin A Phosphorylation at Serine 2152 by the Serine/Threonine Kinase Ndr2 Controls TCR-Induced LFA-1 Activation in T Cells. Front. Immunol 9, 2852 (2018). [DOI] [PMC free article] [PubMed] [Google Scholar]
- 52.Klimek C. et al. The Hippo network kinase STK38 contributes to protein homeostasis by inhibiting BAG3-mediated autophagy. Biochim. Biophys. Acta Mol. Cell Res 1866, 1556–1566 (2019). [DOI] [PMC free article] [PubMed] [Google Scholar]
- 53.Fang X, Bogomolovas J, Trexler C & Chen J. The BAG3-dependent and -independent roles of cardiac small heat shock proteins. JCI Insight (2019). [DOI] [PMC free article] [PubMed] [Google Scholar]
- 54.Muranova LK, Shatov VM, Slushchev AV & Gusev NB Quaternary Structure and Hetero-Oligomerization of Recombinant Human Small Heat Shock Protein HspB7 (cvHsp). Int. J. Mol. Sci 22, (2021). [DOI] [PMC free article] [PubMed] [Google Scholar]
- 55.Rauch JN & Gestwicki JE Binding of human nucleotide exchange factors to heat shock protein 70 (Hsp70) generates functionally distinct complexes in vitro. J. Biol. Chem 289, 1402–1414 (2014). [DOI] [PMC free article] [PubMed] [Google Scholar]
- 56.Clarke L. et al. The international Genome sample resource (IGSR): A worldwide collection of genome variation incorporating the 1000 Genomes Project data. Nucleic Acids Res. 45, D854–D859 (2017). [DOI] [PMC free article] [PubMed] [Google Scholar]
- 57.Marcus JH & Novembre J. Visualizing the geography of genetic variants. Bioinformatics 33, 594–595 (2017). [DOI] [PMC free article] [PubMed] [Google Scholar]
- 58.Chang KT, Guo J, di Ronza A & Sardiello M. Aminode: identification of evolutionary constraints in the human proteome. Sci. Rep 8, 1357 (2018). [DOI] [PMC free article] [PubMed] [Google Scholar]
- 59.Mandegar MA et al. CRISPR Interference Efficiently Induces Specific and Reversible Gene Silencing in Human iPSCs. Cell Stem Cell 18, 541–553 (2016). [DOI] [PMC free article] [PubMed] [Google Scholar]
- 60.Miyaoka Y. et al. Isolation of single-base genome-edited human iPS cells without antibiotic selection. Nat. Methods 11, 291–293 (2014). [DOI] [PMC free article] [PubMed] [Google Scholar]
- 61.Hockemeyer D. et al. Genetic engineering of human pluripotent cells using TALE nucleases. Nat. Biotechnol 29, 731–734 (2011). [DOI] [PMC free article] [PubMed] [Google Scholar]
- 62.Regan JF et al. A rapid molecular approach for chromosomal phasing. PLoS One 10, e0118270 (2015). [DOI] [PMC free article] [PubMed] [Google Scholar]
- 63.Guan S, Price JC, Prusiner SB, Ghaemmaghami S & Burlingame AL A data processing pipeline for mammalian proteome dynamics studies using stable isotope metabolic labeling. Mol. Cell Proteomics 10, M111.010728 (2011). [DOI] [PMC free article] [PubMed] [Google Scholar]
- 64.Verschueren E. et al. Scoring Large-Scale Affinity Purification Mass Spectrometry Datasets with MiST. Curr Protoc Bioinformatics 49, 8.19.1–8.19.16 (2015). [DOI] [PMC free article] [PubMed] [Google Scholar]
- 65.Teo G. et al. SAINTexpress: improvements and additional features in Significance Analysis of INTeractome software. J. Proteomics 100, 37–43 (2014). [DOI] [PMC free article] [PubMed] [Google Scholar]
- 66.Knight JDR et al. ProHits-viz: a suite of web tools for visualizing interaction proteomics data. Nat. Methods 14, 645–646 (2017). [DOI] [PMC free article] [PubMed] [Google Scholar]
- 67.Shannon P. et al. Cytoscape: a software environment for integrated models of biomolecular interaction networks. Genome Res. 13, 2498–2504 (2003). [DOI] [PMC free article] [PubMed] [Google Scholar]
- 68.Giurgiu M. et al. CORUM: the comprehensive resource of mammalian protein complexes-2019. Nucleic Acids Res. 47, D559–D563 (2019). [DOI] [PMC free article] [PubMed] [Google Scholar]
- 69.Cox J & Mann M. MaxQuant enables high peptide identification rates, individualized p.p.b.-range mass accuracies and proteome-wide protein quantification. Nat. Biotechnol 26, 1367–1372 (2008). [DOI] [PubMed] [Google Scholar]
- 70.Teo G. et al. SAINTq: Scoring protein-protein interactions in affinity purification - mass spectrometry experiments with fragment or peptide intensity data. Proteomics 16, 2238–2245 (2016). [DOI] [PubMed] [Google Scholar]
- 71.Hulsen T, de Vlieg J & Alkema W. BioVenn – a web application for the comparison and visualization of biological lists using area-proportional Venn diagrams. BMC Genomics 9, 488 (2008). [DOI] [PMC free article] [PubMed] [Google Scholar]
- 72.Larsson J. eulerr: Area-Proportional Euler and Venn Diagrams with Ellipses [R package eulerr version 6.1.0]. (2020). at <https://cran.r-project.org/web/packages/eulerr/index.html> [Google Scholar]
- 73.Kusebauch U. et al. Human srmatlas: A resource of targeted assays to quantify the complete human proteome. Cell 166, 766–778 (2016). [DOI] [PMC free article] [PubMed] [Google Scholar]
- 74.Pino LK et al. The Skyline ecosystem: Informatics for quantitative mass spectrometry proteomics. Mass Spectrom Rev 39, 229–244 (2020). [DOI] [PMC free article] [PubMed] [Google Scholar]
- 75.Peterson AC, Russell JD, Bailey DJ, Westphall MS & Coon JJ Parallel reaction monitoring for high resolution and high mass accuracy quantitative, targeted proteomics. Mol. Cell Proteomics 11, 1475–1488 (2012). [DOI] [PMC free article] [PubMed] [Google Scholar]
- 76.Choi M. et al. MSstats: an R package for statistical analysis of quantitative mass spectrometry-based proteomic experiments. Bioinformatics 30, 2524–2526 (2014). [DOI] [PubMed] [Google Scholar]
- 77.Ritchie ME et al. limma powers differential expression analyses for RNA-sequencing and microarray studies. Nucleic Acids Res. 43, e47 (2015). [DOI] [PMC free article] [PubMed] [Google Scholar]
- 78.Phipson B, Lee S, Majewski IJ, Alexander WS & Smyth GK Robust hyperparameter estimation protects against hypervariable genes and improves power to detect differential expression. Ann Appl Stat 10, 946–963 (2016). [DOI] [PMC free article] [PubMed] [Google Scholar]
- 79.Sharma V. et al. Panorama public: A public repository for quantitative data sets processed in skyline. Mol. Cell Proteomics 17, 1239–1244 (2018). [DOI] [PMC free article] [PubMed] [Google Scholar]
- 80.Pau G, Fuchs F, Sklyar O, Boutros M & Huber W. EBImage--an R package for image processing with applications to cellular phenotypes. Bioinformatics 26, 979–981 (2010). [DOI] [PMC free article] [PubMed] [Google Scholar]
- 81.Schindelin J. et al. Fiji: an open-source platform for biological-image analysis. Nat. Methods 9, 676–682 (2012). [DOI] [PMC free article] [PubMed] [Google Scholar]
- 82.Maddah M. et al. A non-invasive platform for functional characterization of stem-cell-derived cardiomyocytes with applications in cardiotoxicity testing. Stem Cell Rep. 4, 621–631 (2015). [DOI] [PMC free article] [PubMed] [Google Scholar]
- 83.Grafton F. et al. Deep Learning Predicts Patterns of Cardiotoxicity in a High-Content Screen Using Induced Pluripotent Stem Cell–Derived Cardiomyocytes. BioRxiv (2021). doi: 10.1101/2021.03.23.436666 [DOI] [PMC free article] [PubMed] [Google Scholar]
- 84.Ritz C, Baty F, Streibig JC & Gerhard D. Dose-Response Analysis Using R. PLoS One 10, e0146021 (2015). [DOI] [PMC free article] [PubMed] [Google Scholar]
- 85.Hothorn T, Bretz F & Westfall P. Simultaneous inference in general parametric models. Biom J 50, 346–363 (2008). [DOI] [PubMed] [Google Scholar]
Associated Data
This section collects any data citations, data availability statements, or supplementary materials included in this article.
Supplementary Materials
Data Availability Statement
Mass spectrometry raw data and Skyline files for the targeted proteomics quantification have been deposited to the ProteomeXchange Consortium using the Panorama Public partner repository (link: https://panoramaweb.org/28ZWVY.url). Any additional data used for analyses not available as Supplemental Information is available from the authors upon request.