

Abstract
The family of proteins homologous to the green fluorescent protein (GFP) from Aequorea victoria exhibits striking diversity of features, including several different types of autocatalytically synthesized chromophores. Here we report 11 new members of the family, among which there are 3 red-emitters possessing unusual features, and discuss the similarity relationships within the family in structural, spectroscopic, and evolutionary terms. Phylogenetic analysis has shown that GFP-like proteins from representatives of subclass Zoantharia fall into at least four distinct clades, each clade containing proteins of more than one emission color. This topology suggests multiple recent events of color conversion. Combining this result with previous mutagenesis and structural data, we propose that (i) different chromophore structures are alternative products synthesized within a similar autocatalytic environment, and (ii) the phylogenetic pattern and color diversity in reef Anthozoa is a result of a balance between selection for GFP-like proteins of particular colors and mutation pressure driving the color conversions.
Green fluorescent protein (GFP) from bioluminescent jellyfish Aequorea victoria is widely known for its usefulness in biotechnology. Its unique ability to synthesize chromophore within itself, without any need for external substrates or cofactors except molecular oxygen (1), made it an excellent in vivo marker of gene expression and protein localization in various biological systems. However, it was not until the discovery of GFP-like proteins in nonbioluminescent representatives of class Anthozoa (2) that the actual diversity of GFP-like proteins was fully realized. GFP-like proteins are responsible not only for fluorescent colors in Anthozoa, but also for nonfluorescent purple-blue colors (3–5). It was concluded that, apart from brownish pigmentation caused by symbiotic zooxanthellae, most of the colors perceived in reef Anthozoa are the results of GFP-like proteins, and therefore, they should be considered major color determinants in these organisms (6). With these findings, the GFP research takes a new very interesting direction related to evolutionary ecology rather than biotechnology. Anthozoa represent a unique case when each color is essentially determined by a sequence of a single protein molecule, thus offering an opportunity to apply molecular phylogenetic tools directly to the study of color evolution. It can be expected that in this way it will be eventually possible to obtain clear clues as to the origins of the legendary variety of reef colors, the phenomenon that, despite its prominence, still awaits general scientific explanation.
In this article, we present 11 new GFP-like proteins, bringing the total number of cloned and spectroscopically characterized family members to 27. Taking advantage of this large body of sequence-spectral data, we propose classification criteria for the family and perform phylogenetic analysis. Our data provide clues to the structural basis of color diversity of GFP-like proteins, as well as to the evolutionary forces producing and maintaining this diversity in reef Anthozoa.
Materials and Methods
Collection of Samples.
Samples (100–500 mg of tissue) of Montastraea cavernosa, Condylactis gigantea, Scolumia cubensis, and Ricordea florida were collected at the Florida Keys Marine Sanctuary (Long Key) under National Marine Sanctuary authorization FKNMS-2000-009. The samples were collected during night dives, and candidate specimens were selected on the basis of their appearance under a UV flashlight. Other samples (Dendronephthya sp., Heteractis crispa, Discosoma sp. 3, and Zoanthus sp. 2) were obtained from private seawater aquariums.
Cloning, Expression, and Spectroscopic Analysis of GFP-Like Proteins.
Total RNA was isolated from the tissue samples following the protocol described in ref. 7. Total cDNA was amplified by using the SMART cDNA amplification kit (CLONTECH). These amplified cDNA samples were used to amplify 3′ fragments of cDNAs coding for GFP-like proteins and then to obtain the missing 5′ flanks, exactly as described in ref. 2. After determining the complete cDNA sequence, the coding regions were amplified by using the same cDNA samples as were used to clone the 3′ and 5′ flanks as templates. An upstream (“N-terminal”) primer had a 5′ heel (5′-tTGAtTGAtTGAAGGAGAaatatc), carrying stop codons (bold) in all frames and bacterial ribosome-binding site (underlined), followed by the target cDNA sequence (20–22 bases) starting with the initiation codon of the ORF. The downstream (“C-terminal”) primer was 22–25-bases-long and corresponded to the antisense sequence of cDNA around the stop codon of the ORF. The resulting fragments were cloned by using a pGEM-T vector cloning kit (Promega) following the manufacturer's protocol, using Escherichia coli JM109 strain as host. The colonies were grown on LB/agar/carbenicillin plates supplemented with 0.3 mM of IPTG for 16–20 h at 37°C and then incubated for 2 days at 4°C. The fluorescent colonies were selected by using a fluorescent microscope and streaked widely on new plates. The same colonies were used for overnight culture inoculation followed by plasmid isolation and sequencing, to confirm the identity of the clone. The bacteria were harvested from the plates, suspended in 1 ml of PBS, and disrupted by sonication. The lysate was cleared by centrifugation (5,000 × g, 10 min at room temperature), and its fluorescent properties were determined by using an LS-50B spectrofluorometer (Perkin–Elmer); emission spectra were corrected for the dependence of photomultiplier sensitivity on the wavelength. For mcavRFP and rfloGFP, the “early” samples were harvested after 24 h at 37°C; the “late” samples were harvested after 24 h at 37°C followed by 4 days at 4°C.
Phylogenetic Analysis.
The alignment of GFP-like proteins (see supporting information, which is published on the PNAS web site, www.pnas.org) was constructed after ref. 2, taking into account constraints of the protein structure. Subsequently, the DNA alignment was made by following the protein alignment, excluding the poorly aligned N- and C-terminal regions. The phylogenetic tree was constructed by using tree-puzzle software (8) under an HKY model of DNA evolution (9), assuming that the variability of sites follows γ distribution with α parameter estimated from the data set. The tree was confirmed to be the maximum likelihood tree by paml software (http://abacus.gene.ucl.ac.uk/software/paml.html; ref. 10) under an REV model (11). The tree built by tree-puzzle from protein alignment [JTT model (12)] had the same topology but lower support values because of the smaller number of informative sites in the protein alignment.
Results and Discussion
Nomenclature.
For the sake of clarity of phylogenetic analysis representation, and in accord with the newly proposed classification principle (see below), in this article we are using new nomenclature for GFP-like proteins. Our protein identification tags include a four-letter leader composed of the first letter of the genus name and three initial letters of the species name, followed by definition of color type: GFP, green; RFP, red; YFP, yellow; and CP, chromoprotein (nonfluorescent). When the species is not defined, the leader has four initial letters of the genus name. In the case of multiple unidentified species of the same genus, a number is added to the leader (such as in dis3GFP or zoan2RFP). In the case of several proteins of the same color type found in the same species, the number is added to the color definition (such as in scubGFP1 and scubGFP2). For A. victoria GFP and drFP583 from Discosoma sp., widely accepted common names, GFP and DsRed, are kept.
New GFP-Like Proteins.
A total of 11 new GFP-like proteins was cloned and spectroscopically characterized. Their spectral features are summarized in Table 1; the excitation/emission spectra for all of them can be found in supporting information.
Table 1.
Summary of spectral features and chromophore structures in the family of GFP-like proteins
 |
Note that this article uses different names for GFP-like proteins than proposed in original publications (the original names, where available, are given in brackets in the first column, see text for nomenclature details).
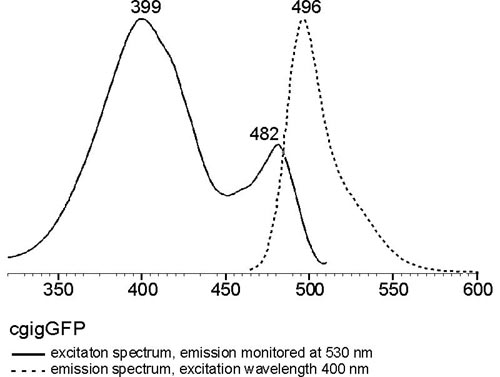
The new set includes representatives exhibiting features not seen before in Anthozoan GFP-like proteins. Two green proteins from C. gigantea (cgigGFP) and H. crispa (hcriGFP) possess double-peaked excitation spectra very similar to those of wild-type GFP, suggesting that their chromophores undergo photoconversion between neutral and ionized states (13, 14). The red-emitting protein zoan2RFP, although very similar to DsRed in the shape of excitation/emission curves, behaves as a “timer”—it turns green at first and then matures into red (Fig. 1 A and B), similarly to one of the mutant variants of DsRed (15). The two new red-emitters from great star coral Montastraea cavernosa (mcavRFP) and Florida corallimorph Ricordea florida (rfloRFP) also show a “timer” phenotype (Fig. 1 C–F). In contrast to zoan2RFP, they failed to mature completely into red in our bacterial expression trials, which resulted in two-peak emission spectra such as those shown in Fig. 1 D and F. Both these proteins exhibited two features that make them different from the rest of the red-emitters. First, the red emission band in the more mature form had a major excitation peak virtually identical to the one of the immature green form, the yellow-orange excitation peak being significantly smaller (Fig. 2). In other orange-red proteins, the red emission is excited best in the yellow-orange region (Table 1, spectra E). This unusual shape of excitation spectra may be the result of photoconversion of the ionization states of the chromophore [by analogy with green proteins (13, 14)]. The striking similarity of major excitation peaks for mature and immature proteins, however, makes it tempting to suggest that in mcavRFP and rfloRFP, the “built-in” fluorescence resonance energy transfer (FRET) from the immature green form of the protein to the mature red form is the major mechanism giving rise to red emission. The second specific feature of mcavRFP and rfloRFP is the shape of their red emission curve: its major peak is narrow and almost symmetrical in contrast to the wide and skewed emission peak of the other red-emitters. In addition, there is a distinctive shoulder at approximately 630 nm (compare spectra E and F in Table 1). Because a GFP-type photoconversion, if it is present, is unlikely to have so much effect on the shape of emission spectra (16), these differences may indicate alterations in the covalent structure of the chromophore as compared with other red-emitters. At present, it is unclear whether these two features are linked at the structural or photochemical levels. Further research is necessary to gain better insight into this problem.
Figure 1.

Changes of emission spectra during maturation of the new red-emitters, zoan2RFP (A and B), mcavRFP (C and D), and rfloRFP (E and F). The excitation wavelength is given within each graph. Horizontal axis is wavelength in nanometers, vertical axis is fluorescence intensity. Maturation stages: A, C, and E, early; B, D, and F, late (see Materials and Methods for details). All of the three proteins exhibit “timer” phenotype (green emission at first and red emission arising later). Note that zoan2RFP matures significantly faster than mcavRFP and rfloRFP. Even at the “early” stage, the red emission peak is very pronounced, and by the “late” stage, the protein converts into red completely. In contrast, mcavRFP and rfloRFP fail to undergo such a complete maturation.
Figure 2.

Details on excitation spectra of mcavRFP (A and B) and rfloRFP (C and D). Wavelengths at which the emission was monitored are given within the graphs. (A and C) Excitation spectra of the green emission band in the immature protein, lacking the red emission. (B and D) Excitation spectra of the red emission band in a more mature form. Horizontal axis is wavelength in nanometers, vertical axis is emission amplitude. Note that in both proteins the major excitation peaks for immature green and mature red forms are virtually identical to each other.
Structural/Spectral Types of GFP-Like Proteins.
We propose to classify GFP-like proteins by their color as it appears to human eye. On the basis of the currently available data set of sequenced and spectroscopically characterized proteins, we discriminate four color types of GFP-like proteins: green, yellow, orange-red, and purple-blue, or chromoproteins (Table 1). The proteins having excitation/emission spectra such as in row A of Table 1 are sometimes called cyan or even blue (6, 17), because of their appearance under certain microscopy optics, but to the human eye, the color of these proteins after purification still appears bright green (2, 18). It must be noted that, in addition to the four colors discussed here, corals exhibit at least two more: truly blue with emission maximum at less than 475 nm and far-red with emission maximum over 600 nm (6, 17). No corresponding GFP-like proteins have been cloned thus far.
All of the GFP-like proteins reported to date share the same fold of polypeptide chain, termed “β-can” (19, 20). The report of a truncated but functional chromoprotein from Anemonia sulcata (4) was later proven to be incorrect (21). However, there are substantial differences between these color types as far as the chromophore structure is concerned (see Table 1). In GFP (green color), the chromophore is formed by residues 65–67 (Ser-Tyr-Gly) as a result of condensation between the carbonyl carbon of Ser-65 and the amino nitrogen of Gly-67 that produces a five-member ring, followed by the dehydrogenation of the Tyr-66 methylene bridge (1, 19, 20). All of the green proteins apparently possess the same chromophore, and the differences in the spectral shapes are explained by modifications of its environment (13, 14, 18). In the red protein DsRed, the chromophore synthesis includes one more stage that extends the conjugated π-system of the chromophore—dehydrogenation of the bond between the α-carbon and amino nitrogen of the first chromophore-forming residue (22–24). Meanwhile, in the chromoproteins representative of asulCP, cyclization leads to the formation of a six-member rather than five-member ring, and the critical step in creating the extended conjugated π-system is breakage of the polypeptide chain immediately before the chromophore (21). Notably, no other chromoprotein contains such a chain break, as demonstrated by denaturing electrophoresis of the bacterial expression products (data not shown), indicating that the chromophore structure of asulCP is the exception rather than the rule within this color type. Biochemical and mutagenesis studies of the yellow zoanYFP (yellow) suggested that this protein has yet another chromophore structure (18, 25).
It must be concluded that pronounced color differences among GFP-like proteins indicate differences in chromophore structures, which justify the use of color for classification. However, different chromophores might be found even in the proteins of the same color, as it happens within the group of chromoproteins and probably within the orange-red group.
Phylogeny.
For the phylogenetic tree representation (Fig. 3), GFP-like proteins from the subclass Alcyonaria—ptilGFP, rmueGFP (26), dendGFP, and clavGFP (2)—were treated as outgroups with respect to other proteins that were isolated from organisms of another Anthozoa subclass, Zoantharia. GFP from A. victoria (27) was excluded from the analysis, because a very long branch leading to it could not be placed within the tree with sufficient confidence.
Figure 3.

The maximum-likelihood phylogenetic tree for the current data set of Anthozoan GFP-like proteins. Numbers at nodes denote the quartet-puzzling support values (1,000 puzzling attempts). Proteins from Alcyonaria subclass, which are considered outgroups, are labeled in white on black. The “stem” of the tree (thick gray line), joining two rooting groups, putatively reflects the diversity of GFP-like proteins before the separation of Alcyonaria and Zoantharia subclasses. Gray bars marked A–D denote the four distinct clades of GFP-like proteins found in Zoantharia. [Bar = 0.1 replacements/site.]
Quite unexpectedly, the grouping of proteins in the phylogenetic tree did not follow color classes or chromophore structures, or even the systematic position of the host. Instead, there are at least four separate clades of Zoantharia proteins (Fig. 3, clades A–D) placed between two outgroup branches containing Alcyonaria proteins. This topology suggests that the four Zoantharia clades already existed before separation of the subclasses Alcyonaria and Zoantharia. The evidence that separation of the clades preceded the separation of Zoantharia orders is even more convincing. On one hand, all of the clades except clade A include proteins from more than one order; on the other hand, none of the orders except the under-sampled Zoanthidea has all their GFP-like proteins within one clade (Table 2).
Table 2.
Summary of the major clades of GFP-like proteins from sub-class Zoantharia
| Clade | Colors | Zoantharia orders |
|---|---|---|
| A | Green, purple-blue | Actiniaria |
| B | Green, orange-red, purple-blue | Corallimorpharia, Scleractinia |
| C | Green, yellow, orange-red | Actiniaria, Zoanthidea |
| D | Green, orange-red | Corallimorpharia, Scleractinia |
Most importantly, the tree reveals multiple relatively recent events of color diversification. Clade B unites proteins of three color types, green, red, and nonfluorescent, cloned from animals of orders Scleractinia and Corallimorpharia. Composition of clade A suggests that separation of nonfluorescent and green colors happened independently in Actiniaria. Clade C suggests very recent separation of green, yellow, and red colors. Clade D suggests two independent events of separation of green and orange-red colors, in addition to the two observed in clades B and C.
The frequency of color conversions within separate lineages makes it impossible, at least for the current data set, to determine what was the color of the common ancestor of GFP-like proteins. Still, the available body of information provides grounds for proposing general principles of maintenance of the present-day color diversity, both on molecular and ecological levels.
Molecular Basis of Color Conversion.
Because a chromophore synthesis pathway in DsRed is an extended form of the GFP pathway (22–24), it can be easily imagined that any mutation damaging the additional autocatalytic stage in DsRed would convert it into green protein. Indeed, at least seven different mutant variants of DsRed emitting in the green range were found during random and site-specific mutagenesis (15, 28, 29). Similar reasoning should apply to the two new red proteins, because their red emission also arises as a result of further modification of the green-emitting chromophore.
It has been shown that a single amino acid replacement can convert a chromoprotein into a DsRed-like red fluorescent protein (3, 5). It is particularly unexpected for asulCP from A. sulcata, which has been directly demonstrated to contain a very dissimilar chromophore; and it still seems unlikely that its red fluorescent mutant variant actually switches to synthesizing a DsRed-type chromophore instead of an original one. However, random mutations in this mutant variant resulted in the appearance of green-emitting forms (3). Because no green-emitting intermediate stage was present in the original asulCP autocatalytic pathway (21), formation of a green-emitting structure in these mutants signifies a substantial deviation most probably toward a GFP/DsRed type of chromophore formation sequence, judging by the shape of excitation/emission spectra of the green asulCP mutants (3).
Finally, yellow protein zoanYFP (yellow) also can be converted into a green-emitting state by at least two different amino acid replacements (18).
Taking these data into account, the following explanation of the observed phylogenetic pattern seems plausible. Different chromophore structures, even the most dissimilar ones, are alternative products synthesized with the help of a basically similar autocatalytic environment, rather than outcomes of prolonged evolution of different catalytic mechanisms. Apparently, just a few amino acid changes in the protein may act like a switch between alternative pathways, as exemplified by mutagenesis results on asulCP chromoprotein.
Color Diversity: Random Variations or Functional Differences?
The adaptive role of Anthozoa coloration is still unclear. The early idea was that the GFP-like proteins serve as specific UV-blocking agents (30, 31) has been substantially modified in the course of recent research; at present, photoprotection in a more general sense is being discussed as the most likely functional assignment (6, 17). It was suggested that fluorescent pigments of corals might serve as a screen scattering the light that reaches endosymbiotic zooxanthellae, and that this photoprotection function may be turned into the opposite—light collection in low-light conditions—when the fluorescent layer is positioned below the zooxanthellae instead of above them (17). This function fits well the spectral properties of GFPs, especially as far as the photoprotection part is concerned: in addition to efficient scattering, they would convert the light from the waveband very near the maximum of photosynthesis action spectrum into the waveband where photosynthetic pigments absorb 1.5–2 times less (32, 33). Meanwhile, the absorption/emission bands of most of the other GFP-like proteins do not match the peaks of photosynthesis action spectrum. For them it was further suggested that they could serve as enhancers of the photoprotection function of greens by means of fluorescent coupling: the energy transfer from green to yellow-red pigments would result in further conversion of the incoming light into wavelengths barely affecting photosynthesis (17). The physiological relevance of this mechanism remains to be investigated. Notably, in the two new orange-red proteins, mcavRFP and rfloRFP, a single protein type achieves this extent of conversion by absorbing in the same waveband as greens but emitting in the red region (Table 1, spectra F).
Perhaps surprisingly, only for nonfluorescent purple-blue coloration of Actiniaria, the topology of the phylogenetic tree suggests that its function is different from the function of green. Each of the three species (A. sulcata, C. gigantea, and H. crispa) yielded a nonfluorescent and a green protein, which are grouped according to color (Fig. 3, clade A). This grouping means that these colors existed as separate entities since the time before separation of the three genera. It must be added that green and purple-blue colors have the same pattern of differential localization in these organisms: green uniformly covers the whole tentacle (and in some cases, the rest of the animal body) and is displaced only at the tentacle tip by purple-blue. This fact constitutes an additional argument in favor of functional differences between these colors.
At the same time, no color-related grouping was observed for the orange-red color. Also, high similarity of yellow zoanYFP (yellow) to the green and red proteins within its clade makes it unlikely that yellow proteins would be grouped according to color when more representatives of this color class will be described. This situation might be viewed as an argument in favor of the “random variation” scenario that these colors are products of accumulation of the random mutations under relaxed environmental restraints and have no adaptive significance of their own (34, 35). Although orange-red and yellow proteins can be easily converted into green by random mutations, the relative probability of backward conversion should be also considered. Mutation pressure would work as the sole factor generating the color diversity only in the case of approximately equal probabilities of forward and backward conversions. If, in contrast, the “to green” conversion is much more likely than reversion, selection should be involved to counterbalance the action of mutation pressure; otherwise, nongreen proteins would be eventually driven into a green state. At least in the case of orange-red proteins, where red emission is caused by auxiliary autocatalysis, the probability of damaging the necessary autocatalytic environment must be higher than the probability of its restoration once the damage is done. Indeed, the only successful attempt to engineer a green protein into a red-emitting state required two simultaneous site-directed replacements, which nevertheless resulted in only partial color conversion (18). A good example is also GFP from A. victoria: despite years of effort, no significantly red-shifted variants of it were found during random mutagenesis. Similar reasoning probably applies to yellow GFP-like proteins, because no less than three specific simultaneous replacements were necessary to convert green protein zoanGFP into yellow (18).
Thus, in our view, a more likely evolutionary scenario to explain the observed phylogenetic pattern is that at least some of the different colors are responsible for different functions and are maintained by natural selection. Although color-converted mutant variants do appear because of mutation pressure, they have an option to assume another function according to their new color and thus avoid elimination. To test this hypothesis, two types of further research are essential: ecological and physiological studies on the functions of nongreen colors, including studies of relevance of fluorescent coupling between different colors for photoprotection; and molecular characterization of GFP-like proteins in morphs of the same species to determine the role of mutation pressure in generating color polymorphism.
Supplementary Material
Acknowledgments
This work was supported by Russian Foundation for Fundamental Research Grants 01-04-49037 (to S.A.L.) and 99-04-48873 (to Y.A.L.), and partially by CLONTECH.
Abbreviations
- GFP
green fluorescent protein
- RFP
red fluorescent protein
- CP
chromoprotein
Footnotes
This paper was submitted directly (Track II) to the PNAS office.
Database deposition: The sequences reported in this paper have been deposited in the GenBank database [accession nos. AY037776 (cgigGFP), AF420592 (hcriGFP), AF420593 (dis3GFP), AF420591 (dendGFP), AY037769 (mcavGFP), AY037772 (rfloGFP), AY037767 (scubGFP1), AY037771 (scubGFP2), AY037770 (mcavRFP), AY037773 (rfloRFP), and AY059642 (zoan2RFP)].
References
- 1.Heim R, Prasher D C, Tsien R Y. Proc Natl Acad Sci USA. 1994;91:12501–12504. doi: 10.1073/pnas.91.26.12501. [DOI] [PMC free article] [PubMed] [Google Scholar]
- 2.Matz M V, Fradkov A F, Labas Y A, Savitsky A P, Zaraisky A G, Markelov M L, Lukyanov S A. Nat Biotechnol. 1999;17:969–973. doi: 10.1038/13657. [DOI] [PubMed] [Google Scholar]
- 3.Lukyanov K A, Fradkov A F, Gurskaya N G, Matz M V, Labas Y A, Savitsky A P, Markelov M L, Zaraisky A G, Zhao X, Fang Y, et al. J Biol Chem. 2000;275:25879–25882. doi: 10.1074/jbc.C000338200. [DOI] [PubMed] [Google Scholar]
- 4.Wiedenmann J, Elke C, Spindler K D, Funke W. Proc Natl Acad Sci USA. 2000;97:14091–14096. doi: 10.1073/pnas.97.26.14091. [DOI] [PMC free article] [PubMed] [Google Scholar]
- 5.Gurskaya N G, Fradkov A F, Terskikh A, Matz M V, Labas Y A, Martynov V I, Yanushevich Y G, Lukyanov K A, Lukyanov S A. FEBS Lett. 2001;507:16–20. doi: 10.1016/s0014-5793(01)02930-1. [DOI] [PubMed] [Google Scholar]
- 6.Dove S G, Hoegh-Guldberg O, Ranganathan S. Coral Reefs. 2001;19:197–204. [Google Scholar]
- 7.Matz M V. In: Green Fluorescent Protein: Applications and Protocols. Hicks B W, editor. Totowa, NJ: Humana; 2002. pp. 3–18. [Google Scholar]
- 8.Strimmer K, von Haeseler A. Mol Biol Evol. 1996;13:964–969. [Google Scholar]
- 9.Hasegawa M, Kishino H, Yano K. J Mol Evol. 1985;22:160–174. doi: 10.1007/BF02101694. [DOI] [PubMed] [Google Scholar]
- 10.Yang Z. Comput Appl Biosci. 1997;13:555–556. doi: 10.1093/bioinformatics/13.5.555. [DOI] [PubMed] [Google Scholar]
- 11.Yang Z H, Goldman N, Friday A. Mol Biol Evol. 1994;11:316–324. doi: 10.1093/oxfordjournals.molbev.a040112. [DOI] [PubMed] [Google Scholar]
- 12.Jones D T, Taylor W R, Thornton J M. Comput Appl Biosci. 1992;8:275–282. doi: 10.1093/bioinformatics/8.3.275. [DOI] [PubMed] [Google Scholar]
- 13.Brejc K, Sixma T K, Kitts P A, Kain S R, Tsien R Y, Ormo M, Remington S J. Proc Natl Acad Sci USA. 1997;94:2306–2311. doi: 10.1073/pnas.94.6.2306. [DOI] [PMC free article] [PubMed] [Google Scholar]
- 14.Palm G J, Zdanov A, Gaitanaris G A, Stauber R, Pavlakis G N, Wlodawer A. Nat Struct Biol. 1997;4:361–365. doi: 10.1038/nsb0597-361. [DOI] [PubMed] [Google Scholar]
- 15.Terskikh A, Fradkov A, Ermakova G, Zaraisky A, Tan P, Kajava A V, Zhao X, Lukyanov S, Matz M, Kim S, Weissman I, Siebert P. Science. 2000;290:1585–1588. doi: 10.1126/science.290.5496.1585. [DOI] [PubMed] [Google Scholar]
- 16.Heim R, Cubitt A B, Tsien R Y. Nature (London) 1995;373:663–664. doi: 10.1038/373663b0. [DOI] [PubMed] [Google Scholar]
- 17.Salih A, Larkum A, Cox G, Kuhl M, Hoegh-Guldberg O. Nature (London) 2000;408:850–853. doi: 10.1038/35048564. [DOI] [PubMed] [Google Scholar]
- 18.Gurskaya N G, Savitsky A P, Yanushevich Y G, Lukyanov S A, Lukyanov K A. BMC Biochem. 2001;2:6. doi: 10.1186/1471-2091-2-6. [DOI] [PMC free article] [PubMed] [Google Scholar]
- 19.Ormo M, Cubitt A B, Kallio K, Gross L A, Tsien R Y, Remington S J. Science. 1996;273:1392–1395. doi: 10.1126/science.273.5280.1392. [DOI] [PubMed] [Google Scholar]
- 20.Yang F, Moss L G, Phillips G N., Jr Nat Biotechnol. 1996;14:1246–1251. doi: 10.1038/nbt1096-1246. [DOI] [PubMed] [Google Scholar]
- 21.Martynov V I, Savitsky A P, Martynova N Y, Savitsky P A, Lukyanov K A, Lukyanov S A. J Biol Chem. 2001;276:21012–21016. doi: 10.1074/jbc.M100500200. [DOI] [PubMed] [Google Scholar]
- 22.Gross L A, Baird G S, Hoffman R C, Baldridge K K, Tsien R Y. Proc Natl Acad Sci USA. 2000;97:11990–11995. doi: 10.1073/pnas.97.22.11990. [DOI] [PMC free article] [PubMed] [Google Scholar]
- 23.Wall M A, Socolich M, Ranganathan R. Nat Struct Biol. 2000;7:1133–1138. doi: 10.1038/81992. [DOI] [PubMed] [Google Scholar]
- 24.Yarbrough D, Wachter R M, Kallio K, Matz M V, Remington S J. Proc Natl Acad Sci USA. 2001;98:462–467. doi: 10.1073/pnas.98.2.462. [DOI] [PMC free article] [PubMed] [Google Scholar]
- 25. Savitsky, A. P., Lukyanov, K. A., Gurskaya, N. G., Savitsky, P. A., Matz, M. V., Fradkov, A. F. & Lukyanov, S. A., 11th International Symposium on Bioluminescence and Chemoluminescence, September 6–10, 2000, Pacific Grove, CA.
- 26. Szent-Gyorgyi, C. S., Bryan, B. J. & Szczepaniak, W. (2001) U.S. Patent 6232107-B.
- 27.Prasher D C, Eckenrode V K, Ward W W, Prendergast F G, Cormier M J. Gene. 1992;111:229–233. doi: 10.1016/0378-1119(92)90691-h. [DOI] [PubMed] [Google Scholar]
- 28.Baird G S, Zacharias D A, Tsien R Y. Proc Natl Acad Sci USA. 2000;97:11984–11989. doi: 10.1073/pnas.97.22.11984. [DOI] [PMC free article] [PubMed] [Google Scholar]
- 29.Wiehler J, von Hummel J, Steipe B. FEBS Lett. 2001;487:384–389. doi: 10.1016/s0014-5793(00)02365-6. [DOI] [PubMed] [Google Scholar]
- 30.Kawaguti S. Palao Trop Biol Stn Stud. 1944;2:617–674. [Google Scholar]
- 31.Catala R. Nature (London) 1959;183:949. [Google Scholar]
- 32.Kinzie R A, Jokiel P L, York R. Mar Biol. 1984;78:239–248. [Google Scholar]
- 33.Kuhl M, Cohen Y, Dalsgaard T, Jorgensen B B, Revsbech N P. Mar Ecol Prog Ser. 1995;117:159–172. [Google Scholar]
- 34.Fox D L. In: The Significance of Zoochromes. Needham A E, editor. New York: Springer; 1974. [Google Scholar]
- 35.Wicksten M K. Bull Mar Sci. 1989;45:519–530. [Google Scholar]
Associated Data
This section collects any data citations, data availability statements, or supplementary materials included in this article.