Abstract
FKBP12-rapamycin associated protein (FRAP, also known as mTOR or RAFT) is the founding member of the phosphatidylinositol kinase-related kinase family and functions as a sensor of physiological signals that regulate cell growth. Signals integrated by FRAP include nutrients, cAMP levels, and osmotic stress, and cellular processes affected by FRAP include transcription, translation, and autophagy. The mechanisms underlying the integration of such diverse signals by FRAP are largely unknown. Recently, FRAP has been reported to be regulated by mitochondrial dysfunction and depletion of ATP levels. Here we show that exposure of cells to hyperosmotic conditions (and to glucose-deficient growth medium) results in rapid and reversible dissipation of the mitochondrial proton gradient. These results suggest that the ability of FRAP to mediate osmotic stress response (and glucose deprivation response) is by means of an intermediate mitochondrial dysfunction. We also show that in addition to cytosolic FRAP a large portion of FRAP associates with the mitochondrial outer membrane. The results support the existence of a stress-sensing module consisting of mitochondria and mitochondrial outer membrane-associated FRAP. This module allows the cell to integrate a variety of stress signals that affect mitochondrial function and regulate a growth checkpoint involving p70 S6 kinase.
A coordinated sequence of cell growth, proliferation, and death is critical for tissue maintenance and homeostasis. Elements that influence cell physiology include growth factors, nutrients, and stress signals. An intracellular signaling network integrates multiple and occasionally conflicting signals to coordinate the response. FKBP12-rapamycin-associated protein (FRAP) plays an important role in this network and ensures that cell growth occurs under optimal conditions, in part by regulating a p70 S6 kinase (p70S6K) phosphatase (1). Rapamycin is a specific modulator of FRAP, and treatment of cells with rapamycin results in a rapid dephosphorylation of p70S6K by means of the formation of an FKBP12-rapamycin-FRAP ternary complex (2).
p70S6K activity has been shown to be sensitive to a wide variety of inputs that include serum, nutrients, wortmanin (a phosphatidylinositol 3-kinase inhibitor), and osmotic stress (3). Mitogens and growth factors regulate p70S6K primarily by means of the upstream kinases such as phosphatidylinositol 3-kinase, phosphoinositide-dependent kinase, and Akt. This kinase-dependent phosphorylation is in equilibrium with unidentified “subordinate” phosphatases such that when cells are deprived of serum these subordinate phosphatases dephosphorylate and deactivate p70S6K. In addition to kinase-directed regulation, p70S6K is regulated by a “dominant,” FRAP-regulated phosphatase that is constitutively associated with p70S6K (4). Activation of this PP2A-type phosphatase results in rapid dephosphorylation of p70S6K even in the presence of mitogens, suggesting that this mechanism is dominant over kinase-directed signaling. Rapamycin dephosphorylates p70S6K by activating the p70S6K phosphatase in a FRAP-dependent manner (4).
A rapamycin-resistant allele of p70S6K generated by truncating its N and C termini (NTCT-p70S6K) has proved to be a valuable reagent in segregating the p70S6K regulatory signals (5). NTCT-p70S6K is sensitive to kinase-directed signals initiated by mitogens and growth factors, but it is insensitive to signals that pass through the FRAP-regulated phosphatase. NTCT-p70S6K is unable to interact with this phosphatase. Accordingly, NTCT-p70S6K is sensitive to wortmanin (phosphatidylinositol 3-kinase inhibitor) but insensitive to rapamycin. Signals emanating from amino acid deprivation (6) and hyperosmolarity (7) do not affect NTCT-p70S6K activity, indicating that they are mediated by FRAP and not by the growth factor-activated kinases. Despite the compelling nature of experiments conducted with NTCT-p70S6K, one cannot rule out the possibility that NTCT-p70S6K is also insensitive to as-yet-unknown FRAP-independent signals impinging on p70S6K.
This correlative use of NTCT-p70S6K has more recently been extended to investigations of mitochondrial function. Mitochondrial poisons that deplete the mitochondrial proton-gradient and lower the concentration of intracellular ATP result in deactivation of p70S6K (8, 9). An NTCT-like allele of p70S6K is resistant to mitochondrial poisons, suggesting that FRAP is sensitive to mitochondrial function. Despite the centrality of mitochondria to cell growth and death, we know little about the nature of crosstalk between mitochondrial activity and growth regulatory signals.
Materials and Methods
Cell Lines and Reagents.
Jurkat and 3T3 cell lines were obtained from the American Type Culture Collection and maintained as recommended. Kit-225 cells were a kind gift from Doreen Cantrell (Lincoln's Inn Fields Laboratories, London) and were maintained in RPMI supplemented with 10% FBS and 20 units/ml recombinant IL-2. The mAb against FRAP (anti-hTOR, catalogue no. 33–8100) and the mouse monoclonal anti-BclII (catalogue no. 13–8800) were purchased from Zymed, the mouse monoclonal anti-calnexin antibody (clone AF18, catalogue no. MA3–027) was from Affinity Bioreagents (Golden, CO), and the rabbit polyclonal anti-p70S6K (catalogue no. sc-230) was from Santa Cruz Biotechnology. The S6 kinase assay kit was purchased from Upstate Biotechnology (Lake Placid, NY), and the rabbit polyclonal anti-FRAP antibody (RTP-302) has been described (10). The mouse monoclonal anti-cytochrome oxidase subunit-I (COX-1) (catalogue no. A-6403), mitochondrial potential probe JC-1, Mitotracker red (MTR), and Alexa-conjugated secondary antibodies used in confocal microscopy were purchased from Molecular Probes. All other reagents were purchased from Sigma unless otherwise mentioned.
Identification of SDS/PAGE-Resolved Proteins by MS.
Jurkat cells were lysed in lysis buffer A (50 mM Tris⋅HCL, pH 7.4/150 mM NaCl/1% Triton X-100/3.3% glycerol/1 mM DTT/protease inhibitor mixture) at 4°C for 30 min and, from this cell extract, FRAP immune-complexes were isolated by using a polyclonal anti-FRAP antibody (RTP302). The SDS/PAGE-resolved immune-complexes were visualized either by silver staining or Coomassie-colloidal staining. The Coomassie-stained bands were excised, washed in 50% acetonitrile/water, and microsequenced. Sequence analysis was performed at the Harvard Microchemistry Facility by microcapillary reverse-phase HPLC nano-electrospray tandem MS on a Finnigan (San Jose, CA) LCQ quadrupole ion trap mass spectrometer.
Subcellular Fractionation and Related Biochemistry.
Jurkat cells were collected by centrifugation at 600 g for 7 min, and the pellet was resuspended in lysis buffer B (20 mM Hepes-KOH, pH 7.5/10 mM KCl/1.5 mM MgCl2/1 mM EDTA/1 mM EGTA/1 mM DTT/protease inhibitor mixture) supplemented with 250 mM sucrose. Buffer B supplemented with 250 mM sucrose is referred to as buffer C. The suspension was left on ice and mixed periodically for 30 min. Cells were then dounce-homogenized, and the lysis was monitored for quality by using phase-contrast microscopy. The homogenate was centrifuged (750 g/10 min at 4°C); the resulting supernatant A was collected, the pellet was washed twice with lysis buffer B, and the washed pellet was saved as the nuclear fraction. Supernatant A was centrifuged (12,500 g/15 min at 4°C), and the resulting supernatant B was saved. The pellet was washed once with buffer C and saved as the heavy membrane pellet. Supernatant B was ultra-centrifuged (100,000 g/45 min at 4°C), and the resulting supernatant C is the cytosolic S/100 fraction. The pellet was labeled as the vescicular fraction. Heavy membrane pellet was resuspended in buffer C and respun at 4,000 g for 15 min to obtain the heavy mitochondrial pellet for further enrichment of mitochondria. All subcellular fractions were preserved at −80°C until further analysis. For SDS/PAGE analysis, fractions were solubilized in 0.125% SDS and 0.012 M NaOH, adjusted to 1 mg/ml of protein (Bradford), and equal amounts of protein were loaded for immunoblotting.
Purification of Mitochondria by Sucrose Step-Density Gradient.
The heavy mitochondrial pellet was overlaid on a sucrose step-density gradient [1.0 M sucrose over 1.5 M sucrose in 10 mM Tris⋅HCl (pH 7.5), 1 mM EDTA]. The preparation was ultra-centrifuged at 60,000 g for 20 min at 4°C. The pellet was washed twice in buffer C and frozen at −80°C for further analysis.
Confocal Microscopy.
Actively growing 3T3 cells grown on cover slips were stained with 250 ng/ml MTR for 45 min. Cells were subsequently fixed with 4% paraformaldehyde for 20 min and permeabilized with ice-cold acetone for 10 min. The cells were then blocked with buffer D (2% normal goat serum/3% BSA in PBS) for 20 min. Staining with primary antibody was carried out in 0.5% Tween and Alexa-conjugated secondary antibody (Alexa fluor-488) in 0.1% Tween. The preparation was washed twice with buffer D, mounted, and visualized on Zeiss LSM410 confocal microscope with a krypton/argon laser.
Immuno-Electron Microscopy.
Actively growing 3T3 cells were harvested by using sterile 5 mM EDTA/PBS solution, and the cell suspension was fixed by mixing with equal volume of 2× fixative (4% paraformaldehyde in 0.2 M phosphate buffer, pH 7.4). The cells were pelleted and infiltrated with preservative solution (2.3 M sucrose, 0.15 M glycine in PBS) for 15–30 min at room temperature. The pellet was mounted and frozen in liquid nitrogen. Sectioning was carried out at −120°C with a cryo-diamond knife, and the resulting sections were picked from the knife with a loop dipped in a 1:1 mixture of 2.3 M sucrose and 2% methylcellulose and transferred to a formvar/carbon-coated copper grid. The grids were placed on 2% gelatin until immunogold labeling. For immunogold labeling, the grids were warmed to 37°C to melt away the gelatin and washed in PBS. They were then blocked with 1% BSA in PBS for 15 min, stained with mouse monoclonal anti-hTOR antibody (Zymed) in 1% BSA/PBS for 30 min, washed in four drops of PBS, and then finally stained with protein A-gold in 1% BSA for 20 min. After washing in a few drops of PBS, contrasting procedure was carried out by briefly floating the grids on a 9:1 mixture of 2% methyl cellulose and 3% uranyl acetate. After removing the excess liquid, the immunogold-labeled sections were examined by transmission electron microscopy (JEOL 1200EX and JEOL 100CX were used).
Measurement of Mitochondrial Potential.
Kit 225 cells were cultured to a density of 0.5–1.0 × 10⁶ cells/ml. For each condition, 10 ml of cells was treated with the appropriate agent for the appropriate length of time. Mitochondrial potential was assessed by using the fluorescent potentiometric dye JC-1 (5,5′,6,6′,-tetrachloro-1,1′,3,3′-tetraethylbenzimidazolylcarbocyanine iodide) as described (11). Briefly, the cells were centrifuged for 8 min at 450 × g at room temperature and resuspended in 1 ml of staining solution (complete medium containing treatment agent and 5 μg/ml JC-1). Cells were stained for 15 min in a 37°C incubator (5% CO2). After staining, cells were collected at room temperature and washed once in treatment solution and once with PBS. The cell pellet was then resuspended in PBS (prewarmed to 37°C), and JC-1 fluorescence was quantitated by using a Gemini Spectramax XS fluorescence plate reader at 37°C (Molecular Devices). The fluorescence of the JC-1 monomer was measured at 485-nm excitation/530-nm emission with a 530-nm cutoff filter. The fluorescence of the JC-1 aggregate was measured at 535-nm excitation/590-nm emission with a 570-nm cutoff filter. For each experiment, the aggregate/monomer ratios were normalized to an untreated condition (100%); values reported therefore represent a percentage of mitochondrial function in healthy, untreated cells.
Results and Discussion
FRAP Responds to Mitochondrial Dysfunction in a Rapamycin-Sensitive Human T Cell Line.
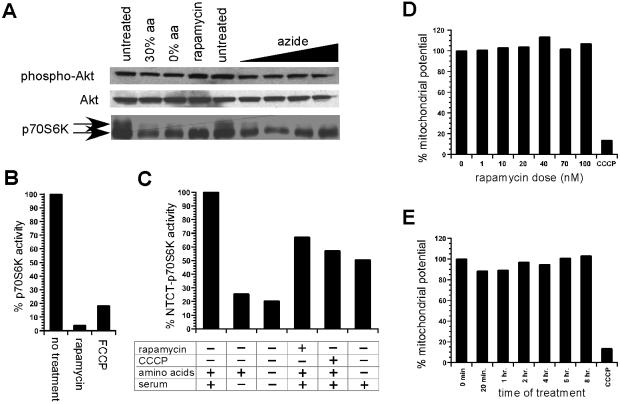
Treatment of Kit-225 cells with mitochondrial inhibitors resulted in a marked dephosphorylation of p70S6K (Fig. 1A) and a loss of its kinase activity (Fig. 1B) within minutes of exposure. In comparison, NTCT-p70S6K is significantly more resistant to mitochondrial dysfunction (Fig. 1C). This result indicates that dysfunctional mitochondria signal to p70S6K in a FRAP-dependent manner. Dennis et al. (9) have suggested that this effect is caused by a decline in the kinase activity of FRAP, which they suggest is regulated by ATP levels. However, we find no change in the intrinsic autokinase activity of FRAP upon treatment with mitochondrial inhibitors when measured by a polyclonal antibody reactive to the autophosphorylation site at the carboxyl terminus of FRAP (10) (data not shown). These data indicate that mitochondrial dysfunction signals by means of FRAP without modulating the intrinsic kinase activity of FRAP. We also measured mitochondrial proton gradient in response to rapamycin treatment by using JC-1, a mitochondrial potential-sensitive fluorescent probe (11). Rapamycin treatment does not result in a significant change in mitochondrial potential (Fig. 1 D and E), suggesting that FRAP does not control mitochondrial activity.
Figure 1.
Analysis of p70S6K phosphorylation in response to mitochondrial dysfunction. (A) p70S6K phospho-shift in response to untreated, 30% amino acid availability (30% aa), absence of amino acids (0% aa), rapamycin treatment, and increasing azide dosage (1 mM, 2 mM, 5 mM, 10 mM) is shown. Similar analysis of phospho-Akt and Akt is also included. (B) p70S6K activity in response to rapamycin and carbonylcyanide p-trifluoro-methoxyphenylhydrazone (FCCP) treatment. (C) Activity of ΔNTΔCT-p70S6K rapamycin-resistant allele in response to the presence of amino acids and serum, withdrawal of serum, withdrawal of amino acid and serum, rapamycin treatment, and carbonylcyanide m-chlorophenlyhydrazone (CCCP) treatment. (D) Mitochondrial activity in response to rapamycin dose is compared with CCCP-treated control measurement by using the JC-1 assay. (E) Mitochondrial activity in response to time of treatment with 50 nM rapamycin is compared with CCCP-treated control measurement.
Osmotic Stress and Glucose Deprivation Signal to FRAP by an Intermediate Mitochondrial Dysfunction.
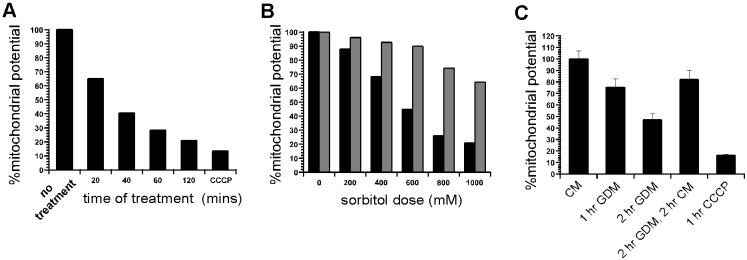
We investigated whether the signals emanating from amino acid deprivation, glucose deprivation, and osmotic stress signal to FRAP by means of an intermediate mitochondrial dysfunction. We measured mitochondrial function in response to these conditions. Exposure of cells to sorbitol-induced hyperosmolarity causes a marked decline in mitochondrial proton gradient within minutes. The decline in mitochondrial function in response to osmotic stress is time-dependent, dose-dependent, and almost completely reversible (Fig. 2 A and B). Because mitochondrial dysfunction causes rapid FRAP-dependent p70S6K deactivation, the results indicate that at least a component of osmo-regulatory signals that deactivate p70S6K in a FRAP-dependent manner are transmitted by an intermediate mitochondrial dysfunction. Similarly, we found that glucose deprivation results in a decline in mitochondrial activity in a reversible manner (Fig. 3C). Glucose deprivation has been reported to signal to p70S6K by means of FRAP (12). These data suggest that FRAP monitors glucose availability by mitochondrial activity. Depriving the cells of amino acids for 30 min did not result in a significant change in mitochondrial proton gradient, as measured by JC-1 fluorescence (data not shown). This result indicates that amino acids signal to FRAP by means independent of mitochondria.
Figure 2.
Measurement of mitochondrial function in response to hyperosmotic conditions and glucose deprivation. (A) Mitochondrial activity in response to time of exposure to osmotic stress (600 mM sorbitol treatment) is compared with CCCP treatment. (B) Mitochondrial activity in response to level of osmotic stress (% sorbitol) is shown (black bars). Kit-225 cells were treated with sorbitol for 30 min before measuring mitochondrial activity. Mitochondrial activity 20 min after removal of osmotic stress (withdrawal of sorbitol) is shown as adjoining bars for each dose (gray bars). (C) Mitochondrial activity in response to glucose deprivation. Kit-225 cells were exposed to conditions indicated and mitochondrial proton gradient was measured by JC-1 assay. CM, complete media; GDM, glucose-deprived media.
Figure 3.
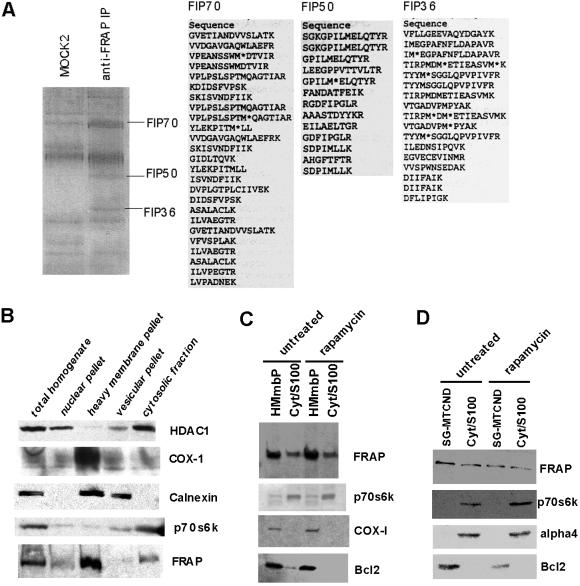
Analysis of FRAP immune-complex and localization of FRAP by subcellular fractionation studies. (A) Identification of components of PDH complex in FRAP immune-complexes. Jurkat cells were lysed as described in Materials and Methods and the cell lysate was used to isolate FRAP immune-complexes by using an anti-FRAP polyclonal antibody. Coomassie-stained gel shows resolution of immmune-complex obtained by using a mock antibody (MOCK2) and the FRAP immune-complex (anti-FRAP IP). Three bands enriched in FRAP immune-complex but absent in mock preparations are marked according to their molecular weights. The number denotes the approximate molecular weight of the band. The bands labeled as FIP70, FIP50, and FIP36 were microsequenced to yield the peptide sequences shown for each band. (B) Equal amounts of indicated fractions were resolved by using SDS/PAGE and immuno-blotted for FRAP and marker proteins. Absence of HDAC1 and p70S6K in the heavy membrane pellet indicates that this fraction was not contaminated by significant amounts of nuclear or cytosolic proteins. Calnexin is predominantly an endoplasmic reticulum (ER)-resident protein; its presence in the heavy membrane pellet and the vesicular fraction is consistent with the fact that heavy membrane pellet contains mitochondrial, lysosomal, and ER-resident proteins. COX-1 is a mitochondrial marker and is therefore seen predominantly in the heavy membrane pellet. FRAP is present in heavy membrane pellet and cytosolic fraction. (C) Heavy membrane pellet (HMmbP) and cytosolic (Cyt/S-100) fractions from untreated and rapamycin-treated cells were analyzed for changes in the levels of FRAP and marker proteins. An additional mitochondrial marker (Bcl-2) is included in the analysis. (D) Mitochondrial fraction purified by using a sucrose gradient (SG-MTCND) and cytosolic fraction from untreated and rapamycin-treated cells was analyzed for the presence of FRAP.
Components of Pyruvate Dehydrogenase (PDH) Complex Are Present in FRAP Immune-Complexes.
To investigate the mechanism that regulates FRAP, we identified several interacting proteins. We isolated FRAP immune-complexes from Jurkat cells, resolved the eluted proteins by SDS/PAGE, and compared the protein bands to those present in immune-complexes obtained by using three mock antibodies (mock 1–3). This analysis was done by silver-staining the gels (data not shown). The bands present in FRAP immune-complexes but absent in mock preparations were excised from colloidal-Coomassie-stained gel, and the peptide fragments from each were sequenced by using MS (Fig. 3A). Among these FRAP-interacting proteins (FIPs), three proteins (FIP70, FIP50, and FIP36) were identified as components of the mitochondrial PDH complex. The FIP36, FIP50, and FIP70 bands were identified as 40-kDa E1 beta, 45-kDa E1 alpha, and 70-kDa E2 subunits of the PDH complex, respectively. The PDH complex catalyzes the conversion of glycolytically derived pyruvate to acetyl CoA, which is then shuttled into the mitochondrial tricarboxylic acid cycle (13).
FRAP Cofractionates with Purified Mitochondria.
Jurkat cells were used to carry out subcellular fractionation. Four distinct fractions consisting of nuclear, heavy membrane, cytosolic, and vesicular proteins were probed for presence of marker proteins and FRAP. As shown in Fig. 3B, these data indicate that FRAP fractionates with both the heavy-membrane pellet and the cytosolic fraction. We purified mitochondria from the heavy-membrane pellet by using sucrose density gradient-ultra centrifugation. FRAP cofractionates with purified mitochondria and rapamycin treatment has no effect on this association (Fig. 3 C and D).
Confocal Microscopy Confirms Colocalization of FRAP with Mitochondria.
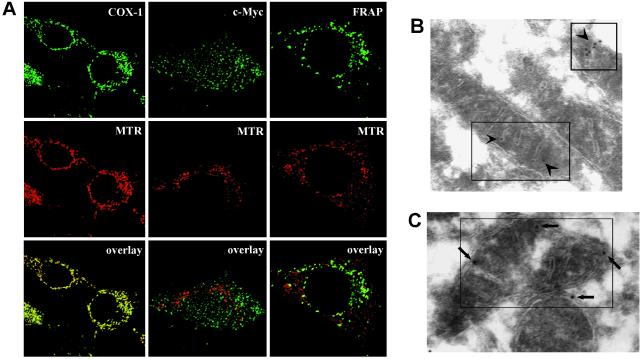
Mouse 3T3 cells were used to conduct immunofluorescence-confocal microscopy. The results show that a significant portion of FRAP colocalizes with mitochondria (Fig. 4A). The positive control (colocalization of COX-1 with mitochondria) and the negative control (lack of colocalization of c-Myc with mitochondria) indicate that the conditions used were capable of distinguishing between these two possibilities. Together, these data indicate that there are at least two distinct pools of FRAP, cytosolic FRAP and mitochondrial FRAP (FRAPm).
Figure 4.
Immunofluorescence-confocal microscopy and immuno-electron microscopy of FRAP in 3T3 cells. (A) Confocal microscopy shows colocolization of FRAP and mitochondria. MTR was used to stain the mitochondria before fixation and permeabilization. COX-1 was primarily stained with an anti-COX-1 mAb, FRAP was primarily stained with an anti-FRAP mAb, and c-myc was primarily stained with an anti-c-Myc mAb. An [Alexa-fluor-488]-conjugated antibody was used as the secondary stain. The yellow speckles in the overlay frames indicate colocolization. COX-1 shows complete colocolization (positive control for methodology) whereas c-Myc does not colocalize with mitochondria (negative control for methodology). A significant portion of FRAP is seen to colocalize with the mitochondria. (B and C) Immuno-electron microscopy indicates mitochondrial locolization of FRAP. A secondary stain of streptavidin-gold was used to detect the primary anti-FRAP mAb. Arrows point toward the electron-dense secondary probe within the boxes. In C the long arrows point toward typical membrane-proximal localizations that are seen at a high frequency. (Magnifications: ×15,000.)
FRAP Associates with Mitochondrial Outer Membrane (MOM).
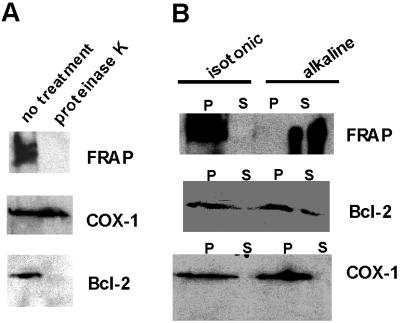
Immuno-electron microscopy conducted by using 3T3 cells also revealed the existence of FRAPm (Fig. 4B). Moreover, in many electron micrographs, FRAPm was found at the edges of mitochondria, suggesting that FRAPm associates in a membrane-proximal manner (Fig. 4C). Purified mitochondrial fractions were subjected to a 20-min treatment with proteinase K to ascertain whether FRAP is exposed on the mitochondrial surface. The results show that mitochondrial FRAP is significantly more protease-sensitive when compared with COX-1, which resides on the mitochondrial inner membrane (MIM) (Fig. 4A). Similar sensitivity is shown by Bcl-2, a MOM-integral protein (14) (Fig. 5A). The results indicate that FRAP associates with MOM and is exposed on the surface of mitochondria. The results of an alkaline sensitivity assay indicate that unlike Bcl-2, FRAP is not a membrane integral protein (Fig. 5B). COX-1, which is loosely attached to MIM, is also sensitive to alkaline treatment and is detected in the supernatant (Fig. 5B). When purified mitochondrial fractions were treated with 3 M urea for 10 min, the amount of FRAP associating with mitochondria was reduced but the amount of Bcl-2 was not affected (data not shown). These data suggest that unlike Bcl-2, which is a membrane-integral protein, the association of FRAPm is associated with mitochondria by means of mitochondrial protein–FRAP interactions. Because the PDH complex is located in the mitochondrial matrix and FRAP is associated with the MOM, the interaction of FRAP with PDH subunits is in all likelihood an indirect one.
Figure 5.
Sensitivity of FRAPm to protease treatment and alkaline extraction. (A) Mitochondrial preparation with or without proteinase K treatment (20 min, room temperature) is resolved and immuno-blotted for FRAP and mitochondrial markers (COX-1 and Bcl-2). COX-1 is associated with the inner membrane and is therefore insensitive to proteinase K treatment. Bcl-2 is associated with the outer membrane and exposed, therefore sensitive to protease treatment. FRAP is also sensitive to protease treatment. (B) Analysis of isotonic and alkaline extraction of mitochondrial preparation is shown. The insoluble pellet (P) and the supernatant (S) of these extractions were resolved and probed for FRAP and marker proteins.
A Model for Mitochondria and FRAP-Mediated Growth Regulation.
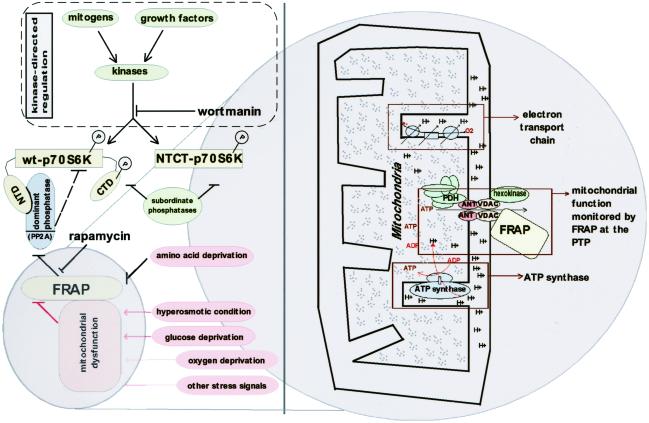
The results support a model where signals that result in mitochondrial dysfunction result in FRAPm-mediated regulation of cell growth (whereas amino acid-based signals may pass through cytosolic FRAP). We suspect that an outer membrane channel that is sensitive to mitochondrial proton gradient is necessary for such a sensory role. This conjecture is supported by preliminary experimental demonstration that voltage-dependent anion channel (VDAC), a component of the mitochondrial permeability transition pore (PTP), is present in FRAP immune-complexes (B.N.D., unpublished work). FRAPm may monitor a mitochondrial-activity parameter by virtue of physical association with a channel such as the PTP complex, which is composed of adenine nucleotide transporter (ANT) and VDAC (Fig. 6). Because ATP molecules that are generated in the mitochondria exit into cytosol by means of ANT, it is also possible that FRAP is sensitive to the mitochondrial ATP flux in accord with a recent proposal (9). This study highlights the role of FRAP in coordinating mitochondrial activity and growth regulation, an area of cell biology with broad biomedical significance.
Figure 6.
A model illustrating the role of FRAP in sensing mitochondrial dysfunction and regulation of p70S6K. The model highlights the role of FRAP in sensing signals initiated by hyperosmotic and glucose-deprivation conditions by an intermediate mitochondrial dysfunction. Other stress signals such as oxygen deprivation that result in mitochondrial dysfunction may also signal to FRAP by using similar mechanisms. FRAP senses amino acid deprivation by means of a mechanism independent of mitochondria. Two distinct pathways orchestrate the regulation of p70S6K: (i) the kinase-directed pathway initiated by mitogens or growth factors and in equilibrium with the “subordinate phosphatases” and (ii) the FRAP-mediated pathway, which involves a “dominant phosphatase” (a PP2A isoform) that is constitutively associated with wt-p70S6K by the N-terminal domain (NTD) of p70S6K. A rapamycin-resistant allele of p70S6K called NTCT-p70S6K is truncated at the NTD and the C-terminal domain (CTD). The dominant phosphatase is unable to associate with NTCT-p70S6K and therefore FRAP-mediated signals do not affect NTCT-p70S6K. A potential mechanism by which FRAP senses mitochondrial function is shown as a “zoom in” (Right). FRAP is shown to be associated with the mitochondrial PTP, which is composed of VDAC and ANT. The PDH complex (located in mitochondrial matrix) is shown in close proximity to PTP where it can receive glycolysis-derived pyruvate, which enters the mitochondria primarily by means of the PTP.
Acknowledgments
We thank William Lane (Harvard Microchemistry Facility) and Maria Eriksson (Harvard Medical School) for technical assistance with microsequencing and immuno-electron microscopy, respectively. Kit-225 cells were a kind gift from Doreen Cantrell. The research was supported by the National Institute of General Medical Sciences (Grant GM38627). S.L.S. is an Investigator at the Howard Hughes Medical Institute.
Abbreviations
- FRAP
FKBP12-rapamycin-associated protein
- FRAPm
mitochondrial FRAP
- p70S6K
p70 S6 kinase
- NTCT-p70S6K
N terminal- and C terminal-truncated p70S6K
- FIP
FRAP-interacting protein
- COX-1
cytochrome oxidase subunit-I
- PDH
pyruvate dehydrogenase
- MTR
Mitotracker red
- PTP
permeability transition pore
- VDAC
voltage-dependent anion channel
- ANT
adenine nucleotide transporter
- CCCP
carbonylcyanide m-chlorophenlyhydrazone
References
- 1.Schmelzle T, Hall M N. Cell. 2000;103:253–262. doi: 10.1016/s0092-8674(00)00117-3. [DOI] [PubMed] [Google Scholar]
- 2.Brown E J, Beal P A, Keith C T, Chen J, Shin T B, Schreiber S L. Nature (London) 1995;377:441–446. doi: 10.1038/377441a0. [DOI] [PubMed] [Google Scholar]
- 3.Shah O J, Anthony J C, Kimball S R, Jefferson L S. Am J Physiol. 2000;279:E715–E729. doi: 10.1152/ajpendo.2000.279.4.E715. [DOI] [PubMed] [Google Scholar]
- 4.Peterson R T, Desai B N, Hardwick J S, Schreiber S L. Proc Natl Acad Sci USA. 1999;96:4438–4442. doi: 10.1073/pnas.96.8.4438. [DOI] [PMC free article] [PubMed] [Google Scholar]
- 5.Cheatham L, Monfar M, Chou M M, Blenis J. Proc Natl Acad Sci USA. 1995;92:11696–700. doi: 10.1073/pnas.92.25.11696. [DOI] [PMC free article] [PubMed] [Google Scholar]
- 6.Hara K, Yonezawa K, Weng Q P, Kozlowski M T, Belham C, Avruch J. J Biol Chem. 1998;273:14484–14494. doi: 10.1074/jbc.273.23.14484. [DOI] [PubMed] [Google Scholar]
- 7.Parrott L A, Templeton D J. J Biol Chem. 1999;274:24731–24736. doi: 10.1074/jbc.274.35.24731. [DOI] [PubMed] [Google Scholar]
- 8.Xu G, Kwon G, Cruz W S, Marshall C A, McDaniel M L. Diabetes. 2001;50:353–360. doi: 10.2337/diabetes.50.2.353. [DOI] [PubMed] [Google Scholar]
- 9.Dennis P B, Jaeschke A, Saitoh M, Fowler B, Kozma S, Thomas G. Science. 2001;294:1102–1105. doi: 10.1126/science.1063518. [DOI] [PubMed] [Google Scholar]
- 10.Peterson R T, Beal P A, Comb M J, Schreiber S L. J Biol Chem. 2000;275:7416–7423. doi: 10.1074/jbc.275.10.7416. [DOI] [PubMed] [Google Scholar]
- 11.Reers M, Smiley S T, Mottola-Hartshorn C, Chen A, Lin M, Chen L B. Methods Enzymol. 1995;260:406–417. doi: 10.1016/0076-6879(95)60154-6. [DOI] [PubMed] [Google Scholar]
- 12.Dickson L M, Lingohr M K, McCuaig J, Hugl S R, Snow L, Kahn B B, Myers M G, Jr, Rhodes C J. J Biol Chem. 2001;276:21110–21120. doi: 10.1074/jbc.M101257200. [DOI] [PubMed] [Google Scholar]
- 13.Trijbels F J, Ruitenbeek W, Huizing M, Wendel U, Smeitink J A, Sengers R C. Mol Cell Biochem. 1997;174:243–247. [PubMed] [Google Scholar]
- 14.Gross A, McDonnell J M, Korsmeyer S J. Genes Dev. 1999;13:1899–1911. doi: 10.1101/gad.13.15.1899. [DOI] [PubMed] [Google Scholar]


