

Abstract
Isothermal titration calorimetry (ITC) is a gold‐standard technique for directly quantifying biomolecular interactions, but its broader applicability is limited by large sample consumption and low throughput. To address these challenges, considerable efforts are made to develop chip calorimeter systems. Here, a high‐sensitivity chip calorimeter integrated with on‐demand droplet microfluidics is presented, capable of performing ITC with picoliter‐volume samples. The device combines vanadium pentoxide thermistors, vacuum‐insulated parylene microfluidics, and multilayer Polydimethylsiloxane microfluidics to achieve precise thermal measurement and fluidic control. On‐demand generation and merging of titrant and titrand droplets enable accurate control of molar ratios for droplet‐based titration. The chip calorimeter achieves a temperature resolution of 14.9 µK and a power resolution of 2.31 nW. The platform is validated by measuring the binding interaction between 18‐crown‐6 and barium chloride, with extracted thermodynamic parameters in good agreement with conventional ITC. This work advances miniaturized ITC technology by providing a scalable and efficient platform for quantitative biochemical analysis, particularly in sample‐limited and high‐throughput applications.
Keywords: chip calorimeter, droplet microfluidics, isothermal titration calorimetry, parylene microfluidics, vanadium oxide
A parylene chip calorimeter integrated with on‐demand droplet microfluidics enables on‐chip isothermal titration calorimetry (ITC) using picoliter‐volume droplets. This platform quantifies thermodynamic parameters of the 18‐crown‐6 and barium chloride binding system with high power resolution, while dramatically reducing sample consumption, analysis time, and system footprint compared to conventional ITC instruments.

1. Introduction
Calorimetry has undergone significant advancements in recent years, particularly in the miniaturization of calorimetric devices.[ 1 , 2 , 3 , 4 ] This trend toward miniaturization has led to the development of chip calorimeters– highly sensitive and precise analytical devices designed to measure heat from small‐scale systems or small volumes of samples.[ 5 , 6 ] These devices, fabricated using microelectromechanical systems (MEMS) technology, integrate thermally isolated sample cells, thermometers, and integrated microfluidic systems, all contained within a compact chip‐sized platform.[ 5 , 6 , 7 , 8 , 9 , 10 ] Compared to conventional calorimeters, chip calorimeters not only have significantly smaller footprints but also offer enhanced sensitivities and versatility. While traditional calorimeters typically require sample volumes in the milliliter scale,[ 11 , 12 , 13 ] chip calorimeters can operate with only microliter or even picoliter‐volume samples, dramatically reducing sample consumption and costs.[ 14 , 15 , 16 , 17 ] Moreover, the reduced thermal mass of chip calorimeters enables faster response times and improved thermal resolutions, facilitating the detection of rapid and subtle thermal events that may be obscured in large‐scale calorimeters. Such advantages have led to the widespread applications of chip calorimeters in diverse scientific fields, particularly for studying biological and chemical interactions including binding kinetics,[ 12 , 18 , 19 , 20 , 21 ] enzyme‐substrate interactions,[ 8 , 22 , 23 ] and DNA hybridizations.[ 10 , 24 ]
Among many calorimetric techniques, isothermal titration calorimetry (ITC) stands out for its ability to directly determine thermodynamic parameters in interactions[ 25 ]; ITC can directly measure the released or absorbed heat during molecular interactions without need for the molecular modifications, providing complete thermodynamic information in a single experiment, which allows the determination of the binding constant (K), enthalpy change (ΔH), stoichiometry (n), Gibbs free energy change (ΔG), and entropy change (ΔS) of the molecular interaction.[ 14 , 17 , 25 ] The comprehensive thermodynamic profile obtained from ITC is invaluable for elucidating the mechanisms of molecular binding, making it indispensable in biochemical and pharmaceutical research. However, despite its clear advantages, the wide application of conventional ITC instruments has been limited due to large sample consumption and long measurement times. These shortcomings are particularly critical in cases where samples are expensive and scarce, or where high‐throughput analyses are required.[ 11 , 12 , 13 , 20 , 26 ]
Chip calorimeters designed for ITC measurements offer a promising solution to the limitations of conventional instruments by enabling rapid measurements with minimal sample volumes, thereby revolutionizing the analysis of biochemical interactions. In particular, chip calorimeters can be mass‐produced using MEMS fabrication techniques, significantly reducing device cost. These chip calorimeter devices can be deployed as disposable units or integrated into massively parallel formats, enabling high‐throughput applications in a cost‐effective manner. However, demonstrations of ITC using chip calorimeter systems remain scarce.[ 14 , 15 , 16 ] A chip calorimeter system suitable for ITC must offer high sensitivity to detect minute amounts of heat while simultaneously providing microfluidic control over the mixing and reaction of samples. Conventional ITC involves incremental titration of a titrant into a titrand, which is not well‐suited for microfluidic systems. Instead, reaction enthalpy can be measured across a series of controlled concentration variations. Such alternative microfluidic titration can be achieved by several methods including flow mixing,[ 27 , 28 ] and droplet mixing.[ 29 ] Flow calorimetry, where reactant concentrations are adjusted by varying flow rates, represents a straightforward method for implementing microfluidic ITC. However, chip calorimeters operated in a flow mode require relatively large sample consumption and generally offer lower power resolutions than chip calorimeters operated in an injection mode. Droplet‐based microfluidics, particularly inkjet‐based sample delivery followed by droplet merging,[ 30 ] offers a promising alternative for high‐throughput ITC with minimal sample consumption. However, control of the sample concentration in such a system requires reloading the inkjet system with fresh samples, making its use for ITC operations challenging. On the other hand, droplet microfluidics ensures precise control of reaction volume and minimal sample consumption.[ 14 , 16 ] In addition, droplet microfluidics eliminates issues related to sample adsorption on channel walls, which is particularly advantageous for microfluidic sensor applications. Sample adsorption in conventional microfluidic systems can lead to significant changes in sample concentration and trigger unwanted surface reactions. Droplet‐based ITC can provide precise control over sample concentration and eliminate the need for extensive cleaning protocols between experiments, even without surface passivation.[ 31 , 32 ] However, the continuous fluid flow of droplet microfluidics often induces additional thermal capacitance loading and baseline shifts, reducing sensitivity and increasing sample consumption.
To address these challenges, we developed a chip calorimeter integrating an on‐demand droplet generation and merging mechanism, enabling precise control over droplet volume. Unlike continuous droplet generation and merging methods, our on‐demand workflow not only reduces sample consumption but also eliminates flow‐induced thermal artifacts and additional thermal capacitance loading from continuous flow, allowing highly sensitive and precise calorimetric measurements. The chip integrates a vanadium pentoxide(V2O5) thermistor as a highly sensitive temperature sensor and combines parylene microfluidics and Polydimethylsiloxane(PDMS) microfluidics to construct a vacuum‐insulated reaction chamber and control microfluidic flows. To demonstrate the feasibility of ITC, we measured the heat of the reaction between 18‐crown‐6(18‐C‐6) and barium chloride(BaCl2) at varying droplet volumes. The extracted thermodynamic parameters showed good agreement with theoretical predictions, validating the performance of our chip calorimeter for microfluidic ITC applications.
2. Results and Discussion
2.1. Droplet‐Based Chip Calorimeter for Isothermal Titration Calorimetry
Figure 1a illustrates the schematic operation of our chip calorimeter compared to a conventional ITC instrument. A conventional ITC system typically consists of two calorimetric cells–a reference cell and a measurement cell, both housed within an insulated jacket and maintained at a constant temperature by precisely controlling the applied heat to the cells. During a titration experiment, small aliquots of titrant are sequentially injected into the measurement cell containing the titrand, while the reference cell functions as a temperature reference. The heat generated or absorbed due to molecular interactions in the measurement cell induces slight temperature changes, which are compensated by adjusting the applied heat to maintain the isothermal condition. The differential power required to maintain the thermal equilibrium is recorded, producing an ITC thermogram. By integrating the ITC thermogram over time, the normalized enthalpy change is obtained as a function of the titrant‐to‐titrand molar ratio, generating a binding isotherm. By fitting the isotherm to an appropriate binding model, key thermodynamic parameters– including K, ΔH, and n can be determined, which are used to calculate ΔG and ΔS.
Figure 1.
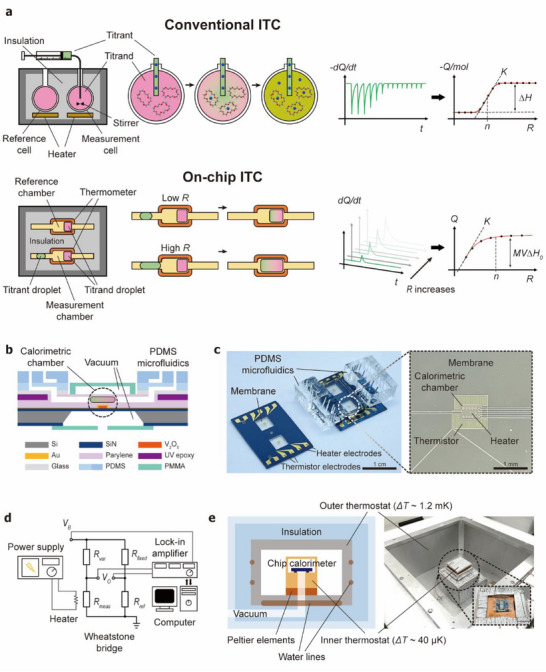
Droplet‐based chip calorimeter for ITC. a) Schematic comparison of conventional ITC and droplet‐based ITC. In the droplet‐based system, the heat of the reaction is measured from the merging of droplets with varying volumes. b) Cross‐sectional structure of the parylene chip calorimeter (not to scale). c) Images of parylene chip calorimeter devices, showing a diced device (left) and a fully assembled device (right) with on‐chip vacuum chambers and PDMS microfluidics. The magnified microscopic image of the membrane shows the calorimetric chamber and the thermistor. d) Schematic of the electrical measurement setup used for differential temperature sensing and thermal conductance calibration. e) Two‐level thermostat system designed to provide a highly stable thermal reservoir.
Implementing the conventional sample injection scheme in a microfluidic device presents challenges, as new sample injection would displace the existing sample within the chamber. To address this problem, we utilized a droplet microfluidic system enabling consecutive heat of reaction measurements from picoliter‐volume droplets with varying molar ratios. First, aqueous droplets–one containing the titrand and the other containing the titrant are generated in PDMS microfluidics and delivered to a parylene calorimetric chamber. There, the droplets merge, initiating the reaction, and the associated heat of the reaction is measured. Instead of titration by sequential injections, multiple merging events are created with varying final molar concentration ratio. The molar ratio between the titrant and the titrand can be precisely controlled by varying the size of the droplets. The heat powers measured during each merging event are converted to an enthalpy change graph as a function of titrant to titrand molar ratio, similar to a binding isotherm.
Figure 1b shows images of our chip calorimeter along with a schematic representation of its structure. Similar to a conventional ITC system, the chip calorimeter features a reference chamber and a measurement chamber both located on thin membranes composed of parylene and silicon nitride(SiN) (Figure 1c). The calorimetric chambers and the connecting channels are fabricated using thin‐film parylene microfluidics and enclosed in an on‐chip vacuum chamber to minimize heat loss through conduction and convection.[ 33 ]
Sample droplets are generated in the PDMS microfluidic section of the system, which incorporates multi‐layer on‐chip valves and microfluidic structures for on‐demand droplet generation. By precisely controlling the flow channel and control channel pressures, sample droplets can be manipulated to perform ITC measurements. The heat generated from sample reactions is detected using highly sensitive V2O5 thermistors, which are strategically patterned around the reaction chamber to ensure accurate and sensitive measurements.
Figure 1d illustrates the electrical measurement circuitry. A Wheatstone bridge circuit, combined with a lock‐in amplifier, is employed for differential resistance measurements between the reference thermistor (Rref ) and the measurement thermistor (Rmeas ). Additionally, an integrated resistive heater is used for thermal conductance calibration, where the differential output voltage is measured at a given applied heat power.
Calorimetric measurements require a stable thermostat system to prevent external temperature fluctuations from affecting the results. To achieve this, we developed a two‐level thermostat that provides a highly stable thermal reservoir (Figure 1e; Figure S1, Supporting Information). The outer thermostat consists of a 1 cm‐thick aluminum plate with embedded water lines. Temperature regulation is achieved by circulating water through these water lines. The water temperature is stabilized using Peltier elements in a separate water reservoir. The temperature of the reservoir is PID‐controlled to maintain a constant value with fluctuations below ≈1.2 mK (Figure S2, Supporting Information). The inner thermostat, which also functions as a vacuum chuck, consists of a copper block that serves as a thermal reservoir for the chip calorimeter device. The temperature of the inner thermostat was regulated by Peltier elements, maintaining fluctuations below ≈40 µK. To further enhance thermal isolation, the on‐chip vacuum space surrounding the calorimeter chambers is evacuated to 0.5 m Torr, minimizing heat transfer through the air.
2.2. Microfabrication of the Chip Calorimeter
The chip calorimeter was fabricated on a SiN wafer using various MEMS fabrication techniques involving semiconductor materials and polymers (Figure 2 ). As the first step, the backside SiN window was etched to enable future silicon wet etching. A vanadium oxide (VOx) layer was then sputter‐deposited and patterned via lift‐off, followed by furnace annealing to induce phase transformation into V2O5. Interdigitated Au electrodes were deposited and patterned using wet etching to form V2O5 thermistors. Au resistive heaters were also patterned at the calorimetric chamber locations for thermal conductance calibration.
Figure 2.
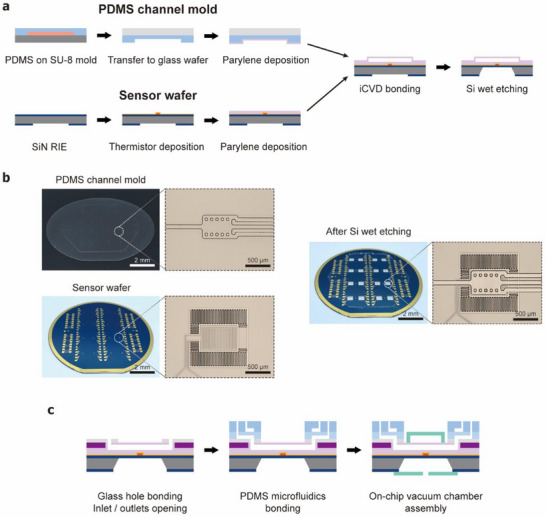
Fabrication and assembly of the chip calorimeter. a) Fabrication steps. Parylene is deposited on both the PDMS channel mold and the sensor wafer containing V2O5 thermistors. The parylene layers are bonded using the iCVD bonding technique. b) Images of the wafer and the calorimetric chamber during key fabrication steps. c) Assembly of the PDMS microfluidic system and the on‐chip vacuum chamber.
The mold for the parylene microfluidic channels was fabricated using PDMS. Parylene channel structures were patterned on a Si wafer using SU‐8 photoresist. PDMS was then spin‐coated and cured on this SU‐8 mold to form a PDMS mold. This PDMS mold layer was transferred onto a glass wafer to facilitate alignment and bonding with the bottom sensor wafer. Parylene layers (5 µm‐thick) were deposited on both the sensor wafer and the PDMS mold. The parylene layers were bonded using the initiated chemical vapor deposition (iCVD) nano adhesive bonding technique.[ 34 , 35 ] After the iCVD bonding, a parylene/SiN membrane was formed via Si wet etching. The individual chip calorimeters were then diced for further processes.
For the connection of PDMS microfluidics to the parylene microfluidics, glass holes were fabricated separately by laser modification chemical etching,[ 36 ] and bonded to the parylene channels (Figure S3, Supporting Information). The PDMS microfluidic system, containing droplet generators and multilayer valves, was fabricated using conventional soft lithography methods and bonded on top of the glass holes via oxygen plasma treatment. The PDMS channel mold was fabricated with SU‐8 and AZ‐9260 photoresist to achieve two different cross‐sectional shapes. A rounded cross‐sectional shape is necessary for PDMS valve construction while a rectangular channel is common for droplet microfluidics. We first patterned the rectangular channels with SU‐8, then patterned the round channels with AZ resist which can have its rounded cross‐section by reflow. To complete the chip, an on‐chip vacuum chamber was constructed by bonding a glass coverslip and polymethyl methacrylate (PMMA) cover.
2.3. On‐Demand Preparation and Manipulation of Picoliter‐Volume Droplets
We integrated an on‐demand droplet generator with a microfluidic ITC to enable precise control of sample volumes. Figure 3a presents the schematic of the PDMS microfluidics for droplet generation and control. We adopted an on‐demand droplet generator scheme utilizing a two‐layer PDMS valve system.[ 37 ] The main channel of the droplet generator is filled with mineral oil, while the two side inlets contain the titrant and titrand solutions. When the valves for the titrant or titrand channel are opened, the aqueous solution flows into the main channel. After a set period of time, the titrant/titrand inlet valve is closed, and the oil inlet valve is opened. The flow transition from aqueous solution to oil induces solution break‐up and droplet formation. The droplet volume is precisely controlled by adjusting the injection pressure of the titrant/titrand along with a fixed valve opening time (1 s). Using this approach, we generated droplets ranging from ≈200 pL to 1 nL with an error of less than ≈3.7% under various loading pressures (Figure 3b).
Figure 3.
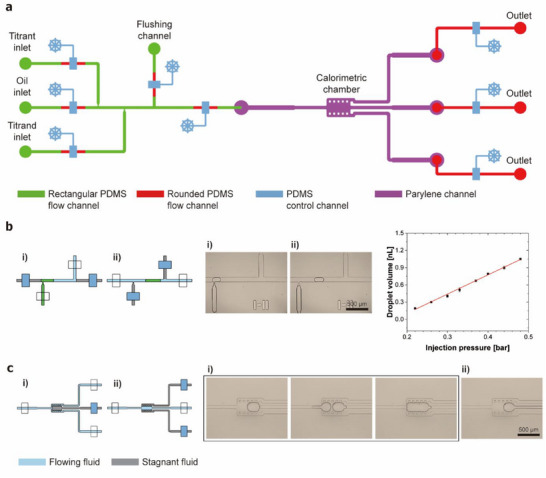
Structure and operation of the droplet microfluidic system. a) Schematic of the integrated microfluidic system. The PDMS microfluidics, which includes the on‐demand droplet generator and flow control valves, are combined with the parylene microfluidics containing the calorimetric chamber. b) Droplet generation by alternating sample and oil flows into the main channel. Droplet volume is controlled by the sample injection pressure. (n = 9) c) Titrand and titrant droplet capture and merging by sequential generation and transport of droplets.
The parylene calorimetric chamber incorporates a droplet capture and merging structure (Figure 3c). By closing the middle outlet valve, droplets are captured within the chamber. The titrand droplet is first transported and stored, followed by the titrant droplet, which is generated to have varying volumes and flows into the chamber. After a brief delay upon contact, the two droplets merge, allowing the titrant and titrand molecules to mix. The resulting heat of the reaction is measured. Upon completion of the measurement, the merged droplet is flushed out by closing the two side outlets and opening the middle outlet. This measurement is repeated with droplets of varying volumes.
2.4. Characterization of the Chip Calorimeter
The V2O5 thermistors in the chip calorimeter exhibit excellent electric properties as a temperature sensor. To characterize the performance, we measured the temperature coefficient of resistance (TCR) of the thermistor using a probe station over a temperature range of 20–70 °C (Figure 4a). The thermistor dimensions were designed to achieve a resistance Rth of ≈10 kΩ at 25 °C, optimizing noise performance and minimizing self‐heating. The measured TCR was −4.36% K−1. Figure 4b shows typical output voltage (VO ) signals at bias voltage, VB = 0.45 V (BW = 0.01–1 Hz) with the bridge circuit configuration (Figure 1d). The root‐mean‐square (RMS) noise voltage (Vrms ) is 24.3 ± 5.57 nV Hz−1/2 (n = 9), corresponding to a noise‐equivalent temperature difference (NETD) of 4.95 ± 1.14 µK. When ΔRmeas is small, the output voltage can be approximated as , and the NETD is given by .
Figure 4.
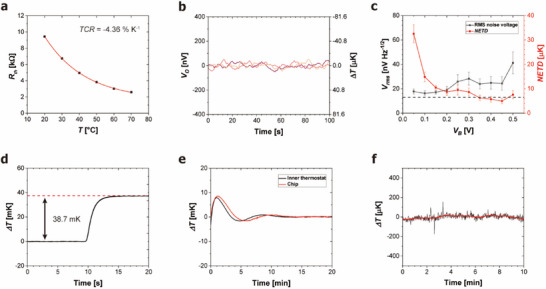
Characterization of the chip calorimeter. a) TCR of the V2O5 thermistor. b) Typical output voltage signal from the bridge circuit at VB = 0.45 V. Three representative signals are overlaid. The RMS noise voltage is 24.3 ± 5.57 nV Hz−1/2. c) RMS noise voltage and corresponding NETD at varying bias voltages. The black dotted line indicates the Johnson–Nyquist noise level of the thermistor. d) Calibration of the thermal conductance. e) Temperature change of the inner thermostat with PID control and the chip calorimeter response. f) Baseline temperature drift of the inner thermostat after stabilization.
The thermistor noise voltage in the bridge circuit varies with the VB , as the VO is proportional to VB . Figure 4c shows the Vrms (BW = 0.01–1 Hz) as a function of VB . As VB increases, the NETD decreases to its minimum. With the minimum NETD of 4.95 µK, the calorimeter temperature resolution (Tres ) corresponds to 14.9 µK, based on a signal‐to‐noise ratio (SNR) of 3:1.
The thermal conductance (G) of the chip calorimeter was determined using an integrated resistive heater. Joule heating of 6 µW applied to the heater underneath the parylene chamber resulted in a temperature rise of 38.7 mK (Figure 4d). This value yields G = 155 µW K−1, and time constant τ = 0.964 s. The parylene channel and chamber were filled with mineral oil and the vacuum insulation was applied. The power resolution (Pres ) of the chip calorimeter, defined as the product of G and Tres , was calculated to be 2.31 nW.
The performance of the thermostat was evaluated by measuring the temperature response of the chip calorimeter when the inner thermostat was activated. Before activating the inner thermostat, the outer thermostat was activated and the temperature was allowed to stabilize. Once activated, the inner thermostat reached thermal stability within ≈15 min, and the chip calorimeter temperature closely followed it with a delay of ≈1 min (Figure 4e). After stabilization, the inner thermostat exhibited exceptional temperature stability, with a fluctuation of only ≈40 µK (Figure 4f).
2.5. Isothermal Titration Calorimetry of 18‐Crown‐6 and Barium Chloride
We performed the ITC of the titration of 18‐C‐6 with BaCl2 using the chip calorimeter to demonstrate its potential for thermodynamic characterization of biomolecular interactions (Figure 5a). The binding reaction between 18‐C‐6 and BaCl2 is a crown‐ether complexation, where a single metal ion Ba2+ binds to a single 18‐C‐6 molecule. This type of reaction typically produces a titration curve that can be fitted using the following equation:[ 14 , 38 ]
Figure 5.
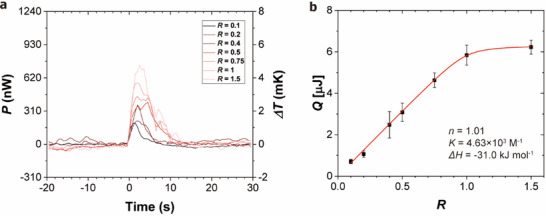
ITC measurement of the binding reaction between 18‐C‐6 and BaCl2. a) Calorimetric power signal measured from droplet mixing with various molar ratios. b) Total heat of binding plotted as a function of the titrant‐to‐titrand molar ratio R.
, where Q is the heat of reaction, V0 is the active chamber volume, MT is the initial titrand concentration, and R is the molar ratio between titrant and titrand.
For the titration of 18‐C‐6 with BaCl2, 2 nL droplets of 18‐C‐6 solution were generated and captured in both the measurement and reference chambers. A 200 pL droplet of BaCl2 solution was then prepared and transported to the measurement chamber, where it merged with the 18‐C‐6 droplets. The heat released from the binding reaction was subsequently measured. The reaction was completed within ≈20 s, after which the temperature returned to baseline. Following each reaction, the chamber was flushed, and measurements were repeated with varying BaCl2 droplet volumes. The droplet volume (BaCl2 droplets) was adjusted from 0.2 to 3.0 nL. With a fixed volume of the 18‐C‐6 droplet, the corresponding molar ratios were 0.1, 0.2, 0.4, 0.5, 0.75, 1.0, and 1.5.
The heat power generated from the binding reaction was integrated over time to obtain the total released heat (Q). These heat of reaction data points were plotted against the molar ratio of BaCl2 to 18‐C‐6 (Figure 5b). By fitting the data to the binding model, we obtained the thermodynamic parameters: n = 1.01, K = 4.63 × 10³ m −1, and ΔH = −31.0 kJ mol−1. These values are in good agreement with measurements obtained using a commercial instrument: n = 0.935, K = 5.41 × 10³ m −1, and ΔH = −31.61 kJ mol−1.[ 13 ] From these results, ΔG and ΔS were calculated as ΔG = −20.9 kJ mol−1 and ΔS = −33.8 J mol−1 K−1 using the following relationship: ΔG = −kBNA ln(K) = ΔH−TΔS, where kB is the Boltzmann constant, and NA is the Avogadro constant. These values indicate that the binding interaction between 18‐C‐6 and BaCl2 is enthalpy‐driven, meaning the binding constant decreases with higher temperature.[ 26 ] Unlike conventional ITC systems, which operate in heat‐compensation mode, our chip calorimeter is operated in heat‐conduction mode, where the measured heat power is proportional to the temperature difference relative to the constant reference temperature. The temperature changes during the chip ITC measurement were less than 5 mK, which can be considered to be under approximately isothermal conditions.
The ITC measurements were demonstrated using high‐concentration samples, which may limit the applicability of the chip calorimeter for low‐concentration assays. The current power resolution is 2.31 nW, which is lower (i.e., less sensitive) than that of commercial ITC instruments and some state‐of‐the‐art chip calorimeters that achieve power resolution in the 100 pW range. We compromised thermal insulation to ensure robust droplet manipulation within the chip calorimeter, resulting in relatively large thermal conductance. Future development will be focused on optimizing device design and materials to enhance thermal insulation. Strategies will include reducing conduction by reducing cross‐sectional areas, using lower‐thermal‐conductivity oils, and minimizing radiative heat transfer. We anticipate that thin‐film chip calorimeters can ultimately achieve power resolution on the order of a few picowatts. Given the current state‐of‐the‐art performance of chip calorimeters and thermometer sensitivity, such enhancement appears feasible.[ 5 , 6 , 9 ] In addition, we plan to increase the reaction chamber volume to accommodate larger sample volumes, enabling reliable ITC measurements using lower sample concentrations. However, larger droplet size will increase thermal capacitance and slow down mixing, potentially leading to longer measurement times. Thus, careful optimization will be essential to fully leverage the advantages of chip ITC.
Each heat of reaction measurement currently takes less than 50 s, which is significantly faster than conventional ITC instruments due to the chip calorimeter's small thermal time constant. Including droplet generation, merging, measurement, and flushing steps, each data point requires ≈1 min. A typical ITC run with ≈10 data points can therefore be completed in ≈10 min, representing a substantial reduction in measurement time compared to conventional ITCs. More importantly, chip calorimeters can be readily integrated into parallelized systems, enabling high‐throughput applications such as drug screenings.
3. Conclusion
This study presents a novel chip calorimeter that enabled high‐sensitivity ITC at the microscale. Integration of V2O5 thermistors, vacuum‐insulated thin film parylene microfluidics, and PDMS on‐demand droplet generator resulted in a calorimetric device with exceptional thermal sensitivity and precise fluid control. This device was complemented with the two‐level thermostat to maintain the surrounding temperature of the system constant. The chip calorimeter demonstrated a power resolution of 2.31 nW, which was remarkable for the on‐chip ITC, allowing for detection of minute thermal events associated with bio/chemical molecular interactions. The successful ITC of 18‐C‐6 and BaCl2 validated the device's capability for ITC applications.
This chip calorimeter represents a significant advancement in microscale calorimetry, with promising applications in biochemical analysis, drug discovery, and materials science. Future work will focus on broadening the range of measurable interactions and further enhancing the device's sensitivity and throughput. Beyond its original function as an isothermal titration calorimeter, the platform has the potential to be used for a wide variety of biochemical interactions at microfluidic scale.
4. Experimental Section
Fabrication of the Sensor Wafer
Both sides of a 4‐inch double‐side‐polished Si wafer were coated with 100 nm‐thick low‐stress SiN using low‐pressure chemical vapor deposition. On the backside of the wafer, a 1.4 µm‐thick AZ‐5214 E (MicroChemicals GmbH) photoresist was spin‐coated and patterned photolithographically to define the SiN etching window. All photolithography steps were performed using an MA‐6 mask aligner (Karl Suss). Reactive ion etching (RIE) was used to etch the SiN at 30 m Torr with 10 SCCM of CHF3 and 2 SCCM of O2 gas flows. A VOx thin film was deposited and patterned by lift‐off. A 6 µm‐thick AZ‐10 XT photoresist (MicroChemicals GmbH) was spin‐coated and patterned. A 600 nm‐thick VOx layer was deposited by RF sputtering at 0.8 m Torr with 20 SCCM of Ar, and 5 SCCM of O2 gas flows. After removing the photoresist, the VOx was annealed in a furnace at 400 °C for 4 h in air to transform the VOx into the V2O5 phase. Electrodes and resistive heaters were fabricated via wet etching. A 10 nm‐thick Cr adhesion layer and a 100 nm‐thick Au layer were sequentially deposited by DC sputtering. An etching mask was patterned with 1.4 µm‐thick AZ‐5214 E photoresist. The Au and Cr layers were etched with Au etchant (CAS 7681‐11‐0, Sigma–Aldrich) and Cr etchant (MDL MFCD07370678, Sigma–Aldrich), respectively.
Soft Lithography of the Channel Mold
The mold for the parylene channel was fabricated using PDMS. A 60 µm‐thick SU‐8 3025 photoresist (Kayaku AM) was patterned on a 4‐inch single‐side‐polished Si wafer to define the parylene channel geometry. PDMS was spin‐coated onto the SU‐8 mold to a thickness of 210 µm and cured at 80 °C in a convection oven for 2 h. The PDMS layer was transferred to a 4‐inch boro 33 glass wafer by oxygen plasma bonding. Both the surface of the PDMS and the glass wafer were treated with oxygen plasma at 60 W for 2 min (Expanded Plasma Cleaner, Harrick plasma) and bonded together. The bonded assembly was further annealed at 80 °C in a convection oven for 20 h for strong bonding. Afterward, the PDMS was peeled off from the SU‐8 mold, resulting in a PDMS mold with the structure of the parylene channel.
Parylene Channel Bonding
The sensor wafer was treated with silane A 174 (CAS 2530‐85‐0, Millipore) vapor for 1 h, to enhance parylene adhesion. In contrast, the PDMS mold was treated with oxygen plasma (2 min, 60 W) for easy release of the parylene layer after bonding. Both the sensor wafer and the PDMS mold were coated with a 5 µm‐thick layer of parylene using a parylene coater (PDS 2010, Specialty Coating Systems). To enhance the adhesion of iCVD layer, the parylene‐coated wafers were treated with oxygen plasma (1 min, 60 W). A 400 nm‐thick poly(glycidyl methacrylate) (PGMA) layer was subsequently deposited using a custom‐built iCVD system (DAEKI High‐Tech. Co,. Ltd.) at 140 m Torr, with a 4:1 gas flow ratio of glycidyl methacrylate (CAS 106‐91‐2, Sigma–Aldrich) and tert‐butyl peroxide (CAS 110‐05‐4, Sigma–Aldrich). Ethylene diamine (EDA, CAS 107‐15‐3, Tokyo Chemical Industry Co., LTD.) vapor was exposed to the sensor wafer side at 75 °C for 5 min to introduce amine functional groups. The two wafers were bonded using a vacuum bonding machine (Hutem) at 110 °C with 2.5 bar bonding pressure for 2 h. After the bonding, the PDMS mold was removed from the sensor wafer leaving behind the bonded parylene microfluidic channel.
Assembly of the Chip Calorimeter
The sensor wafer was mounted onto a KOH etching jig (AMMT GmbH.) with the backside SiN windows exposed. The 525 µm‐thick Si of the wafer was etched with a 35% w/w KOH aqueous solution at 83 °C for 6 h to release the suspended membrane structure. After the etching, the wafer was diced into individual calorimeter chips for further assembly of the on‐chip vacuum chamber and the PDMS microfluidic system. The on‐chip vacuum chamber was constructed using a PMMA cover, which was laser‐cut (VLS 3.50, Universal Laser Systems) and bonded to the chip with UV‐curable adhesive (NOA 71, Norland products, Inc.). To connect the parylene microfluidic channel with the PDMS droplet microfluidic system, thin glass holes were fabricated. Holes with 200‐µm diameter were produced using laser modification chemical etching–a technique combining laser ablation and wet etching to produce clean holes in thin glass substrates (Figure S3, Supporting Information).[ 36 ] The glass holes were aligned with the inlets and outlets of the parylene channel and bonded to the calorimeter chip using UV‐curable adhesive. Then the parylene layer beneath the glass holes was etched using RIE at 30 m Torr with an O2 gas flow of 5 SCCM.
Soft Lithography of the PDMS Droplet Microfluidic System
The PDMS microfluidic system was fabricated using conventional soft‐lithography techniques. The flow channel mold was patterned with two types of photoresist–SU‐8 3025 for rectangular cross‐section channels, and AZ‐9260 (MicroChemicals GmbH) for rounded cross‐section channels. First, 20 µm‐thick SU‐8 3025 was used to define the flow channels, except at the valve regions. At the valve locations, 20 µm‐thick AZ‐9260 was used, which was reflowed by heating the mold on a hotplate at 130 °C for 5 min to achieve a rounded cross‐section suitable for valve closure. The control channel mold was fabricated by patterning 40 µm‐thick SU‐8 3025. For the flow layer, a 20:1 (base:curing agent) PDMS mixture (Sylgard 184, Dow) was spin‐coated to a thickness of 40 µm. The control layer was prepared by pouring a 3 mm‐thick layer of PDMS with 5:1 mixing ratio. Both PDMS layers were partially cured at 80 °C in a convection oven for 30 min. The control layer blocks were cut from the mold, aligned with the flow layer, and bonded using oxygen plasma treatment. The bonded PDMS channel was further cured at 80 °C for 2 h. Finally, the bonded PDMS channel was aligned and bonded with the glass holes on the chip using oxygen plasma, followed by further heat treatment at 80 °C for 20 h to ensure strong adhesion.
Sample Preparation
The internal surface of the parylene channel was coated with 1, 2‐epoxydodecane (CAS 2855‐19‐8, Sigma–Aldrich) to ensure a uniform hydrophobic surface (Figure S4, Supporting Information). As the continuous phase for the droplet microfluidic system, light mineral oil (CAS 8042‐47‐5, Sigma–Aldrich) mixed with 0.2% w/w Span 80 surfactant (CAS 1338‐43‐8, Sigma–Aldrich) was used to stabilize the aqueous droplets. For the ITC experiments, 18‐C‐6 (CAS 17455‐13‐9, Sigma–Aldrich) and BaCl2 (CAS 10361‐37‐2, Sigma–Aldrich) were each dissolved in deionized water to a concentration of 0.1 m, and used as the titrand and titrant solutions, respectively.
Conflict of Interest
The authors declare no conflicts of interest.
Supporting information
Supporting Information
Acknowledgements
This work was supported by the National Research Foundation of Korea (NRF) grant, funded by the Korean government (MSIT) (RS‐2025‐00514604 and RS‐2021‐NR058193).
Chae M., Nam S. M., Seo S., Choi Y., Yang H., Kim J., Jung B.‐J., Lee W., Picoliter‐Volume Isothermal Titration Calorimetry Using Parylene Chip Calorimeter Integrated with on‐Demand Droplet Microfluidics. Small 2025, 21, 2504872. 10.1002/smll.202504872
Data Availability Statement
The data that support the findings of this study are available from the corresponding author upon reasonable request.
References
- 1. van Herwaarden A. W., Thermochim. Acta 2005, 432, 192. [Google Scholar]
- 2. Lee W., Lee J., Koh J., Nanobiosens. Disease Diagnosis 2012, 1, 17. [Google Scholar]
- 3. Khaw M. K., Mohd‐Yasin F., Nguyen N. T., Microelectron. Eng. 2016, 158, 107. [Google Scholar]
- 4. Wang Y., Zhu H., Feng J., Neuzil P., TrAC Trends in Analytical Chem. 2021, 143, 116353. [Google Scholar]
- 5. Hur S., Mittapally R., Yadlapalli S., Reddy P., Meyhofer E., Nat. Commun. 2020, 11, 2983. [DOI] [PMC free article] [PubMed] [Google Scholar]
- 6. Hong S., Dechaumphai E., Green C. R., Lal R., Murphy A. N., Metallo C. M., Chen R., Nat. Commun. 2020, 11, 2982. [DOI] [PMC free article] [PubMed] [Google Scholar]
- 7. Baier V., Födisch R., Ihring A., Kessler E., Lerchner J., Wolf G., Köhler J. M., Nietzsch M., Krügel M., Sens. Actuators, A 2005, 123, 354. [Google Scholar]
- 8. Gaddes D., Reeves W. B., Tadigadapa S., ACS Sens. 2017, 2, 796. [DOI] [PubMed] [Google Scholar]
- 9. Lee W., Fon W., Axelrod B. W., Roukes M. L., Proc. Natl. Acad. Sci. 2009, 106, 15225. [DOI] [PMC free article] [PubMed] [Google Scholar]
- 10. Nestorova G. G., Adapa B. S., Kopparthy V. L., Guilbeau E. J., Sens. Actuators, B 2016, 225, 174. [Google Scholar]
- 11. Velazquez‐Campoy A., Ohtaka H., Nezami A., Muzammil S., Freire E., Curr Protoc Cell Biol 2004, 23, 17. [DOI] [PubMed] [Google Scholar]
- 12. spencer S. D., Raffa R. B., Pharm. Res. 2004, 21, 1642. [DOI] [PubMed] [Google Scholar]
- 13. Mizoue L. S., Tellinghuisen J., Biophys. Chem. 2004, 110, 15. [DOI] [PubMed] [Google Scholar]
- 14. Wang B., Jia Y., Lin Q., Biosens. Bioelectron. 2016, 78, 438. [DOI] [PubMed] [Google Scholar]
- 15. Jia Y., Zhang Z., Su C., Lin Q., Microfluid. Nanofluid. 2017, 21. [DOI] [PMC free article] [PubMed] [Google Scholar]
- 16. Feng X., Jia Y., Jiang H., Lin Q., Anal. Methods 2018, 10, 4665. [Google Scholar]
- 17. Jia Y., Su C., He M., Liu K., Sun H., Lin Q., Biomed. Microdevices 2019, 21, 96. [DOI] [PubMed] [Google Scholar]
- 18. Rodríguez M R. d., Socorro F., J. Therm. Anal. Calorim. 2007, 87, 591. [Google Scholar]
- 19. Ładosz A., Kuhnle C., Jensen K. F., Reaction Chem. Engineer. 2020, 5, 2115. [Google Scholar]
- 20. Wang Y., Wang G., Moitessier N., Mittermaier A. K., Front. Mol. Biosci. 2020, 7, 583826. [DOI] [PMC free article] [PubMed] [Google Scholar]
- 21. Maeng J. H., Lee B. C., Ko Y. J., Cho W., Ahn Y., Cho N. G., Lee S. H., Hwang S. Y., Biosens. Bioelectron. 2008, 23, 1319. [DOI] [PubMed] [Google Scholar]
- 22. Lerchner J., Maskow T., Wolf G., Chem. Engineer. Processing: Process Intensification 2008, 47, 991. [Google Scholar]
- 23. Recht M. I., Chamoun J., Pattekar A., Martini J., Miller B. L., Weiss S. M., Danielli A., Proc. SPIE 2019, 10895, 108950M. [Google Scholar]
- 24. Ahmad L. M., Towe B., Wolf A., Mertens F., Lerchner J., Sens. Actuators, B 2010, 145, 239. [Google Scholar]
- 25. Bastos M., Abian O., Johnson C. M., Ferreira‐da‐Silva F., Vega S., Jimenez‐Alesanco A., Ortega‐Alarcon D., Velazquez‐Campoy A., Nat. Rev. Methods Primers 2023, 3, 17. [Google Scholar]
- 26. Tellinghuisen J., Anal. Biochem. 2022, 642, 114481. [DOI] [PubMed] [Google Scholar]
- 27. van Schie M., Ebrahimi K. H., Hagen W. R., Hagedoorn P. L., Anal. Biochem. 2018, 544, 57. [DOI] [PubMed] [Google Scholar]
- 28. Modaresifar M., Kowalski G. J., Thermochim. Acta 2017, 655, 137. [Google Scholar]
- 29. Torres F. E., Kuhn P., Bruyker D. D., Bell A. G., Wolkin M. V., Peeters E., Williamson J. R., Anderson G. B., Schmitz G. P., Recht M. I., Schweizer S., Scott L. G., Ho J. H., Elrod S. A., Schultz P. G., Lerner R. A., Bruce R. H., Proc. Natl. Acad. Sci. 2004, 101, 9517. [DOI] [PMC free article] [PubMed] [Google Scholar]
- 30. Xu J., Reiserer R., Tellinghuisen J., Wikswo J. P., Baudenbacher F. J., Anal. Chem. 2008, 80, 2728. [DOI] [PMC free article] [PubMed] [Google Scholar]
- 31. Kaminski T. S., Scheler O., Garstecki P., Lab Chip 2016, 16, 2168. [DOI] [PubMed] [Google Scholar]
- 32. Moragues T., Arguijo D., Beneyton T., Modavi C., Simutis K., Abate A. R., Baret J.‐C., deMello A. J., Densmore D., Griffiths A. D., Nat. Rev. Methods Primers 2023, 3, 32. [Google Scholar]
- 33. Kim J., Nam S. M., Jang H., Chung J.‐P., Kim J. S., Kim B.‐C., Chun K. J., Lee W., Curr. Appl. Phys. 2020, 20, 337. [Google Scholar]
- 34. Kim J., You J. B., Nam S. M., Seo S., Im S. G., Lee W., ACS Appl. Mater. Interfaces 2017, 9, 11156. [DOI] [PubMed] [Google Scholar]
- 35. Seo S., Kim J., Choi Y., You J. B., Im S. G., Lee W., Polymer 2019, 181, 121763. [Google Scholar]
- 36. Park S. H., Kim T. J., Lee H. E., Ma B. S., Song M., Kim M. S., Shin J. H., Lee S. H., Lee J. H., Kim Y. B., Nam K. Y., Park H. J., Kim T. S., Lee K. J., Nat. Commun. 2023, 14, 7744. [DOI] [PMC free article] [PubMed] [Google Scholar]
- 37. Zeng S., Li B., Su X., Qin J., Lin B., Lab Chip 2009, 9, 1340. [DOI] [PubMed] [Google Scholar]
- 38. Wiseman T., Williston S., Brandts J. F., Lin L.‐N., Anal. Biochem. 1989, 179, 131. [DOI] [PubMed] [Google Scholar]
Associated Data
This section collects any data citations, data availability statements, or supplementary materials included in this article.
Supplementary Materials
Supporting Information
Data Availability Statement
The data that support the findings of this study are available from the corresponding author upon reasonable request.