Abstract
High-throughput gene expression profiling has become an important tool for investigating transcriptional activity in a variety of biological samples. To date, the vast majority of these experiments have focused on specific biological processes and perturbations. Here, we have generated and analyzed gene expression from a set of samples spanning a broad range of biological conditions. Specifically, we profiled gene expression from 91 human and mouse samples across a diverse array of tissues, organs, and cell lines. Because these samples predominantly come from the normal physiological state in the human and mouse, this dataset represents a preliminary, but substantial, description of the normal mammalian transcriptome. We have used this dataset to illustrate methods of mining these data, and to reveal insights into molecular and physiological gene function, mechanisms of transcriptional regulation, disease etiology, and comparative genomics. Finally, to allow the scientific community to use this resource, we have built a free and publicly accessible website (http://expression.gnf.org) that integrates data visualization and curation of current gene annotations.
The sequence of the first mammalian genome represents a landmark in modern biology and opens new avenues to pursue global approaches at understanding gene function and its relationship to human physiology (1, 2). The raw genome sequence and the accompanying gene predictions provide a starting point for the understanding of their function, the complexity of their interactions, and their roles in promoting cellular and organismal phenotypes. The most common approach to global gene annotation uses primary amino acid sequence analysis tools (e.g., blast and hmmer) and sequence databases (e.g., GenBank and Pfam; refs. 3–6). These powerful tools are used to annotate genes of unknown function under the premise that proteins of similar structure usually have similar function (e.g., kinases contain kinase domains).
Whereas primary sequence analysis frequently indicates the molecular function of a gene and can point to relevant biochemical assays for future study, it does not suggest the cellular or physiological role for proteins. To attempt to gain a more complete picture of a novel gene's function, researchers often perform multiple-tissue Northern blots to look at its expression in a panel of tissues or organs. However, this experiment can be laborious and time-consuming, and availability of a representative number of tissue samples is an important factor for interpretation of the results.
High-throughput gene expression analysis has allowed us to construct the equivalent of a multiple-tissue Northern blot for thousands of genes at once. We have constructed such a resource by profiling 46 human and 45 mouse tissues from diverse tissue origins. Whereas several recent studies have also described high-throughput gene expression measurements on diverse tissue sets (7–9), previous analyses of physiological gene function have been limited to identification of housekeeping genes, and clustering of genes involved in metabolic pathways and development of the central nervous system. The analysis of the data described in the current work has a significantly different and expanded scope. Here, we use mRNA expression patterns to specifically augment gene annotation of genes with no known physiological function. Furthermore, we extend this analysis to investigate mechanisms of transcriptional regulation, to discover candidate disease markers, and to compare transcriptional profiles of gene orthologs in mouse and human. Finally, we have constructed a web resource that allows users to easily perform common queries on the data. Because these data are generated from a non-ratiometric and standardized genomic technology, expansion of this dataset in our continuing effort toward elucidating the transcriptome will easily allow inclusion of additional gene expression data from internal samples as well as those contributed by external collaborators.
Materials and Methods
Samples and Chip Hybridization.
Forty-six human tissue samples and cell lines were obtained from commercial sources and previously published research collaborations, and forty-five mouse tissue samples were derived from dissections. Detailed sample descriptions can be obtained on the web site (http://expression.gnf.org). These samples were labeled and hybridized to either human (U95A) or mouse (U74A) high-density oligonucleotide arrays (10, 11) as described (12). Primary image analysis of the arrays was performed by using genechip 3.2 (Affymetrix, Santa Clara, CA), and images were scaled to an average hybridization intensity (average difference) of 200.
Identification of Tissue-Specific Genes.
For the human dataset, the set of 46 tissues, organs, and cell-lines was reduced to 25 independent and nonredundant samples (see Table 1, which is published as supporting information on the PNAS web site, www.pnas.org). All 45 mouse samples were derived from dissection and were already considered as having independent origins. Based on extensive PCR-validation of oligonucleotide array data (data not shown) and the absence/presence call provided by the genechip software package, an average difference (AD) value of 200 was defined as a conservative threshold to call a gene “expressed” or present. Additionally, an AD of 200 has been estimated to represent ≈3–5 copies per cell, and an expression ratio of 2-fold has previously been established as the approximate limit of sensitivity (10, 11). By using these guidelines as filtering criteria, tissue-specific genes were conservatively defined as having an AD value of greater than 200 in one tissue, and AD value of less than 100 in all other tissues.
Transcriptional Response Elements.
The human dataset was filtered to select genes with expression in the pituitary gland that was 10-fold greater than median and greater than 3-fold above the median in no more than five other tissues. Thirty-four probe sets were identified that mapped to 23 unique Reference Sequence (Refseq) entries and four uncharacterized probe sets. To retrieve the promoter regions for these genes, the first 300 coding nucleotides were aligned to the human genome by using blast. Where significant hits (98% identity over at least 100 nucleotides) were identified, a 5-kb upstream sequence of the translational start methionine was retrieved. Because the transcriptional start sites of few genes are known, and because response elements have also been identified in the first intron of many structural genes, our searches were limited to the regions immediately 5′ of the translational start methionine. By using this method, promoter regions for 18 of the 23 pituitary-enriched genes were identified. Sequences were analyzed for conserved motifs by using alignace and scanace [George Church, Harvard University (13)].
Prostate Cancer Profiling.
Twenty-four prostate tumors and nine benign prostate tissues were profiled as described (14). To identify genes overexpressed in prostate cancer, genes were ranked by calculating the sum of three independent rank tests: the rank of [average hybridization intensity in tumor tissue (T) − average hybridization intensity in normal tissue (N)] + the rank of [average(T)/average(N)] + the rank (−P), where P is the P-value calculated by an unpaired, one-tailed t test. These cancer overexpressed genes were further ranked according to their average levels of expression in the gene expression atlas, with lowly expressed genes scoring highest.
Comparison of Mouse and Human Gene Expression.
Putative ortholog pairs in mouse and human were identified by finding genes with common LocusLink symbols (http://www.ncbi.nlm.nih.gov/LocusLink). Genes that were not expressed (AD less than 200 in all tissues), and genes that were not differentially expressed (ratio of maximum expression to median expression in all tissue less than 3) were removed from the analysis. Gene expression values of the remaining 799 putative orthologs pairs were compared by Pearson's correlation coefficient.
Results and Discussion
RNA samples from 46 human and 45 mouse tissues, organs, and cell lines were hybridized to high-density gene expression arrays. To validate the data, we used PCR to amplify ORFs from cDNA libraries constructed from tissue sources where the database indicated the gene was expressed. Without any optimization of PCR conditions, this analysis resulted in the successful amplification of 82% of 1,824 targets from tissue libraries where expression was seen in the gene expression atlas (data not shown). One hundred PCR reactions were also performed in tissues where the gene expression atlas indicated no message was present, resulting in only one positive amplification (data not shown).
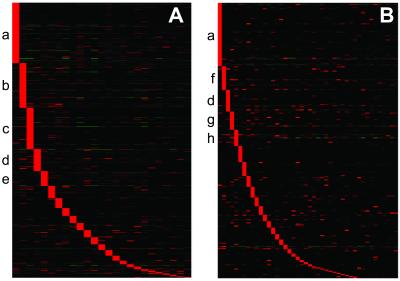
Examining gene expression across a panel of tissues allows us to identify both ubiquitously expressed “housekeeping genes,” the focus of Warrington et al. (7), as well as differentially expressed genes, which we hypothesize perform specific cellular and physiological functions. In our dataset, ≈6.0% of the interrogated genes are ubiquitously expressed, approximately the same percentage as reported in Warrington et al. (7.5%). Furthermore, whereas any individual tissue expresses approximately 30–40% of genes, almost all genes (90%) are expressed in at least one tissue examined. Statistical analysis (ANOVA) revealed that 78% and 82% of genes are differentially expressed in the mouse and human, respectively (P < 0.001). Hierarchical clustering of these differentially expressed genes shows that groups of tissue-specific genes are readily identified in nearly all tissues examined. The most striking examples of these differentially regulated genes are those genes whose expression is restricted to a single tissue (Fig. 1). For example, in this dataset there are 85 human genes restricted to the testis, including several that are known to be involved in testis-function, such as SRY (sex determining region Y)-box 5 (SOX5), testicular tektin 2 (TEKT2), and zona pellucida binding protein (ZPBP). In addition, 19 genes of unknown function were identified as testis-specific, including several whose cDNAs encode large proteins (15). Similar analysis for all tissues in both mouse and human datasets identified 311 human and 155 mouse tissue-restricted genes with known function, and 76 human and 101 mouse genes whose functions were previously uncharacterized (Fig. 1; see also Tables 1 and 2, which are published as supporting information on the PNAS web site).
Figure 1.
Expression of tissue-specific genes. Genes with tissue-specific expression patterns were identified for all tissues in the human (A) and mouse (B) datasets. “Tissue-specific” was defined as expressed with AD greater than 200 in one tissue and less than 100 AD in all other tissues. Tissues were sorted by the number of tissue-specific genes found. The five tissues in human and mouse with the most tissue-specific genes are labeled. Replicate samples from one tissue were averaged, and genes and tissues were clustered by using cluster and visualized by using treeview (25). Red, up-regulated; green, down-regulated; black, median expression. Tissue labels: a = testis, b = pancreas, c = liver, d = placenta, e = thymus, f = mammary gland, g = thyroid, and h = salivary gland).
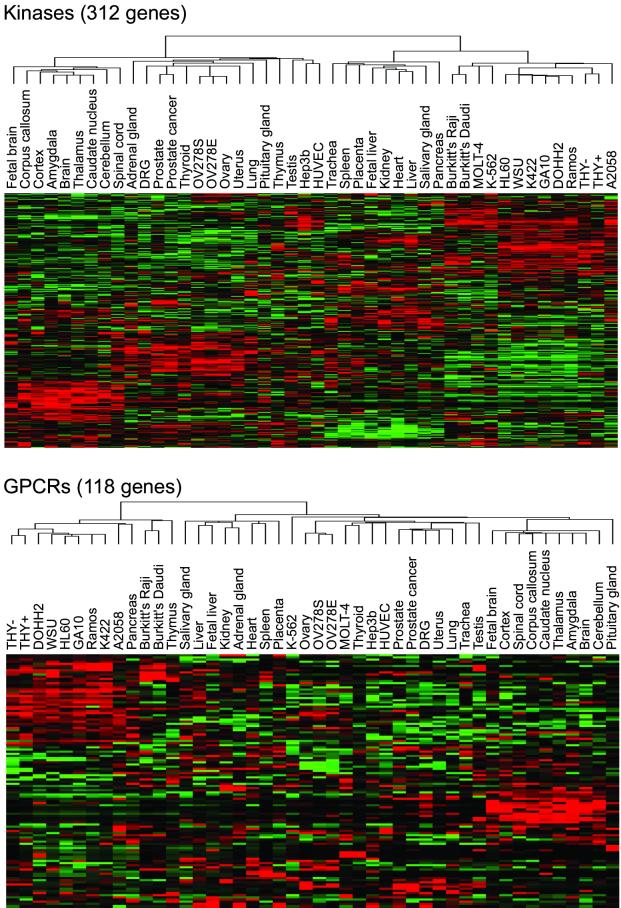
The integration of large-scale expression data with sequence homology-based annotation was used to obtain a more complete description of gene function. Sequence analysis of an uncharacterized protein is commonly used to identify its molecular function (e.g., kinase, protease, and transcription factor). Knowledge of the tissue expression pattern of a gene can complement this annotation by suggesting a physiological function (e.g., homeostasis, development, and proliferation) reflecting the tissues or conditions in which it is expressed. These two methods of gene annotation were integrated by mapping the tissue expression pattern of the genes represented in the database to Pfam, a database of more than 3,000 protein families and domains (6). To illustrate the utility of this approach, we used the gene expression atlas to find differentially regulated members of two large and biomedically important protein families, the G protein-coupled receptor (GPCR) and kinase families. Fig. 2 shows 312 differentially regulated members of the protein kinase family and 118 differentially regulated members of the GPCR family in the human dataset. These families include many orphan receptors and kinases of unknown function. For example, orphan receptors GPR31 and GPR9 showed enriched expression in the pancreas, suggesting a role for these proteins in digestion or hormone secretion. Specific expression patterns of proteins can also be a criterion for selecting therapeutic targets, because the primary effect of modulating their function will likely be restricted to their target tissue. We also used the gene expression atlas to identify candidate protein–protein interaction and enzyme-substrate pairs. For example, we used the gene expression atlas to find a testis-specific GPCR kinase, GPRK2L (16), and fifteen GPCRs that are detectably expressed in testis. We suggest that these GPCRs represent the most likely substrate candidates for GPRK2L. This approach may be generally useful for decoding physiologically relevant biochemical interactions.
Figure 2.
Differential expression of GPCRs and kinases. Pfam was used to identify GPCRs (PF00001, PF00002, and PF00003) and kinases (PF00069, PF00433, PF00454, and PF00625) from the genes interrogated in the gene expression atlas. Data were filtered to remove genes that were not expressed in the atlas (max AD < 200) and not differentially expressed (ANOVA P > 0.05), and the remaining genes were visualized as described previously. The gene identities for these Pfam families, as well as for all Pfam families, can be viewed on the web site (http://expression.gnf.org).
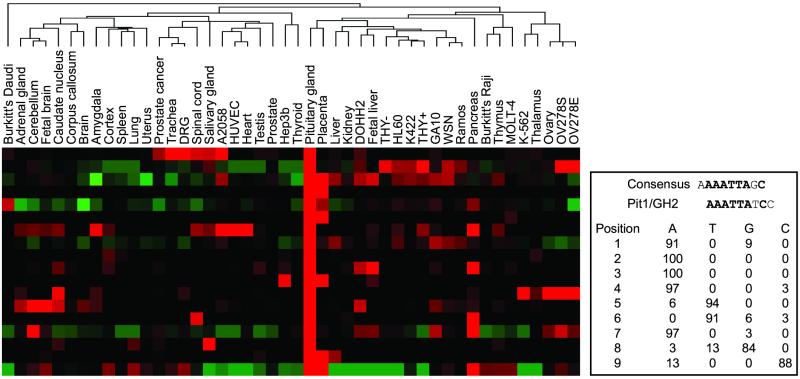
Together with the recent availability of the human genome sequence, coexpressed clusters of genes were used to investigate mechanisms of transcriptional regulation. To illustrate this approach, we identified genes whose expression was enriched in the pituitary gland, a tissue where specific regulation has been previously characterized (17). Twenty-three unique genes were identified, including known growth factors and peptide hormones. Four transcription factors were included in this list, two of which, Pit1 and Pitx2, were previously implicated in the regulation of pituitary-specific gene expression (17). Of these 23 genes, we were able to retrieve 18 promoter regions from the human genome assembly. To identify potential regulatory elements, we used an unbiased word-based methodology previously used in the study of prokaryotes, viruses, yeast, and Arabidopsis (13, 18, 19) to search the promoter regions of these genes for conserved motifs. This process identified a site highly similar to the Pit1 recognition site from the growth hormone 1 promoter that is conserved in 14 of these 18 genes (Fig. 3; ref. 20). Some of these have been previously identified as targets of Pit1, including prolactin, thyroid-stimulating hormone, the glycoprotein α subunit, and Pit1 itself. Several of these genes were unknown as potential targets of Pit1, demonstrating that the general approach of pairing tissue-specific response elements with tissue-restricted transcription factors is likely to yield novel insights into the mechanisms of complex transcriptional regulation.
Figure 3.
Identification of pituitary-specific response elements. The gene expression atlas was used to identify pituitary-enriched genes (Left). Genomic sequence up to 5 kb upstream of the translational start methionine was searched for conserved motifs. On the Right is a potential regulatory element identified in the upstream genomic sequence of the genes in this cluster. This element is similar to a previously described Pit1 binding site from the growth hormone 2 structural gene.
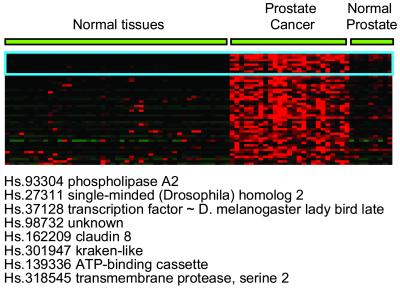
This gene expression atlas was also used to identify potential markers for human disease by comparing transcriptional profiles of pathological samples to the normal transcriptome. Genes with disease-restricted expression are highly desirable both as markers and as pharmacologic targets, because selective expression imparts the specificity required for successful disease-specific targeting approaches [e.g., BCR-ABL and STI571 (21)]. In this study, we identified genes specifically up-regulated in prostate cancer samples that were lowly expressed or absent in other tissues in the database. Proof-of-concept was provided by the identification of several known prostate- and prostate cancer-specific genes including prostate-specific membrane antigen (PSMA), human kallikrien 2 (hK2), and the recently described transmembrane serine protease 2 (TMPRSS2), which although expressed in other body tissues, is most notably expressed in the prostate (Fig. 4; ref. 22). We also discovered genes whose up-regulated expression in prostate carcinoma has not yet been previously described, including the human homologs of the Drosophila transcription factor single-minded, SIM2, and the lady bird late gene, LBX1. In addition, several genes with completely uncharacterized function were identified that are being pursued as potential novel cancer-specific genes. Interrogation of gene expression profiles derived from cancer and other pathological conditions in the context of normal body tissues is likely to return a battery of genes important in understanding disease mechanism and diagnoses. Furthermore, those genes that fall into protein families amenable to pharmacologic perturbation may provide entry points for the design of novel and specific therapeutics.
Figure 4.
Potential markers for prostate cancer were identified by comparing gene expression in normal tissues with normal and tumor prostate samples. Fifty candidate makers are visualized here, and the top eight gene identities are shown.
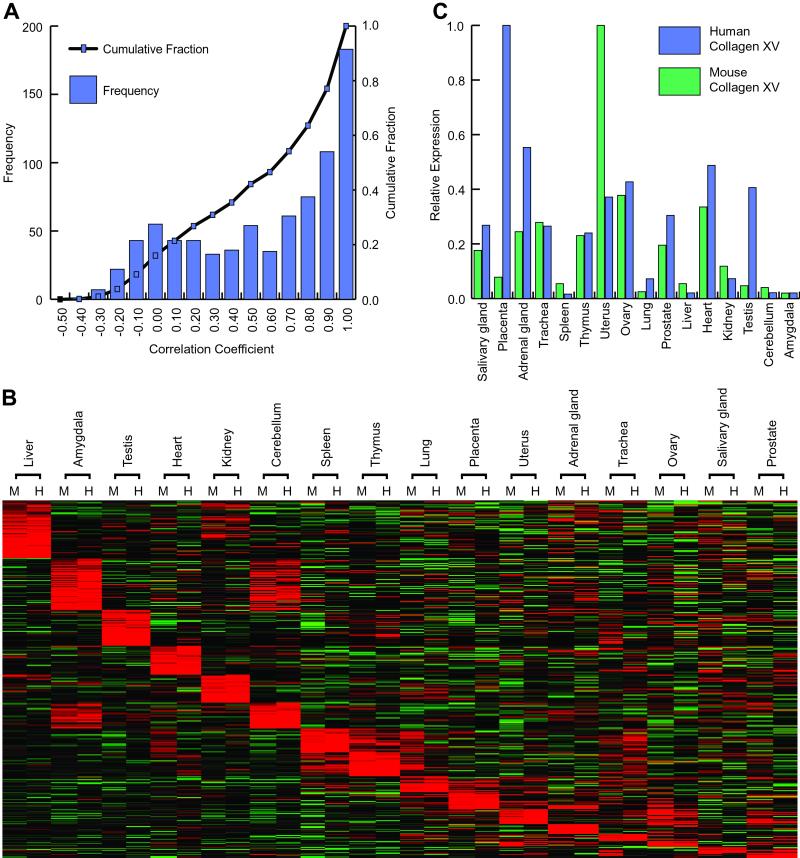
Having access to a substantial portion of the transcriptome from both human and mouse also offered an opportunity to study the comparative transcription between two mammalian species. The increasing importance and use of the mouse as a model organism for human physiology and disease has been bolstered by the extensive sequence homology between the two organisms (http://www.ncbi.nlm.nih.gov/HomoloGene). We would predict that true orthologs would have conserved patterns of mRNA expression reflecting the common physiological function of a gene in mice and humans. Conversely, genes of divergent function may demonstrate protein sequence and mRNA expression divergence between the two species. A set of putative orthologs was identified by searching for mouse and human genes with a common LocusLink symbol, and further restricted for this analysis to genes that showed detectable and differential expression. The expression patterns of these 799 putative ortholog pairs were compared across the 16 tissues in common between our mouse and human datasets. This analysis revealed that half of all mouse and human orthologs have correlation in their expression patterns of 0.6 or better (Fig. 5A). Visualization of these highly correlated transcripts revealed striking similarity in the patterns of gene expression between mice and human (Fig. 5B). Conversely, there were also many examples of low and even negative correlation of expression between the two species. For example, the human extracellular matrix protein collagen XV is most highly expressed in placenta, whereas in mice the putative ortholog is most highly expressed in the uterus (Fig. 5C). Primary sequence comparisons of the mouse and human collagen XV genes revealed that the mouse harbors seven collagenous domains to nine for the human gene (23). In addition, although the conserved C-terminal endostatin domain predicts a role in angiogenesis, inactivation of the mouse structural gene by homologous recombination revealed a normal vasculature (24). Taken in sum, these data support the hypothesis that the physiological role of collagen XV is different between the two species. Thus, expression analysis can supplement primary amino acid sequence homology in ascertaining whether a gene has conserved function between a model organism and the organism it seeks to model.
Figure 5.
Comparison of gene expression for mouse/human ortholog pairs. Putative ortholog pairs between mouse and human genes were identified by LocusLink symbol. (A) Gene expression patterns across 16 tissues for these 799 gene pairs were compared. The distribution of correlation coefficients is plotted. (B) The 427 gene pairs with correlation coefficients greater than 0.6 were sorted by tissue of maximum expression and visualized as described previously. (C) One hundred twenty-eight gene pairs have negative correlation in their gene expression pattern. The expression pattern for collagen XV is shown here. Mouse collagen XV is highly expressed in the uterus, whereas human collagen XV shows highest expression in the placenta.
In conclusion, this significant fraction of the human and mouse transcriptome provides a powerful approach to analyze gene function. The extension of this database with additional samples and more comprehensive gene expression arrays will further increase its utility. We have also created a free and publicly accessible web site (http://expression.gnf.org) that allows researchers to query the mouse and human datasets based on gene name, keyword, protein family, or accession number. Users may also query the data by expression pattern to identify genes present in any tissue or combination of tissues represented in the database. It is our hope that this freely available public resource will enable researchers worldwide to exploit the emerging transcriptome to further biomedical research.
Supplementary Material
Acknowledgments
We thank David Lockhart and Lisa Wodicka for helpful discussions, and Jennifer Villasenor for excellent technical assistance. We also thank Cheng Li and Wing Hung Wong for statistical advice, and Martha Bulyk for helpful comments and suggestions. A.I.S. acknowledges the Achievement Rewards for College Scientists (ARCS) Foundation of San Diego and the La Jolla Interfaces in Science Program for predoctoral support.
Abbreviations
- AD
average difference
- GPCR
G protein-coupled receptor
References
- 1.Lander E S, Linton L M, Birren B, Nusbaum C, Zody M C, Baldwin J, Devon K, Dewar K, Doyle M, FitzHugh W, et al. Nature (London) 2001;409:860–921. doi: 10.1038/35057062. [DOI] [PubMed] [Google Scholar]
- 2.Venter J C, Adams M D, Myers E W, Li P W, Mural R J, Sutton G G, Smith H O, Yandell M, Evans C A, Holt R A, et al. Science. 2001;291:1304–1351. doi: 10.1126/science.1058040. [DOI] [PubMed] [Google Scholar]
- 3.Altschul S F, Gish W, Miller W, Myers E W, Lipman D J. J Mol Biol. 1990;215:403–410. doi: 10.1016/S0022-2836(05)80360-2. [DOI] [PubMed] [Google Scholar]
- 4.Eddy S R, Mitchison G, Durbin R. J Comput Biol. 1995;2:9–23. doi: 10.1089/cmb.1995.2.9. [DOI] [PubMed] [Google Scholar]
- 5.Burks C, Fickett J W, Goad W B, Kanehisa M, Lewitter F I, Rindone W P, Swindell C D, Tung C S, Bilofsky H S. Comput Appl Biosci. 1985;1:225–233. [PubMed] [Google Scholar]
- 6.Sonnhammer E L, Eddy S R, Durbin R. Proteins. 1997;28:405–420. doi: 10.1002/(sici)1097-0134(199707)28:3<405::aid-prot10>3.0.co;2-l. [DOI] [PubMed] [Google Scholar]
- 7.Warrington J A, Nair A, Mahadevappa M, Tsyganskaya M. Physiol Genomics. 2000;2:143–147. doi: 10.1152/physiolgenomics.2000.2.3.143. [DOI] [PubMed] [Google Scholar]
- 8.Miki R, Kadota K, Bono H, Mizuno Y, Tomaru Y, Carninci P, Itoh M, Shibata K, Kawai J, Konno H, et al. Proc Natl Acad Sci USA. 2001;98:2199–2204. doi: 10.1073/pnas.041605498. [DOI] [PMC free article] [PubMed] [Google Scholar]
- 9.Penn S G, Rank D R, Hanzel D K, Barker D L. Nat Genet. 2000;26:315–318. doi: 10.1038/81613. [DOI] [PubMed] [Google Scholar]
- 10.Lockhart D J, Dong H, Byrne M C, Follettie M T, Gallo M V, Chee M S, Mittmann M, Wang C, Kobayashi M, Horton H, Brown E L. Nat Biotechnol. 1996;14:1675–1680. doi: 10.1038/nbt1296-1675. [DOI] [PubMed] [Google Scholar]
- 11.Wodicka L, Dong H, Mittmann M, Ho M H, Lockhart D J. Nat Biotechnol. 1997;15:1359–1367. doi: 10.1038/nbt1297-1359. [DOI] [PubMed] [Google Scholar]
- 12.Sandberg R, Yasuda R, Pankratz D G, Carter T A, Del Rio J A, Wodicka L, Mayford M, Lockhart D J, Barlow C. Proc Natl Acad Sci USA. 2000;97:11038–11043. doi: 10.1073/pnas.97.20.11038. [DOI] [PMC free article] [PubMed] [Google Scholar]
- 13.Hughes J D, Estep P W, Tavazoie S, Church G M. J Mol Biol. 2000;296:1205–1214. doi: 10.1006/jmbi.2000.3519. [DOI] [PubMed] [Google Scholar]
- 14.Welsh J B, Sapinoso L M, Su A I, Kern S G, Wang-Rodriguez J, Moskaluk C A, Frierson H F, Jr, Hampton G M. Cancer Res. 2001;61:5974–5978. [PubMed] [Google Scholar]
- 15.Nagase T, Ishikawa K, Suyama M, Kikuno R, Miyajima N, Tanaka A, Kotani H, Nomura N, Ohara O. DNA Res. 1998;5:277–286. doi: 10.1093/dnares/5.5.277. [DOI] [PubMed] [Google Scholar]
- 16.Sallese M, Mariggio S, Collodel G, Moretti E, Piomboni P, Baccetti B, De Blasi A. J Biol Chem. 1997;272:10188–10195. doi: 10.1074/jbc.272.15.10188. [DOI] [PubMed] [Google Scholar]
- 17.Rosenfeld M G, Briata P, Dasen J, Gleiberman A S, Kioussi C, Lin C, O'Connell S M, Ryan A, Szeto D P, Treier M. Recent Prog Horm Res. 2000;55:1–13. [PubMed] [Google Scholar]
- 18.McGuire A M, Hughes J D, Church G M. Genome Res. 2000;10:744–757. doi: 10.1101/gr.10.6.744. [DOI] [PubMed] [Google Scholar]
- 19.Harmer S L, Hogenesch J B, Straume M, Chang H S, Han B, Zhu T, Wang X, Kreps J A, Kay S A. Science. 2000;290:2110–2113. doi: 10.1126/science.290.5499.2110. [DOI] [PubMed] [Google Scholar]
- 20.Scully K M, Jacobson E M, Jepsen K, Lunyak V, Viadiu H, Carriere C, Rose D W, Hooshmand F, Aggarwal A K, Rosenfeld M G. Science. 2000;290:1127–1131. doi: 10.1126/science.290.5494.1127. [DOI] [PubMed] [Google Scholar]
- 21.Mauro M J, Druker B J. Curr Opin Oncol. 2001;13:3–7. doi: 10.1097/00001622-200101000-00002. [DOI] [PubMed] [Google Scholar]
- 22.Lin B, Ferguson C, White J T, Wang S, Vessella R, True L D, Hood L, Nelson P S. Cancer Res. 1999;59:4180–4184. [PubMed] [Google Scholar]
- 23.Eklund L, Muona A, Lietard J, Pihlajaniemi T. Matrix Biol. 2000;19:489–500. doi: 10.1016/s0945-053x(00)00090-1. [DOI] [PubMed] [Google Scholar]
- 24.Eklund L, Piuhola J, Komulainen J, Sormunen R, Ongvarrasopone C, Fassler R, Muona A, Ilves M, Ruskoaho H, Takala T E, Pihlajaniemi T. Proc Natl Acad Sci USA. 2001;98:1194–1199. doi: 10.1073/pnas.031444798. [DOI] [PMC free article] [PubMed] [Google Scholar]
- 25.Eisen M B, Spellman P T, Brown P O, Botstein D. Proc Natl Acad Sci USA. 1998;95:14863–14868. doi: 10.1073/pnas.95.25.14863. [DOI] [PMC free article] [PubMed] [Google Scholar]
Associated Data
This section collects any data citations, data availability statements, or supplementary materials included in this article.


