

Abstract
Aneuploid epithelial cells are common in breast cancer1,2, however their presence in normal breast tissues is not well understood. To address this question, we applied single cell DNA sequencing to profile copy number alterations (CNAs) in 83,206 epithelial cells from breast tissues of 49 healthy women and single cell DNA&ATAC co-assays to 19 women. Our data shows that all women harbored rare aneuploid epithelial cells (median 3.19%) that increased with age. Many aneuploid epithelial cells (median 82.22%) in normal breast tissues underwent clonal expansions and harbored CNAs reminiscent of invasive breast cancers (gains of 1q, losses of 10q, 16q and 22q). Co-assay profiling showed that the aneuploid cells were mainly associated with the two luminal epithelial lineages, while spatial mapping showed that they localized in ductal and lobular structures with normal histopathology. Collectively, these data show that even healthy women have clonal expansions of rare aneuploid epithelial cells in their breast tissues.
Human breast tissue consists of an intricate network of ducts and lobules that produce and transport milk to nourish offspring during lactation3. The ducts and lobules are comprised of an epithelial bilayer with luminal cells lining the inner layer and basal-myoepithelial cells lining the outer layer. A large-scale study called the Human Breast Atlas (HBCA) Project4 has identified 12 cell types in normal breast tissues, including three epithelial components: luminal secretory/progenitor cells (LumSec), luminal hormone receptor cells (LumHR) and basal-myoepithelial cells (Basal). The epithelial components of breast tissue are a major interest to the biomedical community, since they can give rise to diseases such as breast cancer.
Breast and other normal organ systems have traditionally been assumed to have diploid cells with 23 balanced pairs of chromosomes. In diseases such as cancer, epithelial cells can transform and have aneuploid karyotypes that are acquired through chromosomal rearrangements, however the existence and frequency of aneuploid cells in normal organ systems are not well understood5. Emerging data using targeted deep-sequencing methods have shown that some point mutations in normal tissues can expand, including human eye-lids6, esophagus7, colon8, liver9,10, urothelium11, endometrial12, breast13 and multiple tissues from deceased donors14,15. To increase the sensitivity, these studies utilized LCM8,9,11–13 or performed in vitro expansion of single cells13,14 followed by sequencing to perform CNV calling from normal tissues.
With the development of first-generation single cell DNA sequencing (scDNA-seq) methods, a few studies have started to report on small populations of aneuploid cells in normal tissues5, including the brain16, sperm17, lymphocytes18, colon tissues19 and multiple tissue types20. While pioneering, these studies were generally challenged by low cell numbers and technical noise introduced during whole-genome-amplification (WGA) procedures5,21. From these data it has been difficult to determine the frequency of the aneuploid cells in normal tissues and whether the cells have undergone clonal expansions.
Here, we applied high-throughput scDNA-seq22 and single cell DNA-ATAC co-assays to comprehensively investigate copy number alterations (CNAs) in epithelial cells enriched from a large collection (N=49) of normal breast tissues from the HBCA project4. These data were compared to clinical metadata and copy number data from invasive breast cancers profiled in previous large cohort studies using bulk tissues.
Study overview and data from three women
We obtained viable cell suspensions from 49 healthy women who underwent reduction mammoplasty surgeries in the HBCA project4, along with their clinical metadata (Supplementary Table 1). The cell suspensions were enriched for epithelial cells using EpCAM beads and used to perform nanowell scDNA-seq (n = 49) and scDNA&ATAC-seq co-assays (n = 19) (Fig. 1a and Supplementary Table 2). In total, 83,206 cells were analysed from 49 women. These samples were also embedded to perform spatial transcriptomics (Visium 10× Genomics) profiling (n = 6), histopathological analysis (n = 49) and cytogenetic DNA fluorescence in situ hybridization (FISH) (n = 4).
Figure 1. Study overview and data from an individual woman.

a. Overview of the study design, in which epithelial cells were enriched from viable cell suspensions from normal breast tissues to perform scDNA-seq (n = 49) and scDNA&ATAC-seq co-assays (n = 19). Tissue sections were also prepared and used to perform H&E pathological analysis (n = 49), spatial transcriptomics (n = 6) and DNA FISH cytogenetic experiments (n = 4). b, Representative H&E stained photomicrograph (left), single-cell DNA copy number heat map (middle) and copy number ratio plots (right) of selected aneuploid cells from patient P21. Normal breast tissue morphology was confirmed by examining two H&E slides from P21. Scale bar, 100 μm.
We show representative single-cell copy number data from three women (P21, P18 and P20) of different ages (Fig. 1b and Extended Data Fig. 1). P21 is a 44-year-old woman, in whom 1,649 epithelial-enriched cells were profiled by scDNA-seq and 5.64% were classified as aneuploid (Fig. 1b). Clustering of the aneuploid cells identified a large clonal expansion of cells with both chr1q gain and chr16q loss (59 cells), and smaller expansions of other CNA events (Fig. 1b). The histopathological analysis from P21 showed normal cellular morphology in the haematoxylin and eosin (H&E) sections (Fig. 1b). Similar results were obtained from two other women (P18, 35 years old; P20, 45 years old) in which 1.03% and 4.85% of the epithelial cells were classified as aneuploid, and histopathology showed normal cellular morphology (Extended Data Fig. 1a,b). Collectively, these data, and extra data from 46 women, show that a small fraction of epithelial cells are aneuploid in normal breast tissues and have expanded CNA events.
Copy number events across all women
To identify recurrent CNA events that clonally expanded across different women, we clustered the single-cell CNA data by each woman (Extended Data Fig. 2a). The number of CNA events detected in each woman was enumerated and classified as either expanded CNAs (detected in three or more aneuploid cells) or sporadic CNAs (detected in fewer than three aneuploid cells) (Fig. 2a, Extended Data Fig. 2b and Methods). The number of cells that harboured each specific CNA event was counted irrespective of other CNA events that may have occurred in that given cell. For example, both P17 and P21 harboured expanded aneuploid cells: P21 had 70 cells that showed an expansion of chr1q gain and 73 cells with an expansion of chr16q loss, and P17 had 89 cells with expanded chr1q gain events and 57 cells with expanded chr16q loss events (Extended Data Fig. 2b). In another patient (P18), we identified 14 aneuploid cells, with expanded CNA events including five cells with losses of chr7q and four cells with losses of chr22q, as well as other sporadic CNA events (Extended Data Fig. 2b).
Figure 2. Aneuploid cells in breast tissue from 49 disease-free women and metadata correlations.

a, Top, the frequency of expanded and sporadic CNA events detected in the aneuploid cells from the normal breast tissue from each patient sorted by age. Middle, the frequency of autosomal and chromosome X events sorted by age. Bottom, the proportion of aneuploid cells across the 49 women, sorted by age, showing the frequency of specific CNA events. b, Top, metadata features. Bottom, specific CNA events in women, sorted by age. c, Correlation plots of age compared with the number of CNA events detected per expanded subclones (left) or the proportion of aneuploid cells (right). d, Correlation plots of age compared to the number of expanded events (left) or the number of sporadic events (right). The error bands in c and d represent the 95% confidence interval of the linear regression line. The correlations in c and d were tested by two-sided Spearman’s rank tests.
Across all tissues, the loss of chrX was very frequent in the aneuploid cells (median 8.11%, interquartile range (IQR) 5.16–17.46%) and occurred in most of the women (89.80%) who were profiled (Fig. 2a,b). Autosomal CNA events such as chr1q gain and losses of chr10q, 16q and 22 were also highly prevalent (Fig. 2b) and were clonally expanded in the epithelial cells (Extended Data Fig. 2a). By contrast, other autosomal sporadic CNA events, such as chr8p loss and gains of chr14q and 20p, were detected, but did not clonally expand (Fig. 2b and Extended Data Fig. 2a). We quantified the overall frequency of aneuploid cells in the epithelial compartments across the 49 patients, which showed a range (0.27–20.90%) with a median of 3.19% aneuploid cells detected in each woman (Fig. 2a). In most women, the majority of aneuploid cells harboured expanded CNA events (median 82.67%, IQR 69.43–90.06%), whereas a smaller number of aneuploid cells (median 17.65%, IQR 10.10–32.26%) had sporadic CNA events that did not expand (Fig. 2a). To show that the classification of sporadic CNAs was not due to low cell sampling issues, we performed an association test (P > 0.05, Spearman’s rank), indicating no significant association between sporadic events detection and number of cell sampled (Extended Data Fig. 2c,d).
Metadata correlations
We next investigated the correlation of the aneuploid frequencies in women with different clinical metadata variables (Supplementary Table 1). We first sorted the women by age, which showed that there were a higher number of CNA events and a higher frequency of aneuploid cells in the older women (Fig. 2b). We then performed a correlation analysis for each clinical metadata variable, with the frequency and number of CNA events detected in the cells (Fig. 2c and Extended Data Fig. 3a–f). These results showed that age was the only metadata variable that was significantly correlated in the univariate analysis for both the number of CNA events and the proportion of aneuploid cells (Fig. 2c). We then separated the CNAs into expanded and sporadic events and tested the correlation with age, which showed significant associations with the expanded CNA events (P < 0.05, Spearman’s rank), but not with the sporadic CNA events (P = 0.17, Spearman’s rank) (Fig. 2d). We also tested the correlation between age and the number of autosomal events or chromosome X events, which showed significant associations with increasing age for both groups (P < 0.05, Spearman’s rank) (Extended Data Fig. 3g). Although age was the only significant metadata variable in the univariate analysis, a multivariate analysis also showed that the number of CNA events was significantly associated with metaplasia, ethnicity (African American) and age (Extended Data Fig. 3c). In addition, the multivariate model showed that the increased aneuploid proportion was significantly correlated with ethnicity (Hispanic) and age (Extended Data Fig. 3f). However, none of the other metadata variables (ethnicity, metaplasia), apart from age, was significant in the univariate analysis.
Comparisons to invasive breast cancers
To identify the recurrent CNA events that clonally expand in normal epithelial cells across different women, we clustered the scDNA-seq data from all patients together by the CNA events (Fig. 3a). Next, we sorted the frequency of CNA events across all women (Fig. 3b). These data show that chr1q gain was the most frequent (15.11%) and recurrent CNA event, followed by chrX loss (8.24%), chr16q loss (8%), chr10q loss (4.59%), chr22q loss (4.55%), chr3p loss (4.23%) and chr7q loss (4.08%), in addition to other events. Many of the autosomal CNA events from normal breast tissues were consistent with CNA events reported in invasive breast cancers1,2.
Figure 3. Copy number events in normal tissues associated with breast cancer.
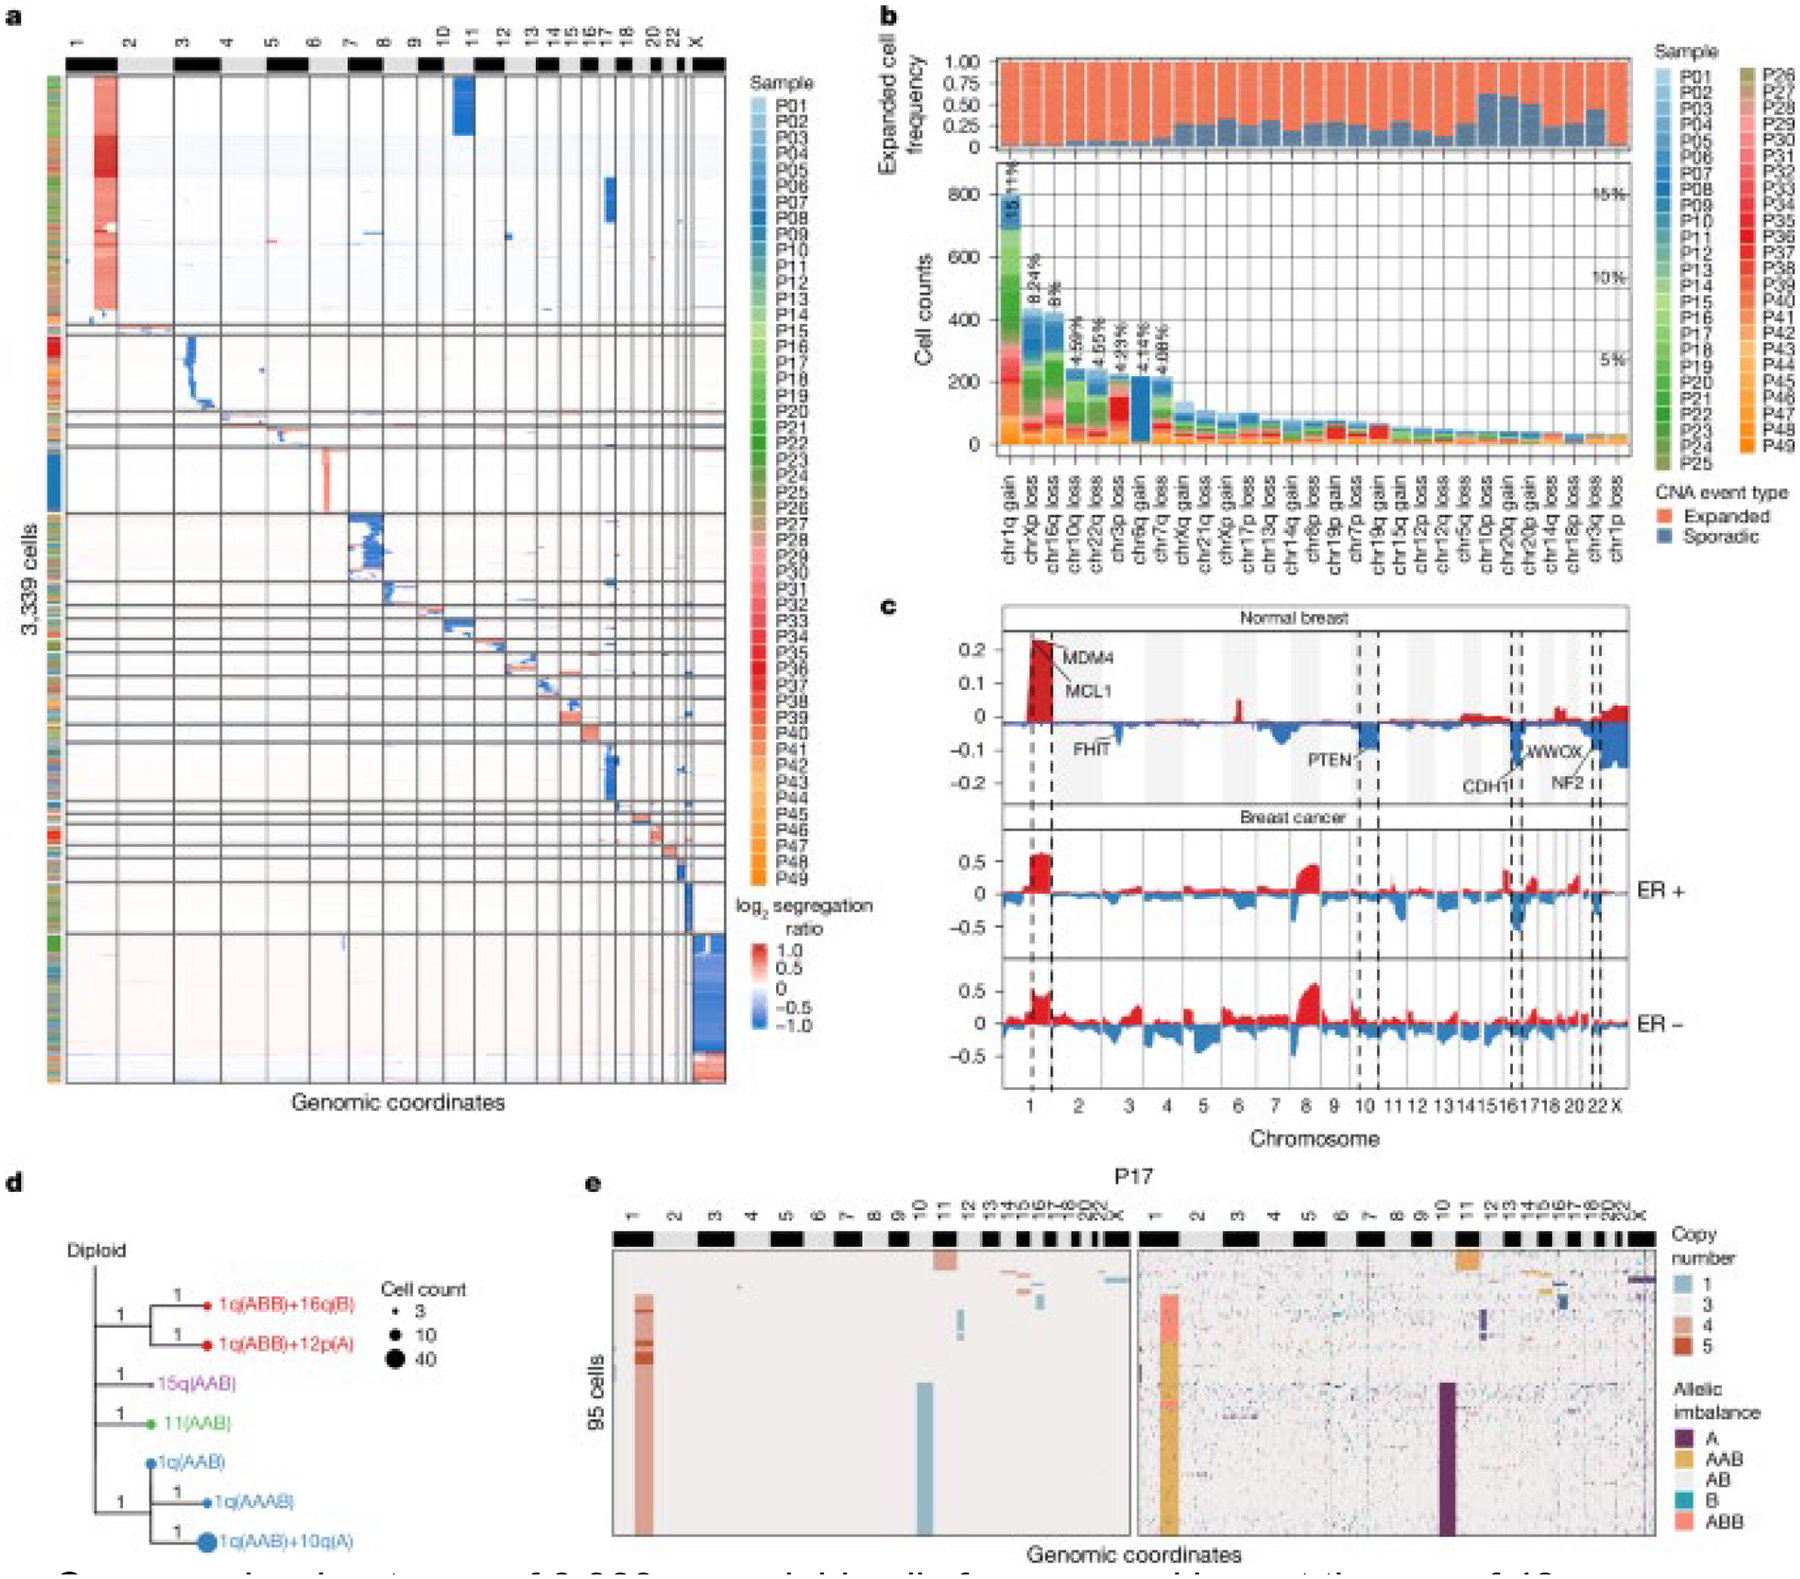
a, Copy number heat map of 3,339 aneuploid cells from normal breast tissues of 49 women clustered by CNA events. b, Top, the frequency of expanded CNA events, compared with sporadic CNA events. Bottom, corresponding bar chart, which shows specific chromosomal events summarized for all 49 women. c, Frequency plot of copy number events in aneuploid cells from normal breast tissues of 49 women, compared with the ER-positive (763 patients) and ER-negative (217 patients) invasive breast cancers from TCGA. d, Minimum evolution tree rooted by a diploid node, constructed from allele-specific copy number profiles of the clonal subpopulations from P17. e, Copy number heat map (left) and allele state heat map (right) of 95 aneuploid cells from P17. A, loss of allele B; AAB, gain of allele A; AB, balanced alleles; B, loss of allele A; ABB, gain of allele B.
To better understand the concordance of CNA events in normal breast tissues, compared with invasive breast cancers, we constructed frequency plots of the normal breast aneuploid cells and bulk data from The Cancer Genome Atlas (TCGA) project2, in which patients were grouped as either oestrogen receptor (ER)-positive (763 samples) or ER-negative breast cancers (217 samples) (Fig. 3c). These data identified a number of concordant CNA events, which were further evaluated for statistical significance; the results showed that normal breast aneuploid cells shared chr1q gain (MCL1, MDM4), chr16q loss (CDH1) and chr22q loss (NF2) with ER-positive breast cancers in TCGA (P = 0.025, hypergeometric test) (Methods). In addition, this analysis also showed statistically significant associations of chr1q gain, chr10q loss (PTEN) and chr16q loss in the normal breast aneuploid cells with ER-negative breast cancers (P = 0.059, hypergeometric test).
Although most chromosomal events in the aneuploid cells from normal breast tissues involved arm-level events, we also identified subchromosomal events on chr3p loss, chr7q loss, 8p loss and chr13q loss that involved variable breakpoints across single cells from different patients and provided an opportunity to identify minimal common regions (MCRs). Using GISTIC223, we identified significant MCRs at chr3p13, chr7q31.2, chr8p22 and chr13q14.2 (Extended Data Fig. 4a), which included genes that were tumour suppressors (FOXP124) and TUSC325) or regulators of cell proliferation (TRIM1326 and CAV127).
We next investigated the co-occurrence of several CNA events in the same aneuploid cells (Methods and Extended Data Fig. 4b). The resulting data showed that chr1q gain occurs frequently together with chr16q loss and chr10q loss (both with a false discovery rate (FDR) < 0.0001, Fisher’s exact test), implying a potentially synergistic interaction of these events that increases the fitness of the expanded aneuploid cells. Notably, the co-occurrence of chr1q gain and chr16q loss was also detected in ER-positive breast cancer (FDR = 0.024, Fisher’s exact), but not in ER-negative breast cancers, suggesting that these events may eventually play a role in the initiation of ER-positive breast cancers.
To understand the chronological order in which CNA events were acquired in the aneuploid cells after they emerged from the diploid cells, we selected five patients for higher-coverage depth sequencing (median 1.14 M reads per cell), to perform allele-specific copy number analysis (Methods and Supplementary Table 3). We compared the read-depth copy number data to the allele-specific copy number data from each patient to identify copy-neutral loss of heterozygosity (CN-LOH) events, which showed that there were no CN-LOH events detected in any of these five patients (Fig. 3e and Extended Data Fig. 4c). Next, we computed a consensus CNA profile from each of the expanded aneuploid genotypes (subclones) using the allele-specific copy number profiles and inferred a clonal lineage tree for each patient using MEDICC228 (Methods). In patient P17, these data showed that the gain of 1q on the A allele (AAB) occurred early and independently of other events, after which the loss of the B allele of chr10q was acquired and led to the expansion of this genotype. In this patient, the gain of chr1q also occurred independently on the B allele (ABB), which co-occurred together with chr16q loss on the A allele and 12p loss on the B allele (Fig. 3d,e). These data show that there was convergent evolution of the 1q gain, through different initiating cells, which led to the independent expansion of different genotypes in the same breast tissue. Similar examples of convergent evolution of allele-specific copy number events were also observed in other patients such as 16q in P21, 10q in P23 and 1q and 10q in P20 (Extended Data Fig. 4c). These lineages also showed that the gain of chr1q often represented one of the earliest events and occurred independent of other chromosomal events in many patients (P17, P20 and P21), after which other events were acquired. However, in some patients (for example P23), the chr1q gain occurred concurrently with 10q and 16q, suggesting that they were acquired simultaneously.
Epithelial lineages of aneuploid cells
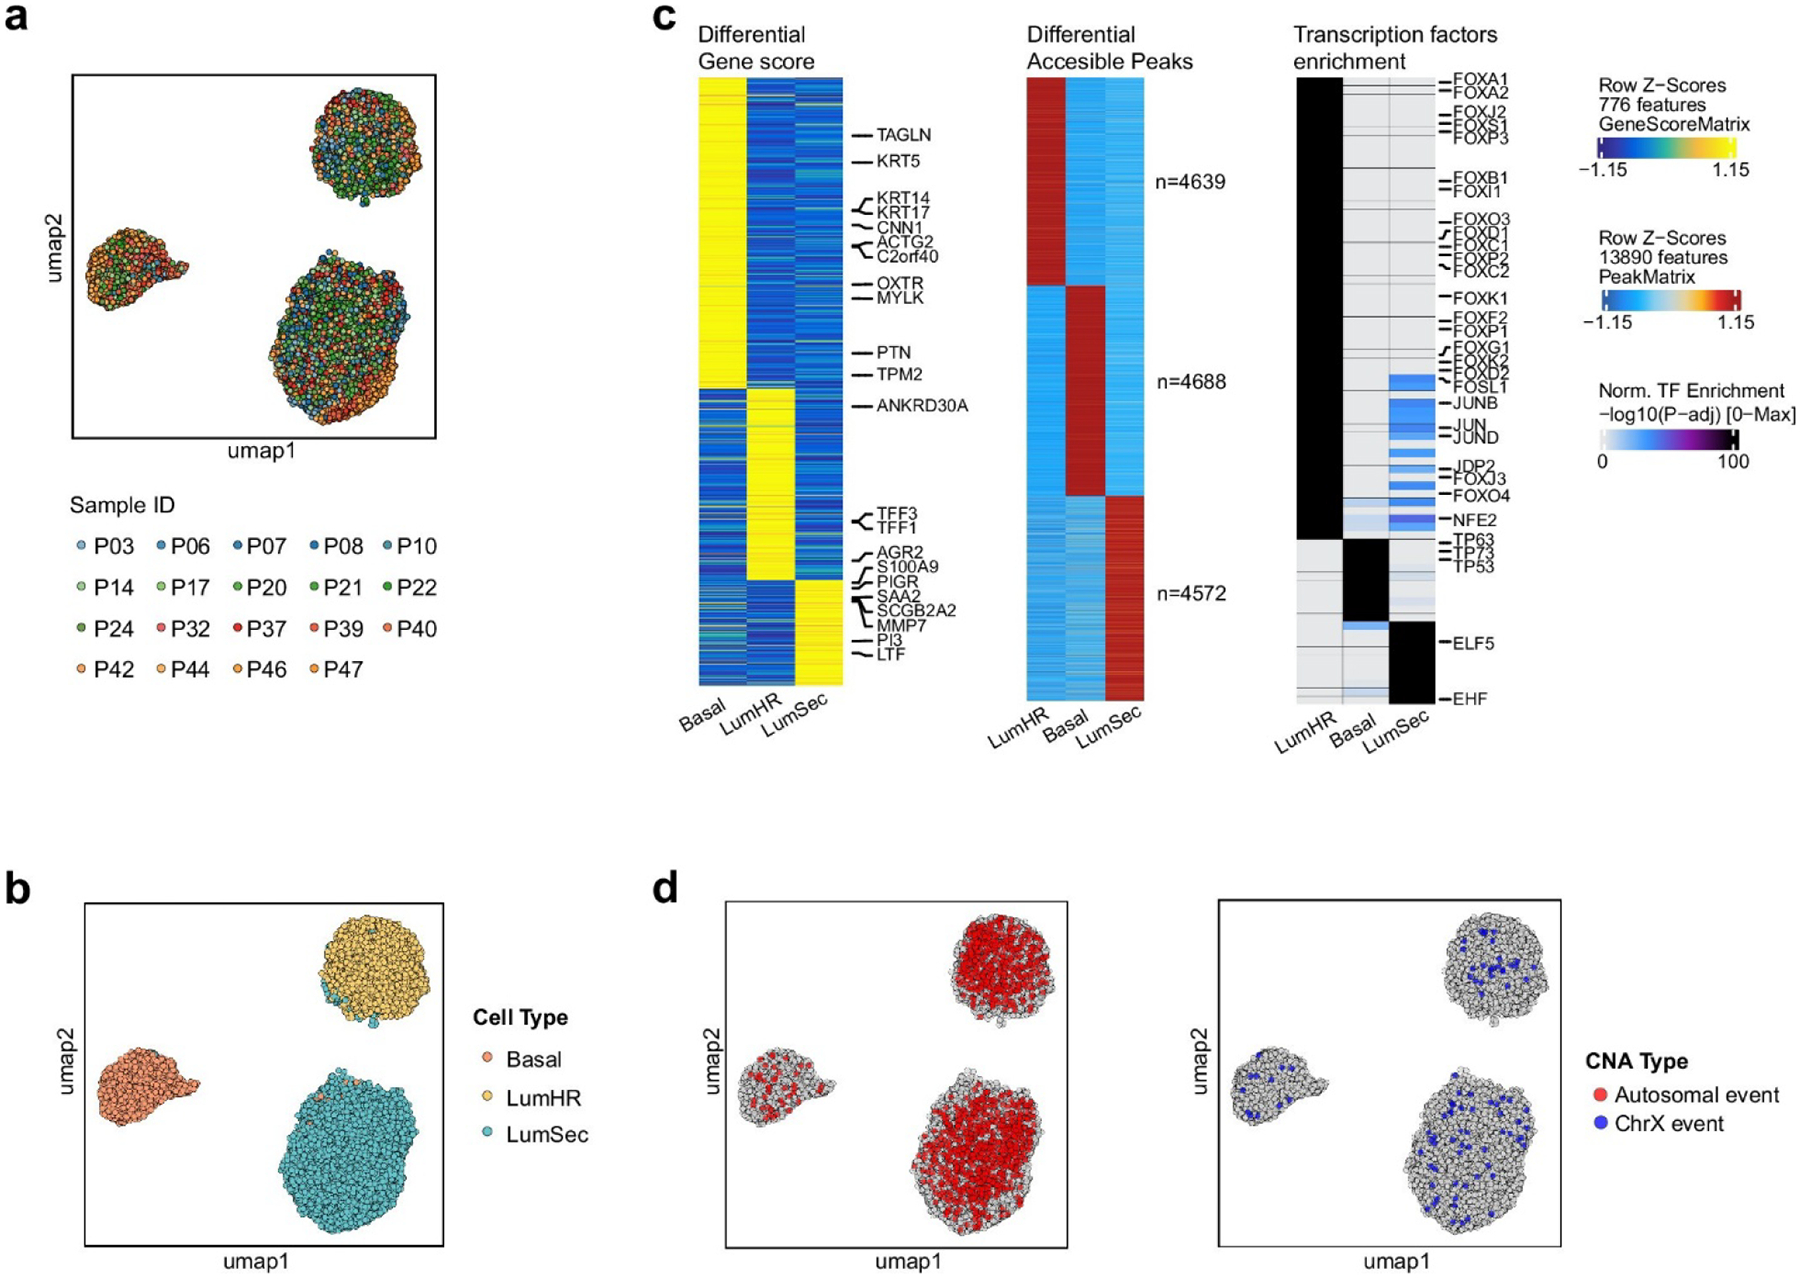
To determine the aneuploid epithelial cell type lineages, we profiled 19 patients using a high-throughput nanowell scDNA&ATAC-seq co-assay29 (Methods and Supplementary Table 4). This approach enabled the direct association of DNA copy number profiles with chromatin accessibility profiles in the same single cells, which was used to distinguish the three epithelial lineages (LumHR, LumSec and Basal) reported in the HBCA project4. In total 38,708 cells were profiled and 31,176 cells passed quality control (Methods). Non-epithelial cells were removed and epithelial cells from different patients were integrated and clustered (Extended Data Fig. 5a,b). The three epithelial lineages were annotated using canonical marker genes from the HBCA project4 (Extended Data Fig. 5c). We also performed a differential accessibility peak (DAP) analysis and transcription factor enrichment analysis using ATAC-seq data, which identified the top transcription factors associated with each epithelial lineage (Extended Data Fig. 5c) and was consistent with a previous scATAC-seq study30.
We mapped the CNA events to their cell type identities from the ATAC-seq profiles. This analysis showed that the autosomal CNAs in the aneuploid cells were present in all three epithelial lineages, but were highly enriched in the two luminal lineages (LumHR and LumSec) and were rare in the basal-myoepithelial lineage (Extended Data Fig. 5d). By contrast, chrX losses were detected at similar frequencies in all three epithelial lineages. A more detailed analysis of individual patients showed that the aneuploid cells that expanded were enriched in the LumSec lineage in some patients (P32, P37 and P40), enriched in the LumHR lineage in other patients (P03, P21 and P47) and were intermixed in the same breast tissues in most patients (Fig. 4a,b and Extended Data Fig. 6a). Furthermore, in most women (with the exception of P46 and P39), few or no aneuploid cells were associated with the basal-myoepithelial lineage (Fig. 4b and Extended Data Fig. 6a).
Figure 4. Epithelial cell lineages of aneuploid cells in normal breast tissues.

a, Left, scDNA&ATAC-seq co-assay data from three patients (P17, P21 and P24) showing uniform manifold approximation and projections (UMAPs) of ATAC-seq profiles of cell types with aneuploid cells coloured by autosomal events or chromosome X events. Right, copy number heat maps of aneuploid cells, with the left annotation bar showing the cell type from the ATAC-seq profiles. Significant genes in aneuploid cells relative to their diploid epithelial cell type reference are shown below (P < 0.05, Wilcoxon rank-sum test). b, Bar plot showing the composition of the epithelial lineages of the aneuploid cells across the 19 samples. c, Top, the copy number frequency plot of single-cell co-assay copy number data from the aneuploid epithelial cells with LumHR ATAC-seq profiles. Bottom, a frequency plot from the patients with ER-positive invasive breast cancer (763 patients) from TCGA. d, Top, the copy number frequency plot of single-cell co-assay data from the aneuploid epithelial cells with LumSec ATAC-seq profiles. Bottom, the frequency plot of patients with ER-negative invasive breast cancer (217 patients) from TCGA. seg., segment.
We next asked how different CNA events from the three epithelial lineages in normal breast tissue corresponded to bulk CNA data from invasive breast cancers in TCGA. We constructed independent frequency plots from the aneuploid cells in normal breast tissues that were detected in the three epithelial lineages and compared these data with the ER-positive and ER-negative invasive breast cancers in TCGA (Fig. 4c,d and Methods). This analysis showed that events such as chr1q gain (MDM4 and MCL1) were present in aneuploid cells from both luminal lineages (LumHR and LumSec) and were also found in both the ER-positive and ER-negative invasive breast cancers in TCGA. By contrast, chr10q loss (PTEN) was found exclusively in the LumSec aneuploid cells in normal breast tissues, consistent with its increased frequency in ER-negative breast cancers. Similarly, chr22q loss (NF2) and chr16q loss (CDH1) were found mostly in the LumHR aneuploid cells in normal breast tissues, consistent with their frequencies in the ER-positive breast cancers. By contrast, the only common CNA event in the basal-myoepithelial lineage was the loss of chr3p (FHIT) (Extended Data Fig. 6b). Further statistical analysis indicated that the CNAs in LumHR aneuploid cells were similar to ER-positive breast cancers (chr1q gain, chr16q loss, chr16p gain and chr22q loss, hypergeometric test, P = 0.001), whereas the CNAs in LumSec cells were more enriched to ER-negative breast cancers (chr1q gain, chr10q loss and chr16q loss, P = 0.01).
To identify specific genes in CNA regions from the epithelial aneuploid cells, we performed differential analysis of the chromatin accessibility data in gene regions and annotated the significant breast cancer genes (Methods and Supplementary Table 5). In the LumHR aneuploid cells, MDM4 and SMYD3 on chr1q were significantly increased (Wilcoxon rank-sum test, FDR < 5.4 × 10⁻⁴), whereas CDH1 and WWOX on chr16q (FDR < 1.6 × 10⁻³) were significantly decreased (Extended Data Fig. 6c,d), in addition to other significantly altered genes (Supplementary Table 5). In the LumSec aneuploid cells, the ATAC-seq signals of MCL1, MDM4, SHC1, CKS1B and SMYD3 on chr1q were significantly increased (FDR < 3.4 × 10⁻⁵), whereas PTEN and FGFR2 located on chr10q were significantly decreased (FDR < 0.018), in addition to other genes (Extended Data Fig. 6c,e). These data identify specific genes with differences in chromatin accessibility that may contribute to the expansion of the aneuploid cells in normal breast tissues.
Spatial mapping of aneuploid cells
To resolve the spatial organization of the aneuploid epithelial cells in normal breast tissues and investigate their nuclear and cellular morphology, we performed spatial transcriptomics (10× Genomics; Methods). We profiled normal breast tissue samples from six women that were previously analysed using scDNA-seq (Supplementary Table 6). From these data, we inferred copy number profiles from the RNA read counts using CopyKAT31 and identified spots that contained aneuploid cells (Methods). We then used a label transfer approach32 to annotate cell types detected in scRNA-seq data from the HBCA project4 in our spatial transcriptomics data. The resulting data showed that spots with CNAs in focal regions of the H&E tissue sections were localized to epithelial structures, including ducts, lobules and terminal ductal lobular units (TDLUs) (Fig. 5 and Extended Data Figs. 7 and 8).
Figure 5. Spatial organization of aneuploid cells in normal breast tissues.

a, Copy number heat maps inferred from spatial transcriptomics spot data using CopyKAT for patient P32. b, Predicted cell types overlayed on the H&E stained image. c, Predicted aneuploid spot annotations overlayed on the H&E stained image of the tissue section. d, Spatial H&E stained image and representative photomicrographs of normal breast tissue morphology were confirmed by examining the aneuploid regions of the H&E tissue section. e, Representative DNA cytogenetic FISH images of chr1q gain, chr10q loss and diploid cells. FISH results were obtained from imaging 25 areas at ×60 magnification. Probes coloured in green targeted chr1q (MDM4) and chr10q (PTEN). Control probes, coloured in red, targeted chr1p and chr10p. Scale bars, 1 mm (b–d), 0.2 mm (d, insets), 5 μm (e).
In patient P32, the CopyKAT data identified a single cluster of spots with chr1q gain and chr10q loss that was associated with a LumSec expression program (Fig. 5a–c). The aneuploid spots mapped to a single focal lobular/TDLU region in the H&E tissue section with normal tissue architecture and nuclear morphology (Fig. 5d). In another woman (P20), the CopyKAT analysis identified a cluster of spots with chr1q gain that was associated with the LumSec expression cluster (Extended Data Fig. 7a). The spots mapped to two ductal regions and one TDLU region with normal cellular morphology and histopathology (Extended Data Fig. 7b). Similar results were found in the normal breast tissues from four other women (Extended Data Figs. 7 and 8). In addition to the spatial transcriptomics analysis, we performed cytogenetic DNA FISH experiments in the same normal breast tissues from four women using targeted probes for chr1p, 1q, 10p and 10q. These data further validated the spatial transcriptomics and scDNA-seq results, showing the presence of aneuploid cells in the epithelial structures of normal breast tissues with 1q gain and 10q loss (Fig. 5e and Extended Data Fig. 8c).
Discussion
Here we report that a median of 3.19% of the epithelial cells in normal breast tissues are aneuploid and that many of these cells (median 82.67%) have expanded CNAs. We found that many of the CNA events in these cells are commonly found in invasive breast cancers. Our results are unexpected in normal breast tissues from healthy women, which have traditionally been assumed to have diploid karyotypes. Furthermore, our metadata show that a woman’s age is significantly correlated with the frequency of aneuploid cells and number of CNA events. These data are consistent with studies of somatic mutations in normal tissues, which accumulate with age8,10,12,13, as well as epidemiology studies showing that a woman’s age is a strong risk factor for developing invasive breast cancer33. However, all of the women in this study had no evidence of breast cancer, suggesting that aneuploidy also occurs at low frequencies in normal breast tissues for most disease-free women.
In the aneuploid cells, we found that gains of chromosome 1q and loss of 10q, 16q, 22 and X were frequently expanded. The loss of the X chromosome allele in somatic cells from women is not entirely unexpected, because one X allele is inactivated by XIST in female tissues and the loss of the inactivated allele would have minimal phenotypic impact on the cells, as other studies have reported34. Furthermore, the loss of chromosome X is unlikely to play an important role in breast cancer progression because there are no known breast tumour suppressor genes on this chromosome.
By contrast, many of the expanded autosomal CNA events in the aneuploid cells from normal breast tissues were consistent with the most frequent CNAs reported for invasive breast cancers in TCGA2. Our data suggest that, by acquiring these cancer-associated CNA events, the epithelial cells may have increased their fitness, enabling them to expand in the normal tissues, in contrast to the sporadic events. Alternatively, these CNA events may not be tolerated well in specific epithelial lineages, leading to their neutral expansion over time. In contrast to breast cancers, CN-LOH was not observed in any of the aneuploid cells from the normal breast tissues. In addition, we found that many of the expanded CNAs arose from different parental alleles, which is consistent with convergent evolution, in which different ancestral cells gave rise to independent expansions. These data contrast with invasive breast cancers, for which clonal origins are always reported35,36,37.
Although most of the frequent chromosomal gains (1q) and losses (10q, 16q and 22) in the normal breast tissues were arm-level events, previous studies have identified specific genes in these regions that are associated with breast cancer. On chromosome 1q, the MDM4 gene can bind to TP53 to inhibit its transcriptional activity when overexpressed38. On chr10q, the tumour suppressor gene PTEN has been shown to regulate cell growth and proliferation, when lost in invasive breast cancers39. On chr16q, the epithelial cadherin gene CDH1 is frequently lost in lobular carcinomas and can lead to invasive properties40. Furthermore, on chr22, the neurofibromatosis gene, NF2, acts as a tumour suppressor in invasive breast cancers41. Notably, our data are consistent with another study that identified copy number changes in chr1q and 16q in matched normal tissues from patients with breast cancer13. However, other common CNA events in invasive breast cancers, such as chr8q gain (MYC and FGFR1), 17p amplification (ERBB2) and chr13 loss (RB1 and BRCA2) were not detected in the normal breast tissues, suggesting that more CNA events may be required for malignant transformation.
Our data also provides insights into the epithelial cell of origin of the aneuploid cells and shows that both luminal lineages (LumHR and LumSec) are represented, often as intermixtures in the same tissues. Although chr1q gain was observed in both epithelial lineages, other events, including 16q loss and 22 loss, expanded in the LumHR lineage, and chr10q loss expanded in the LumSec lineage. We found that aneuploid cells with markers of the LumHR lineage had CNA events that were similar to ER-positive breast cancers, whereas the aneuploid cells with a LumSec lineage had CNA events consistent with ER-negative breast cancers. By contrast, we observed very few aneuploid cells and CNA events in the basal-myoepithelial cells from normal breast tissues. On the basis of this data, we speculate that ER-positive and ER-negative breast cancers may emerge from different luminal epithelial lineages in normal breast tissues.
An important future direction is to determine whether increased frequencies of aneuploid epithelial cells or CNA events in normal breast tissues are correlated with an increased risk of developing invasive breast cancer. Another future direction will be to determine whether high-risk breast tissues (for example, BRCA1 or BRCA2 germline carriers) also have increased levels of aneuploid epithelial cells. An initial study on this topic investigated a small number of patients using first-generation scDNA-seq methods42. In addition, the intrinsic cellular mechanisms or environmental factors that give rise to aneuploid epithelial cells remain unknown and will require functional models to be studied. One notable limitation is that we did not measure point mutations, which was not technically feasible in the sparse scDNA-seq data. Another limitation is that we could not accurately study the expansion rates of the aneuploid cells and fitness of the CNA events, which would require several time points.
In closing, our study shows that most healthy women harbour rare populations of aneuploid epithelial cells with CNA events in their breast tissue that expand and accumulate with age. We expect that these rare aneuploid cells are not restricted to breast tissues, and may also exist in other normal organ systems that can be investigated using a similar framework. Future work in this area will undoubtedly lead to new insights into cancer initiation and begin to address the fundamental question of when a cancer is really a cancer.
Methods
Experimental Methods
Tissue Sample Collection
Fresh breast reduction mammoplasty tissues were collected from disease-free women at the Baylor College of Medicine Hospital and St Luke’s Medical Center. The study was approved by the Institutional Review Boards at the MD Anderson Cancer Center (PA17–0503) and Baylor College of Medicine (H-46622). All women were consented under a protocol approved by the institutional review board, with consent for publication of data. At the time of collection, samples were analysed by a pathologist and incidental tissues with pre-cancer diagnosis, such as atypical ductal hyperplasia or ductal carcinoma in situ, were excluded. Fresh reduction mammoplasty tissue samples were transferred in sterile Dulbecco’s Modified Eagle Medium (DMEM) (Sigma, D5796) on ice until processing. Breast tissues were partitioned for optimal cutting temperature embedding (OCT), formalin-fixed, paraffin-embedded block embedding (FFPE) and fresh viable single-cell dissociation, as described below.
Breast tissue dissociation
Fresh breast tissues were collected and processed within 2 hours of surgery. The tissue dissociation was performed as previously reported4. Briefly, dissociation buffer was prepared freshly: collagenase A (1 mg ml−1 working solution, Sigma, 11088793001) dissolved in DMEM F12/HEPES media (Gibco, 113300) and bovine serum albumin (BSA) fraction V solutions (Gibco, 15260037) mixed at a 3:1 ratio. Breast tissues were minced with 2 ml of dissociation solution. Next, the minced tissues were transferred into 50 ml tubes with a further 40 ml of dissociation solution, then incubated at 37 °C for 2–16 h for complete tissue digestion. The pellet was collected by 5 min of 500g centrifuging then resuspended in 5 ml of trypsin (Corning, catalogue no. 25053CI) and incubated at 37 °C for 5 min with rotating. Trypsin was neutralized with 10 ml of DMEM containing 10% heat inactivated fetal bovine serum (FBS) (Sigma, F0926). The cell suspension was filtered through a 70 μm strainer (Falcon, 352350) and then centrifuged at 500g for 5 min to remove supernatant. Red blood cells in the pellet were nutated by 20 ml of 1× MACS red blood cell lysis buffer (MACS, 130-094-183) incubating at room temperature for 10 min. Red blood cell lysis was stopped by 20 ml of DMEM and then centrifuged at 500g for 5 min. The cell pellet was washed by 10 ml of cold DMEM and then cryo-stored in 10% dimethylsulfoxide/90% FBS medium at −80 °C until the cells were used for the single-cell sequencing assays.
Epithelial cell enrichment from breast tissues
Cryo-stocked suspensions of 3 × 10⁵–1 × 10⁷ viable cells were thawed in a 37 °C water bath for 5 min, then transferred to 5 ml of DMEM and centrifuged at 4 °C, 600g for 5 min to obtain cell pellets. The cell pellet was resuspended in 100 μl of wash buffer (Hanks’ Balanced Salt Solution no. Phenol Red (Gibco, 14025–076) with 10 mM HEPES (Gibco, 15630–80), 2% FBS) and put into 5 ml polystyrene round-bottom tubes. EasySep EpCAM Selection Kit (Stemcell, 17846) was used for epithelial cell isolation by immunomagnetic positive selection. Next, 10 μl of Selection Cocktail, from the above kit, was added to the cell suspension. Cells and the cocktail were gently mixed by pipetting, then incubated on ice for 20 min. To obtain evenly dispersed magnetic particles, RapidSpheres was vortexed thoroughly for 30 s before adding to the samples. Then 7.5 μl of RapidSpheres was added to the cell suspension, gently mixed and incubated on ice at 4 °C for 15 min. To wash out the EpCAM-negative cells, 2.3 ml of wash buffer was added to the sample, then mixed by gently pipetting. The tube was placed into the EasySep magnet (Stemcell, 18000) and incubated at room temperature for 5 min. The supernatant was removed, and epithelial cells were isolated with the magnetic beads on the wall of the tube. The cells were washed three times then resuspended in 0.04% BSA in phosphate-buffered saline (PBS) on ice before the cells were used.
High-throughput scDNA nanowell sequencing
The scDNA library was prepared as described in our previous study22. Briefly, 1 × 10⁵ cells were lysed by 50 ul of NST-DAPI buffer (800 ml of NST (146 mM NaCl, 10 mM Tris base at pH 7.8, 1 mM CaCl2, 21 mM MgCl2, 0.05% BSA and 0.2% Nonidet P-40), 200 ml of 106 mM MgCl2 and 10 mg of DAPI). The isolated nuclei were resuspended in 0.5× Dulbecco’s PBS to a concentration of 40 cells ul−1, then micro-dispensed into a nanowell chip using the ICELL8 cx system (Takara Bio), followed by centrifugation at 1,000g for 5 min at 4 °C. The chip was scanned and imaged under DAPI/blue channel, then wells containing single nuclei were identified using CellSelect Software (Takara Bio) for subsequent reagent dispensing steps. All reagents were set 35 nl per well for micro-dispensing. The chips was centrifuged at 1,000g (before lysis) or 3,000g (after lysis) at 4 °C after each dispensing step. First, lysis buffer (0.136 AU ml−1 protease (QIAGEN, 1021055), 30 mM Tris-HCl, pH 8.0, 5% Tween and 0.5% TritonX-100) was dispensed into the selected wells to lyse the nuclei. The nanowell chip was then incubated at 59.7 °C for 5 s, 54.5 °C for 30 min, 79 °C for 11 s and 75.3 °C for 15 min, and then held at 4 °C. Next, tagmentation mixture containing 144 μl of 2× tagment DNA (TD) buffer and 16 μl of tagment DNA enzyme 1 (TDE1) (Illumina, 20034198) was dispensed into the selected wells and the chip was incubated at 59.7 °C for 5 s and 54.5 °C for 10 min. The tagmentation reaction was neutralized by dispensing the mixture of neutralization regents and first index (72 different index1). The neutralization mix for each index was prepared as previously described using 10 μl of 5× Kapa HiFi Fidelity buffer, 1.6 μl of 25 mM deoxynucleotide triphosphate, 1 μl of 0.5 M EDTA, 6.4 μl of H2O and 1 μl of 100 μM polymerase chain reaction (PCR) forward primers with index S5XX: AATGATACGGCGACCACCGAGATCTACACXXXXXXXXTCGTCGGCAGCGTC, where XXXXXXXX represents an 8 bp index sequence). The chip was centrifuged and incubated at 54.9 °C for 5 s and 49.4 °C for 30 min, then held at 4 °C. The second index (72 different index2) mix was dispensed, which contained 10 μl of 5× Kapa HiFi Fidelity buffer (Roche, K2502), 0.348 μl of 1 M MgCl2, 8.652 μl of H2O and 1 μl of 100 μM PCR reverse primers with index N7XX: CAAGCAGAAGACGGCATACGAGATXXXXXXXXGTCTCGTGGGCTCGG, where XXXXXXXX represents an 8 bp index sequence. To amplify the DNA library, a PCR master mixture consisting of 40 μl of 5× Kapa HiFi Fidelity buffer, 40 μl of Kapa HiFi HotStart DNA Polymerase (Roche, KK2502, 1 U μl−1) and 120 μl of H2O was dispensed into the selected chip wells and the nanowell chip was incubated using the following PCR cycles: 72.1 °C for 8 min; 99.6 °C for 30 s; 12 cycles of 99.6 °C for 20 s, 57.5 °C for 5 s, 62.7 °C for 30 s and 72.1 °C for 1 min; 72.1 °C for 2 min; and 4 °C hold. The PCR product was then collected and purified with 1.8× Ampure XP beads (Beckman, A63881), followed by DNA trace analysis quality control and quantitative PCR. The library was then sequenced around 300,000 reads to target 0.005× coverage depth per cell using the Illumina platform (NextSeq2000, NovaSeq6000) with 8 bp dual-indexed.
High-throughput scDNA&ATAC co-assay sequencing
scDNA&ATAC-seq co-assay profiling was performed as described in another study29. We lysed 8 × 10⁵ cells using 100 μl of chilled ATAC lysis buffer (10 mM pH 7.4 Tris-HCL, 10 mM NaCl, 3 mM MgCl2, 0.1% Tween-20, 0.1% Nonidet P-40, 0.01% digitonin and 1% BSA) for 4 min on ice and then washed with 1 ml of chilled wash buffer (10 mM pH 7.4 Tris-HCL, 10 mM NaCl, 3 mM MgCl2 and 0.1% Tween-20). The isolated nuclei were resuspended in 30 μl of PBS and then added to 72 μl of prepared tagmentation master mix (50 μl of 2× TD buffer, 2 μl of 0.5% digitonin, 10 μl of Tn5 and 10 μl of H2O). Tagmentation was performed on thermomixer for 30 min at 850 rpm, at 37 °C. After tagmentation, the nuclei were washed and diluted to a concentration of 40 cells per microlitre, then micro-dispensed into a nanowell chip using the ICELL8 cx system (Takara Bio), followed by five dispensing steps as described in the above DNA&ATAC-seq co-assay study, including lysis, tagmentation, neutralization, index dispensing and library PCR. The PCR products from these reactions were mixed with both DNA and ATAC-seq libraries. The ATAC-seq library was further enriched from the purified PCR product using ATAC-seq library-specific primers. Both libraries were sequenced using NextSeq2000 Illumina with 11 bp dual-indexed sequencing.
Spatial Transcriptomic profiling
Spatial transcriptomics was performed as described in the Visium manufacturer’s protocols (10× Genomics), with minor modifications. Specifically, fresh breast tissues from three patients were embedded in Cryomolds with optimal cutting temperature compound (Thermo Fisher Scientific, NC9542860 and 1437365) over dry ice and stored at −80 °C until cryo-sectioning. The 12 μm tissue sections were prepared on a cryomicrotome (CryoStar NX70, Thermo Fisher Scientific) at preset chuck and blade temperatures of −17 °C and −15 °C, respectively. The tissue section was placed within the capture area of the Visium spatial slide (10× Genomics PN-1000184). Sectioned slides were fixed by methanol and stained by H&E, as detailed by the manufacturer (10× protocol no. CG000160). Imaging was performed on the Nikon Eclipse Ti2 system under the imaging guidelines (10× protocol no. CG000241). The slides’ permeabilization time was set to 12 min in accordance with the manufacturer’s tissue optimization protocol (10× protocol no. CG000238). The final libraries were constructed following the user guide (10× protocol no. CG000239) and sequenced on the Illumina next-generation sequencing system (NovoSeq6000) using the S2–100 flow cell.
Fluorescence in situ hybridization (FISH)
FFPE tissues were sectioned at 5 μm and incubated at 60 °C overnight and then dewaxed in three changes of Hemo-D, at 5 min each. The slides were then dehydrated in two changes of 100% ethanol, 1 min each, and exposed to pre-treatment solution (Life Technologies) at 80 °C for 15 min. They were washed with distilled water, dried and treated with enzymatic reagents (Life Technologies) at room temperature for 15–20 min. FISH was performed on the above tissues using chr1q (MDM4), ctrl-chr1p (CDKN2C), chr10q (PTEN), ctrl-chr10p (GATA3) probes (Empire Genomics). Slides were hybridized with the FISH probes in accordance with the manufacturer’s instructions (Empire Genomics), with slight modifications. Briefly, 2 μl of each of the probes was mixed with 8 μl of the in situ hybridization buffer. The probe was applied on the slide, covered with a glass coverslip (22 × 22 mm) and sealed with rubber cement. The slides were then denatured at 72–73 °C using a ThermoBrite system (Abbott Laboratories) and incubated at 37 °C overnight. The slides were then washed using 2× saline-sodium citrate at 45–70 °C for 1–2 min, counterstained with DAPI and analysed using a Nikon 80i microscope using the green and orange fluorescent channels. The copy number states of each probe were then counted manually across several imaging fields for each experiment.
Computational Methods
scDNA-seq copy number analysis
Sequencing reads were demultiplexed into single-cell FASTQ files using bcl2fastq (v.2.20.0.422). Reads are aligned to hg19, and duplicates were marked following a previously published pipeline (https://github.com/navinlabcode/CNV_pipeline)36. Cells from 31 patients were processed together using CopyKIT (v.1.0.1)43. Briefly, reads were counted at 220 kb bin genomic resolution and segmented using the CopyKIT default parameter ‘CBS’. Diploid cells were detected using findAneuploidCells() without simulation (remove_XY = F, simul = F). Single-cell quality metrics were calculated using runMetrics() and cells with more than 15 breakpoints were excluded. Low-quality cells were identified and filtered out using the following two criteria: (1) cells with segment ratios within 0.7–1.3 in every bin and (2) cells marked as outliers by findOutliers() with a resolution of 0.7. Segment ratio profiles of remaining non-diploid cells were embedded into reduced dimensions by runUmap() and clustered by findClusters() using default parameters. Samples classified as outliers (‘c0’) were excluded and copy number events of each cluster were labelled at the chromosome-arm level. Integer copy numbers were calculated using calcInteger() with the method = ’fixed’, ploidy_value = 2.
Allele specific copy number inference
We selected five samples with more than 50 aneuploid cells and expanded events, and sequenced them at a higher depth (median 1.14M reads per cell; Supplementary Table 3). FASTQ files of the diploid cells identified in the previous total copy number analysis were merged to create a high-depth pseudo-bulk normal profile of the sample, from which haplotypes were called using SHAPEIT44 against a reference panel from the 1000 Genomes Project (ALL_1000G_phase1integrated_v3). Next, genotypes were called using Cellsnp-lite45 from each aneuploid single cell, and the read counts were summarized to the inferred haplotype blocks. Finally, the allele-specific copy numbers were inferred by SIGNALS46 (mincells = 3, maxCN = 4) using total copy number and haplotype counts as input.
Phylogeny inference
The minimum evolution tree for each patient was constructed using fastme.ols() from the R package ape (v.5.6.2) with the MEDICC2 (ref. 28) minimum event distance matrix, which was calculated based on the consensus allele-specific copy number profile of events that occurred in more than two cells.
scDNA&ATAC-seq co-assay data processing
DNA and ATAC-seq reads were demultiplexed and separated into single-cell FASTQ files using bcl2fastq (v.2.20.0.422) by matching cell barcodes and modality barcodes. DNA reads were aligned to hg19 and processed following the scDNA-seq copy number analysis above. ATAC-seq reads were aligned to hg19 using Bowtie2 (ref. 47) with the options --local, --very-sensitive-local, --no-unal, --no-mixed, --no-discordant, --phred33 -I 10 -X 700 -p 50. Quality control and downstream analysis were implemented by ArchR48. Low-quality cells with a transcription start site enrichment score of less than 6 or more than 30 and a number of fragments of less than 1,000 or greater than 50,000 were excluded. Doublets were predicted by addDoubletScores() and the maximum ratio of predicted doublets to pass-filter cells was set to 4.
Identifying cell types from ATAC-seq data
scATAC-seq profiles were embedded into reduced dimensions by iterative latent semantic indexing (LSI)49 and cells from different samples were integrated using Harmony50. Graph-based clustering was performed by scran51 with k = 5. Gene scores were imputed by addGeneScoreMat() from ArchR and marker genes for each cluster were tested by Wilcoxon rank-sum test using the normalized gene score matrix towards transcription start site enrichment and number of fragments. Non-epithelial subpopulations were excluded from the analysis using the canonical marker genes from the HBCA project4. Cell type specific marker genes and gene score comparisons between aneuploid and diploid cells were performed using the Wilcoxon rank-sum test, with P values adjusted using Benjamini–Hochberg method (FDR). Significantly expressed marker genes for each cluster were selected by the following cutoffs: FDR less than or equal to 0.01 and log2 fold change greater than or equal to 1.25.
Identifying differentially expressed genes associated with CNA events
We first identified CNA events with more than 100 cells in a specific epithelial subpopulation and included four subgroups in the test: chr1q in LumSec and LumHR, chr10q in LumSec and chr16q in LumHR. Next, for each of the subgroups we performed a Wilcoxon rank-sum test on the inferred gene score of the genes located on the chromosome arm with CNAs, comparing gene scores from cells with CNAs with gene scores from diploid cells within an epithelial subpopulation. P values were adjusted using FDR. Significant differentially expressed genes were reported using the threshold of FDR less than 0.05.
Identifying differentially accessible peaks of chromatin
We first identified the reproducible peaks that were detected in at least three cells from each of the epithelial subpopulation using addReproduciblePeakSet() from ArchR48. Then we performed a two-sided Wilcoxon test on the normalized fragment count data getMarkerFeatures() and corrected the P values using the Benjamini–Hochberg method (FDR). Significant DAPs were reported by the following thresholds: FDR less than 0.01 and average log2 fold change greater than 1.25.
Transcription factor motif enrichment in differential chromatin peaks
We created a binary matrix where the presence of a transcription factor motif in each peak is indicated numerically in each cell using addMotifAnnotations() from ArchR48. Then, we performed hypergeometric enrichment of each transcription factor motif within the differential peaks of each cell type using peakAnnoEnrichment() and corrected the P values using the Benjamini–Hochberg method (FDR). Significantly enriched transcription factors for each cell type were reported by the thresholds FDR less than 0.01 and average log2 fold change greater than 1.25. We then overlapped the significantly enriched transcription factors with the cell type specific transcription factors from a previous scATAC-seq study of normal breast tissues30.
Counting of CNA events across single cells
CNA events from aneuploid cells were classified as chromosomal gains (segment ratio greater than 1.3) or losses (segment ratio less than 0.7). We grouped and counted the number of CNA events at chromosome-arm-level resolution for each patient. CNA events were counted by each chromosome arm, whereby the number of cells with the events was counted regardless of whether the cell also had more CNA events. For each patient, the CNA events detected in three or more aneuploid cells were classified as expanded events, whereas CNA events detected in fewer than three aneuploid cells were defined as sporadic events.
Analysis of TCGA copy number data
TCGA breast cancer copy number segmentation data mapped to the hg19 genome were downloaded from the Broad Institute FireBrowse portal (http://gdac.broadinstitute.org). The ER staining status for TCGA samples was obtained from a previous study52. In total, 763 paatients with ER-positive and 217 patients with ER-negative invasive breast cancer were included in the frequency analysis. If the log segment ratio was greater than 0.3, the CNA event was classified as a gain; if the log segment ratio was less than −0.3, the event was classified as a loss. The copy number frequency was then calculated as the fraction of the total patients who have the gain or loss in each segment. To determine the statistical significance of common CNA events detected in the frequency plots, we designed a permutation-based procedure to construct a null distribution of events with 1,000 shuffles of sampling the gain/loss/neutral states from all samples across the whole genome within each cohort. The Z score and P value were calculated to determine the significance of a CNA event frequency being higher than the frequency of the randomization. The significant detected CNA events (P < 0.0005) were identified and used to determine whether they overlapped with the CNA events detected in normal breast tissue by hypergeometric test using R package fgsea v.1.20.0.
Inference of copy number data from spatial transcriptomics data
10× Visium data were first preprocessed with Space Ranger v.1.2.0 and mapped to the GRCh38 reference genome. On the raw count data, CopyKAT v.1.1.0 (ref. 31) was used to infer the copy number profile from the spatial spots with following parameters: id.type = ’S’, ngene.chr = 5, LOW.DR = 0.05, UP.DR = 0.1, win.size = 25, norm.cell.names = “”, KS.cut = 0.05. To infer the copy number events on chromosome arms, we first applied multiPCF on CopyKAT inferred copy number log ratio using the R package copynumber v.1.34.0. Each chromosome arm log ratio value was then input into a Gaussian mixture model classification with G = 2 to estimate the distributions of neutral (N) and non-neutral (A) (gain/loss) using the R package mclust v.5.4.9. The distribution with smaller absolute μN is defined as neutral distribution, whereas the other is defined as gain or loss distribution on the basis of μA > 0 (gain) and μA < 0 (loss). Confident non-neutral distributions (gain/loss) were selected out using several criteria (μA > 95% confidence interval of neutral distribution, proA > proN + 0.2, the absolute 95% confidence interval of non-neutral distribution > 0.1). Finally, we determined the aneuploid spatial spots with chromosomal-arm log ratios greater than Z0.6 from the confident non-neutral distribution. To identify the dominant cell type of each spot, we applied Seurat label transfer, using a reference scRNA-seq data from the HBCA project4.
Statistical analysis of metadata correlations
To evaluate the associations of the number of CNA events and the proportion of aneuploid cells to the clinical metadata variables, we performed Wilcoxon rank-sum tests for categorical variables and Spearman’s rank correlation for continuous variables. P values were further adjusted using the Benjamini–Hochberg method (FDR). The multivariate linear regression was performed using glm() in R package stats (v.4.1.2).
CNA co-occurrence analysis
To measure the co-occurrence of CNA events in single cells, we performed Fisher’s exact test and calculated a co-occurrence index, where NA&B is the number of co-occurred events A and B, and NA is the total number of the A events. P values from Fisher’s exact test were adjusted using the Benjamini–Hochberg method (FDR).
Plots and heat maps
Plots in this manuscript were generated using ggplot2 (v.3.3.5) and ComplexHeatmap (v.2.10.0).
Disclaimer
The content is solely the responsibility of the authors and does not necessarily represent the official views of the Cancer Prevention and Research Institute of Texas.
Extended Data
Extended Data Figure 1. Example of a woman with rare aneuploid cells in the normal breast tissue.

a.b, Representative hematoxylin and eosin (H&E) stained photomicrographs (left panel), single cell DNA copy number heatmap (middle panel) and segmented copy number ratio plots (right panel) of selected aneuploid cells from patient P18(a), P20(b). Normal breast tissue morphologies of P18 and P20 were confirmed by examining two H&E slides per sample.
Extended Data Figure 2. Copy number heatmap across patients and CNA events detected in individual patients.

a. Single cell DNA copy number heatmap of N=3339 aneuploid cells from normal breast tissues across 49 disease-free women organized by patient. b. Examples of clustered copy number heatmaps of aneuploid cells from three women (P21, P17, P18) with lower panels showing chromosome arm-level CNA event counting for chromosomal gains and losses across all cells from each patient. c. The two panels show the linear correlation plots (Spearman Rank Correlation) of number of cells with sporadic events versus number of total cells sampled (left panel) or number of aneuploid cells detected (right panel). d. The two panels show the linear correlation plots (Spearman Rank Correlation) of the number of sporadic CNA events versus the number of total cells sampled (left panel) or number of aneuploid cells detected (right panel). The error bands in c and d represent the 95% confidence interval of the linear regression line. The correlations in c and d were tested by two-sided Spearman’s rank tests.
Extended Data Figure 3. Correlation of aneuploid cells from normal breast tissue with clinical metadata.

a. Boxplots showing the comparison of CNA event number counts in aneuploid epithelial cells with metadata for hyperplasia, metaplasia, parity status, menopause and ethnicity, significance tested using two-sided Wilcoxon rank sum test with adjusted p value reported. N.O.: not observed; AA: African American. b. Correlation plot between BMI and number of CNA events in aneuploid cells tested for significance using Spearman’s rank correlation. The error band represents the 95% confidence interval of the linear regression line. c. Multivariate linear regression analysis showing the correlation between clinical metadata and number of CNA events in the aneuploid epithelial cells with. All p-values were calculated based on two-sided Wald test. d. Boxplots showing the comparison of the proportion of aneuploid cells with metadata for hyperplasia, metaplasia, parity status, menopause and ethnicity, tested by two-sided Wilcoxon rank sum test. e. Correlation plot between BMI and proportion of aneuploid cells tested by Spearman’s rank correlation. f. Multivariate linear regression analysis showing the correlation between clinical characters and proportion of aneuploid cells. The bars represent the 95% confidence intervals of the effect sizes. All p-values were calculated based on two-sided t-test. g. Correlation plots of age compared to the number of autosomal events (left panel) or the number of chromosome X events (right panel) (Spearman’s rank). The boxplots show the median with interquartile ranges (25–75%), while the whiskers extend to the 1.5× the interquartile range from the box (a, d). The error bands in b, e, g represent the 95% confidence interval of the linear regression line. The correlations in b, e, g were tested by two-sided Spearman’s rank tests.
Extended Data Figure 4. Focal CNA mapping and allele-specific copy number lineages.

a. GISTIC2 G-scores for the copy number events detected in aneuploid cells on chromosomes 3, 7, 8 and 13. Peaks are annotated by cytogenetic location and selected cancer-related genes are mapped to the peaks. b. Co-occurrence between specific copy number events in the aneuploid cells from all 49 women, where dot size indicates the prevalence of the co-occurred events pair and * indicated the two-sided Fisher Exact test, FDR <0.05, event count >20 and event occurred in at least 10% patients. c. Minimum evolution tree rooted by a diploid node of the allele specific copy number of the clonal subpopulations (left panel), copy number heatmap (middle panel) and allele state heatmap (right panel) of aneuploid cells from P21, P08, P23, P20. A: loss of allele B; AAB: gain of allele A; AB: balanced alleles; B: loss of allele A; ABB: gain of allele B.
Extended Data Figure 5. Epithelial cell lineages of aneuploid cells in additional patients identified by DNA&ATAC co-assays.
a. UMAP of single cell ATAC-seq profiles from DNA&ATAC co-assay experiments for 19 normal breast samples colored by sample. b. UMAP annotated with cell types from single cell ATAC-seq profiles (N=31,176 cells) generated from DNA-ATAC co-assay experiments for 19 normal breast samples that underwent epithelial enrichment. c. Left panel shows the heatmap of z-scores from differential gene score analysis of the 3 epithelial cell types with canonical gene markers; middle panel shows the heatmap of z-scores from DAP analysis of the 3 epithelial cell types; right panel shows the heatmap of adjusted p-values from TF enrichment analysis of the 3 epithelial cell types with lineage-specific TF markers labeled. The differential analyses were tested by Wilcoxon rank sum test, with P values adjusted using Benjamin & Hochberg method (FDR). d. UMAPs from single cell ATAC-seq profiles (N=31,176 cells) generated from DNA-ATAC co-assay experiments for 19 normal breast samples that underwent epithelial enrichment showing cells with autosomal CNA events (left panel) or chromosome X events (right panel).
Extended Data Figure 6. Chromatin accessibility differences in epithelial lineages identified by DNA&ATAC co-assays.

a. Left panels are UMAPs of single cell ATAC-seq profiles for six patients (P14, P03, P39, P46, P37, P08) colored by either autosomal or X chromosome CNA events detected. Right panels are clustered heatmaps of single cell copy number profiles, with cell types indicated in the left annotation bars from the ATAC data. b. The copy number frequency plot of single cell co-assay data from the aneuploid epithelial cells with Basal-myoepithelial ATAC profiles. c. Differential gene score analysis of aneuploid cells relative to their diploid epithelial cell type references (LumSec, LumHR) for specific chromosomal events. d. Normalized ATAC signals in LumHR mapped to selected breast cancer gene regions with differential gene scores between diploid cells and cells with chr1q gain, chr16q loss, respectively. e. Normalized ATAC signals in LumSec mapped to breast cancer gene regions with differential gene scores between diploid cells and cells with chr1q gain and chr10q loss, respectively.
Extended Data Figure 7. Spatial transcriptomic analysis of aneuploid cells in normal breast tissues in additional patients.

a,c,e Copy number heatmaps inferred from Spatial Transcriptomics spot data using CopyKAT of P20(a), P03(c), P16(e). b,d,f Predicted aneuploid spot annotations overlayed on H&E images (left panel). Spatial H&E image and representative photomicrographs (right panel) of P20(b), P03(d), P16(f). Normal breast tissue morphologies were confirmed by examining the H&E imaging of all of the predicted aneuploid areas in the tissue sections.
Extended Data Figure 8. Spatial transcriptomic analysis of additional patients and cytogenetic validation.

a,b Copy number inferred from Spatial Transcriptomics spot data using CopyKAT of P14(a), P40(b). Inferred copy number heatmap (left panel). Predicted aneuploid spot annotations overlayed on H&E images (middle panel). Spatial H&E image and representative photomicrographs (right panel). c. Representative DNA-FISH images of chr1q gain and diploid cells of P14, P20 and P40. Probes colored in green targeted chr1q (MDM4), while control probes colored in red targeted chr1p. scale bar, 5 μm. FISH results were obtained from 16–25 imaging areas at 60x magnification.
Supplementary Material
Acknowledgements
This work was supported by grants to N.E.N. from the NIH National Cancer Institute (RO1CA240526, RO1CA236864), the CPRIT Single Cell Genomics Center (RP180684) and the Vivian Smith Foundation. N.E.N. is an AAAS Fellow, AAAS Wachtel Scholar, Damon-Runyon Rachleff Innovator, Andrew Sabin Fellow, and Jack & Beverly Randall Innovator. This study was supported by the MD Anderson Sequencing Core Facility Grant (CA016672) and the cytogenetic core facility. Y.L. was supported by the GSBS Kopchick Fellowship and Ray Meyn Scholarship for Cancer Research. J.W. was supported by the UTHealth Innovation for Cancer Prevention Research Training Program Pre-doctoral Fellowship (Cancer Prevention and Research Institute of Texas grant #RP210042).
Footnotes
Conflicts of Interest
The authors do not have any COIs to disclose that are relevant to this study.
Disclaimer
The content is solely the responsibility of the authors and does not necessarily represent the official views of the Cancer Prevention and Research Institute of Texas.
Data Availability
The DNA and ST data are available for download from the Sequence Read Archive (SRA) database (PRJNA1003661) while the ATAC data is available for download from the Gene Expression Omnibus (GEO) database (GSE272504).
Code Availability
Code is available under: https://github.com/navinlabcode/normalbreastDNA
References
- 1.Curtis C et al. The genomic and transcriptomic architecture of 2,000 breast tumours reveals novel subgroups. Nature (2012). https://doi.org:nature10983 [pii] 10.1038/nature10983 [DOI] [PMC free article] [PubMed] [Google Scholar]
- 2.Cancer Genome Atlas, N. Comprehensive molecular portraits of human breast tumours. Nature 490, 61–70 (2012). 10.1038/nature11412 [DOI] [PMC free article] [PubMed] [Google Scholar]
- 3.Hassiotou F & Geddes D Anatomy of the human mammary gland: Current status of knowledge. Clin Anat 26, 29–48 (2013). 10.1002/ca.22165 [DOI] [PubMed] [Google Scholar]
- 4.Kumar T et al. A spatially resolved single-cell genomic atlas of the adult human breast. Nature (2023). 10.1038/s41586-023-06252-9 [DOI] [PMC free article] [PubMed] [Google Scholar]
- 5.Wang Y & Navin NE Advances and Applications of Single-Cell Sequencing Technologies. Molecular cell 58, 598–609 (2015). 10.1016/j.molcel.2015.05.005 [DOI] [PMC free article] [PubMed] [Google Scholar]
- 6.Martincorena I et al. Tumor evolution. High burden and pervasive positive selection of somatic mutations in normal human skin. Science 348, 880–886 (2015). 10.1126/science.aaa6806 [DOI] [PMC free article] [PubMed] [Google Scholar]
- 7.Martincorena I et al. Somatic mutant clones colonize the human esophagus with age. Science 362, 911–917 (2018). 10.1126/science.aau3879 [DOI] [PMC free article] [PubMed] [Google Scholar]
- 8.Lee-Six H et al. The landscape of somatic mutation in normal colorectal epithelial cells. Nature 574, 532–537 (2019). 10.1038/s41586-019-1672-7 [DOI] [PubMed] [Google Scholar]
- 9.Brunner SF et al. Somatic mutations and clonal dynamics in healthy and cirrhotic human liver. Nature 574, 538–542 (2019). 10.1038/s41586-019-1670-9 [DOI] [PMC free article] [PubMed] [Google Scholar]
- 10.Blokzijl F et al. Tissue-specific mutation accumulation in human adult stem cells during life. Nature 538, 260–264 (2016). 10.1038/nature19768 [DOI] [PMC free article] [PubMed] [Google Scholar]
- 11.Li R et al. Macroscopic somatic clonal expansion in morphologically normal human urothelium. Science 370, 82–89 (2020). 10.1126/science.aba7300 [DOI] [PubMed] [Google Scholar]
- 12.Moore L et al. The mutational landscape of normal human endometrial epithelium. Nature 580, 640–646 (2020). 10.1038/s41586-020-2214-z [DOI] [PubMed] [Google Scholar]
- 13.Nishimura T et al. Evolutionary histories of breast cancer and related clones. Nature (2023). 10.1038/s41586-023-06333-9 [DOI] [PMC free article] [PubMed] [Google Scholar]
- 14.Park S et al. Clonal dynamics in early human embryogenesis inferred from somatic mutation. Nature 597, 393–397 (2021). 10.1038/s41586-021-03786-8 [DOI] [PubMed] [Google Scholar]
- 15.Li R et al. A body map of somatic mutagenesis in morphologically normal human tissues. Nature 597, 398–403 (2021). 10.1038/s41586-021-03836-1 [DOI] [PubMed] [Google Scholar]
- 16.McConnell MJ et al. Mosaic copy number variation in human neurons. Science 342, 632–637 (2013). 10.1126/science.1243472 [DOI] [PMC free article] [PubMed] [Google Scholar]
- 17.Wang J, Fan HC, Behr B & Quake SR Genome-wide single-cell analysis of recombination activity and de novo mutation rates in human sperm. Cell 150, 402–412 (2012). 10.1016/j.cell.2012.06.030 [DOI] [PMC free article] [PubMed] [Google Scholar]
- 18.Liu L et al. Low-frequency somatic copy number alterations in normal human lymphocytes revealed by large-scale single-cell whole-genome profiling. Genome Res 32, 44–54 (2022). 10.1101/gr.275453.121 [DOI] [PMC free article] [PubMed] [Google Scholar]
- 19.Zhou Y et al. Single-Cell Multiomics Sequencing Reveals Prevalent Genomic Alterations in Tumor Stromal Cells of Human Colorectal Cancer. Cancer Cell 38, 818–828 e815 (2020). 10.1016/j.ccell.2020.09.015 [DOI] [PubMed] [Google Scholar]
- 20.Knouse KA, Wu J, Whittaker CA & Amon A Single cell sequencing reveals low levels of aneuploidy across mammalian tissues. Proc Natl Acad Sci U S A 111, 13409–13414 (2014). 10.1073/pnas.1415287111 [DOI] [PMC free article] [PubMed] [Google Scholar]
- 21.Gawad C, Koh W & Quake SR Single-cell genome sequencing: current state of the science. Nat Rev Genet 17, 175–188 (2016). 10.1038/nrg.2015.16 [DOI] [PubMed] [Google Scholar]
- 22.Wang K et al. Archival single-cell genomics reveals persistent subclones during DCIS progression. Cell (2023). 10.1016/j.cell.2023.07.024 [DOI] [PMC free article] [PubMed] [Google Scholar]
- 23.Mermel CH et al. GISTIC2.0 facilitates sensitive and confident localization of the targets of focal somatic copy-number alteration in human cancers. Genome Biol 12, R41 (2011). 10.1186/gb-2011-12-4-r41 [DOI] [PMC free article] [PubMed] [Google Scholar]
- 24.Koon HB, Ippolito GC, Banham AH & Tucker PW FOXP1: a potential therapeutic target in cancer. Expert Opin Ther Targets 11, 955–965 (2007). 10.1517/14728222.11.7.955 [DOI] [PMC free article] [PubMed] [Google Scholar]
- 25.Yu X et al. TUSC3: a novel tumour suppressor gene and its functional implications. J Cell Mol Med 21, 1711–1718 (2017). 10.1111/jcmm.13128 [DOI] [PMC free article] [PubMed] [Google Scholar]
- 26.Chen WX, Cheng L, Xu LY, Qian Q & Zhu YL Bioinformatics analysis of prognostic value of TRIM13 gene in breast cancer. Biosci Rep 39 (2019). 10.1042/BSR20190285 [DOI] [PMC free article] [PubMed] [Google Scholar]
- 27.Ren L et al. Caveolin-1 is a prognostic marker and suppresses the proliferation of breast cancer. Transl Cancer Res 10, 3797–3810 (2021). 10.21037/tcr-21-1139 [DOI] [PMC free article] [PubMed] [Google Scholar]
- 28.Kaufmann TL et al. MEDICC2: whole-genome doubling aware copy-number phylogenies for cancer evolution. Genome Biol 23, 241 (2022). 10.1186/s13059-022-02794-9 [DOI] [PMC free article] [PubMed] [Google Scholar]
- 29.Wang K et al. Single cell genome and epigenome co-profiling reveals hardwiring and plasticity in breast cancer. bioRxiv, 2024.2009.2006.611519 (2024). 10.1101/2024.09.06.611519 [DOI] [Google Scholar]
- 30.Pervolarakis N et al. Integrated Single-Cell Transcriptomics and Chromatin Accessibility Analysis Reveals Regulators of Mammary Epithelial Cell Identity. Cell reports 33, 108273 (2020). 10.1016/j.celrep.2020.108273 [DOI] [PMC free article] [PubMed] [Google Scholar]
- 31.Gao R et al. Delineating copy number and clonal substructure in human tumors from single-cell transcriptomes. Nat Biotechnol 39, 599–608 (2021). 10.1038/s41587-020-00795-2 [DOI] [PMC free article] [PubMed] [Google Scholar]
- 32.Butler A, Hoffman P, Smibert P, Papalexi E & Satija R Integrating single-cell transcriptomic data across different conditions, technologies, and species. Nat Biotechnol 36, 411–420 (2018). 10.1038/nbt.4096 [DOI] [PMC free article] [PubMed] [Google Scholar]
- 33.McGuire A, Brown JA, Malone C, McLaughlin R & Kerin MJ Effects of age on the detection and management of breast cancer. Cancers (Basel) 7, 908–929 (2015). 10.3390/cancers7020815 [DOI] [PMC free article] [PubMed] [Google Scholar]
- 34.Machiela MJ et al. Female chromosome X mosaicism is age-related and preferentially affects the inactivated X chromosome. Nature communications 7, 11843 (2016). 10.1038/ncomms11843 [DOI] [PMC free article] [PubMed] [Google Scholar]
- 35.Yates LR et al. Subclonal diversification of primary breast cancer revealed by multiregion sequencing. Nat Med 21, 751–759 (2015). 10.1038/nm.3886 [DOI] [PMC free article] [PubMed] [Google Scholar]
- 36.Minussi DC et al. Breast tumours maintain a reservoir of subclonal diversity during expansion. Nature 592, 302–308 (2021). 10.1038/s41586-021-03357-x [DOI] [PMC free article] [PubMed] [Google Scholar]
- 37.Leighton J, Hu M, Sei E, Meric-Bernstam F & Navin NE Reconstructing mutational lineages in breast cancer by multi-patient-targeted single-cell DNA sequencing. Cell Genom 3, 100215 (2023). 10.1016/j.xgen.2022.100215 [DOI] [PMC free article] [PubMed] [Google Scholar]
- 38.Haupt S et al. The role of MDM2 and MDM4 in breast cancer development and prevention. J Mol Cell Biol 9, 53–61 (2017). 10.1093/jmcb/mjx007 [DOI] [PMC free article] [PubMed] [Google Scholar]
- 39.Bose S et al. Reduced expression of PTEN correlates with breast cancer progression. Hum Pathol 33, 405–409 (2002). 10.1053/hupa.2002.124721 [DOI] [PubMed] [Google Scholar]
- 40.McCart Reed AE et al. The Genomic Landscape of Lobular Breast Cancer. Cancers (Basel) 13 (2021). 10.3390/cancers13081950 [DOI] [PMC free article] [PubMed] [Google Scholar]
- 41.Pearson A et al. Inactivating NF1 Mutations Are Enriched in Advanced Breast Cancer and Contribute to Endocrine Therapy Resistance. Clin Cancer Res 26, 608–622 (2020). 10.1158/1078-0432.CCR-18-4044 [DOI] [PubMed] [Google Scholar]
- 42.Karaayvaz-Yildirim M et al. Aneuploidy and a deregulated DNA damage response suggest haploinsufficiency in breast tissues of BRCA2 mutation carriers. Sci Adv 6, eaay2611 (2020). 10.1126/sciadv.aay2611 [DOI] [PMC free article] [PubMed] [Google Scholar]
- 43.Minussi DC et al. Resolving clonal substructure from single cell genomic data using CopyKit. bioRxiv, 2022.2003.2009.483497 (2022). 10.1101/2022.03.09.483497 [DOI] [Google Scholar]
- 44.Delaneau O, Marchini J & Zagury JF A linear complexity phasing method for thousands of genomes. Nat Methods 9, 179–181 (2011). 10.1038/nmeth.1785 [DOI] [PubMed] [Google Scholar]
- 45.Huang X & Huang Y Cellsnp-lite: an efficient tool for genotyping single cells. Bioinformatics 37, 4569–4571 (2021). 10.1093/bioinformatics/btab358 [DOI] [PubMed] [Google Scholar]
- 46.Funnell T et al. Single-cell genomic variation induced by mutational processes in cancer. Nature 612, 106–115 (2022). 10.1038/s41586-022-05249-0 [DOI] [PMC free article] [PubMed] [Google Scholar]
- 47.Langmead B & Salzberg SL Fast gapped-read alignment with Bowtie 2. Nat Methods 9, 357–359 (2012). 10.1038/nmeth.1923 [DOI] [PMC free article] [PubMed] [Google Scholar]
- 48.Granja JM et al. ArchR is a scalable software package for integrative single-cell chromatin accessibility analysis. Nat Genet 53, 403–411 (2021). 10.1038/s41588-021-00790-6 [DOI] [PMC free article] [PubMed] [Google Scholar]
- 49.Granja JM et al. Single-cell multiomic analysis identifies regulatory programs in mixed-phenotype acute leukemia. Nat Biotechnol 37, 1458–1465 (2019). 10.1038/s41587-019-0332-7 [DOI] [PMC free article] [PubMed] [Google Scholar]
- 50.Korsunsky I et al. Fast, sensitive and accurate integration of single-cell data with Harmony. Nat Methods 16, 1289–1296 (2019). 10.1038/s41592-019-0619-0 [DOI] [PMC free article] [PubMed] [Google Scholar]
- 51.Lun AT, McCarthy DJ & Marioni JC A step-by-step workflow for low-level analysis of single-cell RNA-seq data with Bioconductor. F1000Res 5, 2122 (2016). 10.12688/f1000research.9501.2 [DOI] [PMC free article] [PubMed] [Google Scholar]
- 52.Thennavan A et al. Molecular analysis of TCGA breast cancer histologic types. Cell Genom 1 (2021). 10.1016/j.xgen.2021.100067 [DOI] [PMC free article] [PubMed] [Google Scholar]
Associated Data
This section collects any data citations, data availability statements, or supplementary materials included in this article.
Supplementary Materials
Data Availability Statement
The DNA and ST data are available for download from the Sequence Read Archive (SRA) database (PRJNA1003661) while the ATAC data is available for download from the Gene Expression Omnibus (GEO) database (GSE272504).
Code is available under: https://github.com/navinlabcode/normalbreastDNA