

Abstract
Context:
The signs and symptoms of Graves’ ophthalmopathy (GO) result from inflammation and increased volume of the orbital adipose tissues and extraocular muscles.
Objective:
To identify differentially regulated genes that may be involved in stimulating the orbital adipose tissue expansion seen in GO.
Design:
Gene expression profiling was used to compare genes expressed in orbital adipose tissues from GO patients and normal individuals.
Setting:
Private practice tertiary referral center.
Patients:
Orbital adipose tissues were collected at transantral orbital decompression surgery from 20 euthyroid patients undergoing this procedure for severe GO and at early autopsy from 8 normal individuals having no evidence of thyroid or ocular disease.
Results:
Of the 12,686 genes analyzed, 25 known genes were increased in expression (> 4 fold) in GO orbital tissues, while 11 genes were decreased (> 4 fold). Upregulated genes, confirmed by quantitative RT-PCR, included secreted frizzled related protein-1 (sFRP-1; 18.5 fold) and several adipocyte-related genes, including peroxisome proliferator activated receptor-γ (44.1 fold) and adiponectin (25 fold). Treatment in vitro of GO orbital preadipocytes with recombinant sFRP-1 (100 nM) significantly increased adiponectin (2.0 fold; p<.05), leptin (7 fold; p<.002), and thyrotropin receptor mRNA (13 fold; p<.003) levels, and enhanced Oil red-O staining in the cultures.
Conclusions:
These results support the concept that orbital adipogenesis is enhanced in GO, and suggest that elevated levels of sFRP-1 in the GO orbit may be involved in stimulating this pathogenic process.
Keywords: sFRP-1, Graves’ disease, Graves’ ophthalmopathy, adipogenesis
INTRODUCTION
Graves’ ophthalmopathy (GO) is an autoimmune inflammatory disorder of the orbital adipose and connective tissues and the extraocular muscles. This condition occurs closely in association with Graves’ disease and recent evidence implicates the thyrotropin receptor (TSHr) as an important orbital autoantigen in GO.1–3 The characteristic clinical manifestations of GO, including proptosis, chemosis, periorbital edema and extraocular muscle dysfunction, result from the intraorbital inflammatory process and enlargement of the adipose tissue and muscles within the orbit. While the extraocular muscle enlargement is attributable to cytokine-stimulated glycosaminoglycan accumulation within the extraocular muscles,4 little is known about mechanisms involved in the enlargement of the intraorbital adipose tissues. Recent studies from our laboratory reveal overexpression of mature adipocyte-related genes within GO orbital tissues compared with normal orbital tissues and suggest that de novo adipogenesis may be active within the orbit in this condition.5 However, factors serving to stimulate this process in GO remain undefined.
The development of high-density synthetic oligonucleotide microarrays has enabled the relative expression of a large number of genes in small tissue samples to be assessed. Knowledge of differentially expressed genes in GO orbital fat has the potential to provide insight into molecular mechanisms involved in the pathologic process and to provide new therapeutic targets for treatment of this disease. Using microarray analysis, we determined the relative expression of approximately 12,000 full-length genes in orbital adipose tissue specimens from patients with GO and normal individuals. We choose for further study one of genes most highly overexpressed in GO patient tissues, soluble frizzled related protein-1 (sFRP). The protein product of this gene is an inhibitor of Wnt signaling, a system that when active inhibits adipogenesis. This suggested to us that sFRP might act as a stimulator of adipogenesis in the GO orbit, and we performed additional tissue- and cell culture-based studies, reported here, to further investigate this concept.
MATERIALS AND METHODS
Orbital adipose tissue samples
Orbital adipose/connective tissue specimens used for the gene array studies were obtained from patients who underwent orbital decompression surgery for severe GO (n = 20). All of the patients were euthyroid, one was taking propylthiouracil at the time of surgery, 6 received oral corticosteroids, and 2 of these underwent external beam orbital irradiation prior to decompression surgery. Normal orbital adipose tissues were retrieved at very early autopsy from the same anatomic site in patients with no history of Graves’ disease whose corneas were being harvested for transplantation, generally within an hour postmortem (n = 8). Additional orbital adipose tissue samples were collected similarly for the RT-PCR studies (GO; n = 16 and normal; n = 15), and tissue culture experiments (GO; n = 6). All GO patients were euthyroid at the time of the orbital surgery. The sex ratio, mean body weight and body mass index were not significantly different between the GO patients and normal individuals.
GO orbital tissue specimens were placed in a sterile container on saline soaked gauze in the operating room, transported at room temperature to our laboratory, and frozen at −70° C (samples to be used in the gene array studies) or placed immediately in tissue culture (samples to be used in culture-based studies). Normal orbital tissue was similarly frozen or placed in tissue culture media immediately upon harvesting, depending on its eventual use. Due to the small size of the surgical tissue samples and low yield of RNA from orbital fat tissues, GO and normal tissue specimens were grouped into 2 pools each for the gene array studies (10 GO patients/pool × 2 pools; 4 normals/pool × 2 pools). These studies were reviewed and approved by the Mayo Clinic Institutional Review Board.
RNA Isolation
Total RNA was isolated from the tissue samples using RNeasy kit (Qiagen, Valencia, CA) according to the manufacturer’s protocol. The total RNA was further purified using an affinity resin column (RNeasy; Qiagen, Chatsworth, CA). cDNA was subsequently synthesized using the Superscript cDNA synthesis kit (Gibco-BRL, Gaithesburg, MD). Double stranded cDNA was then purified by phase lock gel (Eppendorf, Westbury, NY) with phenol/chloroform extraction.
Gene array sample preparation, hybridization, and scanning
The purified cDNA was used as a template for in vitro transcription in the synthesis of biotinylated complementary RNA (cRNA) using an RNA transcript labeling reagent (Affymetrix). Labeled cRNAs were then fragmented and hybridized onto the Affymetrix Gene Chip® Hu95A oligonucleotide microarray. Briefly, appropriate amounts of fragmented cRNA and control oligonucleotide B2 were added along with control cRNA (BioB, BioC, BioD), herring sperm DNA, and bovine serum albumin to the hybridization buffer. The hybridization mixture was heated at 99 degree Celsius for 5 minutes followed by incubation at 45 degrees Celsius for 5 minutes before injecting the sample into the Gene Chip. Hybridization then was performed at 45 degrees Celsius for 16 hours with mixing on a rotisserie at 60rpm. After hybridization, the solutions were removed and arrays were washed and stained with streptavidin-phycoerythritin (Molecular Probes, Portland, OR)
After washing and staining, probe arrays were scanned using the gene chip system confocal scanner. The quality of the fragmented biotin labeled cRNA in each experiment was evaluated before hybridizing onto the Hu95A expression array by both gel electrophoresis and hybridizing onto test-2 microarray and analyzing as a measure of quality control. Hybridization and confocal scanning were performed at an institutional microarray core facility.
Gene array data analysis
MAS 5.0 software (Affymetrix) was used to scan and quantitatively analyze the scanned image. The expression of various genes in each pool of GO orbital fat was compared independently with the two pools of normal orbital fat. Genes that were more than 4 fold differentially expressed between groups being compared were identified. Only those genes that were more than 4 fold increased or decreased in both of the GO pools when compared to both of the normal pools were considered to have differential expression between GO and normal orbital fat. For those genes satisfying the above criteria, the fold difference for GO vs. normal orbital fat was derived from the mean of the fold difference between each comparison (e.g. GO#1 vs. N#1, GO#1 vs N#2, GO#2 vs. N#1, GO#2 vs. N#2). The coefficient of correlation between log of ratio for each of the Graves’ pools relative to both normal pools was 0.97.
Cell Culture
GO (n = 6) orbital adipose tissue samples were minced and placed directly in plastic culture dishes, allowing preadipocyte fibroblasts to proliferate as previously described.8 Cells were propagated in medium 199 containing 20% FBS (HyClone Laboratories, Inc., Logan, UT), penicillin (100 U/ml), and gentamicin (20 μg/ml) in a humidified 5% CO2 incubator at 37° C and maintained in 80-mm2 flasks with medium 199 containing 10% FBS and antibiotics.
Orbital cells were grown to confluence in six-well plates in medium 199 with 10% FBS. Upon reaching confluence, cultures were changed to serum-free DMEM/Ham’s F-12 (1:1; Sigma, St. Louis, MO) supplemented with biotin (33 μM), pantothenic acid (17 μM), transferrin (10 μg/ml), T3 (0.2 nM), insulin (1 μM), carbaprostacyclin (cPGI2; 0.2 μM; Calbiochem, La Jolla CA), and, for the first 4 d only, dexamethasone (1 μM) and isobutylmethylxanthine (IBMX; 0.1 mM). The differentiation protocol was continued for 10 d, during which time the medium was replaced every 3–4 d, as previously described.5 In experimental cultures, recombinant human sFRP-1 (100 nM; R&D Systems, Minneapolis, MN; #1384-SF) was added to triplicate cultures at the start of the differentiation period. The media and sFRP-1 were replaced every 3–4 days for the full 10 d period of differentiation. The diluent vehicle was added similarly to the triplicate control culture media. Lipid accumulation and adipocyte morphology were visualized following staining with Oil red-O.6
Quantatative RT-PCR
Quantitative RT-PCR for assessment of sFRP-1 mRNA levels was performed using individual GO and normal control orbital adipose tissue specimens that were different from those analyzed in the gene array studies (n = 16 for GO and n = 15 for normal specimens). In the tissue culture experiments, adiponectin and leptin mRNA was analyzed following differentiation in recombinant sFRP-1-treated and untreated GO orbital cultures (n = 6).
Total RNA was isolated using the RNeasy kit (Qiagen, Valencia, CA) according to the manufacturer’s protocol. cDNA was synthesized using 200 ng of total RNA incubated with random hexamers, followed by a 100 μl reverse transcription reaction with 6.25 units of Multiscribe Reverse Transcriptase (Applied Biosystems, Foster City, CA). Conditions used were 25° C for 10 min, 37° C for 60 min, and 95° C for 5 min.
Oligonucleotide primers and Taqman probes for sFRP-1 were designed using the computer program Primer Express (Applied Biosystems, Foster City, CA, USA). In order to avoid amplification of genomic DNA, the reverse primer for sFRP-1 was placed at the junction between two exons. The sequence of the forward primer used in the reactions was: GCCTGCCTTTGTGTCAGAAAA; the reverse primer was: TGCCTTCTCAGCC CGAAA; and the probe was: TCGCCGTCTCTCTCAGGCTCACTGT. Expression of 18S ribosomal RNA (rRNA) was used to correct for differences in the amount of total RNA added to a reaction and to compensate for different levels of inhibition during reverse transcription of RNA and during PCR. Primers and probes used for analysis of adiponectin and leptin mRNA levels were as previously described.5
Quantitative PCR reactions were done in a 96-well optical reaction plate Amplification reactions contained cDNA equivalent of 2 ng total RNA for orbital tissues and 200 ng total RNA for orbital cultures, 900 nM of the forward and reverse primers and 250 nM of the probes in a volume of 25 μl using the Universal Taqman 2X PCR mastermix (Applied Biosystems). The thermal cycling conditions used were: 2 min at 50° C for optimal AmpErase UNG activity, 10 min at 95°C to activate Amplitaq Gold DNA Polymerase, followed by 40 cycles at 95°C for 15 s and 60°C for 1 min. The target gene and 18S rRNA were amplified in separate wells. All reactions were performed in duplicate in the ABI PRISM® 7700 Sequence Detector (Applied Biosystems) and the data pooled. Normal adipose tissue was used as the positive control and reaction mixture, without the cDNA, was used as the negative control in each run.
The standard curve method was used to quantify the expression of sFRP-1, adiponectin and leptin mRNA and 18S rRNA in each sample. The normalized results were expressed as the ratio of RNA (pg) of the gene to RNA (pg) of 18S rRNA. For each experimental sample, a gene was considered to be expressed if amplification was detected by cycle 40. The Mann-Whitney Rank Sum test was used to assess statistically significant differences between the groups of tissue samples or cultured cells.
RESULTS
Gene array analyses
Only 36 of the 12,686 full-length genes surveyed were expressed differentially (i.e. at least 4 fold higher or lower) in both the GO patient pools when compared with both of the two normal pools (Table 1). Of these, 25 genes were found to have > 4 fold increased expression in the GO tissues. Among the most highly overexpressed genes were several that are either adipocyte-specific or adipocyte-related, including peroxisome proliferator activated receptor-γ (PPAR-γ;44.2 fold), adiponectin (25 fold), perilipin (13.6 fold), fatty acid binding protein 4 (12.3 fold), and lipoprotein lipase (6.5 fold). Other highly overexpressed genes included, pro-platelet basic protein (chemokine C-X-C motif ligand 7; 32.9 fold), collagen, type 1, alpha 1 (28.2 fold), interleukin-6 (23.9 fold), glycogenin 2 (22.4 fold), and sFRP-1 (18.5 fold). The 11 genes that were more than 4-fold underexpressed in both GO orbital fat pools compared with both normal orbital fat pools are also listed in Table 1, and include 2 encoding aquaporin proteins.
Table 1.
Results of gene array studies; Mean fold differences in gene expression between GO and normal orbital adipose tissue specimens
| Gene (Affymetrix ID) | Mean Fold Difference* | Function |
|---|---|---|
| peroxisome proliferative activated receptor-γ (PPAR-γ) (37104_at)** | 44.2 | signal transduction |
| pro-platelet basic protein (chemokine C-X-C motif ligand 7;39208_i_at) | 32.9 | cell proliferation |
| collagen type I α1 (35474_s_at) | 28.2 | differentiation |
| adiponectin (Acrp30;40658_r_at)** | 25.0 | metabolism |
| interleukin 6 (IL-6; 38299_at) | 23.9 | cell proliferation |
| glycogenin 2 (35334_at) | 22.4 | glycogen biosynthesis |
| secreted frizzled-related protein 1** (32521_at) | 18.5 | signal transduction |
| apolipoprotein E (608_at) | 18.3 | development |
| related RAS viral (r-ras) oncogene homolog (1879_at) | 16.9 | signal transduction |
| mab-21-like 1 (C. elegans) (39297_at) | 15.6 | embryogenesis |
| perilipin (37122_at) | 13.6 | metabolism |
| transmembrane 4 superfamily member 3 (38469_at) | 13.0 | pathogenesis |
| Adipocyte fatty acid binding protein 4 (38430_at) | 12.3 | transport |
| putative lymphocyte G0/G1 switch gene (38326_at) | 10.0 | cell growth |
| mesenchyme homeo box 1 (36010_at) | 8.7 | development |
| collagen, type III, α1 (32488_at) | 8.2 | circulation |
| mesoderm specific transcript homolog (mouse) (37749_at) | 7.3 | metabolism |
| lipoprotein lipase (41209_at) | 6.5 | circulation |
| FBJ murine osteosarcoma viral oncogene homolog B (36669_at) | 6.5 | transcription |
| protein phosphatase 1, regulatory (inhibitor) subunit 1A (844_at) | 6.4 | metabolism |
| protein kinase, cAMP-dependent, regulatory, type II β (37221_at) | 6.3 | intracellular signaling |
| collagen, type I, α2 (32305_at) | 6.2 | development |
| vascular adhesion protein 1 (33756_at) | 5.9 | inflammation |
| collagen, type I, α2 (32306_g_at) | 5.9 | development |
| glycerol-3-phosphate dehydrogenase 1 (soluble) (33902_at) | 5.5 | metabolism |
| crystallin, αB (32242_at) | −4.7 | vision |
| aquaporin 5 (32909_at) | −5.5 | transport |
| coagulation factor III (thromboplastin, tissue factor) (36543_at) | −5.5 | immune response |
| cytochrome c oxidase subunit VIIa polypeptide1 muscle (39031_at) | −6.0 | energy pathways |
| isocitrate dehydrogenase 2 (NADP+), mitochondrial (32332_at) | −6.4 | metabolism |
| tropomyosin 2 β(32314_g_at) | −6.4 | development |
| ATPase, Ca++ transport, cardiac muscle, slow twitch 2 (39790_at) | −7.0 | metabolism |
| desmoplakin (DPI, DPII) (36133_at) | −7.4 | differentiation |
| solute carrier family 25 (adenine nucleotide translocator) (32822_at) | −11.7 | energy pathways |
| SH3 domain binding glutamic acid-rich protein (36040_at) | −17.5 | transcription |
| aquaporin 3 (39248_at) | −19.5 | transport |
Mean fold elevation or decrease in gene expression
Genes selected for further study
Quantitative RT-PCR analysis of sFRP-1 in orbital tissue specimens
Quantitative RT-PCR analysis was performed using total RNA isolated from GO (n = 16) and normal (n = 15) orbital adipose tissue samples distinct from those used in the gene array studies. sFRP-1 mRNA was detectable in each of 16 GO specimens, and in 14/15 normal specimens. While there was overlap between the groups, the levels of sFRP-1 mRNA, normalized to 18S rRNA, were significantly higher in GO orbital adipose tissue samples than in the normal tissue samples (p = 0.03; Figure 1). Expression levels of sFRP-1 in individual patients did not correlate with the duration of GO, type of prior GO treatment, smoking history, time since diagnosis of hyperthyroidism, or age. In a previous study, we showed by quantitative RT-PCR that adiponectin, PPAR-γ, leptin and thyrotropin receptor (TSHr) mRNA levels were higher in GO than in normal orbital adipose tissue specimens.5
Figure 1.
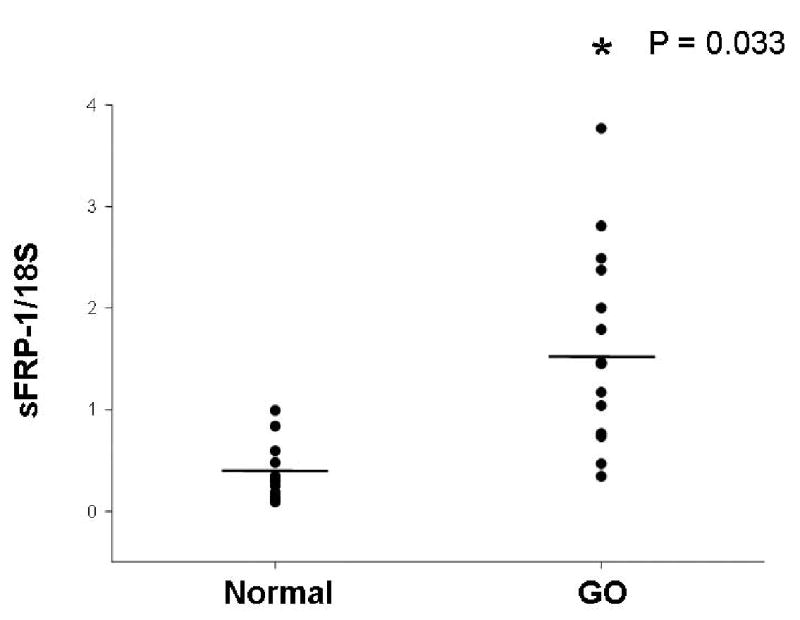
Relative expression of sFRP-1 (normalized to 18S rRNA) in orbital adipose tissue specimens from patients with GO (n = 16) and normal individuals (n = 15). Horizontal lines represent mean values for each group. *p = 0.03 for GO compared with normal orbital tissues.
Cell cultures
Levels of mRNA encoding adiponectin, leptin, and TSHr genes were assessed in sFRP-1-treated and control cultures. As these former genes are expressed exclusively in mature adipocytes, and TSHr expression is known to be enhanced by adipocyte differentiation (2), mRNA levels corresponding to these these genes can be used as “markers’ of adipocyte differentiation. Adiponectin mRNA, while measurable in all cultures following adipocyte differentiation, was greater in sFRP-1-treated GO orbital cell cultures (n = 6) studied in triplicate than in parallel untreated cultures (mean 2.0 fold, range 1.0 to 4.2 fold, p<.05; Figure 2A). Similarly, expression was greater in triplicate sFRP-1-treated cultures than in parallel control cultures for leptin (mean 7 fold, range 3.7 to 11.2 fold, p < .002; Figure 2B) and TSHr (mean 13 fold, range 7.6 to 18.8 fold, p < .003). We estimate that there were approximately 200 copies of adiponectin or leptin RNA/cell in the untreated cultures; this increased to between 400–500 copies/cell of each with sFRP-treatment.
Figure 2.
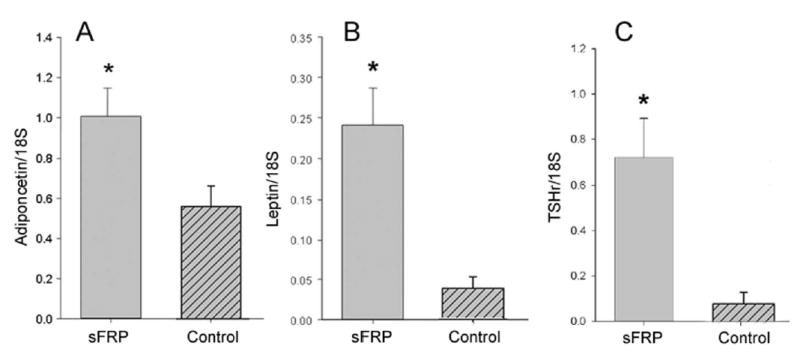
Relative levels of adiponectin mRNA (panel A), leptin mRNA (panel B), and TSHr mRNA (panel C), each normalized to 18S rRNA, in differentiated orbital preadipocyte cultures that were treated for the entire 10 d differentiation period with either recombinant human sFRP-1 (100 nM), or vehicle. Results represent the mean ± SEM of triplicate cultures derived from 6 different individuals with GO. *P < .05 for differences in adiponectin mRNA levels and < .002 for differences in leptin mRNA levels.
Cultures were stained with Oil red-O following the 10 d period of differentiation and observed under phase-microscopy for evidence of adipocyte differentiation. While untreated differentiated cultures generally showed evidence of lipid accumulation in approximately 10–15% of cells, sFRP treatment during differentiation increased both the percentage of cells undergoing differentiation (to approximately 30–40%), and the size of the lipid-filled cells present (Figure 3).
Figure 3.
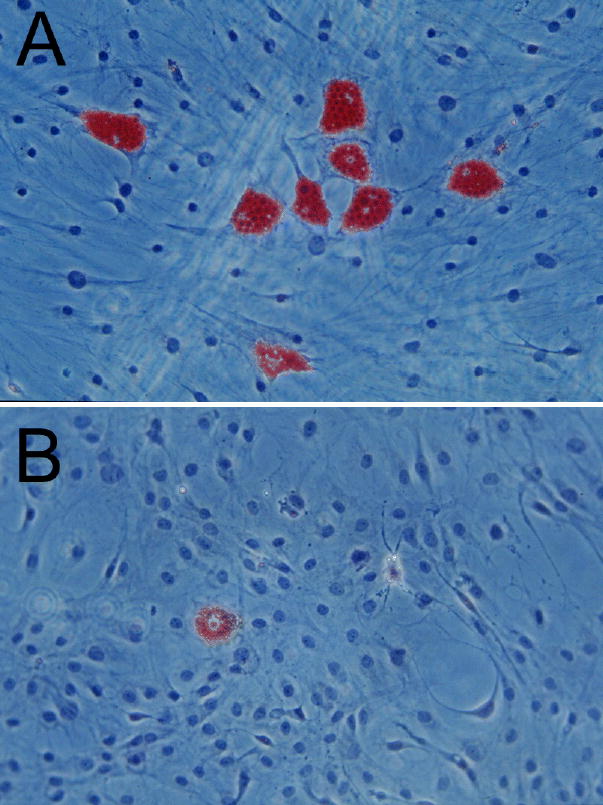
Photomicrographs (10X magnification) of Oil red-O stained orbital cells obtained from a patient with GO. Preadipocytes were cultured for 10 days under differentiating conditions either in the presence of human recombinant sFRP-1 (100 nM; panel A) or vehicle (panel B).
DISCUSSION
Our gene expression profiling identified several genes that were upregulated in GO compared with normal orbital adipose tissues. Among these, PPAR-γ and adiponectin were found to be 44-, 25-fold overexpressed, respectively. PPAR-γ is an essential regulator of adipogenesis and a modulator of fat cell function,9,10 and adiponectin is produced exclusively in mature adipocytes.11 The increased expression of these genes in GO compared with normal orbital tissue suggests either that a greater number of the preadipocytes within the GO tissue have undergone de novo adipogenesis, producing a population of cells containing a higher percentage of mature adipocytes, or that lipid accumulation has increased in the existing fat cells. These gene array findings support our earlier RT-PCR studies demonstrating increased expression of mRNA encoding adiponectin, PPAR-γ and leptin (another adipocyte-specific gene) in individual GO orbital tissue specimens compared with normal orbital tissues.5
A recent study by MacDougald and colleagues compared gene expression profiles between normal human adipocytes and preadipocytes using microarray analysis.12 These investigators identified 119 genes that fit stringent criteria for overexpression in normal human adipocytes and white adipose tissue compared with preadipocytes and stromal vascular tissue. The authors concluded that this constellation of genes defines the normal adipocyte phenotype. Eight of the 25 genes found in our study to be enhanced in expression in GO orbital adipose tissues were among those identified in the MacDougald study. These genes included PPAR-γ, adiponectin, RAS-related viral oncogene homolog, adipocyte fatty acid binding protein 4, lipoprotein lipase, vascular adhesion protein 1, glycerol-3-phosphate dehydrogenase 1, and cDNA (40657_r_a). The differences between our findings and theirs are likely related to modes of array data analysis, and the fact that our tissues were from a different species, fat depot, and disease state.
Our gene expression profiling identified sFRP-1 as another gene upregulated (18-fold) in GO patient tissues. sFRP-1 is a secreted inhibitor of Wnt signaling, a pathway that when active inhibits adipogenesis.6,7 Wnts are secreted glycoproteins that signal through their frizzled receptors and low-density lipoprotein receptor-related protein co-receptors to have profound autocrine and paracrine effects on cellular differentiation and growth.13 Wnt10b blocks adipogenesis through activation of the Wnt/β-catenin signaling pathway,6 and sFRPs have been shown to antagonize Wnt signaling by binding and sequestering Wnts from their receptors.14 The disruption of extracellular Wnt signaling by in vitro expression of sFRP or by the addition of recombinant sFRP to cultures of 3T3 preadipocytes results in spontaneous differentiation.6 However, despite its profound stimulatory effect on adipogenesis, MacDougald and colleagues did not identify the sFRP-1 gene as among those defining the normal adipocyte phenotype.12 We therefore hypothesized that since increased sFRP-1 levels are apparently not a consequence of adipogenesis per se, sFRP-1 might play a pathogenic role in GO orbital pathology.
In initial studies, we verified the gene array findings using quantitative RT-PCR and demonstrated increased levels of sFRP-1 mRNA in individual GO orbital adipose tissue specimens. We then demonstrated the ability of this recombinant protein to stimulate adipogenesis and TSHr expression in cultures of GO orbital preadipocytes. Although representing only early steps towards understanding the potential role of sFRP-1 in GO pathogenesis, these additional studies support the concept that sFRP-1 might have pathophysiologic significance in the disease.
Recent experimental evidence from several laboratories, including our own, suggests that TSHr is an important orbital autoantigen in GO.15–19 We have shown that levels of TSHr mRNA are increased in orbital adipose tissues from GO patients, and that differentiation of orbital preadipocytes increased levels of these TSHr mRNA.1,5 Additionally, in the current study we found that treatment of GO orbital cultures with sFRP-1 enhances TSHr expression. Initially perplexing, therefore, was the lack of evidence in our gene array data for increased TSHr expression in GO orbital tissues. However, this can be explained by the criteria for overexpression used in these studies. Rather than attempting to determine whether particular genes were expressed in normal or GO tissues, we queried the data based to identify genes that were overexpressed in GO compared with normal orbital tissues. For a gene to be identified, we required more than a 4-fold increase in gene expression in both of the GO pools compared with both of the normal pools. Given this stringent approach, TSHr was not identified as an overexpressed gene. While a limitation of this approach to the analysis of gene array data is that clearly relevant genes (such as TSHr) may be excluded, it does allow for the selection of the most highly and consistently overexpressed genes for further study. Of interest is that, while MacDougald and colleagues found the relative expression of TSHr to be 10- to 20-fold higher in human white adipose tissue and 3T3-L1 adipocytes than in stromal vascular tissue and 3T3-L1 preadipocytes (see complete microarray data at http://www-personal.umich.edu/~macdouga/MacDougaldLab.html), TSHr did not meet their criteria to be identified as a gene defining the adipocyte phenotype.12 In a gene array-based study by Soukas and colleagues, TSHr was similarly found to be elevated (5.5 fold) in the adipocyte fraction of adipose tissue compared with the stromal vascular fraction of this tissue.20
In conclusion, we undertook these gene array studies in order to identify potentially important genes and mechanisms not previously implicated in GO pathogenesis. Analysis of the gene profiling data and subsequent confirmatory studies led to the hypothesis that sFRP-1 might stimulate adipogenesis within the GO orbit. Future studies will be aimed at elucidating the role of sFRP-1 and the Wnt signaling system in GO, and determining the causes of high sFRP-1 levels in the GO orbit. It may be that immune mediators such as cytokines or autoantibodies stimulate overproduction of sFRP-1 by orbital preadipocyte fibroblasts in GO, and that this process results in locally enhanced adipogenesis.
Footnotes
This work was supported in part by NIH EYO8819 (to R.S.B.) from the National Eye Institute.
References
- 1.Bahn RS, Dutton CM, Natt N, Joba W, Spitzweg C, Heufelder AE. Thyrotropin receptor expression in Graves’ orbital adipose/connective tissues: potential autoantigen in Graves’ ophthalmopathy. J Clin Endocrinol Metab. 1998;83:998–1002. doi: 10.1210/jcem.83.3.4676. [DOI] [PubMed] [Google Scholar]
- 2.Valyasevi RW, Erickson DZ, Harteneck DA, Dutton C, Jyonouchi S, Bahn RS. Differentiation of human orbital preadipocyte fibroblasts induces expression of functional thyrotropin receptor. J Clin Endocrinol Metab. 1999;84:2557–2562. doi: 10.1210/jcem.84.7.5838. [DOI] [PubMed] [Google Scholar]
- 3.Starkey KJ, Janezic A, Jones G, Jordan N, Baker G, Ludgate M. Adipose thyrotrophin receptor expression is elevated in Graves’ and thyroid eye diseases ex vivo and indicates adipogenesis in progress in vivo. J Mol Endocrinol. 2003;30:369–380. doi: 10.1677/jme.0.0300369. [DOI] [PubMed] [Google Scholar]
- 4.Smith TJ. Orbital fibroblasts exhibit a novel pattern of responses to proinflammatory cytokines: potential basis for the pathogenesis of thyroid-associated ophthalmopathy. Thyroid. 2002;12:197–203. doi: 10.1089/105072502753600133. [DOI] [PubMed] [Google Scholar]
- 5.Kumar S, Coenen MJ, Scherer PE, Bahn RS. Evidence for enhanced adipogenesis in the orbits of patients with Graves’ ophthalmopathy. J Clin Endocrinol Metab. 2004;89:930–935. doi: 10.1210/jc.2003-031427. [DOI] [PMC free article] [PubMed] [Google Scholar]
- 6.Bennett CN, Ross SE, Longo KA, Bajnok L, Hemati N, Johnson K, Harrison S, MacDougald OA. Regulation of Wnt signaling during adipogenesis. J Biol Chem. 2002;277:30998–301004. doi: 10.1074/jbc.M204527200. [DOI] [PubMed] [Google Scholar]
- 7.Ross SE, Hemati N, Longo KA, Bennett PC, Lucas RL, Erickson RL, MacDougald OA. Inhibition of adipogenesis by Wnt signaling. Science. 2000;289:950–953. doi: 10.1126/science.289.5481.950. [DOI] [PubMed] [Google Scholar]
- 8.Bahn RS, Gorman CA, Johnson CM, Smith TJ. Presence of antibodies in the sera of patients with Graves’ disease recognizing a 23 kilodalton fibroblast protein. J Clin Endocrinol Metab. 1989;69:622–628. doi: 10.1210/jcem-69-3-622. [DOI] [PubMed] [Google Scholar]
- 9.Lowell BB. PPAR gamma: an essential regulator of adipogenesis and modulator of fat cell function. Cell. 1999;99:239–242. doi: 10.1016/s0092-8674(00)81654-2. [DOI] [PubMed] [Google Scholar]
- 10.Rosen ED, Sarraf P, Troy AE, Rosen ED, Sarraf P, Troy AE, Bradwin G, Moore K, Milstone DS, Spiegelman BM, Mortensen RM. PPAR gamma is required for the differentiation of adipose tissue in vivo and in vitro. Mol Cell. 1999;4:611–617. doi: 10.1016/s1097-2765(00)80211-7. [DOI] [PubMed] [Google Scholar]
- 11.Scherer PE, Williams S, Fogliano M, Baldini G, Lodish HF. A novel serum protein similar to C1q, produced exclusively in adipocytes. J Biol Chem. 1995;270:26746–26749. doi: 10.1074/jbc.270.45.26746. [DOI] [PubMed] [Google Scholar]
- 12.Ross S, Erickson, R, Gerin I, DeRose PM, Bajnok L, Longo KA, Misek DE, Kuick R, Hanash SM, Atkins KB, Andresen SM, Nebb HI, Madsen L, Kristiansen K, MacDougald OA. Microarray analyses during adipogenesis: understanding the effects of Wnt signaling on adipogenesis and the roles of liver X receptor α in adipocyte metabolism. Mol Cell Biol. 2002;22:5989–5999. doi: 10.1128/MCB.22.16.5989-5999.2002. [DOI] [PMC free article] [PubMed] [Google Scholar]
- 13.Uren A, Reichsman F, Anest V, Taylor WG, Muraiso K, Bottaro DP, Cumberledge S, Rubin JS. Secreted frizzled-related protein-1 binds directly to Wingless and is a biphasic modulator of Wnt signaling. J Biol Chem. 2000;275:4374–4382. doi: 10.1074/jbc.275.6.4374. [DOI] [PubMed] [Google Scholar]
- 14.Kawano Y, Kypta R. Secreted antagonists of the Wnt signaling pathway. J Cell Science. 2003;116:2627–2634. doi: 10.1242/jcs.00623. [DOI] [PubMed] [Google Scholar]
- 15.Heufelder AE, Dutton CM, Sarkar G, Donovan KA, Bahn RS. Detection of TSH receptor RNA in cultured fibroblasts from patients with Graves’ ophthalmopathy and pretibial dermopathy. Thyroid. 1993;3:297–300. doi: 10.1089/thy.1993.3.297. [DOI] [PubMed] [Google Scholar]
- 16.Hiromatsu Y, Sato M, Inoue Y, Koga M, Miyake I, Kameo J, Tokisawa S, Yang D, Nonaka K. Localization and clinical significance of thyrotropin receptor mRNA expression in orbital fat and eye muscle tissues from patients with thyroid- associated ophthalmopathy. Thyroid. 1996;6:553–562. doi: 10.1089/thy.1996.6.553. [DOI] [PubMed] [Google Scholar]
- 17.Feliciello A, Porcellini A, Ciullo I, Bonavolonta G, Avvedimento EV, Fenzi G. Expression of thyrotropin-receptor mRNA in healthy and Graves’ disease retro-orbital tissue. Lancet. 1993;342:337–338. doi: 10.1016/0140-6736(93)91475-2. [DOI] [PubMed] [Google Scholar]
- 18.Mengistu M, Lukes YG, Nagy EV, Burch HB, Carr FE, Lahiri S, Burman KD. TSH receptor gene expression in retroocular fibroblasts. J Endocrinol Invest. 1994;17:437–441. doi: 10.1007/BF03347732. [DOI] [PubMed] [Google Scholar]
- 19.Wakelkamp IM, Bakker O, Baldeschi L, Prummel MF, Wiersinga WM. TSH-R expression and cytokine profile in orbital tissue of active vs. inactive Graves’ ophthalmopathy patients. Clin Endocrinol (Oxf) 2003;58:280–287. doi: 10.1046/j.1365-2265.2003.01708.x. [DOI] [PubMed] [Google Scholar]
- 20.Soukas A, Socci ND, Saatkamp BD, Novelli S, Friedman J. Distinct transcriptional profile of adipogenesis in vivo and in vitro. J Biol Chem. 2001;276:34167–34174. doi: 10.1074/jbc.M104421200. [DOI] [PubMed] [Google Scholar]