Abstract
Although signaling through heterotrimeric G proteins has been extensively studied in eukaryotes, there is little information about this important signaling pathway in plants. We observed that expression of GCR1, the gene encoding the only known (but still putative) G protein-coupled receptor of Arabidopsis thaliana, is modulated during the cell cycle and during plant development. Overexpression of GCR1 in tobacco (Nicotiana tabacum) BY-2 cells caused an increase in thymidine incorporation and in the mitotic index of aphidicolin synchronized cells. Overexpression of GCR1 in Arabidopsis caused two remarkable phenotypes: seed dormancy was abolished and time to flowering was reduced. Molecular markers of these two developmental processes (phosphatase PP2A and MYB65 in germination; LFY during flowering) were up-regulated in GCR1 overexpressors. These data are consistent with the hypothesis that GCR1 may be a regulator of the cell cycle and that this regulation underlies the developmental changes observed in the GCR1 transformants.
Signaling through heterotrimeric G proteins is a highly conserved signal transduction mechanism responsible for transmitting extracellular signals to the cytoplasm in diverse eukaryotes (1). In animal cells these proteins are key regulators of cell growth and differentiation (2, 3). G protein-coupled receptors (GPCRs) are the initial components of this pathway. Activation of GPCRs results from ligand binding and triggers the initiation of a cascade within the cell, resulting in changes in cellular functions including the activation of many genes. Transduction of the signal is mediated by the α subunit or the βγ subunit complex of the heterotrimeric G protein when these components interact with their downstream targets (e.g., ion channels and adenylate cyclase). Normally, upon GPCR activation, GTP binds to Gα, resulting in a conformational change of the heterotrimeric G protein complex and subsequent synthesis or activation of second messengers through specific effectors. Gα has intrinsic GTPase activity and bound GTP is hydrolyzed to GDP.
The human genome contains >800 GPCRs, and these receptors are involved in hundreds of signal transduction pathways. On the other hand, only a single gene GCR1 (4) encoding a putative GPCR has been identified in Arabidopsis thaliana. Whether other genes encoding proteins with seven membrane-spanning helices encode GPCRs is not clear (5, 6). The A. thaliana genome has only one canonical gene (GPA1) encoding Gα (7) although at least one other Gα-like gene has been identified (8). In addition there is one Gβ (9) and two Gγ (10, 11).
It appears therefore that in the case of plant evolution this signaling pathway did not diversify to the extent as it did in animals.
Animals respond to environmental change by physiological adjustments, but plants respond primarily by changes in development. In plants, growth responses to environmental signals and to internal developmental signals involve meristems, specialized regions where cells actively divide (12). Whether and how the rate of cell division determines the overall plant development rate remains a topic of active research and discussion. Signals such as auxin, cytokinin, brassinosteroids, light, sucrose, and stress all modulate cell proliferation and development of plants (13–17). Recent evidence indicates that overexpression in tobacco BY-2 cells of the Arabidopsis GPA1 gene, which encodes the Gα-subunit of a heterotrimeric G protein, leads to a premature advance of the nuclear division cycle, whereas a gpa1 Arabidopsis null mutant has reduced cell division in its aerial parts (18). These results raise the possibility that GPCRs are regulators of the cell cycle. A different line of experimentation links the modulation of cell division to the overall growth rate of plants. Overexpression of Arabidopsis cyclin D2 led to a reduction of the G1 phase of the cell cycle and an increase in the overall growth rate of transgenic tobacco plants (19). D-type cyclins have been suggested to control both the commitment to cell division and the responses of plant cells to extracellular signals during G1 (16, 20). To investigate the possible role of GCR1 in the cell cycle and during plant development, we examined the developmental expression pattern of this gene and the effect of its overexpression on plant development. Here we report that GCR1 has a cell cycle associated expression pattern (like cyclin D2) in Arabidopsis and that its overexpression in BY-2 cells increases the incorporation of thymidine into DNA and elevates the mitotic index of the cells. Overexpression of GCR1 in Arabidopsis creates transgenic plants that have an early flowering phenotype and produce seeds that lack dormancy.
Materials and Methods
Plants.
A. thaliana ecotype Columbia was used. The gpa1–2 mutant, a knockout of Gα, was obtained from the Ohio State University Arabidopsis Stock Center. Nicotiana tabacum BY-2 cells (Bright Yellow 2) were provided by N. Raikhel (Michigan State University, East Lansing, MI).
Vector Construction, Arabidopsis, and BY-2 Cells Transformation.
The GCR1 ORF was PCR-amplified from the full-length cDNA clone, supplied by R. Hooley (University of Bristol, Bristol, U.K.) by using the following primers: 5′-TCTAGACCCGGGATGTCGGCGGTTCTCACA-3′ and 5′-ATGACTCGAGTTGCTGGTCCTTCGGTCTTG-3′. Primers were designed to generate a SmaI restriction site at the 5′ end and a XhoI site at the 3′ end of the GCR1 ORF. The amplified fragment was sequenced to assure fidelity and cloned into the binary vector pMON530. Competent Agrobacterium tumefaciens C58 (21) were transformed with the pMON-GCR1 plasmid and used to produce transgenic Arabidopsis and BY-2 cell lines. Arabidopsis plants were transformed as described by Bechtold and Pelletier (22). T1 transformants were selected by germination on medium supplemented with kanamycin sulfate (25 μg⋅ml−1) and cephotaxime (100 μg⋅ml−1). Green seedlings were transferred to soil after 2 wk of selection and grown at 21°C under a long-day regime.
BY-2 cells were transformed as described (23). The selected transgenic calli were grown in the dark on selective medium at 24°C and transferred to fresh medium every 4 wk. For all of the experiments, liquid cultures were obtained for the different transgenic lines and synchronization was achieved by a 24-h subculture in 5 mg⋅liter−1 aphidicolin as described by Combettes et al. (24).
Thymidine Incorporation and Mitotic Index.
DNA synthesis was measured by incubating 1-ml samples of the synchronized cell suspension with 1 μCi of [3H]thymidine for 20 min at 27°C in Eppendorf microtubes with gentle shaking. Cells were collected by centrifugation for 5 min at 1,800 × g, and the pellet was frozen in dry ice. DNA was extracted with Plant DNAzol Reagent (GIBCO/BRL), resuspended in water, and the [3H]radioactivity was determined with a scintillation counter.
Mitotic indices were determined at various times by counting mitotic figures in at least 400 cells stained with 0.25 mg⋅liter−1 Hoechst dye and 0.2% Triton X-100 by using a UV light microscope.
Northern Blot and Reverse Transcription–PCR (RT-PCR).
Total RNA was prepared from plants at different developmental stages and BY-2 cell pellets by using the RNeasy Plant minikit (Qiagen, Chatsworth, CA). To remove contaminating genomic DNA, the samples were treated with DNAase I. Two micrograms of total RNA was annealed to oligo(dT)12–18 and reverse-transcribed by using Maloney-murine-leukemia virus (M-MLV) RT (GIBCO) to obtain cDNA. The GCR1 ORF, a 300-bp fragment from the LFY-coding region, and 800 bp of the protein phosphatase PP2A gene were PCR-amplified from total cDNA, gel-purified, and sequenced to assure accuracy, before being labeled with [32P]dCTP (Rediprime II, Amersham Pharmacia) and used as probes for Northern and Southern blot experiments. Northern analysis was performed as described (25). Relative quantitative RT-PCR was performed by using as internal standard the 18S ribosomal RNA primers/competimers (Ambion) in a ratio of 3:7. All RT-PCRs were verified through Southern blot experiments by using specific probes. The sequences of the gene-specific primers used for RT-PCR are the following: GCR1(A), 5′-ATGTCGGCGGTTCTCACAGC-3′; GCR1(Z), 5′-GTAACGACCAGGAGCCAGAATTC-3′; LFY(A), 5′-GACGCCGTCATTTGCTACTCTC-3′; LFY(Z), 5′-CGTCGTCATCCTCACCTTCGTT-3′; 5PP2A(A), 5′-ATGAGCAGATCTCGCAG-3′; PP2A(Z), 5′-TCCTGACCAAATGTATATCC-3′; AtMY65(A), 5′-CACGGCGAGGGTAACTGGAA-3′; AtMY65(Z), 5′-TGAAGGGAGCTCCAGCTTCA-3′; AtCYCD2(A), 5′-ATGGCTGAGAATCTTGCTTGT-3′; and AtCYCD2(Z), 5′-TCATTGTTTTCTCCTCCTCTT-3′.
Membrane Preparation and GTPγ 35S Assay.
Leaves detached from 4-wk-old plants or BY-2 cell pellets were homogenized in extraction buffer (50 mM Tris⋅HCl/1% β-mercaptoethanol/protease inhibitors, pH 7.4) containing 12% (wt/vol) sucrose. The membrane fraction was obtained by centrifugation at 100,000 g for 60 min. Membranes were suspended in GTPγS-binding assay buffer (20 mM Hepes/100 mM NaCl/10 mM MgCl2, pH 7.4), and protein concentration was determined by the Bradford assay (26).
Fifty microliters of membrane suspension (protein concentration of 200 μg⋅ml−1) was incubated in triplicate with GTPγ35S (final concentration 30 pM) in a reaction volume of 100 μl. The reaction was carried on for 1 h at room temperature (27). The membrane preparations were then collected by centrifugation at 4,000 × g for 15 min, and the supernatant was removed by aspiration. The amount of bound radioactivity was determined by using a Wallac Microbeta Trilux (Perkin–Elmer) spectrometer and the radioactivity bound to a control well (no microsomes) was subtracted.
Results
Expression of GCR1 Is Developmentally Regulated.
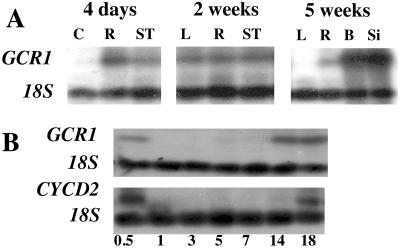
In their first study on the expression of GCR1, Plakidou-Dymock et al. (4) noted that this gene is expressed at such low levels that the signal cannot be detected by Northern hybridization. Using RT-PCR with primers that distinguish between mRNA and DNA, we found expression in various plant organs, with the highest expression in flowering buds and small siliques of 5-wk-old plants. In 4-d-old seedlings, we observed high expression in the small roots, lower expression in the hypocotyl, and no expression in the cotyledons (Fig. 1A). By 2 wk there was similar expression in the various organs (leaves, roots, and shoot tip), and by 5 wk the expression in the leaves had disappeared, the expression in the roots was still present, and there was high expression in the flower buds and young siliques (Fig. 1A).
Figure 1.
(A) Relative quantitative PCR of GCR1 expression in Arabidopsis at different developmental stages. RNA was prepared from cotyledons (C), roots (R), shoot tips (ST), leaves (L), buds (B), and 3-mm-long siliques (Si). (B Upper) Time course of GCR1 expression in roots of 2-d-old aphidilcolin synchronized Arabidopsis seedlings. (Lower) CYCD2 expression in the same seedlings. This expression pattern of CYCD2 confirms that mitosis has been synchronized. 18s rRNA used as relative RT-PCR internal standard.
High expression in the meristematic regions and indications in the literature that G proteins may play a role in the cell cycle (18) prompted us to test whether GCR1 is expressed at specific times during the cell cycle. Using aphidicolin synchronized Arabidopsis root tips, we compared the expression of GCR1 to that of cyclin D2 (CYCD2), a cell cycle associated regulator of protein kinase activity that is expressed in early G1. Arabidopsis seedlings that had just germinated, as determined by the emergence of the root tip, were transferred for 24 h to aphidicolin, which blocks the cell division cycle in the early S phase. The cell cycle blocker was then removed and the seedlings were allowed to grow in normal medium. GCR1 expression was found to be high immediately after the removal of the block, disappeared at 1 h, to reappear 14 h later (Fig. 1B). The expression of CYCD2 showed a similar pattern of expression, except that it did not reappear until 18 h after removal of the aphidicolin. Mitosis normally occurs 6–8 h after removing the aphidicolin block (28).
Overexpression of GCR1 Increases Mitotic Index of BY-2 Cells.
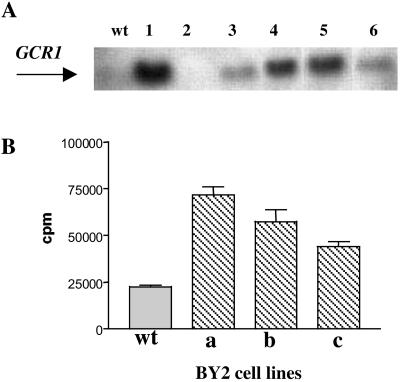
The modulation of GCR1 during the cell cycle indicated to us that it might be instructive to determine the effect of overexpression of GCR1 on the cell cycle and the expression of cell cycle-associated genes. For this line of experiments, we first used a tobacco (Nicotiana tabacum) cell line (BY-2) that is easily synchronizable and has been used extensively for cell cycle studies (29, 24). Transformation of BY-2 cells with the Arabidopsis GCR1 gene driven by the CaMV35S promoter yielded cell lines that had different levels of GCR1 mRNA as determined by Northern blot (Fig. 2A).
Figure 2.
(A) Northern blot analysis of GCR1 mRNA abundance. Each lane contains 10 μg of RNA from six different BY-2-transformed lines (1–6). GCR1-coding sequence was used as probe. (B) GTPγ35S-binding assay. Receptor activity was measured in membrane preparations by determining the binding of the nonhydrolyzable GTP analog GTPγ35S. Binding of GTPγ35S in Arabidopsis T2 plants overexpressing GCR1 (hatched bar) was significantly higher compared to the wt Arabidopsis plant (open bar). Error bars indicate SD.
To determine whether the transformed cell lines contained higher levels of active receptor, we assayed the binding of GTPγS by microsomes by using the three lines that had the highest level of GCR1 expression. G protein coupling causes GPCR activation and the level of activation can be measured by using GTPγ35S binding because this compound cannot be hydrolyzed to GDP by the intrinsic GTPase activity of Gα. The bound radioactivity is a measure of the abundance of Gα bound to active GPCR (30, 27). The amount of GTPγS bound to microsomes from the transformed BY-2 lines was 2–3 times higher than that bound to microsomes from wild-type (wt) BY-2 cells (Fig. 2B). The results are a strong indication that the transformed cells contained more active GCR1 than wt cells and that this GCR1 was coupled to Gα.
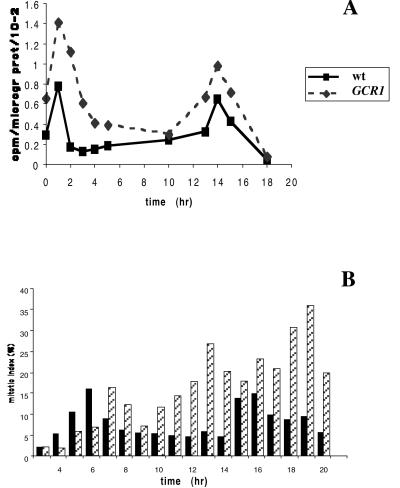
To determine the effect of this greater abundance of active GCR1 on the cell cycle, we synchronized wt and GCR1 overexpressing BY-2 cells with aphidicolin for 24 h, and after removal of the cell cycle blocker, we measured thymidine incorporation (Fig. 3A) and counted mitotic indices (Fig. 3B). In wt BY-2 cells, thymidine incorporation showed two clear peaks: one at 1 h after removal of the aphidicolin and a second one at 15 h. This result is consistent with a block by aphidicolin in early S phase so that DNA synthesis starts immediately after the removal of the block. The cell cycle under these conditions is about 13–14 h. In the GCR1-overexpressing cells, there was a considerable increase in thymidine incorporation, not only during the times of peak incorporation, but at other times as well, suggesting that the rate of DNA synthesis may be enhanced in these cells.
Figure 3.
(A) Thymidine incorporation by aphidilcolin-synchronized wt and GCR1 overexpressing BY-2 cells. The experiment was carried out with duplicate cell samples and repeated three times. (B) Mitotic indices of the same cultured cells; wt = solid bars; hatched bars = GCR1-overexpressing cells The experiment was carried out with duplicate cell samples and repeated three times. Error bars indicate SD.
Examination of the mitotic index in the wt cells showed peaks of mitoses at 6 h and 19 h (Fig. 3B), in each case ≈5 h after the S phase. Mitotic indices were higher in the GCR1-transformed cell lines, with peaks at 5–6 h and 19 h. There was little difference in the mitotic index associated with the first peak, but at later times, the mitotic index was consistently higher in the GCR1-transformed cells.
Overexpression of GCR1 in A. thaliana Abolishes Seed Dormancy.
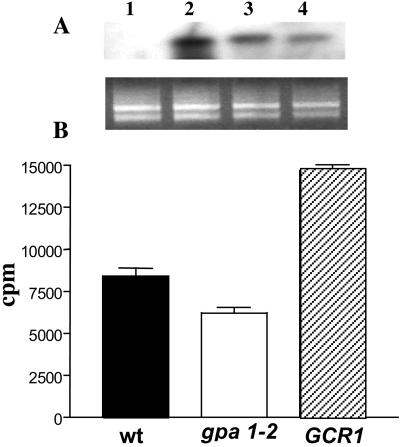
Having obtained this interesting result, we overexpressed GCR1 under the control of the CaMV35S promoter in Arabidopsis plants and checked the expression of GCR1 by using Northern blot hybridization. The results showed, as expected, different levels of expression in the transformed lines (Fig. 4A). We prepared microsomes from wt and GCR1-transformed plants and determined GTPγ35S binding (Fig. 4B). We included microsomes from the gpa1–2 mutant of Arabidopsis, a Gα knockout that has no Gα protein (18). The results extend those shown in Fig. 2. Overexpression of GCR1 resulted in more GTPγ35S binding, suggesting more active GCR1 coupled to Gα at the plasma membrane. Binding of GTPγ35S to the membranes of the gpa1–2 mutant was less than in wt, suggesting that total binding in wt membranes reflects binding to GPA1 (a Gα protein), but possibly also to other Gα proteins (8) or to small G proteins (31). Overexpression of GCR1 in gpa1 could be used to demonstrate whether GPA1 is coupled to GCR1.
Figure 4.
(A Upper) Northern blot analysis of GCR1 mRNA abundance. Each lane contains 10 mg of RNA from 4-wk-old wt plants (lane 1) or from three different Arabidopsis T2 plants (lanes 2–4) grown at 21°C under a long-day regime. GCR1 ORF was used as probe. (Lower) Ethidium bromide-stained gel. (B) GTPγ35S-binding assay. Receptor activity was measured in membrane preparations by determining the binding of the nonhydrolyzable GTP analog GTPγ35S. Arabidopsis wt plant (solid bar), GCR1 overexpressing line (hatched bar), and gpa1–2 line, a Gα knockout (open bar).
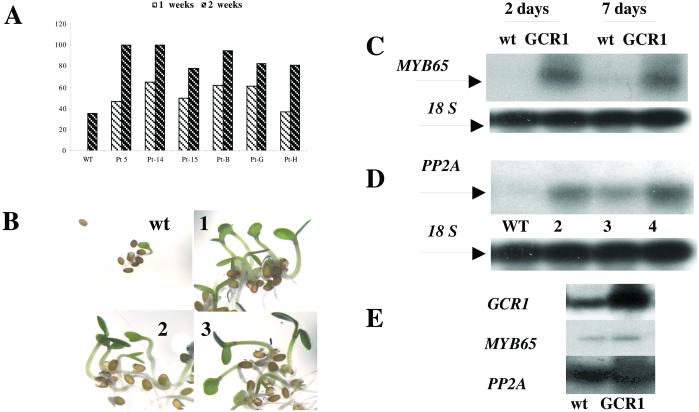
Arabidopsis seeds require either stratification (a cold period) or after-ripening for prompt germination but the seeds of the overexpressing lines appeared to lack dormancy. When freshly harvested wt seeds were sown on agar plates, few (1–2%) germinated within the first 7 d; even after 14 d only 35% had germinated in the experiment shown in Fig. 5A. However, freshly harvested seeds from the GCR1-transformed plants behaved differently: 40–60% germinated in the first week and 80–100% within the second week (Fig. 5A). Seeds from both wt and GCR1 transformants germinated promptly after stratification (not shown). If the seeds were allowed to after-ripen for 3 wk, differences in percentage of germination were less marked but still present (data not shown). Fig. 5B shows the appearance of 1-wk-old seedlings grown from freshly harvested seeds of wt and three transformed lines. The GCR1 overexpressors had already grown into robust seedlings, but the wt seeds had not yet germinated. The expression of GCR1 was monitored by relative quantitative RT-PCR. We detected no expression of GCR1 in wt at 2, 5, or 7 d but strong expression in the transformed seedlings (data not shown).
Figure 5.
(A) Percentage germination after 1 and 2 wk of seeds sown immediately after collection from dry pods of wt Arabidopsis and six different GCR1-overexpressing lines. Note that after 1 wk no wt seeds had germinated. (B) Arabidopsis seeds and seedlings of wt and three different T3 lines overexpressing GCR1 (1, 2, and 3); seeds were collected at maturity and immediately sown on germination medium and kept at 21°C under a long-day regime. After 7 d the seedlings were photographed. (C) Relative competitive RT-PCR of MYB65 expression in 2- and 7-d-old wt plants and a T3 line of overexpressing GCR1 plants; 18s rRNA used as relative RT-PCR internal standard. (D) Relative competitive RT-PCR of the regulatory subunit of protein phosphatase 2A (PP2A) expression in wt (lane 1) and in three different T3 lines overexpressing GCR1. RNA was prepared from 7-d-old plants. 18s rRNA used as relative RT-PCR internal standard. (E) Expression of GCR1, MYB65, and PP2A in 2-wk-old plants measured by RT-PCR in wt and a GCR1-overexpressing line.
Overexpression of GCR1 Enhances the Expression of Germination-Associated Genes.
Seed dormancy and germination are regulated by gibberellins (GAs) and abscisic acid, and release from dormancy is accompanied by changes in expression of many genes (32, 33). In a number of species including Arabidopsis, seed dormancy can be overcome by GA. In barley (Hordeum vulgare), where the control of germination by GA and GA-induced gene expression have been studied for many years, the expression of such genes depends on the transcription factor GAMYB. The expression of GAMYB is itself GA-dependent (34, 35). To find the closest Arabidopsis homolog of GAMYB, we performed a blast search of the Arabidopsis database and identified MYB9, which is identical to AtMYB65 (partial clone). Using RT-PCR we isolated a full-length AtMYB65 cDNA and sequenced it to verify its identity to MYB9 (data not shown). When the expression of AtMYB65 measured by RT-PCR in wt was compared to that in GCR1-transformed plants after 2 and 7 d of germination, we found high expression of AtMYB65 in the transformed lines but not in wt plants (Fig. 5C).
A preliminary report, made by Gonzales-Paz et al. at the Plant Growth Regulator Conference in Brno, Czech Republic, in the summer of 2001,§ indicated that release from dormancy in beechnut is accompanied by the activation of the gene encoding the catalytic subunit of the serine/threonine phosphatase PP2A. PP2A also has been implicated in GA responses during germination (36). Using RT-PCR, we found no detectable expression of the gene for the catalytic subunit of PP2A in the wt seeds 7 d after sowing, but expression was easily detected in the GCR1-transformed lines at this time (Fig. 5D). However, 2 wk after sowing, when a substantial number of wt seeds had formed plantlets, we found expression of GCR1, AtMYB65, and the PPA2 catalytic subunit gene in wt and GCR1-transformed lines (Fig. 5E). These results are consistent with the interpretation that GCR1 initiates a cascade that leads to germination in seeds that would otherwise be dormant.
Overexpression of GCR1 Accelerates Flowering and the Expression of Genes that Control Flowering.
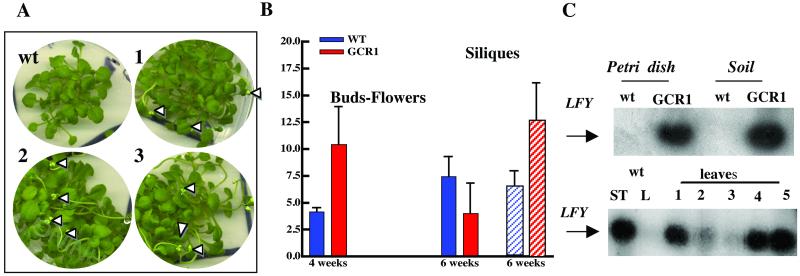
Arabidopsis is a long-day plant that bolts and flowers under the proper daylength conditions. Under short days, flowering is delayed. For the experiments described here all seeds were first exposed to a cold period so that they would germinate synchronously. After 4 wk of growth in Petri dishes and under long-day conditions, we observed many fully formed flowers in the GCR1-transformed plants, but wt plants had only a few flowers at this time (Fig. 6A). A quantitation of this phenomenon with plants grown in soil (Fig. 6B) shows that at 4 wk there were twice as many flowers per plant in the GCR1 overexpressing lines as in wt. By 6 wk the GCR1-transformed plants had fewer flowers but more than twice as many siliques as wt plants. Thus the entire reproductive process occurred earlier in those plants.
Figure 6.
(A) wt Arabidopsis plants and plants of three different T3 lines overexpressing GCR1 (1, 2, and 3) were sown on germination medium in Petri dishes, stratified, and kept for 4 wk at 21°C under a long-day regime. White arrowheads indicate flowers. (B) Number of buds (solid bars) and siliques (hatched bars) counted after 4 and 6 wk in 60 wt plants and 60 GCR1-overexpressing plants (six different lines) grown at 21°C under a long-day regime. Error bars indicate SD. (C Upper) RT-PCR of LEAFY (LFY) expression in 1-wk-old seedlings of Arabidopsis wt grown in a Petri dish (lane 1) or in soil (lane 3) and in a GCR1-overexpressing Arabidopsis line grown in a Petri dish (lane 2) or in soil (lane 4). (Lower) RT-PCR of LFY expression in wt and in five different T3 lines overexpressing GCR1. RNA was prepared from shoot tips (ST) or leaves (L) collected from 4-wk-old wt and from leaves of different overexpressing lines.
Flowering in Arabidopsis is under the control of LEAFY (LFY), a meristem identity gene that is activated by GA (37–39). LFY is expressed in the meristem, and expression increases normally after 2 wk of growth (40). We found high levels of LFY expression in 7-d-old seedlings of GCR1-transformed lines, whether grown from stratified seeds in a Petri dish or in soil (Fig. 6C Upper), whereas expression was still undetectable in wt plants. After 4 wk (Fig. 6C Lower) LFY was expressed in the buds of wt plants but not in the leaves (as expected). In the transformed lines LFY was expressed in the shoot tips (not shown) and also ectopically in the leaves. Variation in the expression of LFY in the leaves may reflect the level of expression of GCR1, including possible silencing, or the amount of active GCR1 protein at the plasma membrane.
Discussion
Based on indirect approaches, GPCR signaling has been implicated in a number of processes in plants, but there is as yet little direct information about the function of this pathway in plants. So far only one GPCR gene, GCR1, has been found in the Arabidopsis genome (5). Here we show that GCR1 is expressed in a developmentally specific manner and is regulated during the cell cycle. We demonstrate that overexpression of the GCR1 receptor results in greater binding of GTPγS to isolated membranes, providing evidence that this putative receptor is coupled to a GTP-binding protein (presumably Gα). We also show that overexpression in BY-2 tobacco cells increases DNA synthesis and the mitotic index of these cultured cells, whereas overexpression in Arabidopsis plants produces two interesting developmental phenotypes: loss of seed dormancy and shortening of time to flower and fruit set.
It may be too early to draw these observations together into one overarching hypothesis, but it is tempting to suggest that GCR1 plays a role in the regulation of the cell cycle and that the developmental consequences of its overexpression are the result of a modulation of the cell cycle. The results with the aphidicolin synchronized Arabidopsis seedlings show that GCR1 is expressed immediately after this blocker is removed and again 13 h later. These are the times when DNA synthesis peaks in these synchronized cells. Expression of GCR1 precedes the expression of CYCD2, a cell cycle-regulated gene that is expressed in early G1 (16). In BY-2 cells, overexpression increases incorporation of thymidine into DNA, suggesting higher levels of DNA synthesis, which then support higher levels of mitotic activity observed between 6 and 19 h after removal of the block. Sucrose has been shown to trigger the cell cycle in plant (16) and we have found that sucrose also triggers transcription of GCR1 (data not shown). Because GCR1 is still a putative receptor whose ligand and effector(s) remains to be identified, we cannot yet test whether this receptor is a cell cycle regulator.
The results described here for the phenotypes of the GCR1 overexpressing Arabidopsis plants are consistent with the interpretation that G protein-coupled signaling may be limiting for certain developmental stages. Furthermore, the GCR1 transformants behaved as if they were more sensitive to their endogenous GAs and/or less sensitive to their endogenous abscisic acid. GA is involved in the breaking of dormancy and the induction of flowering and both processes were accelerated in the GCR1 transformants. A number of other studies also support the interpretation that GA signaling is linked to GPCR signaling. For example, the dwarf rice mutant d1, which is a Gα null, has short internodes and is GA insensitive (41). The aleurone cells of d1 produce very little α-amylase when exposed to GA, and the induction of GAMYB in aleurone cells is greatly attenuated in the mutant. We observed that GCR1 overexpression turns on MYB65, the Arabidopsis homolog of GAMYB. We also have found that germination of the seeds from GCR1 overexpressing lines is less sensitive to exogenous abscisic acid than seeds from control plants (data not shown). This lower sensitivity could simply be caused by an increased sensitivity to GA. It is curious in this respect that the stomatal response of gpa1 is less sensitive to abscisic acid (42).
The interpretation of an increase in mitotic index is never straightforward. It doesn't necessary mean that the cell cycle is shorter. Rather, the increase may be an indicator that M is longer and that one or more of the other phases (G1, S, or G2) are shorter. However, such compensation was not observed when CycD2 was expressed in tobacco plants (19). Overexpression of GPA1 from a regulated promoter was shown to lead to excessive cell division in meristem and the initiation of additional meristems (18). At which point the GCR1-signaling pathway interacts with GA signaling might be identified in the future by the isolation of mutants in those pathways and/or by biochemical and pharmacological approaches. Further insights into the mechanism of GCR1 action will come from crossing these overexpressing plants with various hormone insensitive mutants. We suggest on the basis of our data that it will be fruitful to identify chemicals (agonists and inverse agonists) that modulate GCR1 activity in plants with the goal of modifying growth and development in specific ways.
Acknowledgments
We thank D. Behan, W. Thomsen, and A. Jones for stimulating discussions.
Abbreviations
- GPCR
G protein coupled receptor
- GA
gibberellic acid
- wt
wild type
- RT-PCR
reverse transcription–PCR
Footnotes
Gonzàles-Paz, M., Nicolas, C., Lorenzo, O. & Nicolas, G., Plant Growth Regulator Conference, July 1–6, 2001, Brno, Czech Republic.
References
- 1.Simon M I, Strathmann M P, Gautam N. Science. 1991;252:802–808. doi: 10.1126/science.1902986. [DOI] [PubMed] [Google Scholar]
- 2.Offermanns S. Oncogene. 2001;20:1635–1642. doi: 10.1038/sj.onc.1204189. [DOI] [PubMed] [Google Scholar]
- 3.Schwindinger W F, Robishaw J D. Oncogene. 2001;20:1653–1660. doi: 10.1038/sj.onc.1204181. [DOI] [PubMed] [Google Scholar]
- 4.Plakidou-Dymock S, Dymock D, Hooley R. Curr Biol. 1998;8:315–324. doi: 10.1016/s0960-9822(98)70131-9. , and erratum (1998) 11, 535. [DOI] [PubMed] [Google Scholar]
- 5.Ellis B E, Miles G P. Science. 2001;292:2022–2203. doi: 10.1126/science.1062790. [DOI] [PubMed] [Google Scholar]
- 6.Devoto A, Piffanelli P, Nilsson I M, Willin E, Panstruga R, von Heijne G, Schulze-Lefert P. J Biol Chem. 1999;274:34993–35004. doi: 10.1074/jbc.274.49.34993. [DOI] [PubMed] [Google Scholar]
- 7.Ma H, Yanofsky M F, Meyerowitz E M. Proc Natl Acad Sci USA. 1990;87:3821–3825. doi: 10.1073/pnas.87.10.3821. [DOI] [PMC free article] [PubMed] [Google Scholar]
- 8.Yuh-Ru J L, Assmann S M. Plant Mol Biol. 1999;40:55–64. doi: 10.1023/a:1026483823176. [DOI] [PubMed] [Google Scholar]
- 9.Weiss C A, Garnaat C W, Mukai K, Hu Y, Ma H. Proc Natl Acad Sci USA. 1994;91:9554–9558. doi: 10.1073/pnas.91.20.9554. [DOI] [PMC free article] [PubMed] [Google Scholar]
- 10.Mason G M, Botella J R. Proc Natl Acad Sci USA. 2000;97:14784–14788. doi: 10.1073/pnas.97.26.14784. [DOI] [PMC free article] [PubMed] [Google Scholar]
- 11.Mason G M, Botella J R. Biochem Biophys Acta. 2001;1520:147–153. doi: 10.1016/s0167-4781(01)00262-7. [DOI] [PubMed] [Google Scholar]
- 12.Haecker A, Laux T. Curr Opin Plant Biol. 2001;4:441–446. doi: 10.1016/s1369-5266(00)00198-9. [DOI] [PubMed] [Google Scholar]
- 13.Francis D. In: Inherent Variation in Plant Growth. Lambers H, Van Vuuren M-M-I, editors. Leiden, The Netherlands: Backhuys; 1998. pp. 5–20. [Google Scholar]
- 14.Hooley R. Plant Physiol Biochem. 1999;37:393–402. [Google Scholar]
- 15.Okamoto H, Matsui M, Deng X-W. Plant Cell. 2001;13:1639–1652. doi: 10.1105/TPC.010008. [DOI] [PMC free article] [PubMed] [Google Scholar]
- 16.Riou-Khamlichi C, Menges M, Healy S J, Murray J A. Mol Cell Biol. 2000;20:4513–4521. doi: 10.1128/mcb.20.13.4513-4521.2000. [DOI] [PMC free article] [PubMed] [Google Scholar]
- 17.Beffa R, Szell M, Meuwly P, Pay A, Vogeli-Lange R, Metraux J P, Neuhaus G, Meins F, Jr, Nagy F. EMBO J. 1995;14:5753–5761. doi: 10.1002/j.1460-2075.1995.tb00264.x. [DOI] [PMC free article] [PubMed] [Google Scholar]
- 18.Ullah H, Chen J-G, Young J C, Im K-H, Sussman M R, Jones A M. Science. 2001;292:2066–2069. doi: 10.1126/science.1059040. [DOI] [PubMed] [Google Scholar]
- 19.Cockcroft C E, den Boer B G W, Healy S J M, Murray J A H. Nature (London) 2000;405:575–579. doi: 10.1038/35014621. [DOI] [PubMed] [Google Scholar]
- 20.Riou-Khamlichi C, Huntley R, Jacqmard A, Murray J A H. Science. 1999;283:1541–1544. doi: 10.1126/science.283.5407.1541. [DOI] [PubMed] [Google Scholar]
- 21.Lazo G R, Stein P A, Ludwig R A. Biotechnology. 1991;10:963–967. doi: 10.1038/nbt1091-963. [DOI] [PubMed] [Google Scholar]
- 22.Bechtold N, Pelletier G. Methods Mol Biol. 1998;82:259–266. doi: 10.1385/0-89603-391-0:259. [DOI] [PubMed] [Google Scholar]
- 23.An G. Plant Physiol. 1985;79:568–570. doi: 10.1104/pp.79.2.568. [DOI] [PMC free article] [PubMed] [Google Scholar]
- 24.Combettes B, Reichheld J P, Chabouté M E, Philipps G, Shen W-H, Chaubet-Gigot N. Methods Cell Sci. 1999;21:109–121. doi: 10.1023/a:1009880705257. [DOI] [PubMed] [Google Scholar]
- 25.Sambrook J, Fritsch E F, Maniatis T. Molecular Cloning: A Laboratory Manual. 2nd Ed. Plainview, NY: Cold Spring Harbor Lab. Press; 1989. pp. 743–750. [Google Scholar]
- 26.Bradford J M. Anal Biochem. 1976;72:248–257. doi: 10.1016/0003-2697(76)90527-3. [DOI] [PubMed] [Google Scholar]
- 27.Newman-Tancredi A, Gavaudan S, Conte C, Chaput C, Touzard M, Verriele L, Audinot V, Millan M J. Eur J Pharmacol. 1998;355:245–256. doi: 10.1016/s0014-2999(98)00483-x. [DOI] [PubMed] [Google Scholar]
- 28.Dolezel J, Cihalikova J, Weiserova J, Lucretti S. Methods Cell Sci. 1999;21:95–107. doi: 10.1023/a:1009876621187. [DOI] [PubMed] [Google Scholar]
- 29.Nagata T, Kumagai F. Methods Cell Sci. 1999;21:123–127. doi: 10.1023/a:1009832822096. [DOI] [PubMed] [Google Scholar]
- 30.Ma H. Plant Mol Biol. 1994;26:1611–1636. doi: 10.1007/BF00016493. [DOI] [PubMed] [Google Scholar]
- 31.Bischoff F, Molendijk A, Rajendrakumar C S V, Palme K. Cell Mol Life Sci. 1999;55:233–256. doi: 10.1007/s000180050287. [DOI] [PMC free article] [PubMed] [Google Scholar]
- 32.Debeaujon I, Koornneef M. Plant Physiol. 2000;122:415–424. doi: 10.1104/pp.122.2.415. [DOI] [PMC free article] [PubMed] [Google Scholar]
- 33.Steber C-M, Cooney S E, McCourt P. Genetics. 1998;149:509–521. doi: 10.1093/genetics/149.2.509. [DOI] [PMC free article] [PubMed] [Google Scholar]
- 34.Gubler F, Raventos D, Keys M, Watts R, Mundy J, Jacobsen J-V. Plant J. 1999;17:1–9. doi: 10.1046/j.1365-313x.1999.00346.x. [DOI] [PubMed] [Google Scholar]
- 35.Gomez-Cadenas A, Zentella R, Sutliff T D, Ho T-H. Physiol Plant. 2001;112:211–216. doi: 10.1034/j.1399-3054.2001.1120209.x. [DOI] [PubMed] [Google Scholar]
- 36.Chang M, Wang B, Chen X, Wu R. Plant Mol Biol. 1999;39:105–115. doi: 10.1023/a:1006152223183. [DOI] [PubMed] [Google Scholar]
- 37.Simon R, Igeno M I, Coupland G. Nature (London) 1996;384:59–62. doi: 10.1038/384059a0. [DOI] [PubMed] [Google Scholar]
- 38.Nilsson O, Lee I, Blazquez M A, Weigel D. Genetics. 1998;150:403–410. doi: 10.1093/genetics/150.1.403. [DOI] [PMC free article] [PubMed] [Google Scholar]
- 39.Blazquez M-A, Green R, Nilsson O, Sussman M-R, Weigel D. Plant Cell. 1998;10:791–800. doi: 10.1105/tpc.10.5.791. [DOI] [PMC free article] [PubMed] [Google Scholar]
- 40.Blazquez M A, Soowal L N, Lee I, Weigel D. Development (Cambridge, UK) 1997;124:3835–3844. doi: 10.1242/dev.124.19.3835. [DOI] [PubMed] [Google Scholar]
- 41.Ueguchi-Tanaka M, Fujisawa Y, Kobayashi M, Ashikari M, Iwasaki Y, Kitano H, Matsuoka M. Proc Natl Acad Sci USA. 2000;97:11638–11643. doi: 10.1073/pnas.97.21.11638. [DOI] [PMC free article] [PubMed] [Google Scholar]
- 42.Wang X Q, Ullah H, Jones A M, Assmann S M. Science. 2001;292:2070–2072. doi: 10.1126/science.1059046. [DOI] [PubMed] [Google Scholar]


