

Abstract
Purpose
Clinical observations suggest a correlation between metabolic syndrome (Mets) and overactive bladder (OAB). However, the absence of evidence for a direct causal relationship between them limits the development of effective treatment strategies. This study aimed to explore the association between Mets and OAB in the U.S. population and elucidate their causal relationships.
Methods
A cross-sectional study was conducted using data from the 2005–2018 National Health and Nutrition Examination Survey (NHANES). OAB symptoms were assessed using the OAB symptom score (OABSS), and Mets was diagnosed based on the NCEP-ATP III criteria. Multivariate logistic regression was used to evaluate the relationship between Mets and OAB. Subgroup analyses and interaction tests were performed to assess the consistency of this association. Mendelian randomization (MR) analysis was conducted to investigate the causal effects of Mets components or risk factors on OAB symptoms, including bladder calcification /contracture/ overactivity (BCCO) and urinary frequency/incontinence (UFI).
Results
The cross-sectional study involved 7,596 participants. After adjusting for covariates, individuals with Mets had a significantly higher risk of OAB (OR: 2.27, 95% CI: 1.89–2.72, p = 0.035). Gender subgroup analysis revealed that females had 51% higher odds of developing OAB compared to the reference group (OR: 1.51, 95% CI: 1.13–2.02, p = 0.008), while this association was not observed in males (OR: 0.95, 95% CI: 0.63–1.43, p > 0.05). MR analysis found no significant causal relationship between Mets and OAB symptoms; however, certain Mets components or risk factors, including BMI, waist circumference (WC), fasting blood glucose (FBG), and hypertension, were associated with an increased risk of OAB. The sensitivity analysis excluded the influence of potential heterogeneity and horizontal pleiotropy.
Conclusion
This study highlighted a positive association between Mets and OAB in the U.S. population, with significant gender differences. Furthermore, it provided evidence suggesting a potential causal role of Mets components in the development of OAB and highlighted the importance of therapeutic strategies targeting Mets for managing OAB symptoms.
Supplementary Information
The online version contains supplementary material available at 10.1186/s13098-025-01883-6.
Keywords: Metabolic syndrome, Overactive bladder, Obesity, Diabetes mellitus, Hypertension
Introduction
Overactive bladder (OAB) is a heterogeneous symptom complex characterized by urgency, often accompanied by increased urinary frequency or nocturia, with or without urgency urinary incontinence, in the absence of urinary tract infection or other identifiable pathological changes [1]. In addition to its direct physical symptoms, OAB disrupts sexual health, significantly impacts quality of life, and is associated with an increased prevalence of psychological disorders, such as anxiety and depression [2, 3]. According to the findings of the EPIC study conducted across five countries/regions, the overall prevalence of OAB is approximately 11.8% and increased with age [4]. Given the global context of population aging, the disease burden associated with OAB is expected to become increasingly severe. Neurogenic causes, myogenic causes, aging, and inflammation are potential contributors to OAB [5]; however, its exact pathophysiological mechanisms remain unclear.
Metabolic syndrome (Mets) is a cluster of cardiovascular risk factors, including impaired glucose tolerance, central obesity, hypertension, and dyslipidemia. Recent studies suggest that Mets and OAB may share similar pathophysiological mechanisms [6], such as autonomic and peripheral neuropathies, chronic ischemia, and a pro-inflammatory state. Based on this, some research suggests that Mets may contribute to the underlying mechanisms of OAB development. Previous studies have examined the association between Mets and OAB in population cohorts from Turkey [7], the United Kingdom [8], Israel [9] and Croatia [10]. However, studies investigating the connection between Mets and OAB in the U.S. population remain limited, and there is no consensus on the effect of individual Mets components on OAB.
In this study, we utilized data from the National Health and Nutrition Examination Survey (NHANES) spanning 2005 to 2018 to investigate the potential association between MetS and OAB in the U.S. population. Additionally, to address potential confounding inherent in observational studies, we employed summary-level data from GWAS and conducted Mendelian randomization (MR) analysis to evaluate the causal relationship between MetS, its components, and OAB.
Materials and methods
Study population in NHANES
Data for this cross-sectional study were collected from NHANES between 2005 and 2018 (https://www.cdc.gov/nchs/nhanes/). The target sample for the OAB questionnaire included adults aged 20 years and older, with the following inclusion criteria: (1) Participants aged 20 years and above. (2) Completion of assessments for urinary incontinence and nocturia. (3) Completion of assessments or self-reported for Mets. (4) Completion of surveys covering other concomitant variables that may influence OAB. Exclusion criteria included missing data related to any of the above criteria, refusal to answer, or responses of “I don’t know.” The screening process is summarized in Fig. 1.
Fig. 1.

The screening results of NHANES. OABSS, overactive bladder symptom score; Mets, metabolic syndrome
Definition of OAB
OAB was defined as an overactive voiding reflex characterized by urgency urinary incontinence (UUI) and nocturia. All information was obtained through questionnaires, which were conducted by trained researchers through face-to-face interviews. Urinary incontinence and nocturia were assessed by using three questions from the NHANES survey (KIQ044, KIQ450, and KIQ480): (1) “During the past 12 months, have you leaked or lost control of even a small amount of urine with an urge or pressure to urinate and you could not get to the toilet fast enough?” (2) “How frequently does this occur?”3) “During the past 30 days, how many times per night did you most typically get up to urinate, from the time you went to bed at night until the time you got up in the morning?” Finally, the Overactive Bladder Symptom Score (OABSS) was used to identify OAB [11], as detailed in Supplementary Table S1. In this study, participants with an OABSS total score ≥ 3 were considered to have OAB.
Definition of Mets
In this study, Mets was assessed using the National Cholesterol Education Program-Adult Treatment Panel III criteria [12]. Mets is characterized by the presence of at least three of the following five conditions:1) waist circumference (WC) ≥ 102 cm in males or ≥ 88 cm in females; 2) BP ≥ 130/85 mmHg or the use of antihypertensive therapy; 3) high-density lipoprotein cholesterol (HDL-C) < 40 mg/dL in males and < 50 mg/dL in females, or drug treatment; 4) serum triglycerides (TG) ≥ 150 mg/dL, or drug treatment; 5) fasting blood glucose (FBG) ≥ 100 mg/dL or use of glucose-lowering medications.
Covariates used in NHANES
The variables in this study were adjusted to account for potential confounding factors: age, gender, body mass index (BMI), race/ethnicity (non-Hispanic White, non-Hispanic Black, Mexican American, other Hispanic and other ethnicity), education level (lower than high school, high school and above), family income-to-poverty ratio (< 1.3, 1.3–3.5, and > 3.5), marital status (married/ living with partner, widowed/ divorced/ separated and never married ), drinking status (non-drinker, 1–5 drinks/ month, 5–10 drinks/ month and 10 + drinks/ month ), smoking status (never smoker, former smoker and current smoker), physical activity (low, moderate and high). Past medical history variables included hypertension, diabetes, coronary heart disease and congestive heart failure.
Study design in MR
Our study employed Mendelian randomization (MR) analysis based on three fundamental assumptions: (1) Relevance assumption: the instrumental variables (IVs) must be significantly associated with the exposure; (2) Independence assumption: the IVs should be independent of confounding factors; (3) Exclusion restriction assumption: the IVs must influence the outcome only through the exposure. All data utilized in this study were derived from publicly available summary statistics from genome-wide association studies (GWAS) consortia, including the IEU Open GWAS Project (https://gwas.mrcieu.ac.uk), the FinnGen Biobank (https://r11.finngen.fi), and previously published studies. Ethical approval was not required, as the study relied on publicly available and previously published data.
Data sources for the exposure
Our MR analysis encompassed BMI, WC, T2DM, FBG, Hypertension, HDL-C and TG as Mets components or risk factors [13]. For Mets, genetic instruments are based on the latest data from the Samsung Genome Institute, which contains 1,252,787 valid subjects of European ancestry (the UKB-excluded cohort) [14]. For BMI, we extracted the GWAS summary data from the BioBank Japan Project (BBJ), which included 523,818 subjects with ~ 70% European ancestry [15]. For WC, summary-level statistics were extracted from the UK Biobank with 407,661 participants [16]. For Type 2 diabetes(T2DM) and hypertension, we obtained summary-level data from the FinnGen biobank with 440,735 and 453,657 participants [17]. For FBG, the summary statistics were available from the most comprehensive GWAS in the meta-analyses of glucose and insulin-related traits Consortium (MAGIC), which included 200,622 subjects with European ancestry [18]. For HDL-C and TG, we extracted the GWAS summary data from the Global Lipids Genetics Consortium (GLGC), which included 1,320,016 subjects with European ancestry [19].
Data sources for the outcome
Single-nucleotide polymorphisms (SNPs) associated with overactive bladder (OAB) symptoms (including OAB and urinary incontinence) were obtained from the IEU OpenGWAS project database (https://gwas.mrcieu.ac.uk/). Summary data for OAB were derived from the GWAS phenotype “Bladder: Calcified/Contracted/Overactive” (GWAS ID: ukb-b-373), which included 2,225 cases and 460,785 controls [20]. For urinary incontinence, summary data were based on the phenotype “Urinary frequency/Incontinence” (GWAS ID: ukb-b-8517), comprising 1,624 cases and 461,309 controls [20]. All participants had similar genetic backgrounds, and each individual was of European ancestry.
Instrumental SNPs selection
To ensure the reliability of our MR analysis results, we adhered to strict criteria for selecting instrumental variables. Only SNPs reaching genome-wide significance (P < 5e-8) were selected as instrumental variables, ensuring robust associations between the selected SNPs and Mets or its components, thereby enhancing the validity of causal inference. To mitigate the potential influence of linkage disequilibrium (LD) on the results, we applied the PLINK algorithm (r²threshold = 0.001 and window size = 10,000 kB) to cluster SNPs and selected the most representative SNP from each cluster [21]. This step ensured the independence of the selected SNPs and reduced statistical bias caused by LD. To address potential bias induced by horizontal pleiotropy, the MR-Egger intercept test and Mendelian Randomization Pleiotropy RESidual Sum and Outlier (MR-PRESSO) method was used [22]. Specifically, the MR-PRESSO global test was used to assess the presence of horizontal pleiotropy within the instrumental SNP set. If the global test indicated significance (p < 0.05), the MR-PRESSO outlier test was performed to identify and exclude pleiotropic SNPs from subsequent analyses. Additionally, the strength of instrumental variables was assessed using the F-statistic, with SNPs having F-statistics > 10 considered suitable candidates as instruments [23]. A full list of selected SNPs is provided in the Supplementary Tables 2–17.
Two-sample MR analysis
To test whether Mets or its components have a causal effect on OAB symptoms, we performed a two-sample MR analysis using Mets components or risk factors as exposure and OAB or urinary incontinence as the outcome (Fig. 2). In MR analysis, we harmonized exposure and outcome data, excluding palindrome SNPs. For the primary analysis, we employed the inverse-variance weighted (IVW) MR model to estimate causal effects [24]. As supplementary methods, MR-Egger [25] and Weighted median [26] were also applied. MR results were deemed significant when the P-value from the IVW method was ≤ 0.05, and the beta values from supplementary methods consistently aligned in the same direction as those from the IVW method [27]. Leave-one-out analysis was conducted to assess whether the summary estimate was biased by high-influence points. Cochran’s Q was calculated to assess heterogeneity across individual causal effects, with a P-value ≤ 0.05 indicating the presence of pleiotropy, and that consequently, a random effects IVW MR analysis was used [28]. Sensitivity analyses included leave-one-out analyses to evaluate the impact of individual SNPs on the results. To account for multiple testing across disorders, the Benjamini-Hochberg procedure was applied, with adjusted P-values (p-adj) < 0.05 considered significant.
Fig. 2.

Schematic diagram of MR principle and procedures. IVs, instrumental variables; Mets, metabolic syndrome; T2DM, type 2 diabetes mellitus; BMI, body mass index; WC, waist circumference; FBG, fasting blood glucose; TG, triglyceride; HDL-C, high-density lipoprotein cholesterol; BCCO, bladder: calcified/ contracted/ overactive; UFI, urinary frequency/ Incontinence
Statistical methods
The respondents were weighted to accurately represent the non-institutionalized civilian population of the United States. Considering that our study included laboratory and physical measurement data, we followed the recommendations of the National Center for Health Statistics (NCHS) and applied appropriate weighting (MEC exam weight) to account for the complexity of the survey design. Continuous variables are expressed as means ± standard deviation (SD), while categorical variables are represented by unweighted frequencies (with weighted proportions provided). Comparisons were conducted using the Wilcoxon rank-sum test, chi-squared test with Rao & Scott’s second-order correction, depending on the study design. Weighted logistic regression analysis were employed to evaluate the association between Mets and OAB. Results are presented as odds ratios (ORs) with 95% confidence intervals (CIs) and p-values. All analyses were performed with R version 4.4.1, and a two-tailed p < 0.05 was considered statistically significant.
Results
Participant characteristics
Based on the inclusion and exclusion criteria, a total of 7,596 participants from the 2005–2018 NHANES database were included in this study. The clinical characteristics of all participants were summarized in Table 1. Among them, 6,099 participants (84%) were in the non-OAB group, while 1,497 participants (16%) were in the OAB group. Compared to non-OAB participants, individuals in the OAB group were more likely to be female (61.87% vs. 48.25%), older (58.15 ± 15.40 vs. 45.25 ± 16.33), had a higher BMI (31.47 ± 7.81 vs. 28.69 ± 6.51), larger WC (105.83 ± 17.45 vs. 98.80 ± 16.15), lower educational level, and lower PIR. They also reported lower alcohol consumption and physical activity levels. Additionally, participants in the OAB group exhibited a significantly higher prevalence of chronic diseases, including diabetes (26.76% vs. 9.36%), hypertension (19.40% vs. 12.95%), coronary heart disease (7.77% vs. 2.61%), and congestive heart failure (6.52% vs. 2.03%) (all P < 0.001). Importantly, the prevalence of Mets was significantly higher in the OAB group compared to the non-OAB group (58.85% vs. 35.01%, P < 0.001).
Table 1.
Baseline characteristics of NHANES participants between 2005–2018
| Variables | Overall (n = 7596) |
Groups | p-value | |
|---|---|---|---|---|
| non-OAB (n = 6099) |
OAB (n = 1497) |
|||
| Age (years) | 47.24 ± 16.85 | 45.25 ± 16.33 | 58.15 ± 15.40 | < 0.001 |
| Gender | < 0.001 | |||
| Male | 3822 (49.65%) | 3205 (51.75%) | 617 (38.13%) | |
| Female | 3774 (50.35%) | 2894 (48.25%) | 880 (61.87%) | |
| BMI (kg/m2) | 29.12 ± 6.80 | 28.69 ± 6.51 | 31.47 ± 7.81 | < 0.001 |
| WC (cm) | 99.88 ± 16.55 | 98.80 ± 16.15 | 105.83 ± 17.45 | < 0.001 |
| Race | < 0.001 | |||
| Non-Hispanic White | 3169 (68.15%) | 2589 (68.90%) | 580 (64.00%) | |
| Non-Hispanic Black | 1586 (10.77%) | 1156 (9.59%) | 430 (17.22%) | |
| Mexican American | 930 (7.79%) | 750 (7.83%) | 180 (7.54%) | |
| Other Hispanic | 818 (5.92%) | 643 (5.95%) | 175 (5.74%) | |
| Other ethnicity | 1093 (7.38%) | 961 (7.73%) | 132 (5.50%) | |
| Education level | < 0.001 | |||
| < High school | 1619 (14.88%) | 1154 (13.17%) | 465 (24.29%) | |
| High school | 1616 (20.16%) | 1252 (19.44%) | 364 (24.09%) | |
| >High school | 4361 (64.96%) | 3693 (67.39%) | 668 (51.61%) | |
| PIR | < 0.001 | |||
| < 1.3 | 2520 (22.75%) | 1895 (21.26%) | 625 (30.91%) | |
| 1.3–3.5 | 2768 (36.26%) | 2194 (35.47%) | 574 (40.58%) | |
| > 3.5 | 2308 (40.99%) | 2010 (43.27%) | 298 (28.51%) | |
| Marital status | < 0.001 | |||
| Married/Living with Partner | 4499 (63.67%) | 3700 (64.60%) | 799 (58.62%) | |
| Widowed/Divorced/Separated | 1572 (16.84%) | 1086 (14.63%) | 486 (29.00%) | |
| Never married | 1525 (19.48%) | 1313 (20.78%) | 212 (12.38%) | |
| Drinking status | < 0.001 | |||
| Non-drinker | 1999 (20.71%) | 1504 (19.42%) | 495 (27.77%) | |
| 1–5 drinks/month | 3900 (52.02%) | 3152 (51.52%) | 748 (54.78%) | |
| 5–10 drinks/month | 581 (9.17%) | 501 (9.79%) | 80 (5.73%) | |
| 10 + drinks/month | 1115 (18.10%) | 941 (19.26%) | 174 (11.72%) | |
| Smoking status | 0.120 | |||
| Never smoker | 4262 (55.93%) | 3493 (56.87%) | 769 (50.79%) | |
| Former smoker | 1810 (24.81%) | 1402 (24.38%) | 408 (27.17%) | |
| Current smoker | 1524 (19.26%) | 1204 (18.75%) | 320 (22.03%) | |
| Physical activity | < 0.001 | |||
| Low | 4256 (53.40%) | 3313 (52.32%) | 943 (59.32%) | |
| Moderate | 2487 (34.97%) | 2051 (35.50%) | 436 (32.10%) | |
| High | 853 (11.62%) | 735 (12.18%) | 118 (8.58%) | |
| Hypertension | 1288 (13.94%) | 897 (12.95%) | 391 (19.40%) | < 0.001 |
| Diabetes | 1187 (12.04%) | 730 (9.36%) | 457 (26.76%) | < 0.001 |
| FBG (mg/dl) | 106.15 ± 30.37 | 104.14 ± 26.72 | 117.19 ± 43.83 | < 0.001 |
| TG (mg/dl) | 125.21 ± 106.35 | 125.32 ± 110.62 | 124.61 ± 78.98 | 0.072 |
| HDL-C (mg/dl) | 53.92 ± 16.12 | 53.90 ± 16.19 | 54.01 ± 15.70 | 0.800 |
| Coronary heart disease | 299 (3.41%) | 173 (2.61%) | 126 (7.77%) | < 0.001 |
| Congestive heart failure | 253 (2.73%) | 138 (2.03%) | 115 (6.52%) | < 0.001 |
| Mets | < 0.001 | |||
| Yes | 3,016 (37.37%) | 2,135 (35.01%) | 881 (58.85%) | |
| No | 4,580 (62.63%) | 3,964 (64.99%) | 616 (41.15%) | |
OAB, overactive bladder; BMI, body mass index; WC, waist circumference; PIR, family income-poverty; FBG, fasting blood glucose; TG, triglyceride; HDL-C, high-density lipoprotein cholesterol; Mets, metabolic syndrome
Association between OAB and Mets
Table 2 demonstrated a positive association between OAB and Mets. In the crude model, participants with Mets had a 2.27-fold higher risk of developing OAB compared to those without Mets (OR: 2.27, 95%CI: 1.89–2.72). This positive association attenuated after adjusting for covariates but remained statistically significant in Model 1 (OR: 1.42, 95% CI: 1.15–1.74) and Model 2 (OR: 1.26, 95%CI: 1.02–1.57). Regarding the association between OAB and individual components of Mets, even after adjusting for all covariates, OAB remained significantly positively associated with diabetes (OR: 1.97, 95% CI: 1.50–2.58), BMI (OR: 1.39, 95% CI: 1.27–1.52), WC (OR: 1.33, 95% CI: 1.22–1.44), and FBG (OR: 1.23, 95% CI: 1.11–1.35).
Table 2.
Univariable and multivariable logistic regression for associations between OAB and Mets
| Variables | Crude model | Model 1 | Model 2 | |||
|---|---|---|---|---|---|---|
| OR (95%CI) | p-value | OR (95%CI) | p-value | OR (95%CI) | p-value | |
| Mets | ||||||
| No | Ref | Ref | Ref | |||
| Yes | 2.27 (1.89, 2.72) | < 0.001 | 1.42 (1.15, 1.74) | 0.002 | 1.26 (1.02, 1.57) | 0.035 |
| Hypertension | ||||||
| No | Ref | Ref | Ref | |||
| Yes | 1.62 (1.25, 2.10) | < 0.001 | 0.82 (0.63, 1.08) | 0.162 | 0.81 (0.61, 1.08) | 0.149 |
| Diabetes | ||||||
| No | Ref | Ref | Ref | |||
| Yes | 3.54 (2.81, 4.46) | < 0.001 | 2.12 (1.64,2.73) | < 0.001 | 1.97 (1.50, 2.58) | < 0.001 |
| BMI | 1.50 (1.35, 1.67) | < 0.001 | 1.42 (1.29, 1.56) | < 0.001 | 1.39 (1.27, 1.52) | < 0.001 |
| WC | 1.53 (1.41, 1.66) | < 0.001 | 1.37 (1.26, 1.49) | < 0.001 | 1.33 (1.22,1.44) | < 0.001 |
| FBG | 1.44 (1.31, 1.59) | < 0.001 | 1.28 (1.16,1.40) | < 0.001 | 1.23 (1.11, 1.35) | < 0.001 |
| TG | 0.99 (0.92, 1.07) | 0.859 | 0.98 (0.92, 1.06) | 0.636 | 0.95 (0.89, 1.03) | 0.191 |
| HDL-C | 1.11 (0.28, 4.33) | 0.877 | 0.06 (0.01, 0.23) | < 0.001 | 0.29 (0.08,1.03) | 0.056 |
Crude model was unadjusted, Model1 was adjusted for age, gender and race, and Model 3 was adjusted for age, gender, race, marital status, family income-poverty, education levels, drinking, smoking, coronary heart disease and congestive heart failure. OAB, overactive bladder; Mets, metabolic syndrome; BMI, body mass index; WC, waist circumference; FBG, fasting blood glucose; TG, triglyceride; HDL-C, high-density lipoprotein cholesterol; OR, odd ratio; CI, confidence interval
Subgroup analyses
Subgroup analyses were conducted to evaluate potential modifiers of the association between OAB and Mets (Table 3). Significant interactions were observed in the age, gender, race, and PIR subgroups (all p-interaction < 0.05). Among individuals aged 20–39 years, OAB was significantly associated with an increased risk of Mets (OR: 2.48, 95% CI: 1.47–4.19); however, no significant associations were found in older age subgroups. By gender, females had 51% greater odds of developing Mets compared to the reference group (OR: 1.51, 95% CI: 1.13–2.02), whereas this association was not observed in males (OR: 0.95, 95% CI: 0.63–1.43, p > 0.05). Furthermore, the positive association between OAB and Mets was stronger in Non-Hispanic Black individuals (OR: 1.91, 95% CI: 1.37–2.68) and Other Hispanic individuals (OR: 1.98, 95% CI: 1.16–3.39), those with PIR < 1.3 (OR: 1.91, 95% CI: 1.47–2.50), lower education levels (OR: 1.71, 95% CI: 1.26–2.32), and low physical activity levels (OR: 1.34, 95% CI: 1.00-1.80). Additionally, coronary heart disease and congestive heart failure did not significantly impact the prevalence of Mets (both p-interaction > 0.05).
Table 3.
Subgroup analysis of the association of OAB and Mets
| Subgroup | OR (95%CI) | p-value | P for interaction | |
|---|---|---|---|---|
| Age | < 0.001 | |||
| 20–39 | 2.48(1.47, 4.19) | 0.001 | ||
| 40–59 | 1.35(0.87, 2.09) | 0.173 | ||
| 60+ | 1.28(0.99, 1.66) | 0.057 | ||
| Gender | < 0.001 | |||
| Male | 0.95(0.63, 1.43) | 0.796 | ||
| Female | 1.51(1.13, 2.02) | 0.008 | ||
| Race | 0.003 | |||
| Mexican American | 1.81(0.92, 3.55) | 0.079 | ||
| Other Hispanic | 1.98(1.16, 3.39) | 0.015 | ||
| Non-Hispanic White | 1.04(0.80, 1.35) | 0.764 | ||
| Non-Hispanic Black | 1.91(1.37, 2.68) | < 0.001 | ||
| Other ethnicity | 1.57(0.68, 3.63) | 0.281 | ||
| PIR | 0.001 | |||
| < 1.3 | 1.91(1.47, 2.50) | < 0.001 | ||
| 1.3–3.5 | 1.13(0.74, 1.74) | 0.558 | ||
| > 3.5 | 1.00(0.65, 1.53) | 0.992 | ||
| Education levels | 0.069 | |||
| < High school | 1.71(1.26, 2.32) | 0.001 | ||
| High school | 0.97(0.58, 1.62) | 0.910 | ||
| >High school | 1.28(0.97, 1.70) | 0.079 | ||
| Smoking status | 0.616 | |||
| Never smoker | 1.28(0.93, 1.76) | 0.121 | ||
| Former smoker | 1.27(0.86, 1.89) | 0.216 | ||
| Current smoker | 1.20(0.71, 2.04) | 0.486 | ||
| Drinking status | 0.745 | |||
| Non-drinker | 1.33(0.78, 2.29) | 0.284 | ||
| 1–5 drinks/month | 1.11(0.83, 1.49) | 0.449 | ||
| 5–10 drinks/month | 1.61(0.49, 5.31) | 0.423 | ||
| 10+ drinks/month | 1.48(0.75, 2.91) | 0.240 | ||
| Marital status | 0.708 | |||
| Married/Living with Partner | 1.26(0.94, 1.69) | 0.114 | ||
| Widowed/Divorced/Separated | 1.20(0.80, 1.80) | 0.357 | ||
| Never married | 1.35(0.70, 2.60) | 0.363 | ||
| Physical activity | 0.479 | |||
| Low | 1.34(1.00, 1.80) | 0.050 | ||
| Moderate | 1.32(0.91, 1.94) | 0.141 | ||
| High | 0.76(0.32, 1.78) | 0.511 | ||
| Coronary heart disease | 0.914 | |||
| Yes | 2.61(0.96, 7.12) | 0.059 | ||
| No | 1.05(1.00, 1.11) | 0.071 | ||
| Congestive heart failure | 0.821 | |||
| Yes | 1.67(0.52, 5.39) | 0.343 | ||
| No | 1.06(1.00, 1.11) | 0.036 | ||
OAB, overactive bladder; Mets, metabolic syndrome; PIR, family income-poverty
The results in MR
As shown in Fig. 3, a two-sample Mendelian randomization (MR) analysis was conducted to evaluate the causal relationships between eight Mets components or risk factors and OAB symptoms. While six potential causal relationships were identified, only one remained statistically significant after Benjamini-Hochberg correction. Specifically, BMI was associated with an increased occurrence of BCCO (OR: 1.0013, 95% CI: 1.0002–1.0025, P-val = 0.020, P-adj = 0.074) and UFI (OR: 1.0017, 95% CI: 1.0007–1.0027, P-val = 0.001, P-adj = 0.016). Similarly, WC was linked to the occurrence of BCCO (OR: 1.0016, 95% CI: 1.0001–1.0031, P-val = 0.035, P-adj = 0.093) and UFI (OR: 1.0015, 95% CI: 1.0002–1.0028, P-val = 0.020, P-adj = 0.074). Hypertension also showed an association with the occurrence of BCCO (OR: 1.0007, 95% CI: 1.0001–1.0013, P-val = 0.023, P-adj = 0.074). Additionally, FBG exhibited a weak association with an increased risk of UFI (OR: 1.0022, 95% CI: 1.0004–1.0039, P-val = 0.015, P-adj = 0.074).
Fig. 3.
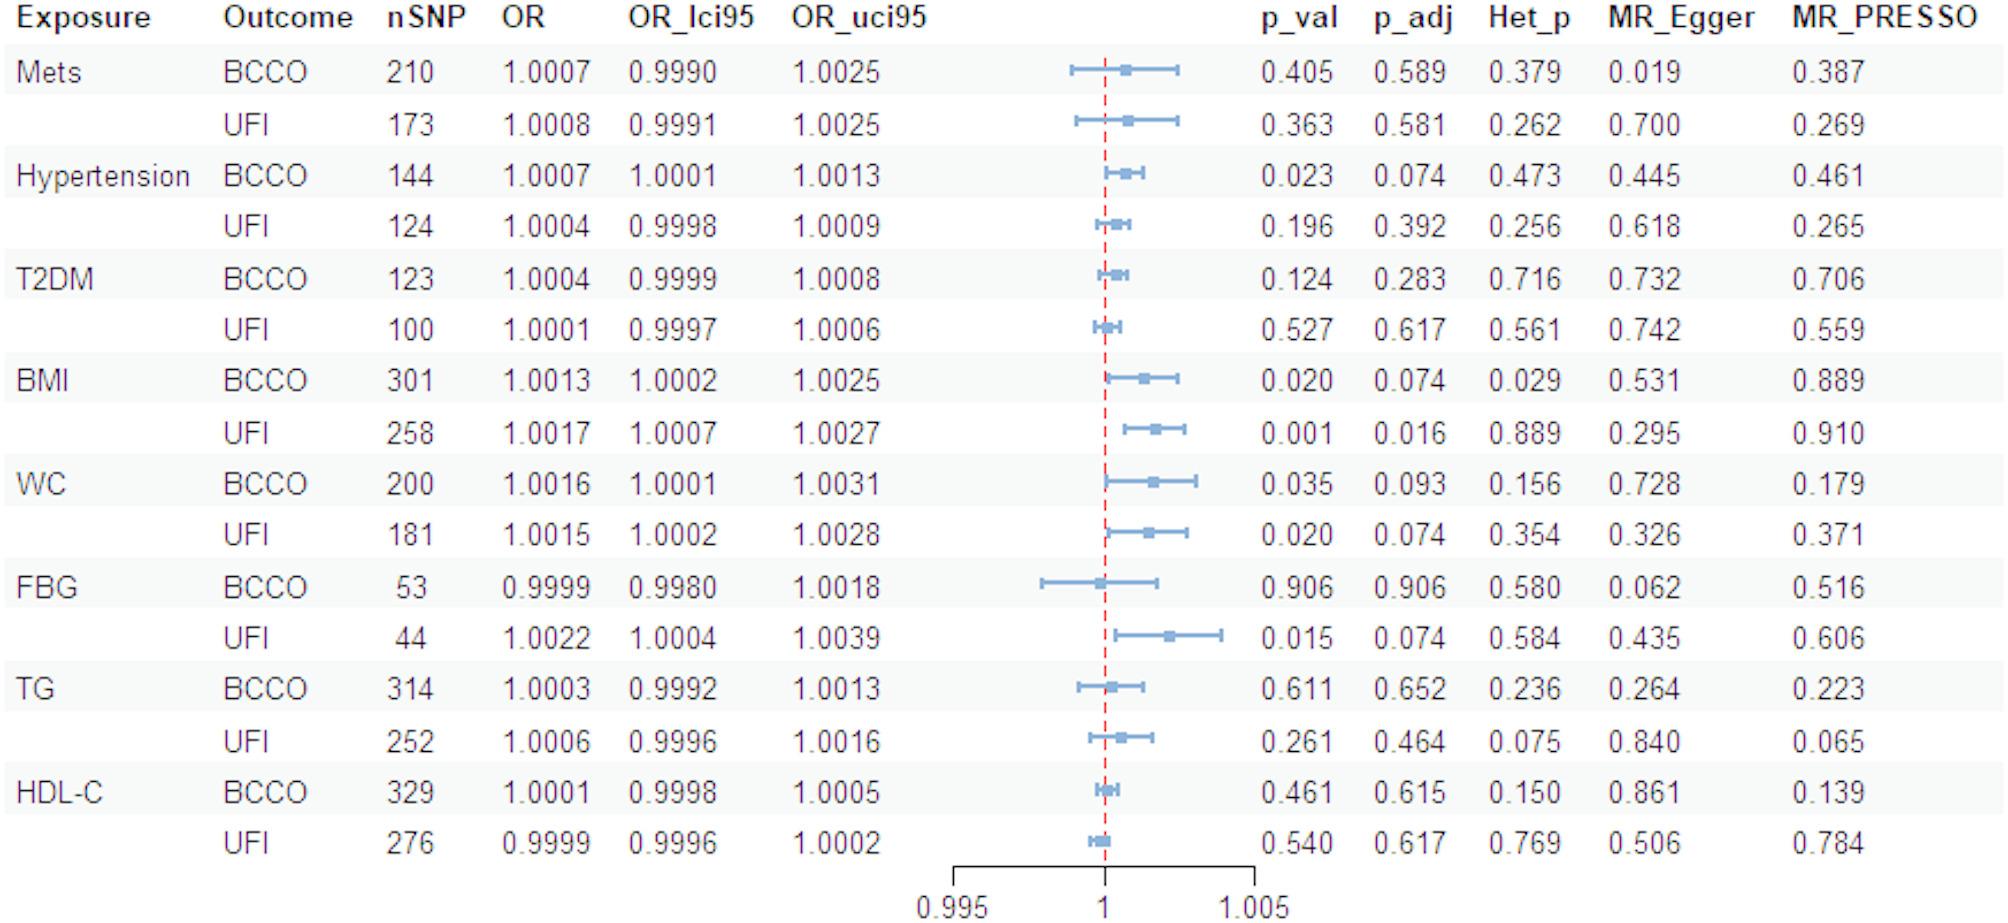
Summary results of the MR analysis between OAB and Mets. OAB, overactive bladder; Mets, metabolic syndrome; T2DM, type 2 diabetes mellitus; BMI, body mass index; WC, waist circumference; FBG, fasting blood glucose; TG, triglyceride; HDL-C, high-density lipoprotein cholesterol; BCCO, bladder: calcified/ contracted/ overactive; UFI, urinary frequency/ Incontinence; nSNP, number of instrumental SNPs selected; OR, odd ratio; p_val, p value for the MR analysis; p_adj, Benjamini-Hochberg False discovery rate adjusted p value; Het_p, p value of the test of heterogeneity of instrumental SNP; MR_Egger, p value of MR-Egger intercept test; MR_PRESSO, p value of MR-PRESSO global horizontal pleiotropy test
No individual SNP significantly disturbed the overall effect of all exposures on OAB in the Leave-one-out analysis (Fig. 4). Heterogeneity and horizontal pleiotropy were assessed using Cochrane’s Q and Egger’s regression, respectively. While heterogeneity was observed in the causal relationship between BMI and BCCO (Het-P = 0.029), the random-effects IVW method accounted for this variability. Our results showed the presence of horizontal pleiotropy in the causal relationship between Mets and BCCO, as evidenced by statistically significant p values(P = 0.019) obtained using the MR-Egger. However, this phenomenon was not observed when the MR-PRESSO was used. The full results of the MR analysis are detailed in Supplementary Table S18.
Fig. 4.

Leave-one-out sensitivity analyses of BMI on BCCO (A), BMI on UFI (B), WC on BCCO (C), WC on UFI (D), Hypertension on BCCO (E) and FBG on UFI (F). The overall effect is indicated at the bottom of the panel. BMI, body mass index; WC, waist circumference; FBG, fasting blood glucose; BCCO, bladder: calcified/ contracted/ overactive; UFI, urinary frequency/ Incontinence
Discussion
The present study established a correlation between OAB and Mets using cross-sectional data from NHANES. Our findings indicated that not only Mets (OR: 1.26) but also its individual components-diabetes (OR: 1.97), BMI (OR: 1.39), WC (OR: 1.33), and FBG (OR: 1.23)-were associated with increased odds of OAB. Furthermore, we conducted Mendelian Randomization (MR) analysis to explore potential causal relationships for the first time. The primary MR analysis revealed no significant causal link between Mets and OAB symptoms; however, certain Mets components or risk factors, including BMI, WC, FBG and hypertension, appeared to promote OAB symptoms in individuals of European ancestry. After applying the Benjamini-Hochberg correction, most causal effects lost statistical significance, except for the impact of BMI on UFI.
Consistent with previous studies, our multivariate analysis supported a positive association between Mets and OAB. Notably, in the gender subgroup analysis, this association was observed exclusively in females (OR: 1.51, 95% CI: 1.13–2.02). In a case-control study involving 330,479 participants, Anis et al. reported a higher prevalence of Mets among female patients with OAB [9]. Similarly, a single-center prospective study, which included 704 women with OAB and 136 without, also found an association between Mets and OAB [8]. Ohgaki et al. compared the severity of OAB symptoms in men with and without Mets and found no clear association, consistent with our findings, which showed no significant association between Mets and OAB in the male subgroup [29]. These results align with previous research emphasizing the role of gender in the pathophysiology of OAB.
Overweight (BMI ≥ 25), obesity (BMI ≥ 30), and elevated waist circumference (WC) are increasingly prevalent among adults, children, and adolescents in the United States [30, 31]. In a large-scale study by Arbelaez et al. involving 36,911,824 subjects from the TriNetX Research Network, obesity was found to be significantly associated with OAB, with higher BMI correlating with increased odds of OAB [32]. Previously published research based on the NHANES database revealed a non-linear association between the weight-adjusted waist index (WWI), a novel obesity indicator, and OAB, with WWI showing a stronger association with OAB than other obesity-related indicators [33]. Our study further confirmed the robust associations of BMI and WC with OAB. Moreover, using MR analysis, we established a causal relationship between BMI and WC and OAB symptoms. Several clinical trials had demonstrated that weight loss interventions may improve OAB symptoms, including incontinence episodes [34–36]. Future studies exploring the protective effects of weight loss interventions—whether surgical or non-surgical—on OAB symptoms will provide valuable insights into whether such interventions should be incorporated as part of the first-line treatment for patients with OAB.
Increasing research has highlighted a potential relationship between diabetes and OAB. For example, in a case-control study involving 279 diabetes mellitus patients and 578 age- and sex-matched controls, a higher prevalence of OAB symptoms was observed in the diabetes group [37]. Additionally, Khadour et al. conducted a cross-sectional study to investigate risk factors associated with the severity of OAB in patients with type 2 diabetes [38]. They identified the duration of diabetes and symptomatic diabetic peripheral neuropathy as independent predictors of OAB severity [38]. Our findings also supported a positive correlation between diabetes and FBG levels with OAB. However, only a causal association between FBG and UFI was found, and no significant causal relationship between T2DM and OAB symptoms was detected in our MR analysis. He et al. suggested that white blood cells and neutrophils mediate the relationship between glucose, fasting glucose, insulin, and OAB, indicating that diabetes may increase OAB risk by promoting systemic inflammation [39]. Pathophysiological mechanisms, such as small fiber neuropathy, accumulation of glycation products, oxidative stress, and small vessel ischemia, have been proposed to explain lower urinary tract dysfunction caused by diabetes [40]. However, current clinical studies on the effects of antidiabetic drugs on OAB have not demonstrated a significant protective effect [41, 42]. Based on existing studies, it may be valuable to conduct clinical research exploring the effects of newer pharmacological agents for diabetes, such as GLP-1 receptor agonists or DPP-4 inhibitors, on OAB.
Limitations and advantage
Several limitations should be acknowledged in this study. First, the diagnosis of OAB in the NHANES dataset was based on questionnaire responses. However, a definitive diagnosis of OAB requires the exclusion of organic diseases and urinary tract infections, which could not be accounted for through the survey, potentially introducing bias. Second, some covariates were self-reported, which may have introduced recall bias. Third, the population analyzed in the MR study was primarily of European ancestry, while the cross-sectional study included a racially diverse U.S. population. Additionally, MR analysis is a statistical method, and while it can suggest causality, it does not provide insights into the underlying pathophysiological mechanisms. Finally, we attempted a bidirectional MR analysis to test whether OAB symptoms were a cause or a consequence of the observed associations. Unfortunately, under the same conditions as the forward MR analysis, there were no valid instrumental variables when OAB symptoms were used as the exposure factor, meaning no data were available for further analysis in the reverse MR.
Conclusion
To sum up, our study further investigated the association between Mets and OAB in the U.S. population using data from a large national cross-sectional survey (NHANES), emphasizing gender differences. Additionally, we provided evidence supporting a potential causal relationship between Mets components and OAB through MR analysis and highlighted the importance of therapeutic strategies targeting Mets in managing OAB symptoms.
Supplementary Information
Below is the link to the electronic supplementary material.
Acknowledgements
We express our gratitude to all individuals and researchers who have contributed to NHANES, the FinnGen consortium, the UK Biobank consortium, the MRC-IEU consortium, the MAGIC consortium, the GLGS consortium.
Author contributions
Z.L: Writing - original draft, Methodology, Investigation, Formal analysis, Data curation, Conceptualization. X.S: Writing - original draft, Formal analysis, Data curation, Conceptualization. C.L: Writing– review & editing, Investigation. C.W: Writing– review & editing, Investigation. R.Z: Writing– review & editing, Investigation. X.D: Writing– review & editing, Investigation. W.S: Writing– review & editing, Investigation. C.L: Writing– review & editing, Supervision.
Funding
This work was supported by the National Natural Science Foundation of China (81970303, 82470294) and Tianjin Key Municipality Medical Discipline (Specialty) Construction Project (TJYXZDXK-054B).
Data availability
No datasets were generated or analysed during the current study.
Declarations
Ethics approval and consent to participate
Ethical approval was not required, as the study relied on publicly available and previously published data.
Consent for publication
Not applicable.
Competing interests
The authors declare no competing interests.
Footnotes
Publisher’s note
Springer Nature remains neutral with regard to jurisdictional claims in published maps and institutional affiliations.
Zhihao Liu and Xiaotong Sun contributed equally to this work.
References
- 1.Temml C, Heidler S, Ponholzer A, Madersbacher S. Prevalence of the overactive bladder syndrome by applying the international continence society definition. Eur Urol. 2005;48(4):622–7. 10.1016/j.eururo.2005.04.026 [DOI] [PubMed] [Google Scholar]
- 2.Coyne KS, Sexton CC, Thompson C, Kopp ZS, Milsom I, et al. The impact of OAB on sexual health in men and women: results from EpiLUTS. J Sex Med. 2011;8(6):1603–15. 10.1111/j.1743-6109.2011.02250.x [DOI] [PubMed] [Google Scholar]
- 3.Coyne KS, Sexton CC, Kopp ZS, Ebel-Bitoun C, Milsom I, et al. The impact of overactive bladder on mental health, work productivity and health-related quality of life in the UK and sweden: results from EpiLUTS. BJU Int. 2011;108(9):1459–71. 10.1111/j.1464-410X.2010.10013.x [DOI] [PubMed] [Google Scholar]
- 4.Irwin DE, Milsom I, Hunskaar S, Reilly K, Kopp Z, et al. Population-based survey of urinary incontinence, overactive bladder, and other lower urinary tract symptoms in five countries: results of the EPIC study. Eur Urol. 2006;50(6):1306–14. 10.1016/j.eururo.2006.09.019. discussion 1314–1305. [DOI] [PubMed] [Google Scholar]
- 5.Mostafaei H, Shariat SF, Salehi-Pourmehr H, Janisch F, Mori K, et al. The clinical pharmacology of the medical treatment for overactive bladder in adults. Expert Rev Clin Pharmacol. 2020;13(7):707–20. 10.1080/17512433.2020.1779056 [DOI] [PubMed] [Google Scholar]
- 6.Hsu LN, Hu JC, Chen PY, Lee WC, Chuang YC. Metabolic syndrome and overactive bladder syndrome may share common pathophysiologies. Biomedicines. 2022;10(8). 10.3390/biomedicines10081957 [DOI] [PMC free article] [PubMed]
- 7.Uzun H, Zorba OU. Metabolic syndrome in female patients with overactive bladder. Urology. 2012;79(1):72–5. 10.1016/j.urology.2011.08.050 [DOI] [PubMed] [Google Scholar]
- 8.Zacche MM, Giarenis I, Thiagamoorthy G, Robinson D, Cardozo L. Is there an association between aspects of the metabolic syndrome and overactive bladder? A prospective cohort study in women with lower urinary tract symptoms. Eur J Obstet Gynecol Reprod Biol. 2017;217:1–5. 10.1016/j.ejogrb.2017.08.002 [DOI] [PubMed] [Google Scholar]
- 9.Anis O, Cohen AD, Aharony S, Kitrey ND, Dotan I, et al. Increased prevalence of metabolic syndrome in female patients with overactive bladder: a population-based study. Neurourol Urodyn. 2024;43(8):1809–16. 10.1002/nau.25521 [DOI] [PubMed] [Google Scholar]
- 10.Saratlija Novakovic Z, Tesija RA, Puljak L. Association between metabolic syndrome and overactive bladder: a case-control study. Scand J Urol. 2017;51(6):470–3. 10.1080/21681805.2017.1354912 [DOI] [PubMed] [Google Scholar]
- 11.Homma Y, Yoshida M, Seki N, Yokoyama O, Kakizaki H, et al. Symptom assessment tool for overactive bladder syndrome–overactive bladder symptom score. Urology. 2006;68(2):318–23. 10.1016/j.urology.2006.02.042 [DOI] [PubMed] [Google Scholar]
- 12.Expert Panel on Detection E, Treatment of High Blood Cholesterol in A. Executive summary of the third report of the National cholesterol education program (NCEP) expert panel on detection, evaluation, and treatment of high blood cholesterol in adults (Adult treatment panel III). #N/A. 2001;285(19):2486–97. 10.1001/jama.285.19.2486 [DOI] [PubMed] [Google Scholar]
- 13.Alberti KG, Eckel RH, Grundy SM, Zimmet PZ, Cleeman JI. Harmonizing the metabolic syndrome: a joint interim statement of the International Diabetes Federation Task Force on Epidemiology and Prevention; National Heart, Lung, and Blood Institute; American Heart Association; World Heart Federation; International Atherosclerosis Society; and International Association for the Study of Obesity. Circulation. 2009;120(16):1640–1645. 10.1161/CIRCULATIONAHA.109.192644 [DOI] [PubMed]
- 14.Park S, Kim S, Kim B, Kim DS, Kim J, et al. Multivariate genomic analysis of 5 million people elucidates the genetic architecture of shared components of the metabolic syndrome. Nat Genet. 2024;56(11):2380–91. 10.1038/s41588-024-01933-1 [DOI] [PMC free article] [PubMed] [Google Scholar]
- 15.Sakaue S, Kanai M, Tanigawa Y, Karjalainen J, Kurki M, et al. A cross-population atlas of genetic associations for 220 human phenotypes. Nat Genet. 2021;53(10):1415–24. 10.1038/s41588-021-00931-x [DOI] [PMC free article] [PubMed] [Google Scholar]
- 16.Mbatchou J, Barnard L, Backman J, Marcketta A, Kosmicki JA, et al. Computationally efficient whole-genome regression for quantitative and binary traits. Nat Genet. 2021;53(7):1097–103. 10.1038/s41588-021-00870-7 [DOI] [PubMed] [Google Scholar]
- 17.Kurki MI, Karjalainen J, Palta P, Sipila TP, Kristiansson K, et al. FinnGen provides genetic insights from a well-phenotyped isolated population. Nature. 2023;613(7944):508–18. 10.1038/s41586-022-05473-8 [DOI] [PMC free article] [PubMed] [Google Scholar]
- 18.Chen J, Spracklen CN, Marenne G, Varshney A, Corbin LJ, et al. The trans-ancestral genomic architecture of glycemic traits. Nat Genet. 2021;53(6):840–60. 10.1038/s41588-021-00852-9 [DOI] [PMC free article] [PubMed] [Google Scholar]
- 19.Graham SE, Clarke SL, Wu KH, Kanoni S, Zajac GJM, et al. The power of genetic diversity in genome-wide association studies of lipids. Nature. 2021;600(7890):675–9. 10.1038/s41586-021-04064-3 [DOI] [PMC free article] [PubMed] [Google Scholar]
- 20.Zhang X, Ma L, Li J, Zhang W, Xie Y, et al. Mental health and lower urinary tract symptoms: results from the NHANES and Mendelian randomization study. J Psychosom Res. 2024;178:111599. 10.1016/j.jpsychores.2024.111599 [DOI] [PubMed] [Google Scholar]
- 21.Chang CC, Chow CC, Tellier LC, Vattikuti S, Purcell SM, et al. Second-generation PLINK: rising to the challenge of larger and richer datasets. #N/A. 2015;4:7. 10.1186/s13742-015-0047-8 [DOI] [PMC free article] [PubMed] [Google Scholar]
- 22.Verbanck M, Chen CY, Neale B, Do R. Detection of widespread horizontal pleiotropy in causal relationships inferred from Mendelian randomization between complex traits and diseases. Nat Genet. 2018;50(5):693–8. 10.1038/s41588-018-0099-7 [DOI] [PMC free article] [PubMed] [Google Scholar]
- 23.Bowden J, Del Greco MF, Minelli C, Zhao Q, Lawlor DA, et al. Improving the accuracy of two-sample summary-data Mendelian randomization: moving beyond the NOME assumption. Int J Epidemiol. 2019;48(3):728–42. 10.1093/ije/dyy258 [DOI] [PMC free article] [PubMed] [Google Scholar]
- 24.Burgess S, Butterworth A, Thompson SG. Mendelian randomization analysis with multiple genetic variants using summarized data. Genet Epidemiol. 2013;37(7):658–65. 10.1002/gepi.21758 [DOI] [PMC free article] [PubMed] [Google Scholar]
- 25.Bowden J, Davey Smith G, Burgess S. Mendelian randomization with invalid instruments: effect estimation and bias detection through Egger regression. Int J Epidemiol. 2015;44(2):512–25. 10.1093/ije/dyv080 [DOI] [PMC free article] [PubMed] [Google Scholar]
- 26.Bowden J, Davey Smith G, Haycock PC, Burgess S. Consistent estimation in Mendelian randomization with some invalid instruments using a weighted median estimator. Genet Epidemiol. 2016;40(4):304–14. 10.1002/gepi.21965 [DOI] [PMC free article] [PubMed] [Google Scholar]
- 27.Wei Y, Zhan Y, Carlsson S. Childhood adiposity and novel subtypes of diabetes in adults: a Mendelian randomisation and genome-wide genetic correlation study. Lancet Glob Health. 2023;11(Suppl 1):S1. 10.1016/S2214-109X(23)00086-4 [DOI] [PubMed] [Google Scholar]
- 28.Yuan S, Kim JH, Xu P, Wang Z. Causal association between celiac disease and inflammatory bowel disease: a two-sample bidirectional Mendelian randomization study. Front Immunol. 2022;13:1057253. 10.3389/fimmu.2022.1057253 [DOI] [PMC free article] [PubMed] [Google Scholar]
- 29.Ohgaki K, Horiuchi K, Kondo Y. Association between metabolic syndrome and male overactive bladder in a Japanese population based on three different sets of criteria for metabolic syndrome and the overactive bladder symptom score. Urology. 2012;79(6):1372–8. 10.1016/j.urology.2012.03.006 [DOI] [PubMed] [Google Scholar]
- 30.Ford ES, Mokdad AH, Giles WH. Trends in waist circumference among U.S. Adults. Obes Res. 2003;11(10):1223–31. 10.1038/oby.2003.168 [DOI] [PubMed] [Google Scholar]
- 31.Hedley AA, Ogden CL, Johnson CL, Carroll MD, Curtin LR, et al. Prevalence of overweight and obesity among US children, adolescents, and adults, 1999–2002. #N/A. 2004;291(23):2847–50. 10.1001/jama.291.23.2847 [DOI] [PubMed] [Google Scholar]
- 32.Vivilaki VG, Wilhelm E, Petelos E. Infodemic management challenges and evidence-based midwifery. Eur J Midwifery. 2023;7:21. 10.18332/ejm/168728 [DOI] [PMC free article] [PubMed] [Google Scholar]
- 33.Hui Z, Zewu Z, Yang L, Yu C. Association between weight-adjusted waist index and overactive bladder: a cross-sectional study based on 2009–2018 NHANES. Front Nutr. 2024;11:1423148. 10.3389/fnut.2024.1423148 [DOI] [PMC free article] [PubMed] [Google Scholar]
- 34.Gunes Y, Fersahoglu MM, Bulut NE, Cakmak A, Ergin A, et al. Effects of sleeve gastrectomy on pelvic floor disorders in female patients with severe obesity: a prospective study. Obes Surg. 2023;33(10):3069–76. 10.1007/s11695-023-06725-w [DOI] [PubMed] [Google Scholar]
- 35.Palleschi G, Pastore AL, Rizzello M, Cavallaro G, Silecchia G, et al. Laparoscopic sleeve gastrectomy effects on overactive bladder symptoms. J Surg Res. 2015;196(2):307–12. 10.1016/j.jss.2015.03.035 [DOI] [PubMed] [Google Scholar]
- 36.Vissers D, Neels H, Vermandel A, De Wachter S, Tjalma WA, et al. The effect of non-surgical weight loss interventions on urinary incontinence in overweight women: a systematic review and meta-analysis. Obes Rev. 2014;15(7):610–7. 10.1111/obr.12170 [DOI] [PubMed] [Google Scholar]
- 37.Chiu AF, Huang MH, Wang CC, Kuo HC. Higher glycosylated hemoglobin levels increase the risk of overactive bladder syndrome in patients with type 2 diabetes mellitus. Int J Urol. 2012;19(11):995–1001. 10.1111/j.1442-2042.2012.03095.x [DOI] [PubMed] [Google Scholar]
- 38.Khadour FA, Khadour YA, Alhatem W, Al Barroush D. Risk factors associated with the severity of overactive bladder among Syrian patients with type 2 diabetes. Sci Rep. 2024;14(1):16547. 10.1038/s41598-024-67326-w [DOI] [PMC free article] [PubMed] [Google Scholar]
- 39.He Q, Wu L, Deng C, He J, Wen J, et al. Diabetes mellitus, systemic inflammation and overactive bladder. Front Endocrinol (Lausanne). 2024;15:1386639. 10.3389/fendo.2024.1386639 [DOI] [PMC free article] [PubMed] [Google Scholar]
- 40.Finazzi Agro E, Rosato E, Wagg A, Sinha S, Fede Spicchiale C, et al. How do we make progress in phenotyping patients with LUT such as OAB and underactive detrusor, including using urine markers and microbiome data, in order to personalize therapy? ICI-RS 2023: part 1. Neurourol Urodyn. 2024;43(6):1261–71. 10.1002/nau.25377 [DOI] [PubMed] [Google Scholar]
- 41.Van Den Eeden SK, Sarma AV, Rutledge BN, Cleary PA, Kusek JW, et al. Effect of intensive glycemic control and diabetes complications on lower urinary tract symptoms in men with type 1 diabetes: diabetes control and complications trial/epidemiology of diabetes interventions and complications (DCCT/EDIC) study. Diabetes Care. 2009;32(4):664–70. 10.2337/dc07-2375 [DOI] [PMC free article] [PubMed] [Google Scholar]
- 42.Neu S, Matta R, Locke JA, Troke N, Tadrous M, et al. The use of metformin in overactive bladder: a retrospective nested case-control, population-based analysis. Urology. 2024;183:70–7. 10.1016/j.urology.2023.09.033 [DOI] [PubMed] [Google Scholar]
Associated Data
This section collects any data citations, data availability statements, or supplementary materials included in this article.
Supplementary Materials
Data Availability Statement
No datasets were generated or analysed during the current study.