

Abstract
Parkinson’s disease (PD) is a prevalent neurodegenerative disorder where recent evidence suggests pathogenesis may be in part mediated by inflammatory processes, the molecular and cellular architecture of which is largely unknown. To identify and characterize selectively vulnerable brain cell populations in PD, we performed single nucleus transcriptomics and unbiased proteomics to profile the prefrontal cortex from postmortem human brains of 6 individuals with late-stage PD and 6 age-matched controls. Analysis of nearly 80,000 nuclei led to the identification of eight major brain cell types, including elevated brain-resident T cells in PD, each with distinct transcriptional changes in agreement with the known genetics of PD. By analyzing Lewy body pathology in the same postmortem brain tissue, we found that α-synuclein pathology was inversely correlated with chaperone expression in excitatory neurons. Examining cell-cell interactions, we discovered a selective abatement of neuron-astrocyte interactions and enhanced neuroinflammation. Proteomic analyses of the same brains identified synaptic proteins in prefrontal cortex that were preferentially downregulated in PD. By comparing this single cell PD dataset to a published analysis of similar brain regions in Alzheimer’s disease (AD), we found no common differentially expressed genes in neurons, but identified many shared differentially expressed genes in glial cells, suggesting that disease etiology, especially in the context of neuronal vulnerability, in PD and AD are likely distinct.
One Sentence Summary:
A single cell transcriptomic atlas with integrated proteomics for the prefrontal cortex of late-stage Parkinson’s disease human brains.
INTRODUCTION
Parkinson’s disease (PD) is a common neurodegenerative movement disorder that impacts approximately 1 million people in the USA and nearly 6 million worldwide (1, 2). The neuropathological hallmarks of PD are loss of substantia nigra neurons and intracellular α-synuclein aggregates known as Lewy bodies. More recently, neuroinflammatory pathways involving glial and immune cells have been suggested to contribute to PD pathogenesis (3). However, whether these pathways contribute to sporadic disease remains to be clarified. Moreover, the relative contributions of neuronal versus glial cell populations to PD pathophysiology remains unknown. Single cell and nucleus RNA sequencing technologies have recently become robust and rigorous methods for assessing the heterogeneity of cell types in various diseases (4). Although single cell technologies, including multi-omics analyses, are becoming popular methods to the study of neurodegeneration, these tools are only now beginning to be applied to PD research, especially employing postmortem human brain tissues (5–7).
Here, we performed single cell transcriptomics and proteomics using postmortem late-stage PD brains and age-matched controls to obtain an accurate and unbiased assessment of the complex cellular changes associated with PD. We investigated the prefrontal cortex, as this brain region is affected and exhibits Lewy body pathology in late-stage PD (8), and because bulk transcriptomic analysis of this region in PD brains indicated the need for cell-type resolution (9). By focusing on the prefrontal cortex, we also can make cross-comparisons between PD and Alzheimer’s disease (AD) based on published AD datasets for this vulnerable brain region (10). We identified an inflammatory response in the brain, especially of increased brain-resident T cells and microglia in PD, as well as divergent neuronal responses in AD versus PD. Oligodendrocyte changes that appear to be a common feature of neurodegeneration add to the growing body of research spanning neurodegenerative disorders. We found Lewy body pathology is inversely correlated with chaperone capacity, whereas the genetic architecture of PD seen in familial cases is also revealed in sporadic forms of the disease. Our data uncovered a unique cellular-level view of transcriptional and cortical protein changes associated with PD, representing the first single-cell portrait of PD brain prefrontal cortex.
RESULTS
Single nucleus transcriptomic profiling of postmortem brains.
To understand cellular diversity and disease-related transcriptional changes in PD, we performed single nucleus RNA sequencing to profile postmortem human brain tissue from the prefrontal cortex Brodmann area 9 (BA9, dorsolateral prefrontal cortex), for examination of circuit-based vulnerability in the context of neuropathology, such as Lewy bodies, in this projection area, in six patients with PD and six sex- and age-matched healthy controls (mean age 75.9, range 63–96 years, table S1). We optimized an unbiased isolation protocol for human brain nuclei using sucrose gradient ultracentrifugation (fig. S1, A to C, see Methods) followed by single nucleus RNA sequencing on the 10x Chromium single cell platform (10x Genomics). We profiled 77,384 brain nuclei with an average sequencing depth of 100,000 reads per nucleus and detected a median of 2,598 genes and 5,639 transcripts per cell after quality control filtering (fig. S1, D to F, table S1). To classify the major cell types in the prefrontal cortex, we clustered all nuclei jointly across the 12 individuals (both PD and healthy controls) to produce 12 transcriptionally distinct clusters with highly consistent expression patterns across individuals (Fig. 1, A to D). We identified and annotated eight major brain cell types with known marker genes, namely: excitatory neurons (ExN, SLC17A7) with three subclusters (ExN1, ExN2, ExN3), inhibitory neurons (InN, GAD1) with three subclusters (InN1, InN2, InN3), astrocytes (Astro: AQP4), microglia (MG: ITGAM), oligodendrocytes (Oligo: MBP), oligodendrocyte precursor cells (OPC: PDGFRA), endothelial cells (Endo: CLDN5), and brain-resident T cells (T cells: CD3E) (Fig. 1, A and D, fig. S1G). We found unique or enriched RNA markers for each of the cell types, including CUX2, CBLN2, HS6ST3 for excitatory neuron subcluster 1; TSHZ2, POU6F2, FOXP2 for excitatory neuron subcluster 2; NRG1, NEFL, CADPS2 for excitatory neuron subcluster 3; ADARB2, GALNTL6, RGS12 for inhibitory neuron subcluster 1; NXPH1, KIAA1217, SOX6 for inhibitory neuron subcluster 2; FGF13, TMEM132D, UNC13C for inhibitory neuron subcluster 3; ST18, PLP1, MBP for oligodendrocytes; AQP4, GFAP, RYR3 for astrocytes; SPP1, RUNX1, DOCK8 for microglia; LHFPL3, TNR, MEGF11 for oligodendrocyte precursor cells; EBF1, ADGRF5, TFPI for endothelial cells; and SKAP1, GNLY, CD96 for brain-resident T cells (Fig. 1D). The relative proportions of five of the major cell types were roughly similar between PD and healthy controls, with the exceptions of oligodendrocytes, microglia, and brain-resident T cells (Fig. 1E, table S2). We identified increased brain-resident T cells (healthy controls, n = 33 nuclei; PD, n = 243 nuclei; P = 0.02) in PD brain samples, indicating the presence of neuroinflammation (Fig. 1E, fig. S1H). We identified more microglia and higher percentage of microglia in PD brains (healthy controls, n = 1699 nuclei; PD, n = 3684 nuclei; P = 0.09), which we validated with RNAscope in situ hybridization by quantifying the number of either IBA or C1QA expressing microglial cells and their percentages in all brain cells between PD and controls (fig. S2).
Fig. 1. Single nucleus transcriptomic analysis of human brain prefrontal cortex reveals cell-type-specific changes in PD.

(A to C), UMAP plotting of human brain nuclei (n = 77,384 nuclei), colored by (A) major human brain cell types: excitatory (ExN) and inhibitory (InN) neurons, oligodendrocytes (Oligo), astrocytes (Astro), microglia (MG), oligodendrocyte precursor cells (OPC), endothelial cells (Endo) and brain-resident T cells (Tcells); (B) disease diagnosis of either Parkinson’s disease (PD) or healthy controls (HC); or (C) individuals (from 12 individuals of 6 PD and 6 HC). (D) Heatmap of top marker genes in each brain cell type. (E) Brain cell type proportion grouped by disease diagnosis of PD or HC. (F) Differentially expressed genes (DEGs) counts for each brain cell type (log fold change > 0.75 for T cells; log fold change > 0.25, FDR corrected P-value adjusted < 0.05 for all the other cell types). (G and H) Gene ontology (GO) pathway analysis of differentially expressed genes between PD and HC for each brain cell type for either (G) up-regulated pathways or (H) down-regulated pathways (H), with normalized z score for each pathway.
We performed correlation analysis across all individuals in this study and their biological variations, including sex, age, and PMI, using multidimensional scaling of variables (MDS) and pseudobulk information of each individual based on their single nucleus transcriptomic data. There were no differences across all brain cell types between the individual groups, in terms of sex (male vs female), broad age range (70s, 80s, 90s) and PMI (5 hours, 10 hours, 15 hours) (table S1, fig. S3, A to C), allowing us to focus on differences between PD and healthy controls. The correlation analysis between disease condition (healthy controls or PD) and major brain cell types showed that brain-resident T cells were the most vulnerable cell type in PD brains (fig. S3D). To prioritize drivers of variation based on a genome-wide summary, we performed the variance partition analysis (11). Here, we considered sex, age, PMI, cell type, and individual (patient ID), as variables to quantify the contribution of multiple sources of variation, using the input as the normalized cell type specific pseudo-bulk data. The violin plot (fig. S3E) shows the contribution of each variable to total variance where each dot represents a gene. Among all the variables that we considered, variation across cell types explains a median of over 56.78% of the variation in expression, followed by individual (patient ID), which explains 5.75% of the variation as we have both healthy controls and PD patients in our dataset. The variation explained by PMI, age, and sex are all less than 0.5%. Overall, our results demonstrate that the cell clustering was mostly driven by cell type, instead of other covariates such as PMI, age or sex.
We next examined the cell type-specific gene expression changes between PD and healthy control and identified 806 unique differentially expressed genes across all the major brain cell types. We found that neurons in the prefrontal cortex showed fewer significant gene expression changes than glial cells, whereas astrocytes and microglia yielded the greatest number of differentially expressed genes (Fig. 1F, table S3). We identified a broad decrease in gene expression in both excitatory and inhibitory neurons, which revealed a signature of neuronal gene repression with 79% and 67% of downregulated genes, respectively. Conversely, all glial cell populations showed an overall upregulation of gene expression, in which alterations within astrocytes and microglia are the most prominent.
We performed gene ontology pathway (GO) analysis of both downregulated and upregulated differentially expressed genes in each brain cell type (Fig. 1, G and H, table S3). The most upregulated pathway in neurons (Fig. 1G) consisted of pathways associated with axonogenesis (EPHA6, ROBO1, GAB1, PARD3) and presynaptic assembly (NLGN4Y, CBLN2), suggesting compensatory synaptogenesis and synaptic alterations. We further validated our single nucleus transcriptomic dataset using the targeted gene expression method, RNAscope in situ hybridization on an additional cohort of PD and control brain sections of prefrontal cortex, focusing on several differentially expressed genes that were identified by single nucleus RNA sequencing, including EPHA6 and CBLN2 (fig. S4A). We quantified the RNAscope signals at the single RNA molecule level between PD and controls using QuPath (fig. S4, B and C), which confirmed differential regulation of these select genes in PD brains compared to healthy controls.
Upregulated pathways in oligodendrocytes indicated the activation of protein complex assembly (HSPA1A, HSPA1B, FMN1) and cytoskeleton organization (P2RX7, RAPGEF3, FMN1, FCHSD2). Astrocytes showed enhanced expression of pathways related to detoxification of heavy metals (MT1G, MT1F, MT3), consistent with iron and other heavy metal deposition in PD brains (12, 13). Microglia in PD brains were enriched for the pathways of myeloid cell differentiation (FOS, STAT3, RUNX1), regulation of hemopoiesis (BCL6, IL4R, JAK3), and glycolytic process (NFKBIZ, IL15, NFKBID), which are all markers of microglia activation in response to disease. In oligodendrocyte precursor cells, regulation of cell growth (VEGFA, HSPA1, HSPA1B) and positive neurogenesis (ZNF365, SYT1, MAPT) pathways were observed displaying presumed regenerative responses toward neuroinflammation. As we unbiasedly profiled all brain nuclei without enrichment of immune cell nuclei, there were relatively few T cells present. Nevertheless, there was an enrichment of genes in brain-resident T cells in PD brains for pathways regulating homeostasis of cell number (IL7R, IL15, MALT1) and regulation of T cell differentiation (CAMK4, CD28, ZAP70), suggesting a prominent T cell response is present in PD, consistent with the newly discovered roles for T cells in PD patients (14–16).
The most prominent downregulated pathways in PD brains were in neurons (Fig. 1H). Protein folding and unfolded protein response pathways (HSPB1, HSP90AB1, DNAJB6, HSPA1A, HSPH1) were the most downregulated pathways within excitatory neurons in PD, signifying decreased chaperone capacity, consistent with the increased protein aggregation known to occur in this cell type. Inhibitory neurons also showed prominent patterns of repression of unfolded protein response pathway (HSPD1, HSP90AA1, HSPH1) but additionally displayed signatures of dysregulation of receptor mediated endocytosis pathways (HSP90AA1, PLCG2, HSPH1). We further validated the differential expression of neuronal genes using RNAscope in situ hybridization on PD and control brain sections from the prefrontal cortex for downregulated genes, such as HSP90AA1 and PLCG2 (fig. S4D) and quantified the RNAscope signals between PD and control brains using QuPath (fig. S4, E and F).
There was no discernable downregulation pathway signature for microglia, other than phospholipid binding (LPAR1, ANXA4, AXL) and virus receptor activity (CXADR, SELPLG, AXL), suggesting microglia play a more active role in initiation of immune responses than negative regulation. Most astrocyte downregulated pathways consisted of coagulation (VAV3, LYN, UBASH3B) indicating its detection of cellular injury. The pattern of brain-resident T cell downregulated genes was less intuitive, as their pathways were GATOR2 complex (SESN3, SZT2), receptor antagonist activity (MTRNR2L12, MTRNR2L8) and enhancer binding (BCH2, MEF2C, LEF1) (Fig. 1H). Overall, GO pathway analysis indicates increased gliosis and neuroinflammation in PD with a concomitant repression of neuronal expression.
Chaperone gene expression patterns in PD negatively correlate with Lewy body pathology in excitatory neurons.
Based on our observation that protein folding pathways were downregulated in neurons in PD (Fig. 1H), we sought to correlate PD brain Lewy body pathology with gene expression in neuronal subpopulations, particularly cortical excitatory neurons, as pathology is largely restricted to these neurons in PD (17). We performed phospho-S129-α-synuclein immunohistochemistry on brain prefrontal cortex tissue obtained from the same PD and healthy control individuals used for single nucleus analysis and confirmed the presence of Lewy bodies and Lewy neurites in PD cases with a lack of pathology in controls (Fig. 2A). Quantification of Lewy bodies and Lewy neurites counts in each brain sample showed that PD patients had a range of pathology, but overall, exhibited a significantly higher Lewy body pathology score compared to healthy controls (p = 0.03, unpaired t-test) (Fig. 2B). We compared the Lewy body pathology score of each PD brain sample with its single nucleus quality control parameters, such as mapping ratio, cell number variation and number of transcripts, and concluded that there was no difference in quality of RNA regardless of Lewy body pathology score (table S1).
Fig. 2. Correlation analysis of Lewy body pathology to chaperone gene expression in brains of patients with PD.

(A) Immunohistochemistry of pS129 α-synuclein (EP1536Y) in formalin fixed prefrontal cortex cortical sections detected α-synuclein-positive Lewy bodies and Lewy neurites. All scale bars represent 50 μm, except in the right-most panel scale bar = 25 μm. (B) Bar graph of Lewy body plus Lewy neurite score quantification across conditions (n = 12 with 6 PD and 6 HC, unpaired t-test P = 0.03). (C) Dot plots showing the differential expression of genes related the unfolded protein misfolding pathway in excitatory neurons (ExN) and inhibitory neurons (InN) of PD versus healthy controls (HC). (D) Dot plot of differential gene expression patterns of ExN versus InN in PD patients (log_fc: log fold changes). (E) Correlation between gene expression and pathology scores for each gene of the protein misfolding pathway. Spearman’s correlation coefficient (R2) was calculated based on normalized gene expression versus Lewy pathology score.
We then carried out an unbiased correlation analysis of Lewy body pathology score with gene expression and identified postsynaptic gene ontology pathways as the most positively correlated pathway (q = 0.0009). Protein folding pathways (q = 0.021) were most negatively correlated with the Lewy body pathology score. To further evaluate the negative correlation between protein folding pathways and Lewy body pathology score, we plotted the differential expression of downregulated genes in the protein folding pathway in excitatory neurons and inhibitory neurons. PD brains showed a lower average expression in most heat shock protein genes in excitatory neurons in comparison to healthy controls (Fig. 2C). Although inhibitory neurons also displayed similar trends of downregulation of chaperone genes in PD, it was not as pronounced as the repressive patterns of protein misfolded response genes in excitatory neurons (Fig. 2C). The relative sparing of chaperone expression within cortical inhibitory neurons in PD may contribute to the observation that Lewy bodies are most often found in excitatory neurons but not inhibitory neurons (17). All misfolded protein response genes exhibited downregulation in excitatory neurons in PD, apart from three genes (HSPH1, HSPB1, and CHORDC1) (Fig. 2, C and D). Based on the immunohistochemistry Lewy pathology score (Fig. 2B), we performed a Pearson’s correlation analysis for each gene of the protein folding pathway. Overall, we identified negative correlation patterns, suggesting that Lewy pathology is inversely correlated with chaperone gene expression in PD brains, including for HSP90AB1 (R2 = 0.74; m = −0.42), HSPA1A (R2 = 0.61; m = −0.34), and DNAJA4 (R2 = 0.58; m = −2.7) (Fig. 2E). As several of these chaperones have been shown to be directly involved in α-synuclein protein folding, this finding suggests a decrement in chaperone capacity contributes to Lewy body pathology. Although HSPA4L displayed the most prominent difference in gene expression across excitatory and inhibitory neuronal cell types, Lewy pathology showed a minimal correlation (R2 = 0.014; m = 0.41), indicating disaggregase activity (HSPA4L encoded Hsp110 (18) is the rate limiting component of the disaggregase), is probably not enhanced in PD brains, adding to the pathology.
Regulation of PARK and GWAS candidate genes in human PD brains.
We corroborated our PD single nucleus RNA sequencing dataset by analyzing differential expression of all known 23 PARK genes in PD brains and each brain cell type, including SNCA (PARK1/4), PRKN (PARK2), PINK1 (PARK6), DJ-1 (PARK7), and LRRK2 (PARK8), as well as the PD risk gene GBA (Fig. 3, A and B, fig. S5, A and B). SNCA and LRRK2 were upregulated in PD brains, consistent with previous literature that reported increased expression or activity (in the case of LRRK2) is associated with greater disease risk of PD (19). LRRK2 was highly expressed in microglia and oligodendrocyte precursor cells, commensurate with previous reports of LRRK2 expression in monocytes in the blood samples of PD patients (20), pointing to the potential role of LRRK2 in neuroinflammation. Expression of PRKN, PINK1, GBA and PARK7 were downregulated in PD brains mainly in excitatory neurons, suggesting a loss-of-function role in PD (Fig. 3B). This directionality of expression extended to most PD genes, implying that the modest changes in PARK gene expression could contribute to disease risk, as was unequivocally established for SNCA (21). We next sought to correlate PARK gene expression in excitatory neurons with Lewy pathology scores. We found that LRRK2 (PARK8) (R2 = 0.58; m = 1.9), GIGY2 (PARK11) (R2 = 0.48; m = 1.6) and DNAJC13 (PARK21) (R2 = 0.39; m = 2.7) expression was positively correlated with Lewy pathology scores (fig. S6).
Fig. 3. Cell-type-specific regulation of PARK genes and GWAS candidate genes in brains of patients with PD.

(A) Dot plots showing the expression of known PARK genes and GBA in human PD brains compared to healthy controls (HC). (B) Violin plots showing cell-type-specific differential expression of SNCA, LRRK2, PRNK, PINK1, GBA and PARK7 in major neuronal and glial brain cell types in human brains PD versus HC. (C) Heatmap for cell-type-specific expression of UTMOST identified most significant genes in PD brains compared to healthy controls, with normalized average gene expression value for each gene across cells for a specific cell type. (D) Heatmap for cell-type-specific differential expression of UTMOST prefrontal cortex most significant genes with effect size greater than 0 in human PD brains compared to healthy controls, with normalized average gene expression value for each gene in a specific cell type. (E) Heatmap for cell-type-specific differential expression of UTMOST prefrontal cortex most significant genes with effect size less than 0 in human PD brains compared to healthy controls, with normalized average gene expression value for each gene in a specific cell type.
Meta-analysis of genome-wide association studies (GWAS) of PD have identified over 50 risk haplotypes for the disease (22, 23). To evaluate their expression patterns in human PD brains, we carried out Unified Test for Molecular Signatures (UTMOST) analysis (24), a summary-statistic-based testing framework to quantify the overall gene–trait association across all tissues. Using GWAS data from the NINDS-Genome-Wide Genotyping in Parkinson’s Disease project, we performed UTMOST multi-tissue joint analysis (Fig. 3C), which is a cross-tissue transcriptome-wide association analysis tool, and identified 48 genes, including seven genes in the prefrontal cortex (BA9) with a positive effect size, and 12 genes with a negative effect size in this brain region (Fig. 3D). We then assessed the differential expression of these UTMOST identified genes in PD brains for each brain cell type, using the z scores calculated from the t-test for each gene in PD brains versus healthy controls of our single nucleus dataset. Genes rendered from the UTMOST joint-tissue analysis can be broadly clustered into a PD upregulated set (Fig. 3C top) and a PD downregulated set (Fig. 3C bottom). Upregulated genes including MAPT, TMEM163, and KAT8 were enriched in oligodendrocytes, whereas most of downregulated genes were found principally in excitatory neurons, including LRC37A2, BCL7C, and LRRC37A2. In terms of prefrontal cortex specific genes, we observed many overlapping profiles with the joint-tissue gene list. For example, STX4 and NUPL2 had positive effect sizes and were highly expressed in microglia (Fig. 3D), whereas LRRC37A2, BCL7C, RNF40, DCTPP1, and LRRC37A, had negative effect sizes and were downregulated in excitatory neurons (Fig. 3E). The integration of UTMOST genetic and single nucleus transcriptomic analysis underscored the cellular heterogeneity and brain cell-type specificity of GWAS disease risk genes in PD.
Transcriptional dynamics of excitatory neurons and glial cell subtypes in PD.
To infer transcriptional gene expression dynamics of the major neuronal and glial brain cell types in PD, we applied unsupervised single cell RNA velocity analysis of nascent (unspliced) and mature (spliced) mRNAs to our single nucleus dataset using scVelo (25), since the sequencing of single nuclei can potentially identify and enrich the amount of unspliced reads from precursor mRNA (pre-mRNA) (5, 25). The single cell RNA velocity fields projected on the Uniform Manifold Approximation and Projection (UMAP) (26) plots described the local average velocity and trajectory dynamics of each cell type in PD and healthy control brains (fig. S7, A and B). The trajectories of all subpopulations of excitatory neurons were altered, with excitatory neuron subclusters 2 and 3 shifting dramatically, from a left-to-right pattern to a top-to-bottom pattern (fig. S7, A and B), indicating a selective transcriptomic signature change for excitatory neuron subpopulations and these neurons were most vulnerable in PD brains. The genes and pathways that were altered in excitatory neuron subpopulations were related to neurotransmission (SYN2, MCTP1, PCLO), synaptic signaling (HTR2A, SYN2, CLSTN2, SLC4A10) and structure (LRFN5, SLIT1, RAPGEF4) (fig. S7, C to F), using gene ontology pathway analysis. A unique pattern of T cell trajectory was found in the PD brains, suggesting a specific role of brain-resident T cells in PD, with enriched FYN and THEMIS genes, which have a regulatory function for T cells (fig. S7, A to B and F). In contrast, the dynamics of inhibitory neurons did not show a major pattern change in PD brains, indicating excitatory neuronal populations are more vulnerable neuronal cell types in PD brains.
We next performed single cell RNA velocity on the different individual brains separately and found a systematic pattern between individuals with a high pathology score and a low pathology score, with samples having lower pathology scores being more similar to healthy controls. For example, in the direct comparison of PD05 (highest pathology score 11.9), PD01 (lowest pathology score 0.1) and HC01 (pathology score 0), there was a dramatic direction shift of the dynamics in excitatory neuronal subpopulations of ExN1, ExN2, and ExN3 in PD05 compared with PD01 and HC01, which suggests that the pathology score may correlate with the transcriptional dynamics and the disease progression, as shown by the RNA velocity plots (fig. S8, A to C).
Cell-cell communications between neurons, glia, and T cells in PD brains.
To systematically study neuro-immune interactions in the brain between neurons and glial cell types and how those interactions are affected by PD, we leveraged our human brain single nucleus RNA-seq dataset to identify candidate cell-cell communication pathways using CellPhoneDB (27), a repository of ligand-receptor interacting pairs. We first curated cell-cell interactions in healthy control brains and then extended the survey of cell-cell communications between cell types in PD brains to enable comparisons. A matrix of the difference of cell-cell interaction pair numbers in PD brains to healthy controls revealed that overall cell-cell interactions are decreased in PD across all cell types, indicating a general loss of cell-cell communication in PD brains (Fig. 4A). One of the most dramatic changes in cell-cell communication was between excitatory neurons and astrocytes, where approximate 25% of the interactions were lost in PD compared to healthy controls (table S4). In controls, astrocytes express the EGF receptor which interacts with TGF-β and betacellulin (BTC) (28) expressed by excitatory neurons. However, these interactions were missing in the PD brains (Fig. 4B). SIRPA/CD47 signaling was also lost in PD brains, suggesting an abnormal neuroinflammation process (29). Interactions involving activin receptor (ACVR) between excitatory neurons and astrocytes were absent along with the interaction between the tyrosine kinase TYRO3 receptor and its ligand GAS6. Taken together, the lack of key cell-cell communications between astrocytes and excitatory neurons in the PD brains shows a pattern of abatement of neuron-glia interactions in PD, suggesting an abnormal neuroinflammatory process in PD brains.
Fig. 4. Cell-cell communications between brain cell types in brains of patients with PD.

(A) Matrix showing the difference in cell-cell interaction pair numbers between PD (n = 6 individuals) versus healthy control (HC, n = 6 individuals) brains. (B) Dot blot showing the cell-cell interaction between excitatory neurons (ExN) and astrocytes (Astro) in PD and HC brains. (C) Dot plot showing the strength of cell-cell interactions between brain-resident T cells (Tcells) and excitatory neurons (ExN) in PD and HC brains (different font colors indicate - red: unique interactions in PD; blue: unique interactions in HC, black: common in HC and PD).
We previously identified soluble and surface receptor-surface ligand pairs between T-cells and neuronal and glial cells in healthy control brains (30). In PD brains, most of the key interactions between T cells and excitatory or inhibitory neurons were retained, including interactions involving the co-inhibitory ligand T cell immunoreceptor with Ig and ITIM domains (TIGIT), the brain tissue resident marker of CD96, and the chemokines CCL3 and CCL4 (Fig. 4C). Additional interaction pairs between the NOTCH signaling pathway were identified in PD brains, indicating a possible pathogenic link between Notch pathway and PD (31) (Fig. 4C, table S4). The loss of MHC class II chaperone CD74 interactions with APP or COPA between T cells and excitatory neurons in PD brains suggests a potential reduction in the immune regulation and suppression for amyloid-ß processing. Transmembrane chemokine CX3CL1 is expressed by neurons and regulates immune activation through its unique receptor CX3CR1 in homeostatic immune surveillance. We found this immune regulation is reduced in the PD brains (Fig. 4C), indicating an altered neuro-immune response in PD.
Paired proteomic and transcriptomic analysis of PD brains.
To detect differences in protein abundance in PD brains compared to healthy controls, we utilized unbiased, label-free quantitative mass spectrometry to profile proteomic changes from the same brain region and tissues of the same donors that were used for our single nucleus transcriptomics analysis to facilitate paired proteomic and transcriptomic analysis of PD brains. In total, 35,964 peptides were mapped to 2,534 unique gene symbols from mass spectrometry analysis. A total of 22 proteins were identified as differentially expressed between PD brains and healthy controls (two-sided t-test, P < 0.05), with 13 upregulated proteins, including CDH2 (N-Cadherin), GSTT1 (Glutathione-S-transferase theta 1) and N4BP1 (NEDD4 binding protein), as well as 9 downregulated proteins, including SEC13, BRCC3, and NDRG2, as shown by a volcano plot (Fig. 5A). Heatmaps of individuals reveal most of these proteins have distinct expression patterns across all PD and healthy control brains (Fig. 5B). We further analyzed all differentially expressed proteins by GO pathway analysis for both upregulated and downregulated pathways (Fig. 5C). Top upregulated gene ontology pathways include glutathione metabolic process involving glutathione S-transferase (GST), an anti-oxidant enzyme known to protect neurons from reactive oxidative species (32), as well as maintenance of cytoskeleton polarity, which could be indicative of a cellular adaptation to reinforce intracellular protein transport. Downregulated GO pathways included branched chain amino acid metabolic / catabolic processes which is known to affect tyrosine metabolism and dopamine (33). Also, pathways that regulate COPII vesicle coating and protein transport from ER to Golgi were downregulated, suggesting perturbation in protein transport processes.
Fig. 5. Paired proteomics and single cell transcriptomics of brains of patients with PD.

(A) Volcano plot showing significant differentially expressed proteins (n = 2,523 proteins, two-sided t test, P < 0.05) of PD (n = 6 individuals) versus health controls (HC, n = 6 individuals). (B) Heat map showing the upregulated (top) and downregulated (bottom) differentially expressed proteins (there were no significant differentially expressed proteins after Bonferroni or FDR correction). (C) Upregulated (top) and downregulated (bottom) gene ontology (GO) terms (n = 13 upregulated and 9 downregulated genes as input (P < 0.05), hypergeometric test, FDR correction). (D) Distinct protein modules (M1-M14) clustered by WGCNA across PD and HC. Each module’s label is the most significantly enriched GO term of that module proteins. (E) Eigen-proteins that are highly expressed in PD brains compared to HC in the most upregulated modules of M1 and M2. (F) Cell-type enrichment evaluated by module proteins against lists of RNA markers for different brain cell types from the single nucleus transcriptomic data using the one-tailed Fisher’s exact test. Blue line: P < 0.05. Red line: Adjusted P < 0.05, Bonferroni correction.
We harmonized the proteomic data and single nucleus transcriptomic data to survey differentially expressed proteins in PD brains compared to healthy controls from proteomic data to their RNA expression in excitatory neurons. Since protein and RNA abundance are not always directly correlated (34), we characterized the co-expression pattern in the proteomics data, and performed weighted gene co-expression network analysis (WGCNA) for the relationship of different gene sets (modules). We identified 14 modules (M1 to M14) in the human brain proteomic dataset across PD and healthy control samples. Two of the modules were synapse related (M1 synaptic vesicle cycle, and M2 synapse organization), whereas the remaining modules were associated with cellular respiration (M3), protein activation cascade (M4), and antigen processing and presentation (M8) (Fig. 5D). Of note, the two synapse related modules of synaptic vesicle cycle (M1) and synapse organization (M2) were both upregulated in PD brains (Fig. 5E), which corroborates findings from single nucleus transcriptomic analysis indicating upregulation of these pathways (Fig. 1G, presynaptic assembly, axongenesis). To further determine whether these modules contain cell-type specific information, we assessed the overlap of the proteins from each module with the cell type specific marker genes identified from our single nucleus transcriptomic dataset. Accordingly, excitatory neuron-specific marker genes were enriched in synapse related module M1 (HPCAL1, NPTX1, and SYN2), M2 (ERC2, CDH13, and CCK), and M11 (HPCA, and DCLK1). The enrichment of SYN2 was also identified using single cell RNA velocity analysis in PD brains (fig. S7F), suggesting a robust enrichment of synaptic signaling for both RNA and protein in PD brains. The M4 module was enriched for microglia markers (PADI2, CD14, and CD163) and endothelial cell markers (ANXA1, and CFH). The M7 module was associated with both astrocyte markers (SLC14A1, AQP4, and AGT) and endothelial cell markers (COL1A2, CAVIN2, and FN1). Oligodendrocyte markers were over-represented in the M5 module, including ANLN, ERMN, and CNP (Fig. 5F). In summary, we identified distinctive differentially expressed proteins and pathways between PD brains and healthy controls through proteomics analysis. Based on WCGNA co-expression analysis, these changes could be attributed to specific cell types based on the transcriptomic analysis of the same PD brains at the single cell level. A pattern that emerged from this analysis is that synaptic pathways are detrimentally impacted by the disease within PD neurons.
We next performed WGCNA on the single nucleus transcriptomic dataset of major neuronal and glial cell types for RNA modules and then compared with protein modules (35, 36). We found many overlaps between the RNA modules and protein modules (fig. S9, A to F). For example, both the ExN green module and the InN blue module had significant overlaps with the protein blue module (p = 1.50e-10, and p = 4.54e-18, respectively) (fig. S9G). The gene UCHL1, which is expressed in neurons, was present in all three modules, and has been shown to be associated with PD. Furthermore, the microglia (MG) turquoise-protein turquoise intersection was enriched in genes that can be linked to PD (fig. S9G). For instance, KLK6 encodes a protease that participates in alpha-synuclein cleavage and involves in PD pathogenesis, wheras DLG1 plays an important role in microglia activation in PD mouse models.
Cross-neurodegenerative disease comparisons of PD and AD at both transcriptomic and proteomic levels.
As AD and PD are the two most common late-onset neurodegenerative disorders, it is of importance to understand similarities and differences at the transcriptomic and proteomic levels. To identify shared PD and AD signatures at the transcriptional level, we first compared our single nucleus transcriptomic dataset with a publicly available AD single nucleus sequencing dataset which profiled postmortem human brain region of the prefrontal cortex (Brodmann area 10, BA10) from 24 AD patients and 24 controls (10). In AD and PD comparisons, we identified 138 common differentially expressed genes across all six major brain cell types, including excitatory neurons, inhibitory neurons, oligodendrocytes, astrocytes, microglia, and oligodendrocytes precursor cells, although overlapping differentially expressed genes showed distinct patterns across cell types. There was no PD and AD common differentially expressed genes within a neuronal population. However, there were overlaps in glial cell types, such as oligodendrocytes (upregulated: SLC38A2, CA2; downregulated: UTY, RASGRAF2), astrocytes (upregulated: MT2A, MT1E, MRAS, COL27A1, PLEC, M1M, MT1G; downregulated: ALDH1A1, BAALC), and microglia (upregulated: SPP1, APOE, APOC1, CACNA1A, IRF8; downregulated: SYTL3, IFI44L) (Fig. 6A). Mirroring the transcriptomic analyses, the overlapping differential expression pathways (P < 0.05, FDR) between PD and AD were exclusively found in astrocytes and microglia, with no shared pathways in neuronal or other cell types (Fig. 6B). The top overlapping pathways for astrocytes were associated with biological processes that involve cadmium or copper ion detoxification, wheras those for microglia were related to immune responses, cell activation, and protein secretion (Fig. 6C). We further compared the overlapping DEGs and pathways between the microglia of our PD brain dataset and a recent AD brain microglial dataset with both early and late AD cases across multiple brain regions (37) (fig. S10, table S5). Top overlapping downregulated pathways between AD and PD microglia were focal adhesion and cell-substrate junction (fig. S10, A and B), whereas the top overlapping upregulated pathways between microglia from PD and early AD were mostly related to immune response and activation (fig. S10C), indicating common signature of neuroinflammation in PD and AD microglia.
Fig. 6. Comparison between PD and AD single cell transcriptomics and proteomics.
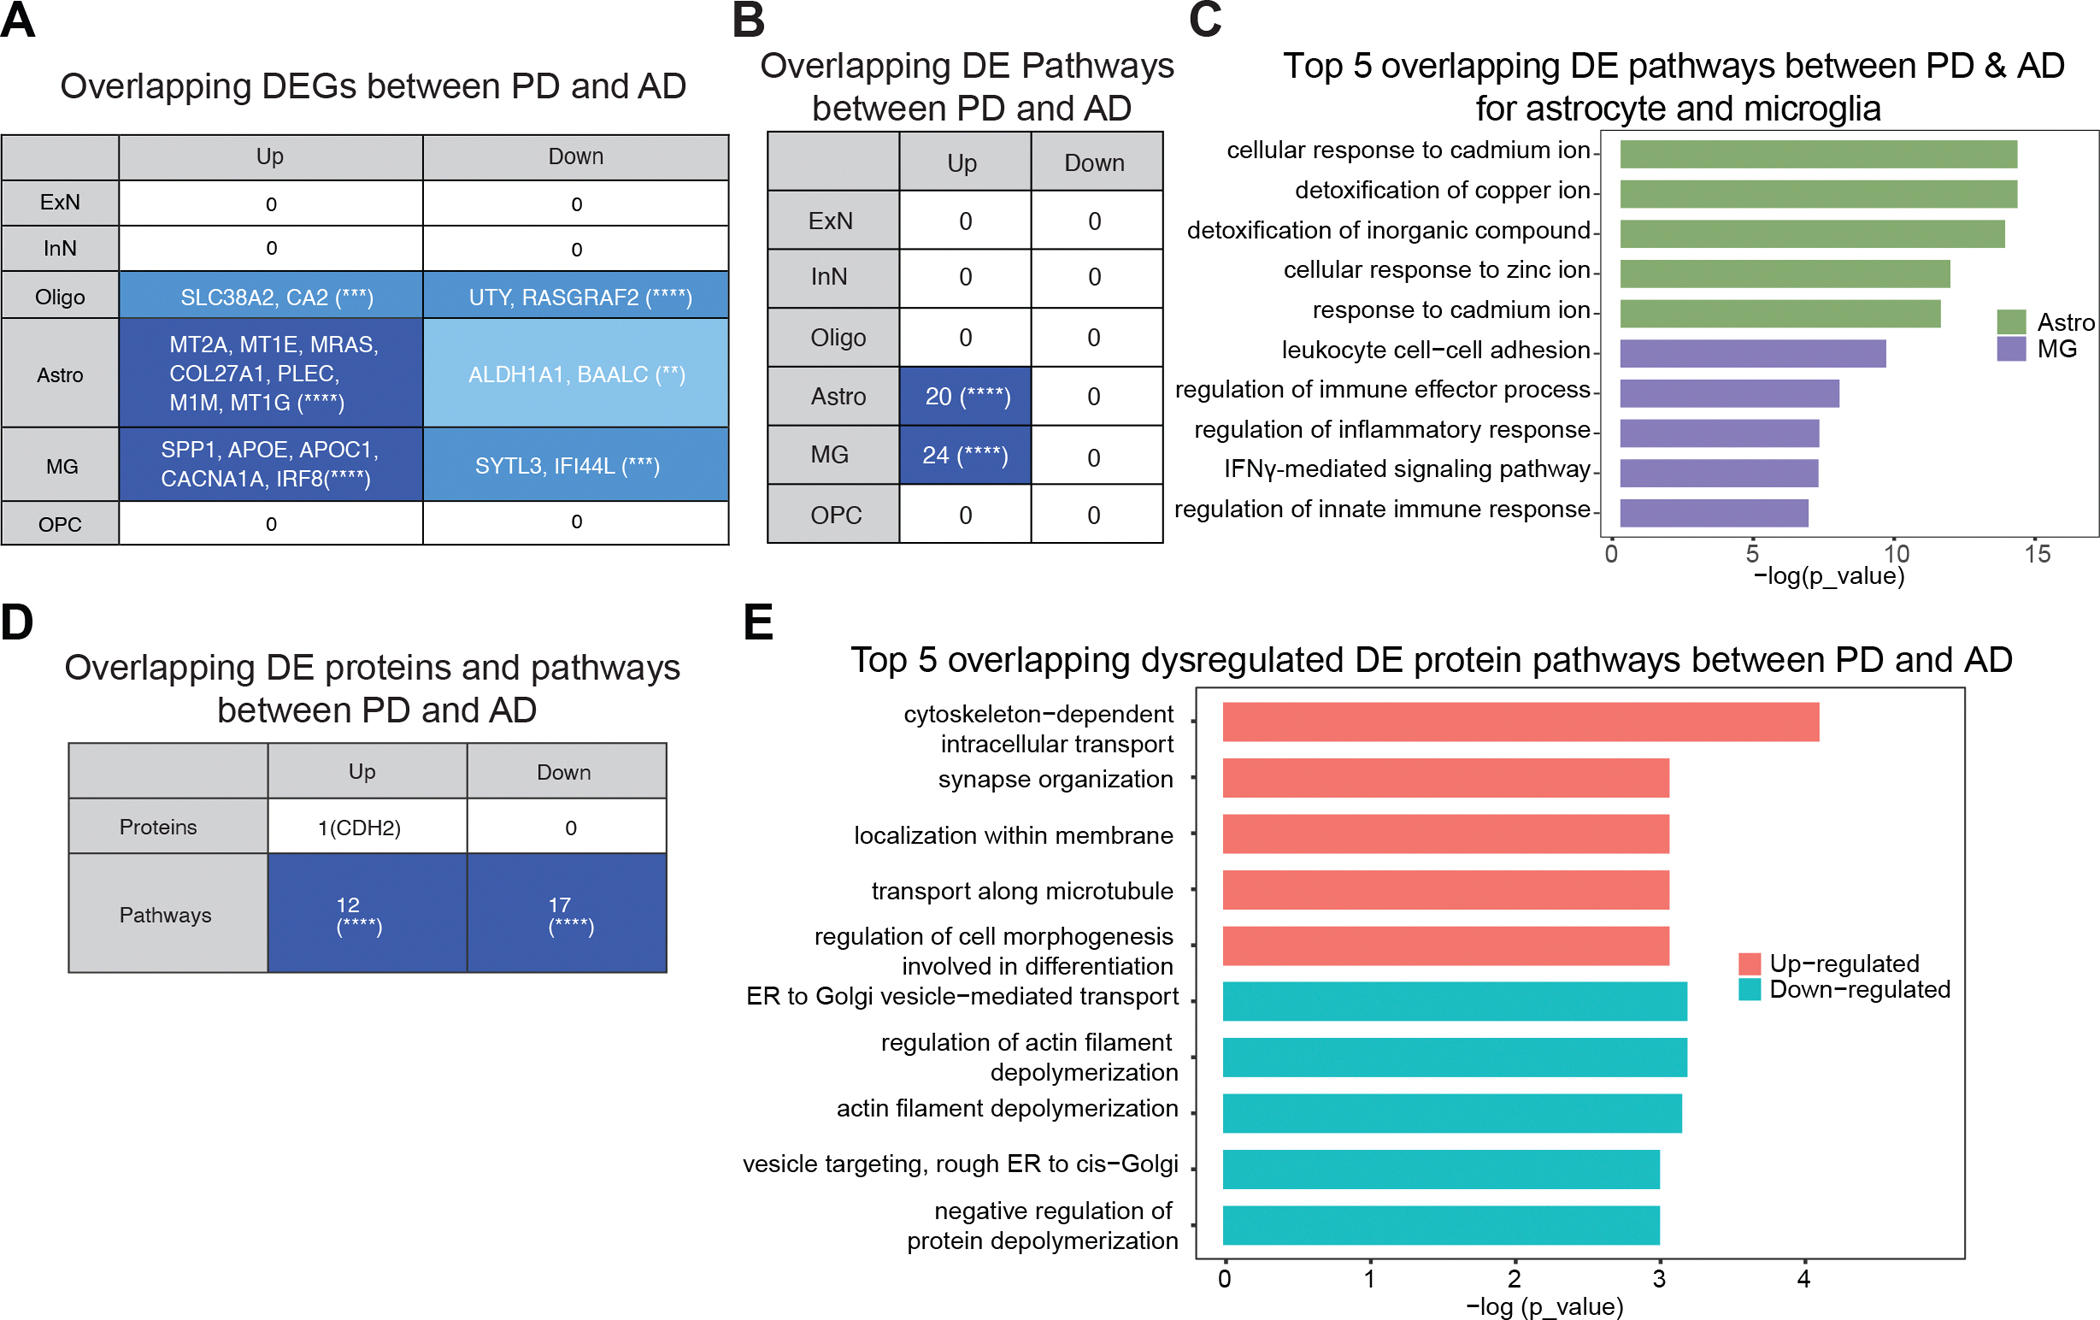
(A) The number of overlapping differentially expressed genes (DEGs) for each cell type between PD brain single nucleus transcriptomic data and Mathys et al’s AD brain single nucleus transcriptomic data (10) (n = 24 AD and 24 healthy controls). Over-representation test, (**): P ≤ 0.01, (***): P ≤ 0.001, (****): P ≤ 0.0001 (B) The number of overlapping (over-representation test, (****): P ≤ 0.0001) differentially expressed (DE) Gene ontology terms (hypergeometric test, FDR correction) for each cell type between PD brain single nucleus transcriptomic data and Mathys et al’s AD brain single nucleus transcriptomic data (10). (C) Top five overlapping differentially expressed (DE) pathways for astrocytes (Astro) and microglia (MG) between PD and AD. (D) The number of overlapping (over-representation test, (****): P ≤ 0.0001) differentially expressed (DE) proteins (P < 0.05) and pathways (genes with P < 0.1) between PD proteomics and Ping et al’s AD proteomics data (58) (there are n = 632 upregulated and 1222 downregulated genes for Ping et al’s data (58)). (E) Top five overlapping upregulated and downregulated differentially expressed (DE) protein pathways between PD and AD.
We next compared our proteomics data to an analogous proteomics AD dataset of the prefrontal cortex(38). This AD dataset was reported by Ping et al.(38) with 10 AD and 10 healthy control brains in the region of BA9 which was subjected to the same mass spectroscopy procedures as for our PD proteomics data. We identified 5,143 proteins that were expressed in all samples, with minimal overlap between AD and PD. We revealed overlap for 12 upregulated pathways and 17 downregulated pathways (Fig. 6D). The top common upregulated pathways were linked to cytoskeleton-dependent intracellular transport, whereas common downregulated pathways in PD and AD were associated with ER to Golgi vesicle transport as well as filament depolymerization (Fig. 6E), akin to what we identified in the transcriptomic comparison of PD and AD (Fig. 6C). Taken together, both at the proteomic and transcriptomic levels, the two most common neurodegenerative disorders appear to initiate distinct pathogenesis processes in the brain, with shared impact on the glial cells of astrocytes and microglia.
DISCUSSION
Although several underlying mechanisms have been suggested for the pathogenesis of PD, there have not been effective treatments that prevent disease progression, in part because the molecular architecture of PD is largely unknown. With rapid advancement of single cell RNA sequencing technologies in tandem with computational methods, it is possible to identify detailed disease signatures in PD at a single-cell resolution. Here we provided an extensive analysis profiling nearly 80,000 brain nuclei from the prefrontal cortex of late-stage PD brains. We demonstrated that α-synuclein pathology is inversely correlated with chaperone expression in excitatory neurons. We further extended our analysis by utilizing advanced computational methods including UTMOST, scVelo, CellPhoneDB, and WGCNA to gain a comprehensive understanding of the dataset. By examining cell-cell interactions, we found a selective abatement of neuron-astrocyte interactions with enhanced neuroinflammation. Finally, in comparing AD to PD prefrontal cortex, we did not find common expressed genes in neurons but identified many shared differentially expressed genes in glial cells, suggesting that disease etiology in PD and AD are distinct. We augmented the study with proteomic analysis and cross-comparisons with AD datasets of the same brain region, providing valuable insights into the pathways of neurodegeneration.
Using single nucleus RNA sequencing, we profiled unique disease signatures of neuronal and glial cell populations correlating them with GWAS and proteomic data. GO pathway analysis of the single nucleus data (Fig. 1G–H) identified cell-type specific disrupted biological processes, with distinct pathways highlighted in the major cell types of the brain: neurons (upregulated: synapse assembly, synaptic organization; downregulated: protein folding), astrocytes (upregulated: response to metal ion, downregulated: coagulation), microglia (upregulated: immunological activation; downregulated: phospholipid binding), oligodendrocytes/OPC (upregulated: regulation of cell growth) and T cells (upregulated: T cell differentiation).
We observed upregulation of presynaptic assembly/organization pathways by differential gene expression analysis (Fig. 1G) and RNA velocity in neuronal populations. Several genes (EPHA6, NLGN4Y, CBLN2) encode for synaptic cell-adhesion molecules that are known to orchestrate synapse formation and maintenance. Overexpression of these pathways may reflect perturbations in synaptic architecture that is crucial to maintaining basal circuitry in the prefrontal cortex. These results align with the idea that cognitive impairments in PD are mainly attributed to altered activity of the neural pathways connecting the anterior striatum with the prefrontal cortical region (39). Single cell RNA velocity results (fig. S7) underscored these synaptic changes in excitatory neurons. WGCNA modules (M1: synaptic vesicle cycling, M2: synapse organization) derived from proteomic interrogation of the prefrontal cortex further support the concept that synaptic pathways are defective in PD excitatory neurons. We further compared the potential shared pathways in the prefrontal cortex neurons from out dataset and substantial nigra dopamine neurons from a recent published dataset (7) and revealed overlapping downregulated pathways related to neuron to neuron synapse (fig. S10, E and F, table S5). Lastly, downregulated pathways in PD neurons were all related to protein folding and will be discussed further below.
Microglia are the most abundant immune cells in the central nervous system and are thought to participate in PD disease progression (40). The frequency of oligodendrocytes was found to be decreased in PD patient brains, whereas the number of microglia was increased compared to healthy controls, suggesting that glial cell populations play differential, but important role(s) in PD pathology (Fig. 1). Similar trends have been described in the analysis of a PD midbrain dataset (41). Also, an increased proportion of microglia was found in a recent single cell study of anterior cingulate cortex across Lewy body diseases (6). In our dataset, microglia had the greatest number of DEGs (135 upregulated, 178 downregulated) with a distinct signature of gliosis in the up-regulated gene ontology pathways. Genes responsible for myeloid cell differentiation (FOS, STAT3, RUNX1) and regulation of hemopoiesis (BCL6, IL4R, JAK3) were activated and are strong indicators of neuroinflammation in the prefrontal cortex. Many of the DEGs in oligodendrocytes and OPCs, encode GWAS hits such as MAPT and TMEM163 (Fig. 3). In the case of astrocytes, even though we did not observe any changes in numbers, we observed clear upregulation of pathways in astrocytes related to stress responses to heavy metals. Astrocytes are known to protect neurons by accumulating heavy metals commensurate with their deposition in PD (42).
One notable finding was the identification of T cells in PD brains. In this population, there was gene enrichment for pathways regulating homeostasis of cell numbers (IL7R, IL15, MALT1) and regulation of T cell differentiation (CAMK4, CD28, ZAP70). Our results are congruent with recent findings that clonal expansion of α-synuclein reactive T cells have been identified in the brains of PD patients(14, 15) and that CD4+ T cells contribute to neurodegeneration in Lewy body dementia(43). Our findings add to existing data suggesting that T cell mediated immunity plays an important role in PD and α-synucleinopathies. Our results also indicate the need to carefully profile T cells in in PD at different stages, and other movement disorders as well as AD and tauopathies for comparative and mechanistic purposes.
We observed severe downregulation of protein folding and misfolded protein response pathways (HSP90AB1, HSPB1, DNAJB6) in both excitatory and inhibitory neuronal populations, though the effect was more pronounced in excitatory neurons (Fig. 2C, D). Due to the constant proteostatic stress in synaptic terminals, impairment of chaperone machinery has been known to cause functional deficits in neurons, which has long-term impact on cortical neurotransmission (44). We evaluated the effects of proteostasis deficits by correlating chaperone/heat shock protein gene expression in excitatory neurons with phospho-S129-α-synuclein positive Lewy pathology, revealing negative associations of chaperone expression in relation to Lewy bodies and Lewy neurites (Fig. 2E). These data highlight the utility of leveraging single cell/nucleus data derived from postmortem human brain tissue in the context of neuropathology.
Most of the heat shock proteins that are encoded by genes in the downregulated protein folding pathways are neuroprotective since they directly interfere with α-synuclein misfolding. For example, Hsp90ab1, which is highly negatively correlated with Lewy pathology score, is known to inhibit α-synuclein aggregation by interacting with oligomeric species(45). Another example is heat shock protein DNAJB6 which has been shown to suppress α-synuclein aggregation. Knockout models resulted in a higher number of exogenous preformed fibrils (PFFs)-induced synuclein aggregates(46). DNAJB1 in conjunction with the HSPA1A (Hsp70) disaggregase-complex is linked to disassembling α-synuclein amyloid fibrils (47). Finally, our observations support the notion that the molecular chaperones which show decreased expression in PD have an active role in α-synuclein protein quality control and are potential therapeutic targets for PD.
In a cross-comparison of our PD dataset with the AD dataset generated by Mathys et al. (10), we did not observe overlapping genes or pathways in excitatory or inhibitory neuronal populations. In addition, we did not identify overlapping genes and pathways in oligodendrocytes and OPCs, even though these cell types appear to have a prominent role in AD (10). Rather, we observed upregulation of common pathways within astrocyte and microglia populations. The top upregulated pathways in astrocytes in PD are stress responses to heavy metals. These detoxification pathways are also observed in AD, suggesting that a common disease signature in astrocytes. Our data reflect recent work where similar glial activation profiles were observed in tissue from patients with multiple sclerosis, macular degeneration, and AD (48). Collectively, these data suggest commonalities between PD, AD and other neurodegenerative diseases in terms of gene expression profiles are mostly localized to non-neuronal glial cells, particularly astrocytes and microglia and may reflect similarities in immune activation responses.
The top five overlapping pathways between PD and AD prefrontal cortex for microglia consisted of pathways for interferon gamma signaling and innate immune cell regulation, implying a shared immune response across the two neurodegenerative diseases. One of the overlapping genes was ApoE which encodes for apolipoprotein E and is a well-studied genetic risk factor for AD, dementia with Lewy bodies, and Parkinson disease dementia (49, 50). ApoE was downregulated in both PD and AD in microglia. Studies have shown activated microglia promotes tau pathogenesis in an ApoE dependent manner (51). Our transcriptomic profiling of PD patients highlights the role of ApoE in microglia and calls for further investigation of how ApoE promotes neuroinflammation. It also underscores the suggestion that T cell mediated adaptive immunity may be different between AD, PD and other α-synucleinopathies such as Lewy body dementia (43), even though PD and AD share microglial neuroinflammatory signatures.
This study has limitations. The differentially expressed protein analysis was conducted on individual-level data from 12 subjects. Due to low statistical power, we could not identify differentially expressed proteins after Bonferroni or FDR correction and therefore used raw p-values without any correction to identify differentially expressed proteins. Thus, this proteomic dataset will need to be validated on larger patient cohorts in the future. Although it would be best to do single cell mass spectrometry analysis and make comparisons to the single nucleus RNA sequencing data, single cell mass spectrometry is in its infancy as a method and no one to date has done both single cell mass spectrometry and single cell RNA sequencing on the same tissue. For protein co-expression network analysis, our sample size of either PD or control brains was relatively small, thus the WGCNA network analysis of PD and controls were not computed separately to prevent potential power issue, and in addition, we performed scale-free assessment for evaluation of the WGCNA network, and with a soft thresholding of 12, R^2 is nearly 0.9, which shows WGCNA performs well on our proteomics dataset. Regarding using Lewy body pathology to infer causative processes, it is difficult and it is not clear whether the observed decrease in chaperones contributed to pathology or was a response to it.
In summary, the tandem employment of single nucleus transcriptomic studies and unbiased proteomic interrogation of the prefrontal cortex in PD provides invaluable insight into the complex molecular and cellular pathobiology of late-stage PD. Taken together, these datasets are a valuable resource to the scientific research community for assessment of the underlying pathogenesis of PD. It is also a tool to evaluate overarching neurodegenerative disorder dysfunctions through cross comparisons with analogous datasets obtained from diseases, including movement disorders with cognitive decline, the AD spectrum, and other tauopathies. Such investigations may lead to a better mechanistic understanding of disease processes as well as provide viable targets for therapeutic intervention.
MATERIALS AND METHODS
Study design
The primary goal of this study was to define cellular diversity and disease-associated transcriptomic and proteomic changes in the brains of patients with PD. We performed single nucleus RNA sequencing, label free quantitative mass spectrometry and Lewy body pathology analysis using postmortem human brain tissue from the prefrontal cortex in six patients with late-stage PD and six sex- and age-matched healthy controls. Samples from PD and control brains were paired into disease versus control groups based on their sexes and ages for batches of experiments. Investigators were not blinded to disease conditions during experiments and assessment of results.
Prefrontal cortex (BA9, dorsolateral prefrontal cortex) obtained from postmortem PD and non-diseased age- and sex-matched control individuals was provided by brain tissue biorepository at Nathan Kline Institute and New York University Grossman School of Medicine (NKI/NYUGSOM) (52, 53). Study participants were allocated into disease or control groups based on overall PD clinical diagnosis and brain pathology as described previously (2),(54),(55). Dissected brain tissues were fresh frozen and stored at −80 °C until use. Sperate cohorts of prefrontal cortex brain tissues including both PD cases and healthy controls were obtained from Banner Sun Health Institute and Yale Alzheimer’s Disease Research Center for validation assays.
Nuclei isolation from postmortem frozen human brain tissue
Nuclei were isolated from postmortem human brain tissue as previously described (30) with modifications. All procedures were carried out on ice or at 4 °C. In brief, fresh frozen tissue (50 to 100 mg) was homogenized in 15 ml of ice-cold nuclei homogenization buffer [2 M sucrose, 10 mM Hepes (pH 7.9), 25 mM KCl, 1 mM EDTA (pH 8.0), 10% glycerol, and ribonuclease (RNase) inhibitors freshly added (80 U/ml)] using a 15-ml Wheaton Dounce tissue grinder (10 strokes with the loose pestle and 10 strokes with the tight pestle). The homogenate was transferred into a 50 ml ultracentrifuge tube on top of 10 ml of fresh nuclei homogenization buffer cushion and centrifuged at 24,000 rpm for 60 min at 4 °C on ultracentrifuge. The supernatant was removed, and the pellet was resuspended in 1 ml of nuclei resuspension buffer [15 mM Hepes (pH 7.5), 15 mM NaCl, 60 mM KCl, 2 mM MgCl2, 3 mM CaCl2, and RNase inhibitors freshly added (80 U/ml)] and counted on a hemocytometer with Trypan Blue staining. The nuclei were centrifuged at 800g for 10 min at 4°C with a swing bucket adaptor and resuspended at a concentration of 500 to 1000 nuclei/ul in the nuclei resuspension buffer for the next step of 10x Genomics Chromium loading.
Droplet-based single nucleus RNA sequencing
The single nucleus RNA sequencing libraries were prepared by the Chromium Single Cell 3′ Reagent Kit v3 chemistry according to the manufacturer’s instructions (10x Genomics). The generated single nucleus libraries were sequenced using Illumina NovaSeq6000 S4 at a sequencing depth of 300 million reads per sample, with an average sequencing dept of 50,000 – 100, 000 reads per nucleus.
Single cell data alignment.
For single nucleus RNA sequencing data of brain tissues, a custom pre-mRNA human genome reference was generated with human genome reference GRCh38_3.0.0 (available from 10x Genomics) that included pre-mRNA sequences, and single nucleus sequencing data were aligned to this GRCh38–pre-mRNA reference to map both unspliced pre-mRNA and mature mRNA using CellRanger version 3.1.0. Total 300 million reads for each sample maps to an average of 90.0% of the whole human genome and to 79.1% of both intron and exon regions.
Single cell quality control, clustering and cell type annotation
After quality control filtering of eliminating nuclei with less than 200 genes (poor quality nuclei) and more than 7,000 genes (potential doublets) per nucleus, we profiled 77,384 brain nuclei and detected a median of 2,598 genes and 5,639 transcripts per nucleus (fig. S1D, 3027 mean genes and 8629 mean transcripts per nucleus). Seurat (version 4.0.2) (56) single cell analysis R package was used for processing the single nucleus data, integration procedure, and downstream analysis. We normalize and identify variable features for each dataset independently. Basically, the top 2000 most variable genes across all nuclei in each sample were identified, followed by the integration of all samples using the FindIntegrationAnchors function for identifying anchors and using IntegrateData function for integrating all the datasets together, and dimensionality reduction using principal components analysis (PCA). Then, Uniform Manifold Approximation and Projection for Dimension Reduction (UMAP) was applied to visualize all cell clusters, and the classification and annotation of distinct cell types was based on known marker genes of each major brain cell type and the entire single nucleus gene expression matrix (fig. S1G). Difference in cell type abundance, such as differences in the number (or proportion) of T cells and microglia between PD and control group, were tested using the Wilcoxon Rank Sum test using the function Wilcox test in R. Wilcoxon rank-sum test is a nonparametric test of the null hypothesis that two sets of samples are from populations with the same distribution, which is an alternative to Student’s t-test when the data do not satisfy a normal distribution.
Differential expression analysis
Differential expression analysis for single nucleus RNA sequencing data was performed using the Wilcoxon Rank Sum test using the function FindMarkers of the Seurat package (4.0.2) in R. For T cells, the threshold was set as the absolute value of the expression log fold change of PD over healthy controls being larger than 0.75 with no other constraints. For other cell types, the genes were filtered using the default parameters. We followed the same procedure as that by Mathys et al(10) and Grubman et al(57) in AD single nucleus transcriptomic data analysis, and the parameters were set to the default values for all the cell types. As for differential analysis for proteomics data, we used the two-sided t test for both our data and Ping et al(58) AD data. Proteins were called differentially expressed if P < 0.05.
Gene ontology (GO) pathway analysis
Gene-set and protein enrichment analysis was performed using the function enrichGO from the R package clusterProfiler. GO terms from biological process, cellular component, and molecular function subontologies were considered. The background genes were set to be all the protein coding genes in the single nucleus transcriptomic data. We used the default values for the other parameters. For plotting, we prioritized biological process over cellular component, followed by molecular function.
RNAscope in situ hybridization, imaging, and quantification
To validate gene expression differences identified by single nucleus RNA sequencing, RNA in situ hybridization was performed using the RNAscope Multiplex Fluorescent v2 Assay (Advanced Cell Diagnostics, Inc., Newark, CA, USA). Human brain tissue from the prefrontal cortex of either PD or controls was flash frozen and stored at −80°C. Prior to performing the assay, frozen tissue was embedded in OCT and sectioned at 10μm using cryostat. RNAscope in situ hybridization was performed according to the manufacturer’s protocol. Briefly, fresh frozen sections were fixed in 10% neutral buffered formalin for 1 hour at room temperature, then sequentially dehydrated in 50% ethanol, 70% ethanol, 100% ethanol, and 100% ethanol for 5 minutes each at room temperature. Tissue sections were pretreated with hydrogen peroxide and protease to block endogenous peroxidase activity and optimally permeabilize the sections. Target RNAscope probes, such as EPHA6, CBLN2, PLCG2 and HSP90AA1, were hybridized to tissue sections, signal was amplified, and fluorescent dyes of Opal Dye 570 or 650 were applied. Positive control RNAscope probes for human POLR2S, PPIB, UBC, and HPRT-1 and a negative control probe for Bacillus subtilis DapB were used to ensure detection of target RNA signals and a lack of non-specific probe binding. All tissue sections were counterstained with DAPI. Images were captured using a Leica SP8 motorized staging confocal microscope with a 20x lens (Leica #506517). Confocal imaging settings were kept constant between healthy controls and PD. RNA expression was quantified using QuPath, by detecting the cells using DAPI channel, identifying and measuring probe channel signals, and calculating estimated spot count per cell for the entire cryosection. RNA expression in human brain sections from PD patients was compared to that in healthy control human brains in approximately 10,000 nuclei from each tissue section, and statistical significance was determined using Student’s t-test.
Single cell-level annotation of post-GWAS candidate genes
To determine if any PD related GWAS genes were also DEGs in a particular cell type of our single nucleus transcriptomic data, we downloaded the single nucleotide polymorphism (SNP) summary statistics from the NINDS-Genome-Wide Genotyping in Parkinson’s Disease Project (https://www.ncbi.nlm.nih.gov/projects/gap/cgi-bin/study.cgi?study_id=phs000089.v3.p2) to impute the cross-tissue expression and the overall gene-trait association using the Python package UTMOST. The resulting genes that are associated with PD in prefrontal cortex (BA9) and the overall joint-tissues were extracted and filtered to select genes having P value < 0.05 after Bonferroni correction. Next, conditional analysis was performed using the function conditional_test_geneset to mitigate gene co-regulation or linkage disequilibrium (LD). Finally, the z scores were calculated from the two-sided t test of PD versus healthy controls for each cell type in the single nucleus transcriptomic data using the two sets of the UTMOST PD-associated genes.
Single cell RNA velocity analysis of RNA velocity and gene identification
The RNA velocity was computed using the Python package scVelo. The PD samples and the HC samples were processed separately to better compare the differences between these two conditions. First, the function filter_and_normalize was applied to conduct data filtering, normalization and log transformation. Next, for each cell, the first- and second- order moments were calculated by the function pp.moments. Then, the gene velocities and graph were calculated, and the velocities were projected to the precomputed UMAP plot using velocity, velocity_graph, and velocity_embedding_stream functions respectively, with default parameters. And finally, to identify cell type specific genes that are responsible for the inferred velocities compared to all the other cell types, the function rank_velocity_genes was employed for each cell type separately.
Cell-cell Communication Analysis by CellphoneDB
Using major brain cell clusters described above from single nucleus RNA-seq data of PD and HC brains, library size normalized counts matrices were input into the CellPhoneDB (https://github.com/Teichlab/cellphonedb, v2.0.0) python package along with a metadata file containing cluster names. The fraction of cells in a cluster expressing a gene was set to 0.02 and statistical analysis with a p value cutoff of 0.01 was performed using 1000 iterations. A lenient cutoff was set for the fraction of cells expressing a gene to allow for the identification of potential interactions involving lowly-expressed genes and due to the fact that the proportion of cells expressing a gene in nuclei may be different than in the total cell. All other parameters were left as default. Full resulting analysis tables with all cell-cell interactions are present in table S4. PD or HC brain samples were integrated for cell type clustering and applying CellPhoneDB on the integrated single cell datasets of either PD or control brains, identify cell-cell communication networks in PD or control, and compare the overall interaction strength, as well as the differential ligand-receptor pairs between PD and control in the given cell types and across all cell types.
Weighted gene co-expression network analysis (WGCNA) module detection on the proteomics dataset
The function blockwiseModules in the R package WGCNA was used to identify modules of highly correlated proteins across PD and healthy control samples. Module eigen-protein was calculated as the first principal component of each of the resulting 13 protein modules and was used to summarize and represent the expression pattern of all the proteins in that module. The label for each module was chosen to be the top significant Gene Ontology (GO) terms using the function enrichGO.
Over-representation analyses for protein module cell-type RNA marker enrichment
Over-representation test was performed using the one-tailed Fisher’s exact test with the R function phyper to compare each WGCNA protein module against the RNA markers for each cell type from the single nucleus transcriptomic data. Bonferroni adjusted P values were calculated to adjust for multiple comparisons. The background for the over-representation test was set as the number of genes in each RNA marker list.
Supplementary Material
Supplementary Materials
This PDF file includes:
Supplementary Materials and Methods
Other Supplementary Materials:
Data File S1 (Tables S1 to S5)
Acknowledgments:
We thank Jesse Cedarbaum and Philip Coish for reading manuscript. The authors also acknowledge Yale Pathology Tissue Services for assistance in tissue processing and staining and Yale Center for Genome Analysis for 10x Genomics library preparation and Illumina sequencing. We also thank Florine Collins, Weiwei Wang and Jean Kanyo for proteomics sample preparation and data collection.
Funding:
This work was supported by Aligning Science Across Parkinson’s (ASAP; R.C., D.A.H., S.S.C., L.Z.), McKnight Foundation (R.C., S.S.C.), and NIH RF1 NS110354 (S.S.C.). The necessary mass spectrometers and the accompany biotechnology tools within the MS & Proteomics Resource at Yale University is funded in part by the Yale School of Medicine and by the Office of The Director, National Institutes of Health (S10OD02365101A1, S10OD019967, and S10OD018034), and additional support came from NIH Yale/NIDA Neuroproteomics Centre (DA018343). The study is funded by the joint efforts of the Michael J. Fox Foundation for Parkinson’s Research (MJFF) and the Aligning Science Across Parkinson’s (ASAP) initiative. MJFF administers the grant [ASAP-000529] on behalf of ASAP and itself.
Footnotes
Competing interests: Authors declare that they have no competing interests.
Data and materials availability:
All data associated with this study are present in the paper and the Supplementary Materials. All postmortem brain single nucleus RNA sequencing data are available through the National Center of Biotechnology Information’s Gene Expression Omnibus (GEO) at the accession number of GSE202210, including raw sequencing data of fastq files and processed data of gene expression matrix. Raw mass spectrometry data have been deposited in the PRIDE repository and is publicly available at the ProteomeXchange accession of PXD030142. Code for Seurat (56), UTMOST (24), scVelo (25), CellPhoneDB (27), and WGCNA (59) is available at github.com or zenodo.org.
References and Notes
- 1.Poewe W et al. , Parkinson disease. Nature Reviews Disease Primers 3, 17013 (2017). [DOI] [PubMed] [Google Scholar]
- 2.Beach TG et al. , The Sun Health Research Institute Brain Donation Program: description and experience, 1987–2007. Cell Tissue Bank 9, 229–245 (2008). [DOI] [PMC free article] [PubMed] [Google Scholar]
- 3.Lindestam Arlehamn CS, Garretti F, Sulzer D, Sette A, Roles for the adaptive immune system in Parkinson’s and Alzheimer’s diseases. Curr Opin Immunol 59, 115–120 (2019). [DOI] [PMC free article] [PubMed] [Google Scholar]
- 4.Stuart T et al. , Comprehensive Integration of Single-Cell Data. Cell 177, 1888–1902.e1821 (2019). [DOI] [PMC free article] [PubMed] [Google Scholar]
- 5.Ma S-X, Lim SB, Single-Cell RNA Sequencing in Parkinson’s Disease. Biomedicines 9, 368 (2021). [DOI] [PMC free article] [PubMed] [Google Scholar]
- 6.Feleke R et al. , Cross-platform transcriptional profiling identifies common and distinct molecular pathologies in Lewy body diseases. Acta Neuropathol 142, 449–474 (2021). [DOI] [PMC free article] [PubMed] [Google Scholar]
- 7.Kamath T et al. , Single-cell genomic profiling of human dopamine neurons identifies a population that selectively degenerates in Parkinson’s disease. Nat Neurosci 25, 588–595 (2022). [DOI] [PMC free article] [PubMed] [Google Scholar]
- 8.Braak H et al. , Staging of brain pathology related to sporadic Parkinson’s disease. Neurobiology of Aging 24, 197–211 (2003). [DOI] [PubMed] [Google Scholar]
- 9.Nido GS et al. , Common gene expression signatures in Parkinson’s disease are driven by changes in cell composition. Acta Neuropathologica Communications 8, (2020). [DOI] [PMC free article] [PubMed] [Google Scholar]
- 10.Mathys H et al. , Single-cell transcriptomic analysis of Alzheimer’s disease. Nature 570, 332–337 (2019). [DOI] [PMC free article] [PubMed] [Google Scholar]
- 11.Hoffman GE, Schadt EE, variancePartition: interpreting drivers of variation in complex gene expression studies. BMC Bioinformatics 17, 483 (2016). [DOI] [PMC free article] [PubMed] [Google Scholar]
- 12.Rouault TA, Iron metabolism in the CNS: implications for neurodegenerative diseases. Nature Reviews Neuroscience 14, 551–564 (2013). [DOI] [PubMed] [Google Scholar]
- 13.Ward RJ, Zucca FA, Duyn JH, Crichton RR, Zecca L, The role of iron in brain ageing and neurodegenerative disorders. The Lancet Neurology 13, 1045–1060 (2014). [DOI] [PMC free article] [PubMed] [Google Scholar]
- 14.Sulzer D et al. , T cells from patients with Parkinson’s disease recognize α-synuclein peptides. Nature 546, 656–661 (2017). [DOI] [PMC free article] [PubMed] [Google Scholar]
- 15.Lindestam Arlehamn CS et al. , α-Synuclein-specific T cell reactivity is associated with preclinical and early Parkinson’s disease. Nature Communications 11, (2020). [DOI] [PMC free article] [PubMed] [Google Scholar]
- 16.Gate D et al. , CD4(+) T cells contribute to neurodegeneration in Lewy body dementia. Science 374, 868–874 (2021). [DOI] [PMC free article] [PubMed] [Google Scholar]
- 17.Gómez-Tortosa E, Sanders JL, Newell K, Hyman BT, Cortical neurons expressing calcium binding proteins are spared in dementia with Lewy bodies. Acta Neuropathologica 101, 36–42 (2001). [DOI] [PubMed] [Google Scholar]
- 18.Nonoguchi K et al. , Cloning of human cDNAs for Apg-1 and Apg-2, members of the Hsp110 family, and chromosomal assignment of their genes. Gene 237, 21–28 (1999). [DOI] [PubMed] [Google Scholar]
- 19.Nalls MA et al. , Large-scale meta-analysis of genome-wide association data identifies six new risk loci for Parkinson’s disease. Nature Genetics 46, 989–993 (2014). [DOI] [PMC free article] [PubMed] [Google Scholar]
- 20.Bliederhaeuser C et al. , LRRK2 contributes to monocyte dysregulation in Parkinson’s disease. Acta Neuropathologica Communications 4, (2016). [DOI] [PMC free article] [PubMed] [Google Scholar]
- 21.Simon-Sanchez J et al. , Genome-wide association study reveals genetic risk underlying Parkinson’s disease. Nat Genet 41, 1308–1312 (2009). [DOI] [PMC free article] [PubMed] [Google Scholar]
- 22.Chang D et al. , A meta-analysis of genome-wide association studies identifies 17 new Parkinson’s disease risk loci. Nature Genetics 49, 1511–1516 (2017). [DOI] [PMC free article] [PubMed] [Google Scholar]
- 23.Nalls MA et al. , Identification of novel risk loci, causal insights, and heritable risk for Parkinson’s disease: a meta-analysis of genome-wide association studies. The Lancet Neurology 18, 1091–1102 (2019). [DOI] [PMC free article] [PubMed] [Google Scholar]
- 24.Hu Y et al. , A statistical framework for cross-tissue transcriptome-wide association analysis. Nature Genetics 51, 568–576 (2019). [DOI] [PMC free article] [PubMed] [Google Scholar]
- 25.La Manno G et al. , RNA velocity of single cells. Nature 560, 494–498 (2018). [DOI] [PMC free article] [PubMed] [Google Scholar]
- 26.McInnes L, Healy J, Melville J, Umap: Uniform manifold approximation and projection for dimension reduction. arXiv preprint arXiv:1802.03426, (2018). [Google Scholar]
- 27.Efremova M, Vento-Tormo M, Teichmann SA, Vento-Tormo R, CellPhoneDB: inferring cell–cell communication from combined expression of multi-subunit ligand–receptor complexes. Nature Protocols 15, 1484–1506 (2020). [DOI] [PubMed] [Google Scholar]
- 28.Hyrc KL, Bownik JM, Goldberg MP, Neuronal free calcium measurement using BTC/AM, a low affinity calcium indicator. Cell Calcium 24, 165–175 (1998). [DOI] [PubMed] [Google Scholar]
- 29.Zhang H, Li F, Yang Y, Chen J, Hu X, SIRP/CD47 signaling in neurological disorders. Brain Research 1623, 74–80 (2015). [DOI] [PMC free article] [PubMed] [Google Scholar]
- 30.Pappalardo JL et al. , Transcriptomic and clonal characterization of T cells in the human central nervous system. Science Immunology 5, eabb8786 (2020). [DOI] [PMC free article] [PubMed] [Google Scholar]
- 31.Imai Y et al. , The Parkinson’s Disease-Associated Protein Kinase LRRK2 Modulates Notch Signaling through the Endosomal Pathway. PLOS Genetics 11, e1005503 (2015). [DOI] [PMC free article] [PubMed] [Google Scholar]
- 32.Smeyne M, Smeyne RJ, Glutathione metabolism and Parkinson’s disease. Free Radical Biology and Medicine 62, 13–25 (2013). [DOI] [PMC free article] [PubMed] [Google Scholar]
- 33.Le Masurier M, Oldenzeil W, Lehman C, Cowen P, Sharp T, Effect of Acute Tyrosine Depletion in Using a Branched Chain Amino-Acid Mixture on Dopamine Neurotransmission in the Rat Brain. Neuropsychopharmacology 31, 310–317 (2006). [DOI] [PubMed] [Google Scholar]
- 34.Seyfried NT et al. , A Multi-network Approach Identifies Protein-Specific Co-expression in Asymptomatic and Symptomatic Alzheimer’s Disease. Cell Systems 4, 60–72.e64 (2017). [DOI] [PMC free article] [PubMed] [Google Scholar]
- 35.Luo Y et al. , Single-cell transcriptome analyses reveal signals to activate dormant neural stem cells. Cell 161, 1175–1186 (2015). [DOI] [PMC free article] [PubMed] [Google Scholar]
- 36.Xue Z et al. , Genetic programs in human and mouse early embryos revealed by single-cell RNA sequencing. Nature 500, 593–597 (2013). [DOI] [PMC free article] [PubMed] [Google Scholar]
- 37.Sun N et al. , Human microglial state dynamics in Alzheimer’s disease progression. Cell 186, 4386–4403 e4329 (2023). [DOI] [PMC free article] [PubMed] [Google Scholar]
- 38.Ping L et al. , Global quantitative analysis of the human brain proteome in Alzheimer’s and Parkinson’s Disease. Scientific Data 5, 180036 (2018). [DOI] [PMC free article] [PubMed] [Google Scholar]
- 39.Cools R, Dopaminergic modulation of cognitive function-implications for l-DOPA treatment in Parkinson’s disease. Neuroscience & Biobehavioral Reviews 30, 1–23 (2006). [DOI] [PubMed] [Google Scholar]
- 40.Ho MS. (Springer; Singapore, 2019), pp. 335–353. [Google Scholar]
- 41.Smajić S et al. (Cold Spring Harbor Laboratory, 2020). [Google Scholar]
- 42.Agarwal D et al. , A single-cell atlas of the human substantia nigra reveals cell-specific pathways associated with neurological disorders. Nature Communications 11, (2020). [DOI] [PMC free article] [PubMed] [Google Scholar]
- 43.Gate D et al. , CD4(+) T cells contribute to neurodegeneration in Lewy body dementia. Science, eabf7266 (2021). [DOI] [PMC free article] [PubMed] [Google Scholar]
- 44.Gorenberg EL, Chandra SS, The Role of Co-chaperones in Synaptic Proteostasis and Neurodegenerative Disease. Frontiers in Neuroscience 11, (2017). [DOI] [PMC free article] [PubMed] [Google Scholar]
- 45.Daturpalli S, Waudby CA, Meehan S, Jackson SE, Hsp90 inhibits alpha-synuclein aggregation by interacting with soluble oligomers. J Mol Biol 425, 4614–4628 (2013). [DOI] [PubMed] [Google Scholar]
- 46.Deshayes N, Arkan S, Hansen C, The Molecular Chaperone DNAJB6, but Not DNAJB1, Suppresses the Seeded Aggregation of Alpha-Synuclein in Cells. International Journal of Molecular Sciences 20, 4495 (2019). [DOI] [PMC free article] [PubMed] [Google Scholar]
- 47.Gao X et al. , Human Hsp70 Disaggregase Reverses Parkinson’s-Linked alpha-Synuclein Amyloid Fibrils. Mol Cell 59, 781–793 (2015). [DOI] [PMC free article] [PubMed] [Google Scholar]
- 48.Kuchroo M et al. , Single-cell analysis reveals inflammatory interactions driving macular degeneration. Nat Commun 14, 2589 (2023). [DOI] [PMC free article] [PubMed] [Google Scholar]
- 49.Davis AA et al. , APOE genotype regulates pathology and disease progression in synucleinopathy. Sci Transl Med 12, (2020). [DOI] [PMC free article] [PubMed] [Google Scholar]
- 50.Liu CC, Liu CC, Kanekiyo T, Xu H, Bu G, Apolipoprotein E and Alzheimer disease: risk, mechanisms and therapy. Nat Rev Neurol 9, 106–118 (2013). [DOI] [PMC free article] [PubMed] [Google Scholar]
- 51.Shi Y et al. , Microglia drive APOE-dependent neurodegeneration in a tauopathy mouse model. Journal of Experimental Medicine 216, 2546–2561 (2019). [DOI] [PMC free article] [PubMed] [Google Scholar]
- 52.Ginsberg SD et al. , Selective decline of neurotrophin and neurotrophin receptor genes within CA1 pyramidal neurons and hippocampus proper: Correlation with cognitive performance and neuropathology in mild cognitive impairment and Alzheimer’s disease. Hippocampus 29, 422–439 (2019). [DOI] [PMC free article] [PubMed] [Google Scholar]
- 53.Ginsberg SD et al. , RNA sequestration to pathological lesions of neurodegenerative diseases. Acta Neuropathol 96, 487–494 (1998). [DOI] [PubMed] [Google Scholar]
- 54.Braak H, Ghebremedhin E, Rüb U, Bratzke H, Del Tredici K, Stages in the development of Parkinson’s disease-related pathology. Cell and Tissue Research 318, 121–134 (2004). [DOI] [PubMed] [Google Scholar]
- 55.Beach TG et al. , Arizona Study of Aging and Neurodegenerative Disorders and Brain and Body Donation Program. Neuropathology 35, 354–389 (2015). [DOI] [PMC free article] [PubMed] [Google Scholar]
- 56.Hao Y et al. , Integrated analysis of multimodal single-cell data. Cell 184, 3573–3587 e3529 (2021). [DOI] [PMC free article] [PubMed] [Google Scholar]
- 57.Grubman A et al. , A single-cell atlas of entorhinal cortex from individuals with Alzheimer’s disease reveals cell-type-specific gene expression regulation. Nat Neurosci 22, 2087–2097 (2019). [DOI] [PubMed] [Google Scholar]
- 58.Ping L et al. , Global quantitative analysis of the human brain proteome in Alzheimer’s and Parkinson’s Disease. Sci Data 5, 180036 (2018). [DOI] [PMC free article] [PubMed] [Google Scholar]
- 59.Langfelder P, Horvath S, WGCNA: an R package for weighted correlation network analysis. BMC Bioinformatics 9, 559 (2008). [DOI] [PMC free article] [PubMed] [Google Scholar]
Associated Data
This section collects any data citations, data availability statements, or supplementary materials included in this article.
Supplementary Materials
Data Availability Statement
All data associated with this study are present in the paper and the Supplementary Materials. All postmortem brain single nucleus RNA sequencing data are available through the National Center of Biotechnology Information’s Gene Expression Omnibus (GEO) at the accession number of GSE202210, including raw sequencing data of fastq files and processed data of gene expression matrix. Raw mass spectrometry data have been deposited in the PRIDE repository and is publicly available at the ProteomeXchange accession of PXD030142. Code for Seurat (56), UTMOST (24), scVelo (25), CellPhoneDB (27), and WGCNA (59) is available at github.com or zenodo.org.