

Abstract
Motivations bias our responses to stimuli, producing behavioral outcomes that match our needs and goals. We describe a mechanism behind this phenomenon: adjusting the time over which stimulus-derived information is permitted to accumulate toward a decision. As a Drosophila copulation progresses, the male becomes less likely to continue mating through challenges1–3. We show that a set of Copulation Decision Neurons (CDNs) flexibly integrates information about competing drives to mediate this decision. Early in mating, dopamine signaling restricts CDN integration time by potentiating CaMKII activation in response to stimulatory inputs, imposing a high threshold for changing behaviors. Later into mating, the timescale over which the CDNs integrate termination-promoting information expands, increasing the likelihood of switching behaviors. We suggest scalable windows of temporal integration at dedicated circuit nodes as a key but underappreciated variable in state-based decision-making.
The ability to change behavioral responses to information collected from the world is a defining feature of motivation4. Studies of motivational scaling have focused primarily on the potentiation of sensory stimuli when our internal states make us more likely to act on them5–14, perhaps in part because sensory responses are reliable and easily measured. Sensory scaling would likely help animals to identify relevant environmental stimuli, but many signals are either ambiguous or relevant to multiple behaviors, requiring modifications at other sites of control. By localizing a motivated decision to a small group of neurons governing an innate behavior and subjecting them to extensive electrical and molecular manipulations, we find another solution to the problem of motivational response tuning. We find that motivation biases a decision by altering the time over which information is retained and allowed to accumulate in sensory-agnostic decision-making neurons.
Drosophila copulation provides a clear and quantitative readout of motivated decision-making. Mating precludes many other behaviors, so to respond to changing conditions flies must first stop mating. Undisturbed copulations last ~23 minutes, but if a dangerous situation arises the male1–3 may decide to truncate the mating (Figure 1a, Extended Data Figure 1f), depending on both the severity of the threat and how far the mating has progressed. For the first several minutes after initiating copulation, the male will sacrifice his (and his partner’s) life in the face of a potentially lethal threat, presumably to ensure successful fertilization. But his persistence (or propensity to keep mating when challenged) decreases as time passes, reflecting the increasing likelihood that the goals of mating have been achieved1–3.
Figure 1: Copulation Decision Neuron (CDN) activity controls the real-time decision to end matings.

(a) The male maintains a stereotyped posture while mating. When challenged he may decide to detach himself from the female and end the mating.
(b) The CDNs (labeled by NP2719-Gal41) reside in the abdominal ganglion of the ventral nervous system. Scale bar is 20 µm.
(c) Acute silencing of the CDNs using the light-gated chloride channel GtACR1 prevents termination in response to a one-minute-long 39°C heat threat. Error bars for proportions here and in all other figures (unless otherwise stated) represent 67% credible intervals, chosen to resemble the standard error of the mean. For the number of samples in each experiment, see Supplementary Table 3. For statistical tests, see Supplementary Table 4.
(d) Electrical activity in the CDNs is only necessary at the time of mating termination. Tonic silencing of the CDNs results in extended mating duration (fifth column, mean: 101 minutes), but silencing from the beginning until near the natural end of mating does not affect copulation duration (third column). Matings in which the CDNs are silenced through the normal ~23-minute termination time end seconds after the light is turned off (fourth column). Green rectangles represent the time during which the neurons were silenced. Error bars for dot plots here and throughout represent standard error of the mean.
(e) Acute optogenetic stimulation of the CDNs causes termination. Two seconds of stimulation is sufficient to terminate copulation. “No ret.” refers to flies that were not fed retinal, the obligate chromophore for CsChrimson’s light sensitivity.
(f) The termination response to minute-long green light stimulation (green lines; Left: 9.72 μW/mm2, Right: 8.03 μW/mm2) of the CDNs is potentiated as a mating progresses, similar to the response to real-world challenges like heat threats (orange lines).
We previously used the motivational dynamics of this system to study how neurons measure time on the scale of minutes2. That mechanism centered on the self-sustained activity of CaMKII, achieved through autophosphorylation at residue T287, a feature intensely studied for its role in memory formation and storage in the mammalian hippocampus15,16. Here, in a different set of neurons, we find another long-timescale function for CaMKII: matching decision-making to motivational state by scaling the amount of time over which information is integrated. These findings broaden the implications for CaMKII in regulating phenomena over timescales longer than can be supported by electrical activity alone17,18.
There are three main findings in this study: 1) that the changing integrative properties of the sexually dimorphic Copulation Decision Neurons (CDNs) underlie the male fly’s decrease in persistence as mating progresses; 2) that the timescale of integration is set by levels of CaMKII activity; and 3) that motivating dopaminergic signaling increases CaMKII’s excitability in the CDNs, restricting integration time and steering the resolution of conflicting drives. This mechanism supports flexible decision-making by allowing decision-relevant information to accumulate over timescales that depend on the relative values of the behaviors under consideration.
RESULTS
CDNs mediate a probabilistic decision
Our previous work showed that synaptic release of GABA from NP2719-Gal4 neurons (a set of abdominal ganglion interneurons referred to here as the CDNs; Figure 1b, Extended Data Figure 1a, Extended Data Figures 8–11, Supplementary Discussion 1) is required for matings to end at the appropriate time1 but with the tools available at the time could not resolve their role in the immediate decision to terminate the mating (Supplementary Note 1). Here we explored the relationship between acute CDN activity and decision-making. Silencing the CDNs with GtACR119 (a light-gated chloride channel) during the presentation of a heat threat caused the male to persist through a strong challenge that would otherwise end nearly all matings (Figure 1c and Video 1). In unchallenged matings, tonic CDN inhibition extended copulation duration well beyond the natural ~23-minute mark (Figure 1d), but if the inhibition ended after 20 minutes, matings were of normal duration. Tonic inhibition that continued beyond 23 minutes resulted in near-instantaneous termination after the inhibition concluded (Figure 1d). Inversely, CDN silencing that began just before 23 minutes extended matings as much as if the neurons had been inhibited throughout the mating (Extended Data Figure 1b). These results show that the electrical activity of the CDNs is not required to keep time during mating — only for the decision to end it, whether in response to threats or at its ~23-minute conclusion.
Two seconds of optogenetic CDN stimulation using the red-light gated cation channel CsChrimson (Chr)20 terminated nearly 100% of matings (Video 2 and Figure 1e) with a dismounting procedure resembling the response to threatening stimuli (Video 3). Termination occurred regardless of time into mating and with a variable latency of up to 30 seconds after the stimulation pulse (Extended Data Figure 1d). CDN stimulation in non-mating flies did not induce any obvious change in behavior and did not stop flies from courting or initiating mating (Extended Data Figure 1c), arguing against a startle reflex or activation of a motor pattern generator. Silencing the CDNs immediately after stimulation prevented terminations that had not already occurred (Extended Data Figure 1e), suggesting a requirement for sustained CDN electrical activity to make and execute the decision to switch behaviors.
The results from these initial optogenetic experiments were all-or-nothing, either suppressing the fly’s response to threats 100% of the time or inducing termination 100% of the time. But the fly’s responses to natural stimuli are probabilistic, with a gradually increasing fraction of matings being truncated in response to identical stimuli as the mating progresses1. If the CDNs were to adjust their output in response to direct stimulation according to mating time, then they might be the locus at which the termination probability is rescaled. To provide direct input to the CDNs without immediately terminating matings we delivered green light to mating pairs, which is less effective than red light at stimulating CsChrimson20 and slightly less effective at penetrating the fly’s cuticle21. The efficacy of minute-long green light CDN stimulation increased as mating progressed, with each condition quantitatively matching the response of a real-world threat of fixed severity (Figure 1f). These data argue that the CDNs treat sustained artificial stimulation similarly to their natural inputs, even though the excitation is non-synaptic and not matched to specific physiological dynamics. Since these experiments completely bypass sensory input by directly stimulating the CDNs, our results argue against an important role for motivational amplification of sensory stimuli upstream of the CDNs. Instead, together with the molecular results below, they argue that motivational scaling occurs within the CDNs.
Integration time expands later in mating
In contrast to minute-long real-world threats and optogenetic stimulation bouts, termination to brief (500 ms or 1 sec), strong (i.e., bright red light) optogenetic pulses did not change from 10 to 15 minutes into mating (Figure 2a). The importance of stimulus duration in elevating termination probability late in mating raised the idea that the CDNs may change the timescale over which they integrate information rather than perceived stimulus intensity as mating progresses.
Figure 2: The CDNs integrate multimodal inputs over longer timescales as mating progresses.

(a) Termination in response to brief, strong CDN stimulation does not increase as mating progresses.
(b) Left: flies are given two strong 500-millisecond CDN stimulation pulses. Right: probability of mating termination in response to independent (top) or integrated (bottom) pulses.
(c) The response to two CDN stimulation pulses is greater than expected if each pulse acted independently (grey line = 2p-p2, estimated using the single pulse response (p)). Pulses are integrated over longer timescales later in mating.
(d) Male flies become progressively more likely to stop mating in response to a 350-millisecond wind gust (Extended Data Figure 2a–c; Video 4).
(e) Silencing the CDNs with tetanus toxin (Tnt) prevents wind-induced mating termination (Video 5).
(f) Paired wind gusts (650 milliseconds at 10 minutes, 250 milliseconds at 15 minutes) are integrated over a longer timescale at 15 minutes into mating.
(g) Six-second optogenetic grooming neuron stimulation causes CDN-dependent termination with increasing propensity as mating progresses.
(h) Two pulses of grooming neuron stimulation separated by 5 seconds are integrated at 15, but not 10, minutes into mating.
(i) CDN silencing during only the first of two optogenetic grooming pulses induces the same level of termination as if only one pulse (no CDN inhibition) was delivered.
(j) Response of a model system to input pulses of varying duration. For pulses longer than the integration window, information accumulates faster and peaks higher with a greater .
(k) Fitting behavioral data to the linear model (left) reveals a higher time constant of integration, , at 15 minutes into mating compared to 10 minutes (right). Parameter error bars represent one standard error of the parameter fit (Supplementary Note 2, Extended Data Figures 3,4). Gray shaded regions represent model pointwise 95% coverage intervals.
To examine the role of integration time in information processing and rule out confounding effects of sustained stimulation on the CsChrimson protein itself, we separated two, strong, 500 millisecond stimulation pulses by various time intervals (Figure 2b). These two pulses resulted in termination rates well above the expectation if each pulse were acting independently, but only when the pulses were presented sufficiently close together in time (Figure 2c). At 15 minutes into mating, the two pulses were integrated over a longer time interval than at 10 minutes, showing that integration cannot be accounted for by the dynamics of CsChrimson alone20 and instead arguing that information is retained over a longer time window as the mating progresses.
Because CsChrimson delivers depolarizing currents throughout the cell, rather than specifically at postsynaptic sites, we designed a preparation using naturalistic stimuli that could be delivered in quick pulses. We delivered sub-second gusts of wind to mating pairs (Extended Data Figure 2a–e), as we had previously demonstrated that sustained exposure to intense airflow could interrupt mating1. Individual bursts of wind became more and more effective in causing termination as the mating progressed (Figure 2d), an effect that required CDN output (Figure 2e). Like direct stimulation of the CDNs with optogenetics, brief gusts of wind integrated supralinearly, and the time over which the pulses could interact increased as mating progressed (Figure 2f).
Like heat and wind threats, optogenetic stimulation of neurons that promote grooming behavior22 causes flies to terminate at higher levels when delivered later in mating, and this termination relies on CDN output (Figure 2g). Two short pulses of grooming neuron excitation were only integrated when presented later into mating, consistent with a gradually expanding integration window (Figure 2h). If the CDNs were silenced during the first grooming pulse, the second pulse acted as though the first had not been present at all (Figure 2i), demonstrating that the lingering information integrated from the first pulse required electrical activity of the CDNs, rather than acting in upstream circuitry or on the CsChrimson protein itself. We found similar mating time-dependent pulse integration by stimulating a separate neuronal population23 whose activity terminated mating (Extended Data Figure 2f–i). These results argue that the CDNs integrate competing information from a variety of neuronal inputs — and that the temporal window of integration expands as motivation to sustain the mating decreases.
These results all indicate that the difference between the male’s higher motivational state at 10 minutes and lower motivational state at 15 minutes cannot be explained by a simple rescaling of synaptic inputs or a change in excitability. Instead, they suggest that the ability of the CDNs to retain information about demotivating inputs later in mating is a primary determinant of the fly’s decision-making under duress.
Modeling the response to sustained input
For sustained inputs like our heat threats, increasing the amount of time over which information can accumulate would lead to pronounced differences in the response to a stimulus (schematized in Figure 2j). A longer integration time predicts that sustained stimulation would end matings not only more frequently, but also earlier into the stimulation, due to surpassing the saturation point of conditions with shorter time constants. Scoring the exact times of termination within minute-long optogenetic stimulation bouts at 10 or 15 minutes into mating supported this hypothesis (Figure 2k). We used the resulting cumulative termination curves to fit a simple linear dynamical system to produce quantitative estimates of information decay. The modeling estimated time constants of information retention, seconds at 10 minutes and ≈ 3–10 seconds at 15 minutes (Figure 2k, Supplementary Note 2, Extended Data Figures 3, 4, Methods [Modeling]), in general agreement with our experimental findings above and below. corresponds to the duration it takes each moment of input signal to decay by 1–1/e ≈ 63%, consistent with a discernible effect of integration as long as inputs are separated by less than .
CaMKII prevents information retention
We performed a screen for modifiers of CDN output in response to sustained, white-light stimulation, which on average took ~11 minutes to terminate matings (Figure 3a; see Methods [Behavioral experiments, Optogenetic stimulation during behavior, Screen experiments] and Supplementary Note 1). Several of the most prominent outliers involved manipulations of the highly-conserved24 calcium/calmodulin-dependent kinase CaMKII. When a constitutively active CaMKII mutant25 (the phosphomimetic point mutation T287D) was expressed in the CDNs, matings were far less sensitive to sustained optogenetic stimulation (Figure 3a). Inversely, when CaMKII activity was reduced in the CDNs via an RNAi transgene, expression of a kinase dead mutant26 (K43M), or of mutated versions expected to reduce its activation by calmodulin binding27 (TT306/7DD, TT306/7SS), matings were more sensitive to sustained stimulation (Figure 3a). These results led us to investigate the role of CaMKII activity on temporal integration in the CDNs.
Figure 3: CaMKII activity in the CDNs sets the timescale of integration.

(a) When the CDNs are tonically stimulated with white light throughout courtship and mating, copulation duration is reduced to ~11 minutes. Out of ~500 genetic manipulations (mostly RNAi), several manipulations of CaMKII in the CDNs strongly altered copulation duration. Bins containing CaMKII manipulations are indicated with colored arrows.
(b) Knocking down CaMKII in the CDNs of males increases the sensitivity of matings to heat threats early into mating.
(c) Expressing constitutively active CaMKII (T287D) in the CDNs protects matings from heat threats.
(d) Knocking down CaMKII increases the rate and overall fraction of flies terminating to green light at 10 minutes whereas increasing CaMKII activity with T287D expression decreases the rate and overall fraction of flies terminating to green light at 15 minutes.
(e) Knocking down CaMKII more strongly potentiates the termination response to sustained green light stimulation (8.03 μW/mm2) than a short pulse of red-light stimulation.
(f) Knocking down CaMKII in the CDNs allows paired wind gusts to be integrated across a 10 second inter-gust interval at 10 minutes into mating. Single pulse lengths were calibrated so that flies would terminate at a rate of ~30% for each genotype.
(g) Top: ten 250 millisecond red light pulses with a set amount of time between each pulse were delivered to CDN>CsChrimson flies at either 10 or 15 minutes into mating. Bottom: cumulative fraction of flies terminating after each light pulse at 10 (top) and 15 (bottom) minutes into mating. Integration across longer intervals was seen only at 15 minutes. CaMKII knockdown increases, while constitutively active CaMKII decreases, the time over which the CDNs can integrate pulses
In assessing the role of CaMKII in the response to challenges, we found that RNAi-mediated knockdown in the CDNs made matings more susceptible to heat threats (Figure 3b), without affecting either the duration of undisturbed matings or the requirement for electrical activity to truncate matings (Extended Data Figures 5h, i). The constitutively active T287D mutation made matings insensitive to heat or wind threats (Figure 3c, Extended Data Figure 5g), effects that required CaMKII kinase activity (Extended Data Figure 5b) and had no bearing on the male’s fertility (Extended Data Figure 5c). Some males expressing T287D in the CDNs mated for over an hour (Extended Data Figure 5d), similar to males in which the CDNs were electrically or synaptically1 silenced, but expression of CaMKII-T287D had little to no effect on the ability of CsChrimson stimulation to evoke calcium transients (Extended Data Figure 5a). Males expressing the T287D mutation readily terminated matings in response to repeated CDN stimulation (see below, Figure 3g), indicating that the CDNs are still functional in the presence of sustained CaMKII activity. Using our cumulative termination paradigm, we found that increasing CaMKII activity decreased the rate at which males terminated matings in response to 1-minute green light stimulation, making them behave as if it were earlier into mating. Inversely, decreasing CaMKII levels made males behave as if it were later in mating (Figure 3d). These experiments suggest that CaMKII may exert control over the termination decision by decreasing the timescale of integration in the CDNs.
In another test of whether CaMKII controls the integration process or simply dampens CDN responses regardless of the input dynamics, we selected two conditions of optogenetic excitation that differed in intensity and duration by orders of magnitude but were balanced so that they were equally effective in terminating matings (~15% termination probability). Knockdown of CaMKII increased the response to 60 seconds of weak stimulation far more effectively than the response to 500 milliseconds of strong excitation (Figure 3e). These results are inconsistent with a model in which CaMKII activity only impacts the magnitude of CDN output. Instead, they argue that CaMKII’s primary role is to control integration over many seconds.
Perhaps the most convincing demonstration of temporal integration in the CDNs is the ability of information from a first stimulatory input to combine with a later pulse to increase termination probability, as in Figure 2b. We performed a version of this experiment with wind gusts, finding a similarly increasing ability for spaced gusts to integrate later into mating. Knocking down CaMKII in the CDNs lengthened the integration window, allowing pulses to integrate when separated by 10 seconds at 10 minutes into mating (Figure 3f) — much longer than the normal time constant of integration at that point.
We noticed that the termination probability in response to single 500 ms red light pulses was altered by knockdown of CaMKII. This effect is explainable by adjustments to integration time, but it confounds a direct comparison across genotypes (Extended Data Figure 5j, k). We decreased the stimulation pulse length to 250 ms, which on its own almost never terminated matings (Extended Data Figure 5l) and supplied 10 pulses with varying cycle lengths — the rationale being that this provides many cycles over which a weak stimulus can accumulate (if the interpulse interval is less than the integration time of the system) without immediately saturating our readout (Figure 3g) (albeit with additional caveats, Extended Data Figure 4f–i). At 10 minutes into mating, these 250 ms pulses accumulated to cause termination only when separated by less than 5 seconds. At 15 minutes into mating, integration was seen with up to 10 seconds between pulses (Figure 3g).
When CaMKII was knocked down, we found evidence of integration at 10 minutes into mating even when pulses were separated by as much as 10 seconds (Figure 3g). When CaMKII activity was increased in the CDNs via expression of the T287D mutant, pulses accumulated supralinearly with 1 second or 2.5 second cycle lengths, again showing that CaMKII does not simply prevent CDN output. Elevated CaMKII activity did, in contrast, suppress the accumulating response to pulses separated by 5 or 10 seconds (Figure 3g), arguing that the behavioral consequences of CaMKII activity are strongly dependent on the temporal dynamics of input to the CDNs. These results lead us to conclude that the CDNs are the locus of integration for termination-promoting information and that CaMKII activity adjusts the rate of information decay over time to scale behavioral responses.
Dopamine allows calcium to excite CaMKII
In the linear model, saturation and integration are both caused by negative feedback, with weak negative feedback corresponding to a longer time constant and higher saturation point. CaMKII is classically activated by calcium and calmodulin, and so would be poised to implement negative feedback – and manipulation of its calcium-dependent activation by mutating the 306 and 307 residues strongly changed the response to optogenetic excitation in our initial screen (Figure 3a). Because integration relies on the activity of the CDNs themselves rather than just receiving input (Figure 2i), we speculated that motivational inputs might adjust the magnitude of gain by affecting the relationship between CaMKII and activity of the CDNs, just as one would adjust the feedback term of the linear model.
Dopaminergic activity in the ventral nervous system (anatomically distinct from the courtship promoting dopaminergic neurons in the brain, Extended Data Figure 7f) motivates males to persist through threats during mating1 by signaling through the D2 receptor on the CDNs [Miner et. al28]. Thermogenetic stimulation of dopaminergic neurons using the warmth-gated cation channel TrpA129 dramatically increased the duration of sustained optogenetic CDN stimulation required to end matings (Figure 4a), suggesting that dopamine might motivate matings by restricting CDN integration, possibly via CaMKII. Thermogenetically stimulating dopaminergic neurons while expressing the dopamine sensor GRAB-DA3m30 caused a temperature-dependent increase in fluorescence (Figure 4b) and FLIM signal (Extended Data Figure 7i–k), arguing that activity-dependent dopamine secretion in the abdominal ganglion is capable of elevating dopamine levels to physiologically-meaningful levels near the CDNs.
Figure 4: Dopamine restricts integration by facilitating CaMKII activation.

(a) Sustained thermogenetic stimulation of dopaminergic neurons protects the mating against optogenetic stimulation of the CDNs at 15 minutes into mating. Each black stripe represents a single mating.
(b) Thermogenetic stimulation of dopaminergic neurons drives release of dopamine onto the CDNs as measured by changes in the brightness of GRAB-DA3m. Top: example abdominal ganglion (black dashed line) at room temperature, with dim fluorescence (left), and the same AG after increasing the temperature to stimulate local dopaminergic neurons (right). Bottom shows quantification of changes in fluorescence with temperature in flies expressing TrpA1 in the dopaminergic neurons (purple) or without TrpA1 (black).
(c) Dopamine promotes the activation of CaMKII as reported by the fluorescence lifetime of the FRET sensor green-Camuiα. Left: ~10-milliwatt, 920 nm laser stimulation of the Channelrhodpsin-2 variant ChR2-XXM only slightly increases CaMKII activity in the CDNs (black); subsequent perfusion of 100 μM dopamine allows the same stimulation of ChR2-XXM to strongly increase CaMKII activity (blue). NP5270-Gal41 is used as the CDN driver for green-Camuiα and GCaMP6s imaging experiments (see Methods [Imaging experiments, Region of interest]). Each bold trace is the mean of the light traces. Middle: A representative sample trace. Right: fluorescence lifetime map of green-Camuiα signal in CDN axons from the example trace before and after dopamine perfusion.
(d) Dopamine cannot increase CaMKII activity without ChR2-XXM stimulation.
(e) Dopamine does not increase calcium influx in the CDNs as measured by GCaMP6s. Baseline fluorescence is calculated as the mean number of photons for the first 5.12 seconds of pre-perfusion recording, which was done at the same 10-milliwatt laser power (see Methods [Imaging experiments, Optogenetic stimulation while imaging/Calcium imaging]).
(f) Increasing dopamine concentration increases the ability of ChR2-XXM stimulation to activate CaMKII. Each trace is a single fly. For the 0 μM concentration, saline was perfused while imaging.
In our previous work2,3 we noticed that the calcium-permeable and highly sensitive channelrhodopsin variant ChR2-XXM31 was activated by the near-infrared laser at high power, so we had kept power low to avoid stimulating the opsin while imaging. Here, we increased the laser power to provide constant stimulation of the CDNs while simultaneously monitoring calcium or CaMKII activity levels (see Methods [Imaging experiments, Optogenetic stimulation while imaging]). While this stimulation increased calcium levels in the CDNs as reported by GCaMP6s32 (see below), it had little effect on CaMKII activity (Figure 4c). However, when we perfused dopamine into the bath (at concentrations producing similar GRAB-DA3m FLIM changes as thermogenetic stimulation of dopaminergic neurons, Extended Data Figure 7l), CaMKII was strongly activated by the same stimulation (Figure 4c). Dopamine perfusion also potentiated CaMKII activation in response to transient one-photon stimulation of ChR2-XXM (Extended Data Figure 6b). Perfusing dopamine while providing laser stimulation did not increase CaMKII activity in a different set of neurons, arguing against a generic effect of dopamine on ChR2-XXM or its relationship to CaMKII excitability. (Extended Data Figure 6c). CaMKII activity quickly relaxed back to baseline after stimulation ceased, illustrating that the sustained increase in CaMKII activity was maintained by the ongoing elevation of calcium (Extended Data Figure 6d), supported by the absence of a phenotype from preventing calcium-independent activity with the T287A mutation in Figure 3a. Perfusing dopamine without co-expression of ChR2-XXM only slightly increased fluorescence lifetime (Figure 4d), arguing against an effect of dopamine on the green-Camuiα sensor itself, and leading us to conclude that dopamine acts to enhance the ability of calcium to activate CaMKII in the CDNs.
An alternative hypothesis to explain these results might be that dopamine increases calcium influx, which in turn activates CaMKII. However, dopamine did not cause an increase in calcium driven by ChR2-XXM laser stimulation. Instead, high concentrations of dopamine decreased stimulation-evoked calcium in the CDNs despite effectively activating CaMKII (Figure 4e, further quantified in Extended Data Figures 6e,f; [Miner et. al28]). Increasing concentrations of dopamine increased the ability of ChR2-XXM stimulation to activate CaMKII (Figure 4f). These results support a model in which CaMKII acts as a rapid negative feedback regulator of CDN output, capping the retention of information supplied by excitatory inputs. In conditions of low dopamine, CaMKII is less activated by CDN calcium, allowing longer information retention and rendering the mating more susceptible to threats (Figure 5).
Figure 5: A motivating dopamine signal acts through CaMKII to bias behavioral choice by controlling retention of decision-relevant information.

Early in mating, dopaminergic signaling increases the excitability of CaMKII in the CDNs, limiting the retention of decision-relevant information. Late in mating, lack of dopamine allows for information retention over a longer timescale, increasing the likelihood that the male will stop mating when threatened.
Discussion
Compiling information over time is at the core of decision-making33,34, so control over the integration of that information seems at least as likely a target for motivational regulation as sensory processing—and it has several advantages. For example, control of decision-making via adjustments to the accumulation of information at decision centers avoids amplifying upstream signals, including decision-irrelevant inputs. The integration mechanism we propose serves as a tunable lowpass filter, promoting decisions based on accumulated evidence collected over time, instead of transient noise. This mechanism may be particularly well-suited to making decisions during innate behaviors, where the relevant sensory stimuli are more complex and varied than the learned sensory association tasks where decision-making is most frequently examined.
Our results, and work on sexually dimorphic fly behaviors more broadly1–3,35–41, add a new perspective to the prevailing view of decision-making as the result of anonymized population-level attractor dynamics42. In conventional analyses of circuit dynamics, such as region-wide measurements of intracellular calcium, CDN-like populations would likely not stand out among thousands of intermingled cells. The ability to identify and manipulate compact circuit elements provides clear evidence of decision-making bottlenecks that should be considered in the interpretation of widespread calcium or voltage recordings. Even having identified the CDNs, our data illustrate that calcium imaging would fail to reveal their changing integrative properties over the course of mating. We see the identification of compact decision-making centers as an opportunity to reduce the complexity of high-level processes and work to establish core molecular principles that enrich our understanding beyond a circuit-level explanation.
Our results add to a growing understanding of the neuronal populations that control the male’s changing responsiveness to challenges over time during mating (Figure 5, Extended Data Figures 7e, 12, Supplementary Discussion 1). A critical moment occurs six minutes after mating begins when the Crz eruption drives sperm transfer and opens the period of threat responsiveness2,3. The eruption is timed from within the Crz neurons by CaMKII’s self-sustained but slowly declining activity via autophosphorylation at T287. In this work we show that CaMKII works in a different set of neurons to again control long-timescale behavioral changes, but with key differences. In the CDNs, it is not clear to what extent CaMKII uses its classic self-sustaining abilities at T287. Instead, dopamine signaling guides the ability of CaMKII to be activated by excitatory inputs to the CDNs. Instead of delaying an all-or-nothing event as in the Crz neurons, CaMKII activity appears to work in real time to adjust the window of integration in the CDNs to match the local dopamine tone and guide the male’s response to challenges that arise during mating.
We believe that we have i) found strong evidence that motivational state tunes temporal integration to bias decision outcomes, ii) discovered the anatomical locus of this integration, and iii) identified key molecular factors that make the adjustment. But the physical nature of the information integrated over time and the means by which dopamine influences CaMKII activatability are not yet clear. One potential interaction between dopamine and CaMKII may come from the two phosphorylatable threonines at the 306 and 307 sites in the calmodulin binding region. Phosphorylation at these positions prevents calmodulin binding, and so decouples CaMKII activation from calcium/calmodulin levels. If dopamine signaling were to reduce phosphorylation rates at T306 and T307, it could directly control the relationship between CaMKII activity and electrical activity. Expression of mutant CaMKII proteins which mimic phosphorylation at these sites caused low motivation-like phenotypes in our screen.
Calcium levels could be the target of CaMKII activation as well as its impetus, matching the predictions of the linear model, in which negative pressure on the accumulating variable is produced by the accumulating variable itself . Lingering calcium over seconds-long timescales is also known to influence synaptic release in a process known as synaptic facilitation43, providing another means of controlling CDN output. But CaMKII manipulations with powerful impacts on integration produced only small changes in measured calcium after optogenetic stimulation (Extended Data Figure 5a), mostly visible near the bottom of the sensor’s dynamic range32. However, the calcium influx critical for controlling synaptic release is thought to be dominated by local conductances at the active zone44,45, and may only minimally contribute to our bulk cytosolic GCaMP measurements. Understanding how CaMKII activity expedites the purging of information will also require deeper investigation into this system. Even lacking these important details, our results provide a new and unexpected mechanistic explanation for motivational control over decision making. Given the broad conservation of the molecules involved and the generality of the problem, we expect this way of thinking about motivation to be useful in understanding motivated decisions across behaviors and animals.
METHODS
Fly stocks
Flies were maintained on conventional cornmeal-agar-molasses medium under 12 hour light/12 hour dark cycles at 25°C. Males were anesthetized with CO2 and collected 0–10 days after eclosion and group-housed away from females for 3–6 days before testing. Flies expressing CsChrimson, GtACR1, or ChR2-XXM and all experimental controls were housed with rehydrated potato food (Carolina Bio Supply Formula 4–24 Instant Drosophila Medium, Blue) coated with all-trans-retinal (Sigma Aldrich R2500) diluted to 50 mM in ethanol for at least 1 day, unless marked as “no retinal.” These vials were kept inside aluminum foil sheaths to prevent degradation of the retinal due to light exposure. Virgin females used as partners for copulation assays were generated by heat-shocking a UAS-CsChrimson-mVenus stock with a hs-hid transgene integrated on the Y-chromosome (Bloomington stock #55135) in a 37°C water bath for 75 minutes. This stock was selected for mating partners because the females are highly receptive to courtship, resulting in many mating pairs shortly after initiation of assays, and because it has been shown that copulation duration is robust to variations in the female’s genetic background. Virgins were group-housed for at least 2 days before use. Optogenetic experiments were not performed at specific times relative to the light-dark cycle of the incubator because these animals were housed in constant dark conditions to preserve all-trans-retinal integrity. We did not observe any dependency of time of day on any of the behaviors described here. Flies containing TH-LexA and LexAop-TrpA1 (or flies used as controls for TH>TrpA1 experiments) were raised at 19°C and collected as adults before being stored at 25°C. Detailed genotypes of all strains used in the paper are listed in Supplementary Table 3.
BEHAVIORAL EXPERIMENTS
Evaluation of mating
A pair of flies was scored as “mating” when they adopted a stereotyped mating posture for at least 30 seconds. This posture consists of the male mounting the female and propping himself up on her abdomen using his forelegs, while curling his own abdomen and keeping the genitalia in contact. The posture is starkly different from anything exhibited during other naturalistic behaviors and is rarely, if ever, sustained for 30 seconds during unsuccessful attempts to initiate a mating. If the flies are physically pulled apart without disengaging the genitalia (such as if the female falls or if they collide with an obstacle), the male can climb back into place. This posture is also maintained in the presence of threats, unless the male elects to terminate the mating, differentiating it from a “stuck” phenotype. When stuck, the male dismounts the female, orients himself away from her, and attempts to walk away, but cannot decouple their genitalia. In the rare cases when we see a male become stuck in response to a threat, we record the copulation as having terminated. Occasionally in extremely long (>1hr) mating males, the male will become stuck, possibly because the seminal fluids harden and adhere the flies together. In this case too, the onset of the stuck posture is scored as the end of mating.
Assessing fertility
After a mating, the female fly was collected and placed in isolation in the above-described cornmeal food vials. One week later, the vial was visually inspected for the presence of larva as an indicator of successful fertilization.
Optogenetic stimulation during behavior
For more information on the behavioral arenas we used, see Thornquist et al., 20202.
Non-screen experiments:
For CsChrimson experiments: One male and one virgin female fly were placed in each 0.86” diameter 1/8” thick acrylic well sitting 4” above 655 nm LEDs (Luxeon Rebel, Deep Red, LXM3-PD01-0350) driven using 700 mA constant current drivers (LuxDrive BuckPuck, 03021-D-E-700) and passed through frosted collimating optics (Carclo #10124). This spot of light was scattered using a thin diffuser film (Inventables, 23114–01) under the wells to ensure a uniform light intensity of ~0.1 mW/mm2. The LEDs were controlled using an Arduino Mega2560 (Adafruit) running a custom script, which itself was controlled by a Raspberry Pi (either 2 or 3, running Raspbian, a Debian variant). Flies were observed by recording from above using the Raspberry Pi with a Raspberry Pi NoIR camera (Adafruit) and infrared illumination from below using IR LED arrays (Crazy Cart 48-LED CCTV Ir Infrared Night Vision Illuminator reflected off the bottom of the box) while streaming the video to a computer for observation.
For GtACR1 experiments: The set-up was as above except using the green Luxeon Rebel, LXML-PM01–0100, and a pulse-width modulated signal to set the time-average intensity of the light to ~5 μW/mm2 (approximately six times brighter than the ambient light) unless otherwise noted.
Matings must have ended within one minute after the end of CDN or grooming neuron stimulation in order to be scored as “terminated”. Matings that did not stop within one minute of the stimulation’s end almost always continued until ~23 total minutes of copulation (data not shown). Matings that continued longer than one minute after the end of stimulation but terminated earlier than the expected ~23 minutes were still scored as “not terminated”.
Optogenetic experiments in which we recorded the exact time of termination in response to stimulation, or assigned mating termination to one of 10 pulses of red light, were scored post hoc from a recorded video of the experiment. We recognize that flies may make the decision to terminate mating before there are any visible signs, and that the termination motor process is typically executed over 1–3 seconds. We expect that this procedure introduces error into our measurements, especially for the experiments in Figure 3g in which there was only a small amount of time (1 or 2.5 seconds) between red light pulses. Some flies were likely recorded as terminating mating in response to a later red light pulse than was actually responsible. We scored termination time as the first instance of the male pulling away from the female.
Screen experiments (Figure 3a):
Individual pairs of males and females were placed in single wells of 32 well recorded from a height of ~9’’ using a Canon camera (VIXIA HF R600). Arenas were illuminated from below using a diffuse white light source (HSK A2 light pad on top of an Artograph LightPad 930 LX) with an illuminance of ~4500 lux. Copulation duration was scored post hoc using our automated scoring system6 (https://github.com/CrickmoreRoguljaLabs/CaMKIICode).
Thermogenetics (with and without optogenetics) and heat threats
A similar device to the optogenetic arenas described above was constructed, with the addition of a ¼” thick water bath underneath each well. Room temperature water was continually passed through this bath, except when thermogenetic (TrpA1) or heat threat manipulations occurred. To change the temperature of the wells, hot water (controlled by a separate stopcock for each well) replaced the room temperature water. Heat threat temperatures refer to the temperature in the well after 10 seconds of hot water, as measured by a Bestdo 6802II digital thermometer. Unlike in Thornquist et al., 2020 and Thornquist and Pitsch et al. 2021, during heat threat experiments, hot water was administered 10 seconds before intended time of the threat because it took ~10 seconds for the well to warm up to the right temperature. Hot water was then removed 50 seconds after the intended threat time. All heat threats lasted 1 minute, and matings were scored as “terminated” if they ended within 1 minute of the end of the heat threat. Like the optogenetic experiments, matings that did not stop within one minute of the heat threat’s end almost always continued until ~23 total minutes of copulation (data not shown). The LEDs above were driven with 1A BuckPucks controlled by a pulse-width modulated signal selected to ensure the average intensity of illumination is the same as in the other behavioral experiments (~0.1 mW/mm2 for red light, ~ 5 μW/mm2 for green) despite having to pass through the water bath.
Additional notes about acute optogenetics and heat threat experiments
In most CDN/NP2719>Chr experiments, flies which did not terminate in response to the light pulse were probed with a four-second pulse of light 30–60s after the original light pulse to ensure that they expressed CsChrimson. In almost every mating pair, this was sufficient to induce termination, and in the few cases (<0.1%) in which it was insufficient, a subsequent 15 second pulse was likewise insufficient to terminate the mating, suggesting that these flies did not express CsChrimson (likely parental flies), and thus were not included in the reported data.
All reported termination probabilities are technically conditional: they are only the subset of flies which persisted in mating until the noted time of the stimulus. For the 15-minute and earlier time points, this accounts for 100% of experimental flies, but data at the 20-minute time point should be considered in this light, rather than as a cumulative termination probability that includes the flies that terminated without intervention.
Experimental apparatus for delivering wind gusts to flies
See Extended Data Figure 2. Flies were placed in modified cylindrical acrylic behavioral chambers (10mm diameter and ~9mm height) from Zhang et al., 201646. These chambers were placed on top of an acrylic box (9” x 9”, 5.5” height, 0.125” thick, McMaster-Carr 8505K742), with the sides and area under the behavioral chambers cut out. This box was placed on top of another acrylic box (12” x 24”, 4” height, 0.5” thick, McMaster-Carr 8560K266). In the floor of each behavioral chamber, there was a small hole (~3mm sided hexagon) that allowed a barbed tube fitting adapter (McMaster-Carr 5463K438) to fit in. To prevent flies from falling into the hole, a layer of mesh was placed on top of the floor. 0.125” inner diameter tubing (Firm Polyurethane, McMaster-Carr 5648K74) was inserted into each adapter, which then fed into 0.25” inner diameter tubing (Tygon PVC, McMaster-Carr 6516T21). This tubing fed through the cut-out sides of the acrylic box, with each individual tube connecting to a 2 way, normally closed solenoid (K-Rui H2O Solenoid, 12V, #997; 0.5” FNPT x 0.25” Nylon Female Adapter, Thogus Products TAF1084/N). Air was fed into the solenoid via two wall sources, with each source suppling air for five solenoids/chambers. Tubing from each air source fed into three airflow meters (Hilitand LZQ-7). Between each wall source and the airflow meters, a two-way stopcock was put in-line, to allow excess air to leak out. Of the three airflow meters, two meters fed into two solenoids each and one meter only fed into one solenoid. Between each airflow meter and the solenoids, another two-way stopcock was inserted in-line, to allow excess air to leak out. Solenoid-sized holes were cut into the 0.5” thick acrylic box to allow for solenoids to rest above the benchtop. To allow the air from the wall air sources to pass through the normally-closed solenoids, we connected each solenoid to an Arduino Mega 2560 and wrote custom Arduino and Java code to supply current to each solenoid. A camera (Canon Vixia HF R700) was set up above behavioral chambers and connected via HDMI cable to a computer monitor (Asus VS238H-P) to view and record experiments.
Scoring mating termination in response to wind gusts
Air strength was adjusted via air flow meters, and the strength of the wind delivered to each chamber was tested before starting experiments for the day with a handheld anemometer (BTMETER BT-100). All experiments were performed using a wind strength of ~1.5 meters/second, as measured by the anemometer (flow rate: 48 mL/sec). Wind speed was measured by removing each adapter from the bottom of its behavioral chamber – air was allowed to flow for 3.5 seconds and had to reach ~1.5 meters/second by the end of the 3.5 seconds.
Flies were scored as terminating mating if they stopped mating within 30 seconds of wind offset. For about 10% of matings, the wind gust either pinned flies against the wall (as opposed to throwing them around the chamber), or made flies get stuck in the door; these matings were excluded from the data.
Note for paired wind gust experiments
The Arduino code as written is not able to deliver a program of paired pulses to multiple behavioral chambers simultaneously. If delivering a paired pulse paradigm to two chambers, the first chamber must finish its full paired pulse cycle before the next one can begin. For example, if a paired pulse paradigm (500ms pulse, 10 sec interval, 500ms pulse) begins in chamber 1 at time 0:00 and is supposed to begin in chamber 2 at time 0:05, it will not begin in chamber 2 until time 0:11, after the whole cycle for chamber 1 has finished. This means that for flies in chamber 2, the pulse paradigm would not start until 6 seconds after the intended time. In order to correct for this, for paired pulse paradigms with an interpulse interval of 10 seconds or more, we started experiments by only loading flies into 5/10 mating chambers (so as to minimize the odds of flies mating within close time proximity of each other, and then loaded the other 5 chambers after the first 5 had already started mating. Since it was unlikely for flies to start mating within about 5 seconds of each other, we loaded all 10 chambers at the same time for experiments with an interpulse interval of 5 seconds. However, despite these precautions, there were still some flies whose paired pulse paradigms overlapped, and therefore caused one chamber’s wind delivery to be delayed by a few seconds. Though not ideal, we consider these variations essentially negligible since our data indicates that the CDN time constant of integration changes over the timescale of many minutes.
IMAGING EXPERIMENTS
FLIM and intensity images were acquired, as in our previous work2,3, using a modified Thorlabs Bergamo II. Samples were excited using a Coherent Chameleon Vision II Ti:Sapphire laser emitting a 920 nm beam and emission was detected using cooled Hamamatsu H7422P-40 GaAsP photomultiplier tubes, with light collected through a 16x water immersion objective (Nikon, 0.8NA N16XLWD-PF). The PMT signal was amplified using Becker-Hickl fast PMT amplifiers (HFAC-26) and passed to a PicoQuant TimeHarp 260 photon counting board, which was synchronized to the laser emission by a photodiode (Thorlabs DET110A2) inverted using a fast inverter (Becker-Hickl A-PPI-D). The TimeHarp signal was acquired by custom software (FLIMage, Florida Lifetime Imaging, Version 2.0.21) which was also used to control the microscope. Optogenetic stimulation was performed by excitation with a blue (Thorlabs M470L4) or red (Thorlabs M625L4) LED through a liquid light guide (Thorlabs LLG5–8H) for an incident intensity at the sample of ~0.2 mW/mm2.
We acquired 64 x 64 pixel FLIM and intensity images at a rate of ~7.8 Hz (1 frame every 0.128 seconds). Each data point reported is the average of 40 frames (5.12 seconds). FLIM images were automatically averaged during acquisition. Intensity images were averaged post hoc.
Dissection
Flies were anaesthetized with ice, then dipped in 100% ethanol for about 15 seconds. The ventral nervous system was dissected out in chilled saline (103 mM NaCl, 3 mM KCl, 5 mM TES, 8 mM trehalose, 10 mM glucose, 26 mM NaHCO3, 1 mM NaH2PO4, 4 mM MgCl2, 1.5 mM CaCl2, pH ~7.25, 270–275 mOsm, dissolved in deionized water). The dissected out nervous system was then carefully transferred into a 35x10 mm VWR petri dish filled with 3 mL of the same chilled saline. The nervous system adhered to the bottom of the petri dish and was stable throughout the experiment.
Note: If flies were anaesthetized with CO2, baseline CaMKII activity was increased in the CDNs, and CaMKII was unresponsive to ChR2-XXM laser stimulation.
Pharmacology
Dopamine was prepared as a 100 mM stock solution in ddH2O and kept frozen. From this, 10 mM aliquots were diluted in ddH2O were used for experiments, which were dissolved in chilled saline at different ratios depending on the experiment (for saline controls, the same amount of ddH2O was dissolved). The final volume was always 40 mL. For example, to get a 100 μM dopamine solution, 400 μL of 10 mM dopamine was dissolved into 39.6 mL of chilled saline — slightly modifying concentrations, osmolarity, and pH, which was not corrected.
Dopamine (or saline) was delivered by perfusion during experiments. Prior to application of dopamine, or in control cases, matched saline solution, data was collected with no perfusion. A 50 mL graduated cylinder (in which we put the dopamine solution) was kept elevated above the sample by a three-prong clamp attached to the top of a three-foot-tall stand. 1/8” internal diameter tubing (Firm Polyurethane, McMaster-Carr 5648K74) was fed into the graduated cylinder; it was then passed into the box that enclosed the objective, stage, scan mirrors, PMTs, etc. of our microscope. 1/32” internal diameter tubing (Clear Masterkleer Soft PVC, McMaster-Carr 5233K91) was then connected to the original tubing via a 1000 μL pipette tip (VWR 76322–154), allowing us to fit a 10 μL pipette tip (VWR 53509–130) at the end, which was held in place by a stand attached to the microscope stage. The pipette tip was then submerged in the saline in the petri dish. In order to move the dopamine from the graduated cylinder to the petri dish we inserted a 20 mL LiteTouch luer lock syringe in line with the 1/8” diameter tubing via a three-way stopcock. To deliver dopamine, we pulled about 5 mL of solution into the syringe from the graduated cylinder, and then gently pushed about 2 mL of solution from the syringe to the sample, which allowed the solution to naturally flow from the graduated cylinder to the sample at a rate of ~4 mL/min.
To remove solution from the petri dish, so as not to let it overflow, we attached another 10 μL pipette tip adjacent to the input pipette tip in such a way that it was positioned above the dopamine/saline solution but below the top of the petri dish. This allowed the dopamine/saline solution to remain at a constant volume within the petri dish, since it was removed once it rose up to the output pipette tip. The output pipette tip was attached to the 1/8” diameter tubing, which was then passed out of the microscope-enclosing box and into a 250 mL bolt neck flask with upper tubulation. A rubber stopper with a hole was inserted into the mouth of the flask – this was used to attach the flask to a vacuum. The vacuum allowed solution to be removed from the output pipette tip and be deposited into the 250 mL bolt neck flask.
After experiments were done for the day, 1–2 liters of deionized water were run through the input tubing of the perfusion system (emptying into an external flask) to wash out any residual dopamine.
Region of interest
For each sample, one region of interest (ROI) was drawn around the axons of the CDNs. We used the driver NP5270 Gal4 because it is a stronger driver and took less laser power to image from than NP2719, while still recapitulating the behavioral phenotypes of NP2719 and sparsely labelling the abdominal ganglion1. The neurons labeled by NP5270 project to either side of the abdominal ganglion. One set of axonal projections was chosen to record from, depending on its strength of fluorescence. Extra care was taken to not include any cell bodies in the region of interest. For intensity imaging, a small region of interest was also drawn outside of the abdominal ganglion and set as background.
Optogenetic stimulation during imaging
We used two types of optogenetic stimulation: stimulation with visible light (625 nm red light stimulation of CsChrimson and 470 nm blue light stimulation of ChR2-XXM) and stimulation of ChR2-XXM with the 920 nm infrared light emitted from our laser. When doing experiments not involving infrared optogenetic stimulation, we used a laser power of ~5 mW (as measured by a Coherent FieldMate Laser Power Meter 1098948; measurements using this power meter were slightly noisy – they varied by ~0.2 mW).
For one-photon stimulation experiments, we first recorded the baseline measurements for our sensor over a variable amount of time (always more than 30 seconds) depending on the experiment. Our 2-photon laser and PMTs were shuttered during stimulation to protect the PMTs using an Arduino, which closed the shutter 100 milliseconds before and opened the shutter 100 milliseconds after the stimulation.
For infrared laser optogenetic stimulation of CsChrimson or ChR2-XXM (the pre/post dopamine or saline experiments), we first found the region of interest (ROI) using ~5 mW laser power. We then shut the laser off and waited ~1 minute to allow the fluorescence to return back to baseline. We then recorded for 204.8 seconds at ~10 mW laser power, which constituted the “pre dopamine” period. We then turned the laser off and started perfusing in dopamine. We did not continue recording while perfusing dopamine because the start of perfusion sometimes moved the sample out focus, though we otherwise noticed no difference in CaMKII dynamics during these continuous imaging/stimulation trials (Extended Data Figure 6g). Once dopamine perfusion started, we quickly confirmed that the sample had not moved by turning the laser back on (~10 mW, but not recording) and brought it back into focus if it had moved. We then turned the laser off and waited until we could see the output tubing start to remove solution from the petri dish (see Pharmacology section above) - typically this whole process typically took ~2 minutes. Then we started recording again, which constituted the “dopamine” or “saline” (for Figures 4e and f) period. For some dopamine concentration experiments (Figure 4f) and the calcium imaging experiments in Figure 4e, the “pre dopamine/saline” period traces are not shown.
Fluorescence lifetime imaging
The FLIMage software recorded the time of arrival of each photon emitted (from the eGFP molecule of green-Camuiα) relative to the time of the excitation pulse delivered by our laser for each pixel in 64 time bins of width 200 picoseconds. The mean/average fluorescence lifetime was calculated using custom python code (https://github.com/CrickmoreRoguljaLabs/).
Briefly, we drew a ROI around the axons of the CDNs (see Region of Interest, above); the photon distributions for each pixel within the ROI across 40 consecutive frames (see Imaging Experiments, above) were pooled to increase photon count and reduce noise. To calculate the fluorescence lifetimes, these pooled photon distributions (represented as a vector n, where ni is the number of photons in the ith time bin) were used to fit the parameters of a double exponential model (1) that was convolved with a Gaussian Instrument Response Function (2) (resulting in (3)).
| (1) |
| (2) |
| (3) |
Specifically, the parameters were calculated by minimizing the mean squared error between n and Eq. 3 as expressed below, subject to .
| (4) |
The mean/average fluorescence lifetime was calculated as in our previous work1,3
| (5) |
Additional note about FLIM experiments
In a very small number of trials (2 or 3), ChR2-XXM stimulation of the CDNs/NP5270 Gal4 did not increase green-Camuiα lifetime. These samples were subsequently probed with multiple 10 second blue light bouts, which also had no effect on lifetime. ChR2-XXM is not fused with a fluorescent protein so we could not easily verify its absence. However, due to the very reliable induction of CaMKII activity in the CDNs by strong ChR2-XXM stimulation (Extended Data Figure 6a,b, and dozens of other unreported experiments), we concluded that these samples likely did not express ChR2-XXM and were parental flies, so they were excluded from our data.
Calcium imaging
For calcium imaging, all detected photons within a pixel were summed together, regardless of arrival time relative to the excitation pulse. All data were likely entirely due to functioning GCaMP6s molecules, as opposed to autofluorescence, as their estimated fluorescence lifetime was 2.6–2.8 nanoseconds (data not shown).
For all experiments, change in fluorescence of GCaMP6s after optogenetic stimulation of the CDNs was calculated using custom MATLAB code (www.github.com/CrickmoreRoguljaLabs/) as:
where is the mean number of photons (over at least 30 seconds) recorded at baseline before optogenetic excitation and is the number of photons collected in each frame after excitation.
The code calculates from a .csv file that is created by the FLIMage software after an experiment. The file is in the format of photon count per frame (among other measurements), and accounts for background photon ROI subtraction.
The only exception is for the experiment in Figure 4e (further quantified in Extended Data Figure 6e) in which optogenetic stimulation (from the laser itself) is constantly present, so was calculated from the first 5.12 seconds of recording of the pre dopamine/saline period – the pre period is not shown in the traces. The original value from the pre period was also used for the post dopamine/saline period.
Experiments in Figure 4b and Extended Data Figure 7i–l:
Physiology experiments in Figure 4b and Extended Data Figure 7i–l were performed using an Olympus 20x 1.0 NA water immersion objective (XLUMPLFLN) on a customized Sutter MIMMs to be detailed in a later manuscript by SCT and Gaby Maimon. All data were plotted with matplotlib version 3.7.2. Extracellular saline was prepared as in Mussells Pires et al., 202447 consisting of (in mM concentrations of the sats used): 103 NaCl, 3 KCl, 5 TES, 10 trehalose dihydrate, 10 glucose, 2 sucrose, 26 NaHCO3, 1 NaH2PO4, 1.5 CaCl2 and 4 MgCl2 titrated with Milli-Q water to an osmolarity of 280–285 mOsm. All salts were sourced from Sigma-Aldrich. Dopamine hydrochloride salt (Sigma H8502) was added to 50 mL aliquots of saline to the desired concentrations of 1, 5, 10, and 100 μM used for individual experiments. Images were acquired at a frame rate of ~61 Hz at 256 x 256 pixel resolution.
The physiology experiments were performed in a custom physiology chambers made of laser-cut ¼” thick black acrylic from McMaster-Carr (8505K755) cut in the shape of a standard sample slide (76 x 26 mm) with a 17 mm x 17 mm square hole in the center of the slide. The sides of one face of the hole were chamfered to provide access for a perfusion system and a thermocouple to measure bath temperature around the objective. The base of the hole (still 17.5 x 17.5 mm) was covered with a glass coverslip adhered to the chamber by placing a layer of Parafilm between the acrylic and coverslip, then heating the coverslip with a soldering iron to melt the Parafilm. The Parafilm was then cut away with a razor blade to provide a glass surface that contacted the dissected nervous system. The glass coverslips were covered with a poly-L-lysine solution overnight before use, which was washed away before experiments, to increase the stickiness of the glass surface. Saline was perfused driven by gravity with flow control set to a rate of ~3 mL/min through Tygon tubing formulation 2375. Saline was cleared from the chamber with a vacuum line connected to a thin glass wick with a hole through which saline was sucked to avoid any contact with potential contaminating plastics in the outlet tubing.
Closed-loop temperature control was achieved using a Warner Instruments temperature controller (CL-100) driving a Peltier device (SC-20) that enclosed the perfusion line and regulated by the LCS-1 heat exchanger. The set point was controlled, and probe temperatures were measured, with the BNC outputs of the CL-100 driven and measured by an MCC USB-1208FS DAQ controlled with custom Python3 code using the ROS2 Foxy Fitzroy distribution. The probe was placed in the bath of the physiology chamber.
Dopamine was applied by thawing 50 mL aliquots of each dose and switching the perfusion line into each dopamine solution sequentially (timestamped in the siff file stream to know when the solution was switched). Each solution was given ~5 minutes to fill the perfusion system and physiology chamber before switching solutions.
Male flies aged at least 3 days after eclosion were anesthetized on ice, and their VNS and brain was dissected out together in the extracellular saline solution above, with care taken not to contact the VNS with the forceps and disrupt the glial sheath. The VNS was then pipetted into the physiology chamber and allowed to settle for ~5 minutes before beginning perfusion of saline.
For thermogenetic stimulation, the explant was imaged for several minutes at ~20°C before increasing the Peltier controller’s set point to ~39°C. The temperature was monitored until the water bath achieved ~30°C before resetting the set point to 20°. Each brain was exposed to two steps to 30°C to ensure repeatability of the result, but the first temperature ramp in each experiment was used for quantification. In flies expressing TrpA1 under the control of TH-LexA, we noticed that often the fluorescence signal would decline before the temperature was stepped back to 20°C – we interpret this result as habituation of the TrpA1 channel or a depletion of endogenous dopamine stores, as bath application of dopamine did not show the same effect (and so presumably does not result from bleaching of the fluorophore at high dopamine concentrations). To quantify fluorescence or lifetime, we took the mean intensity-weighted lifetime or ΔF/F over a 30 second window just preceding the command to increase the temperature (for the 20°C case) or during the period that the temperature was stably elevated to 30°C. We discarded approximately 1/3rd of flies because of either motion artifacts or formation of an air bubble directly above the sample during the temperature ramp. F0 was computed using the 5th–35th second of the recording, so sometimes the 20°C condition mean varied slightly from 0. Plotted data use a boxcar filter of width 0.5 seconds to smooth the traces.
Fluorescence lifetime for GRAB-DA3m experiments were computed by fitting the first 1200 frames to a biexponential distribution convolved with a Gaussian by minimizing the chi-squared statistic, as in Thornquist et al., 20202. The offset of this fit was used to adjust the mean photon arrival time within each frame. Mean intensity-weighted lifetime refers to the following procedure: when taking the mean of a set of frames, the lifetime was computed as
where refers to the intensity of the th frame, refers to the mean lifetime of the th frame, and refers to the average across frames.
Antibodies and immunohistochemistry
All samples were fixed in PBS with Triton X-100 and 4% paraformaldehyde for 20 minutes, then washed three times with PBS/Triton X-100 for 20 minutes each before application of antibodies. All samples were incubated with the primary antibody for two days, washed three times with PBS/Triton X-100 for 20 minutes each, incubated with the secondary antibody for two days, then washed three times as before and mounted on coverslips using VectaShield (Vector Labs). The exception is for MCFO staining, in which we followed the protocol of Nern et al.48
Antibodies used are as follows:
Rabbit anti-GFP (A-11122, Invitrogen, 1:1,000 dilution)
Chicken anti-GFP (GFP-1010, Aves Labs, 1:1,000 dilution)
Mouse anti-GFP (A11120, Invitrogen, 1:2,000 dilution)
Rabbit anti-DsRed (323496, Clontech 1:1000 dilution)
Mouse anti-nc82 (Developmental Studies Hybridoma Bank)
Donkey anti-chicken 488 (703-545-155, Jackson ImmunoResearch, 1:400)
Donkey anti-rabbit 488 (A11008, Invitrogen, 1:400 dilution)
Donkey anti-mouse 488 (A21202, Invitrogen, 1:400 dilution)
Donkey anti-rabbit 555 (A-31572, Invitrogen, 1:400 dilution)
Donkey anti-mouse Cy3 (715-166-150, Jackson ImmunoResearch, 1:400 dilution)
Donkey anti-rabbit 647 (711-605-152, Jackson ImmunoResearch, 1:400 dilution)
Donkey anti-mouse 647 (711-605-151, Jackson ImmunoResearch, 1:400 dilution)
Confocal microscopy
Confocal images were collected using a Zeiss LSM 710 through a 20x air objective (Olympus PLAN-APOCHROMAT) controlled by Zen software and analyzed using ImageJ.
Connectomics Analysis
All analyses were performed using Python 3.9 code using the NeuPrint Python API version 0.4.26 on the MANC volume v1.0. We first printed single-plane projections, flattening the dorsoventral axis, of all neurons whose input_roi and output_roi were only ‘ANm’ and which did not enter or exit via any nerves (using Bokeh to generate visualizations of the neurons’ skeletons and synapses). We manually inspected each neuron for features that qualitatively matched the CDNs or the Crz neurons, and created a candidate list as a starting point for further analyses. All visualizations of neuronal anatomy used Bokeh 3.2.2, but otherwise visualizations used matplotlib.
Putative Crz neurons
We queried the NeuPrint API for the number of release sites and synapses received from all other neurons in the MANC volume for each putative Crz neuron, and computed the cosine similarity of their output and input vectors using scikit-learn 1.3.2. We plotted the similarity between each candidate neuron as a heatmap, both for the presynaptic and the postsynaptic vectors, ordered using sklearn’s linkage (with the ‘average’ metric for cluster distances) and dendrogram functions to suggest clusters of neurons with similar connectivity, chosen subjectively. For each putative cluster, we examined the morphology of individual cells more closely, ruling out potential Crz neurons based on features like the presence of an extra midline branch crossing the anterior abdominal ganglion. This resulted in six neurons, with body IDs 14161, 11828, 13190, 16132, 17702, 14938, that appeared to be putative Crz neurons. We chose the set of four of these which were most similar to one another to identify as Crz neurons, though our superficial analyses seem qualitatively robust to the selection of which set of four is used.
Putative CDN anatomy
We filtered the anatomically CDN-like cells by predicted neurotransmitter, taking all cells that were predicted to be more likely to be GABAergic than cholinergic or glutamatergic. We then used the same clustering approach as with the Crz neurons, focusing on the presynaptic vectors for each putative GABAergic CDN, to identify the five clusters delineated in Extended Data Figure 8.
Cluster 2 was selected based on the numerosity of the neurons (7 identified) and the closer consistency of their morphology with that of the CDNs than other potential clusters.
Putative CDN outputs and inputs
Overlaid images of neurons within a cell class were plotted using an opacity of where refers to the number of synapses of the cell within that class with the most synapses from or onto the CDNs. When scaling the opacity of markers within a scatter plot by neurotransmitter prediction confidence, the opacity was set to
with
In Extended Data Figure 9a–c, the assignment of entropy to confidence score was calculated mapping entropy to the confidence in the strongest neurotransmitter if the other two were equiprobable (i.e. the minimum possible confidence for a given entropy). Total uncertainty corresponds to an entropy of , 70% confidence corresponds to an entropy of 1.181, 90% confidence corresponds to an entropy of 0.567, and total confidence corresponds to an entropy of 0.
MODELING
Estimation of parameters, and
The instantaneous probability of termination, given that a fly has not yet terminated the mating by time , was modeled as
with the intensity of the stimulus and the time constant of integration, two model parameters we wish to fit. Each moment in time gives an approximate estimate of this value, which can be pooled together using the cumulative distribution , which can be derived by noting that
this can be solved to yield
with the constant of integration. Because , we can immediately see that and solve to get
finally yielding
The probability of any particular observation , given parameters, and is then
We can now attempt to fit our data to this model to obtain estimates of the parameters and . One form of estimate is the maximum likelihood estimate, the values of the parameters “least surprised” by the data (those which predict the greatest likelihood of generating the data set). The likelihood of any particular data set , assuming all samples are independent, is
and we choose as our estimates .
Any values and that maximize also maximize , or
However, our data is subject to an additional constraint: the stimulation is terminated at some upper bound value . Thus, rather than consisting of termination times , the data takes the form with the number of data points that persevere through the threat. The probability of observing is the probability that the corresponding sample would be greater than , or . Then we can then account for this constraint in the likelihood function by re-writing as
and thus
We can then maximize this expression to obtain our estimates and .
To do so, we take the gradient of and find where it equals 0.
Similarly,
Splitting into two pieces:
and
At the maximum likelihood values and , both of these are 0, so
or
where is the number of flies which terminate the mating in response to the stimulus. If is the total number of flies in the experiment, so that and then we have
which is the exact maximum likelihood estimate for given .
Similarly, we have (after dividing by ) that
We were unable to find an analytical solution to this equation, so to estimate we performed grid search to maximize the log-likelihood, for each value using the analytical value for given the current estimate for . We used a step size of 0.001, and searched parameters ranging from 0.01 to 40.
Likewise, for the model in which there is no (Extended Data Figure 3c), the maximum likelihood estimate for is
Estimating variance of parameter fits
To estimate the variance of the parameter fits, we use the Fisher Information and Cramér-Rao bound, which says
for any consistent estimator of a parameter vector where is the Fisher Information matrix defined as
For our model,
The bottom right element is simply
so that the expectation is
The diagonal terms are
The expectation of the terms on the left (those resulting from the truncation) is
The top left term of the Fisher Information is a little messy. The contribution from the values above the cutoff is
while the contribution from the values within the range of the assay is the expectation of the term
For those elements of the Fisher Information for which we did not find a closed form solution of the expectation, we used the value at the maximum likelihood estimate (essentially assuming that the probability density of those values is peaked near our estimate). We then computed the Fisher Information and took the inverse to find the Cramér-Rao bound, which we used as our estimate of the covariance matrix. The plotted variances of the parameters correspond to the diagonal of this matrix.
The standard error of , likewise, is
Because the maximum likelihood estimate is asymptotically normally distributed with variance given by the Cramér-Rao bound, for statistical comparisons of model fits we performed a Welch’s t-test for unequal variances and unequal sample sizes.
STATISTICS (NON-MODELING DATA)
Fisher’s exact test, Mann Whitney U-test, and Kolmogorov-Smirnov test were performed using Prism 9. All tests are unpaired. All tests with multiple comparisons use post hoc Bonferroni corrections.
Extended Data
Extended Data Figure 1: Sustained CDN activity is necessary and sufficient to end matings.

(a) Left: Individual CDNs labelled via MultiColor FlpOut48 (image of a single optical section of the abdominal ganglion). Right: CDN dendrites selectively cover the midline tracts of the abdominal ganglion (blue); the CDNs send axonal projections throughout the abdominal ganglion (magenta). Scale bars are 20 μm.
(b) Electrical activity of the CDNs is only necessary around the time of termination to end the mating: silencing that begins just before the natural time of termination (20 min) is still sufficient to prolong the mating – 5 flies stopped mating before the light was turned on.
(c) Optogenetic stimulation of the CDNs using CsChrimson preceding the onset of mating does not affect copulation duration if only supplied during courtship (brown), but shortens copulation by several minutes if continued into the mating (flashing red light throughout the duration of the experiment, “tonic”, red). These results closely resemble the results of thermogenetic activation in previous work1 that did find immediate termination of the mating upon CDN activation. Providing the same optogenetic activation only after mating begins results in near-immediate termination of copulation (blue).
(d) Flies end matings in response to 2 seconds of optogenetic CDN stimulation with varying latencies. Left: ethogram, right: cumulative distribution plot.
(e) Stimulation of the CDNs followed by immediate electrical silencing largely prevents the termination of matings that had not ended before the silencing began. Left: ethogram, right: cumulative distribution plot.
(f) Mating with a heat-insensitive, Gr28b.d;TrpA1 double mutant female does not change the male’s decision to stop mating when threatened by heat.
Extended Data Figure 2: Further characterization of integrative properties of multimodal threats during mating.

(a) Flies were placed in elevated behavioral arenas connected to two-way solenoids. Compressed air sources were fed into airflow meters and then into the solenoids, which gate the delivery of the wind. By controlling solenoid opening via Arduino, specific gusts of wind of timed duration can be delivered to behavioral arenas. A camera was suspended above the behavioral arenas. For more information, see Methods.
(b) Side view of each well. Tubes were connected into wells via adapters, and a mesh layer was placed over the hole in the floor so the flies did not fall in.
(c) Photo of the setup. Solenoids are controlled via a computer connected to the Arduino (not in view).
(d) Flies end matings in response to a 350-millisecond wind gust with varying latencies. Cumulative distribution plot of the 10- and 15-minute data in Figure 2d.
(e) Single 650-millisecond wind gusts at 10 minutes into mating, and 250-millisecond wind gusts at 15 minutes into mating each terminate ~30% of matings. Data used to calculate independent probability of paired pulse experiment in Figure 2f.
(f) Of 164 descending-interneuron-labeling lines screened, none terminated mating at 5 minutes when stimulated for 15 seconds with CsChrimson. SS01593 (containing the serotonergic descending neuron DNg26, as well as labeling other cells) is the most effective line at terminating mating at 15 minutes.
(g) DNg26 (SS01593) sends projections to the abdominal ganglion.
(h) 700 milliseconds of DNg26 stimulation at 10 minutes into mating, or 300 milliseconds of DNg26 stimulation at 15 minutes into mating terminate ~30% of matings.
(i) Paired pulse stimulation (700 ms at 10 min, 300 ms at 15 min) of DNg26 is integrated over a longer timescale when delivered at 15 minutes into mating.
Extended Data Figure 3: Quantitative estimation of the changing time constant of integration.

(a) If the instantaneous probability of terminating a mating in response to sustained stimulation ramps up as an exponential (top), then the cumulative probability of a mating ending by a particular time into a sustained stimulation follows the function (bottom).
(b) Parameter estimates for (time constant, bottom) and (intensity, top) across timepoints and conditions. is sensitive to stimulation intensity but not time into mating, while scales with time into mating, but not stimulation intensity. Error bars show the square root of the estimated parameter variance using the Cramér-Rao bound.
(c) Temporal integration is necessary to explain the behavior of flies during sustained optogenetic stimulation, as a model predicting no temporal integration (no ) ascribes a much lower likelihood to the data sets observed (bottom). Temporal integration is also needed to explain the increasing probability of termination as the stimulus goes on (top, data fit with a kernel density estimate).
(d) Termination times of CDN>Chr flies exposed to green light for sixty seconds (intensity indicated above graphs). Fitting the cumulative distribution to the model in (a) reveals a close fit. Solid black line: maximum likelihood fit. Error bars: pointwise 95% coverage intervals sampled according to estimated covariance of the parameters. The data used to fit the model for medium intensity light are the same as is plotted in Figure 2k.
Extended Data Figure 4: Analysis of the statistical methodologies for measuring temporal integration.

(a) Sampling scheme for generating data sets. samples were generated according to the given cumulative distribution function, , and these were used to fit estimates for the generating and . The value of was varied logarithmically from 10 to 1000 to evaluate what sample size would be necessary to accurately estimate the parameters of the distribution.
(b) The cumulative distribution function can be qualitatively reconstructed with samples of size ~ 100 across a wide range of cumulative distribution function shapes. Smaller sample sizes (e.g. ~30) are highly variable, especially when the overall number of flies terminating the mating during the stimulation is low (top row).
(c) The sensitivity of the inference of the value of to sample size across a range of values. The closer a point is to the diagonal, the more likely the fitting procedure is to capture the correct . The fitting procedure overestimates at low sample sizes, especially when the true value for is small. This may, to some extent, be explained by the fact that termination times are rounded to the nearest second (we find it is impossible to judge the time of termination more precisely than this value, given the complex motor sequence of terminating the mating). For larger sample sizes, the estimate is much better, so long as a large number of flies terminate the mating during the stimulation. When and are both small, however, the inference is considerably less reliable, because these conditions correspond to cases in which very few flies terminate the mating during the stimulus, providing very little information about .
(d) As in ©, but instead examining the sensitivity of the estimate of . The parameter is easier to estimate, because even flies that do not terminate the mating during the stimulation are still informative about its value to some extent (see Methods). However, we find that is systematically underestimated due to the bias towards overestimating and the fact that the two estimates show substantial anticovariance (elaborated in panel (e)).
(e) Covariance of and for various sample sizes. Dashed lines indicate the true parameter values, while independent points show individual sample estimates. The two parameters always anticovary, as indicated by the diagonal slant of each distribution. This reflects the fact that only appears in the cumulative distribution with in the form , and so this term is easier to fit than either value alone. If is overestimated, will tend to be underestimated to compensate. The multiplicative relationship is clear from the approximately linear covariance of the logarithm of the two parameters. When the data is more informative about , i.e. many flies terminate the mating during the experiment, the cluster is much smaller (e.g. the orange data set). We therefore restricted our experiments to those conditions that would generate reliable estimates of the parameters, especially in cases where we expected or to be very small.
Extended Data Figure 5: Physiological and behavioral consequences of targeted manipulation of CaMKII activity the CDNs.

(a) Constitutively active CaMKII (T287D) has little-to-no effect on the ability of CsChrimson stimulation to evoke calcium transients in the CDNs, as measured by changes in fluorescence of GCaMP6s. Left, middle left: average traces after 2 and 5 seconds of CsChrimson stimulation. Middle right: max fluorescence after stimulation. Right: average residual calcium 15–20 seconds after stimulation.
(b) CaMKII T287D in the CDNs cannot suppress the heat threat response with a non-functional catalytic domain (K43M). Both the T287D and K43M mutations are contained on the same UAS-CaMKII transgene.
(c) CaMKII T287D in the CDNs has no effect on fertility.
(d) CaMKII T287D in the CDNs extends mating duration.
(e) Overexpression of wildtype CaMKII in the CDNs does not decrease the likelihood of terminating mating in response to a heat threat.
(f) Expression of CaMKII T287D selectively in CDN-Gal4 cells that do not also express Tsh-Gal80 prevents the motivational consequences of expression of CaMKII T287D in all CDN-Gal4 cells.
(g) Expressing constitutively active CaMKII in the CDNs prevents termination in response to wind.
(h) CaMKII knockdown in the CDNs does not alter mating duration.
(i) Mating termination is still dependent on CDN electrical activity when CaMKII is knocked down in the CDNs.
(j) Left: termination response to 500ms red light stimulation of the CDNs with CaMKII knockdown. Right: paired pulse response with CaMKII knockdown in the CDNs.
(k) Left: termination response to 500ms red light stimulation of the CDNs with expression of CaMKII T287D. Right: paired pulse response with expression of CaMKII T287D in the CDNs.
(l) A single 250 millisecond pulse of CDN stimulation is very unlikely to cause termination regardless of time into mating or CaMKII manipulation. Plotted is the fraction of flies (for cycle lengths: 2.5, 5, and 10 sec) from Figure 3g that terminated in response to the first of 10 pulses.
Extended Data Figure 6: Dopamine potentiates CaMKII activity in the CDNs without increasing calcium influx.

(a) CaMKII activity in the axons of the CDNs (as reported by the fluorescence lifetime of the FRET sensor green-Camuiα) decays over ~1 minute after 10 seconds of blue light stimulation of the Channelrhodpsin-2 variant ChR2-XXM whereas calcium levels (as measured by changes in the fluorescence of GCaMP6s) decline over ~5 seconds. 3112Laser power was kept at ~5 milliwatts, to limit the basal excitation of ChR2-XXM. Error bar shading for all imaging data represents SEM.
(b) CaMKII activity, as reported by change in fluorescence lifetime of green-Camuiα (left), is more strongly activated by transient blue light stimulation of ChR2-XXM in the presence of dopamine perfusion (right). Laser power was kept at ~5 mW, to limit the basal excitation of ChR2-XXM.
(c) Left: Dopamine does not potentiate CaMKII activity in another set of Dsx+ neurons (female pC1 neurons25). Right: ~10 mW laser stimulation of ChR2-XXM in pC1 neurons induces an increase in GCaMP6s fluorescence that relaxes to baseline after a few minutes.
(d) Constant stimulation is required to keep CaMKII activity high in the presence of dopamine. After stopping laser stimulation for ~100 seconds (“laser break”), CaMKII levels return to baseline and then ramp up again once the laser is turned back on.
(e - f) Dopamine does not increase calcium influx in the CDNs. (e) Peak calcium levels (from Figure 4e) in response to ~10 mW laser stimulation of ChR2-XXM before and after dopamine perfusion. (f) Left: average traces of 2.5 seconds blue light stimulation of ChR2-XXM with saline and dopamine perfusion. Middle: peak calcium after stimulation. Right: residual calcium 15–20 seconds after stimulation (note the small y-axis to highlight a potential effect on residual calcium).
(g) Dopamine potentiates CaMKII activation under continuous ~10 mw infrared laser ChR2-XXM stimulation.
Extended Data Figure 7: Characterization of the influence of abdominal ganglion circuitry (Crz neurons and dopaminergic neurons) on the CDNs.

a) The Crz neurons project throughout the abdominal ganglion, with processes closely apposed to those of the CDNs, both near their axons (left) and dendrites (right), though synaptic connectivity cannot be concluded.
(b) Optogenetic stimulation of the CDNs while the Crz neurons are silenced results in termination of the mating, demonstrating that the CDNs operate downstream of the Crz neurons in determining the motivational state of the fly.
(c) Silencing the Crz neurons reduces the response to sustained stimulation of the CDNs by selectively decreasing the gain on the input (~8-fold), leaving the time constant of integration largely unaffected.
(d) Cumulative distribution functions used for estimating the parameters of panel (c)
(e) For the first ~6 minutes of mating, high CaMKII activity in the Corazonin neurons prevents the network eruption that triggers sperm transfer2,3. Before the eruption, males that have not mated recently are impervious to challenges of apparently all varieties and severities. At 6 minutes, the eruption increases , allowing threat information to be delivered to the Copulation Decision Neurons (CDNs), through mechanisms not yet understood. After the eruption, dopaminergic inputs to the CDNs increase intracellular CaMKII levels to restrict , the timescale of competing information retention.
(f) Dopaminergic neurons (orange) send projections throughout the abdominal ganglion, often forming varicosities near CDN (green) processes (indicated by white arrowheads). Images are obtained from a single optical plane.
(g) Silencing the dopaminergic neurons does not affect overall copulation duration.
(h) Warmth alone decreases but increases showing that heat cannot account for the effects of stimulation the dopaminergic neurons.
(i) Data as in Figure 4b but plotting lifetime instead of fluorescence. The measurement was more variable but there is a consistent ~200 picosecond increase in lifetime with thermogenetic stimulation.
(j) Thermogenetic stimulation of the dopaminergic neurons of the abdominal ganglion results in an increase in fluorescence and fluorescence lifetime. Note that 1) the lifetime is not linearly related to the increase in fluorescence (and so the two measures have differential sensitivity across concentration) and 2) both signals begin to decrease before the temperature is decreased. Because bath application of dopamine resulted in stable fluorescence, this seems unlikely to be bleaching of the indicator. We speculate it results either from habituation of the TrpA1 channel or rapid depletion of the dopaminergic neurons, at least at the scale of the sensor’s dynamic range. Allowing several minutes of recovery at 20°C permitted a second stimulation to be equally efficacious (not shown).
(k) Warming the abdominal ganglion without expression of TrpA1 in dopaminergic neurons resulted in a small but consistent decrease in both fluorescence lifetime and fluorescence itself. The GRAB-DA3m protein itself is likely temperature sensitive, but the effect of temperature produces a change in fluorescence signal opposite to that observed during stimulation of dopaminergic neurons, arguing that signals as in Figure 4b are not artifacts of the temperature ramp.
(l) Bath application of dopamine in the concentration range used in Figure 4 results in increases in fluorescence lifetime and fluorescence quantitatively similar to that evoked by thermogenetic stimulation of dopaminergic neurons, arguing that these bath concentrations result in physiologically-plausible exposure to dopamine at the CDN axons. These values differ substantially from the reported sensitivity of GRAB-DA3m30 which we speculate arises from the protective glial sheath surrounding the abdominal ganglion, which may buffer the exogenous dopamine levels or rapidly degrade it. Supporting this conclusion, in unpublished experiments, we found that pipette administration of dopamine to a still bath (rather than continuous perfusion) only transiently increased the excitability of CaMKII, unlike the sustained excitability increase observed in Figure 4.
Extended Data Figure 8: Identification of putative CDNs.

(a) The 54 predicted-GABAergic neurons of the abdominal ganglion that superficially resemble the CDNs cluster into five groups, as well as a miscellaneous collection, by comparing the proportions and identities of their various synaptic inputs. Left: the cosine similarity of the vector of synaptic inputs for each cell. Right: Each putative CDN’s synaptic inputs across the collection of cells innervating any of the 54 possible candidates.
(b) As in a, but for the synaptic output vectors of the CDN candidates
(c) IHC of central planes of the abdominal ganglion highlights two features of the CDNs: synaptic release sites along the dorsolateral AG and inputs in the central AG.
(d) The overlaid anatomy of the 7 neurons identified in Cluster 2, presumed to be the CDNs, from three perspectives. Left: viewed from the fly’s right side. Middle: viewed from the ventral side of the fly, Right: viewed from the anterior side of the fly.
(e) The anatomy of each individual CDN is varied, innervating different portions of the antero-posterior extent of the later abdominal ganglion
Extended Data Figure 9: Local interneuron inputs to the putative CDNs are highly varied and likely inhibitory.
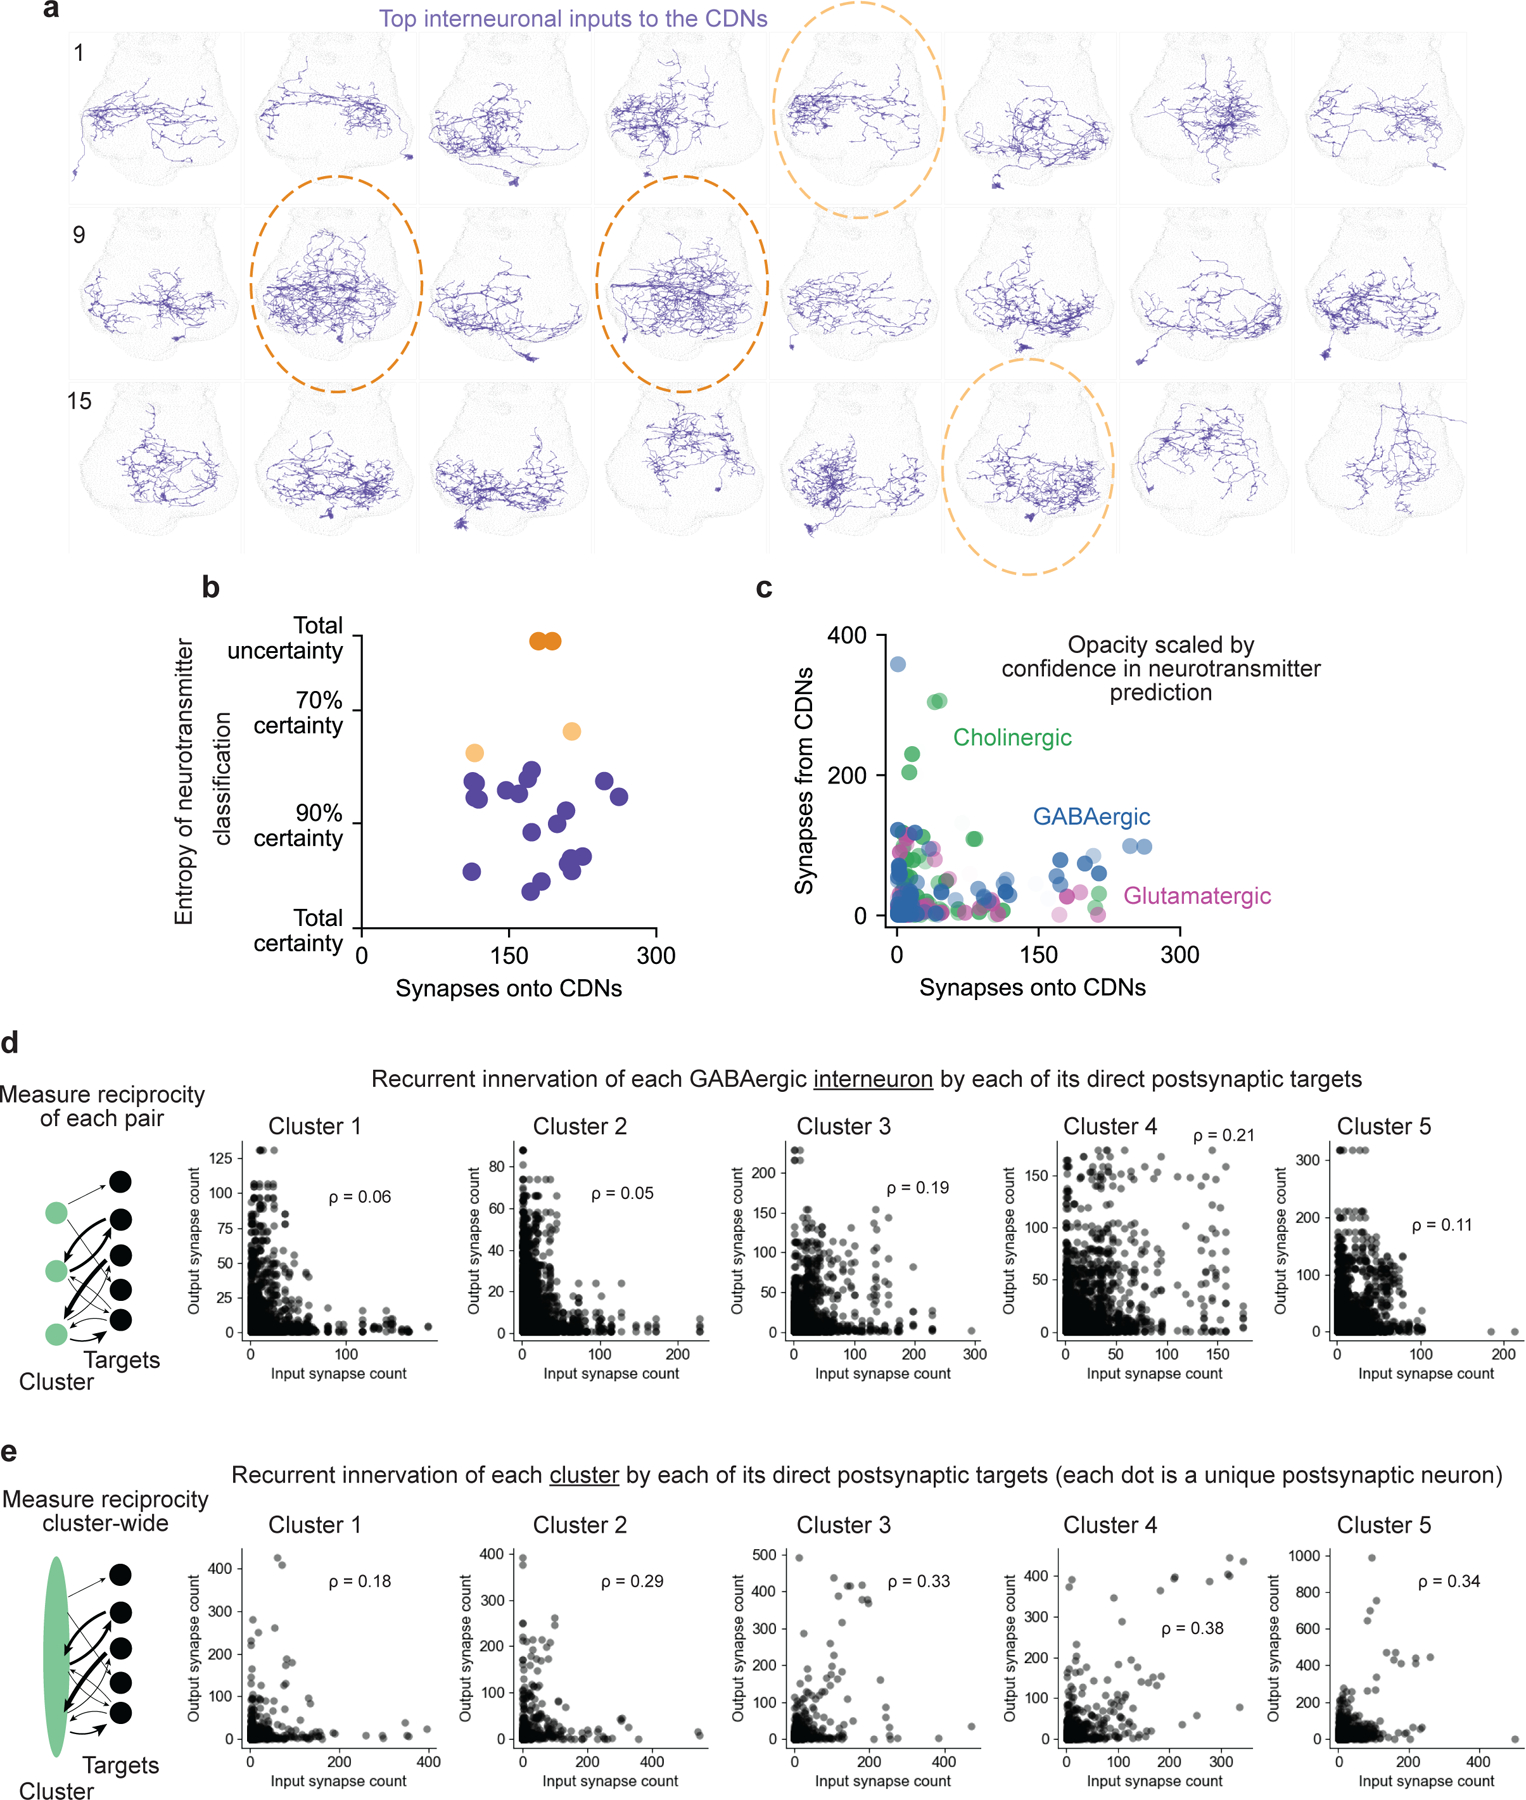
(a) The 24 strongest inputs to the CDNs from within the AG show highly varied anatomy, rather than resembling any specific cell class.
(b) The neurons with the most ambiguous neurotransmitter predictions (circled in panel a) do not have anatomy closely approximating the labeling by our TH-Gal4 line.
(c) The neurons that most strongly innervate the CDNs from within the AG are predicted to be inhibitory (either through GABA or glutamate) and do not receive reciprocal synapses from the CDNs, again arguing against a primary role for recurrence in their ability to integrate inputs.
(d) Each individual cell in Clusters 1 and 2 of Extended Data Figure 8 receives relatively little reciprocal innervation from its postsynaptic targets, especially as compared to the other GABAergic neuron classes.
(e) Pooling the CDNs suggests an increase in reciprocal innervation across the cell class, suggesting that many post-synaptic targets of each putative CDN innervates other CDNs. The diagonal of these plots is still much less dense in Clusters 1 and 2, implying that these cells are less recurrently connected than other morphologically-similar interneurons of the AG.
Extended Data Figure 10: Putative CDNs principally target abdominal ganglion interneurons, and receive few direct recurrent inputs.
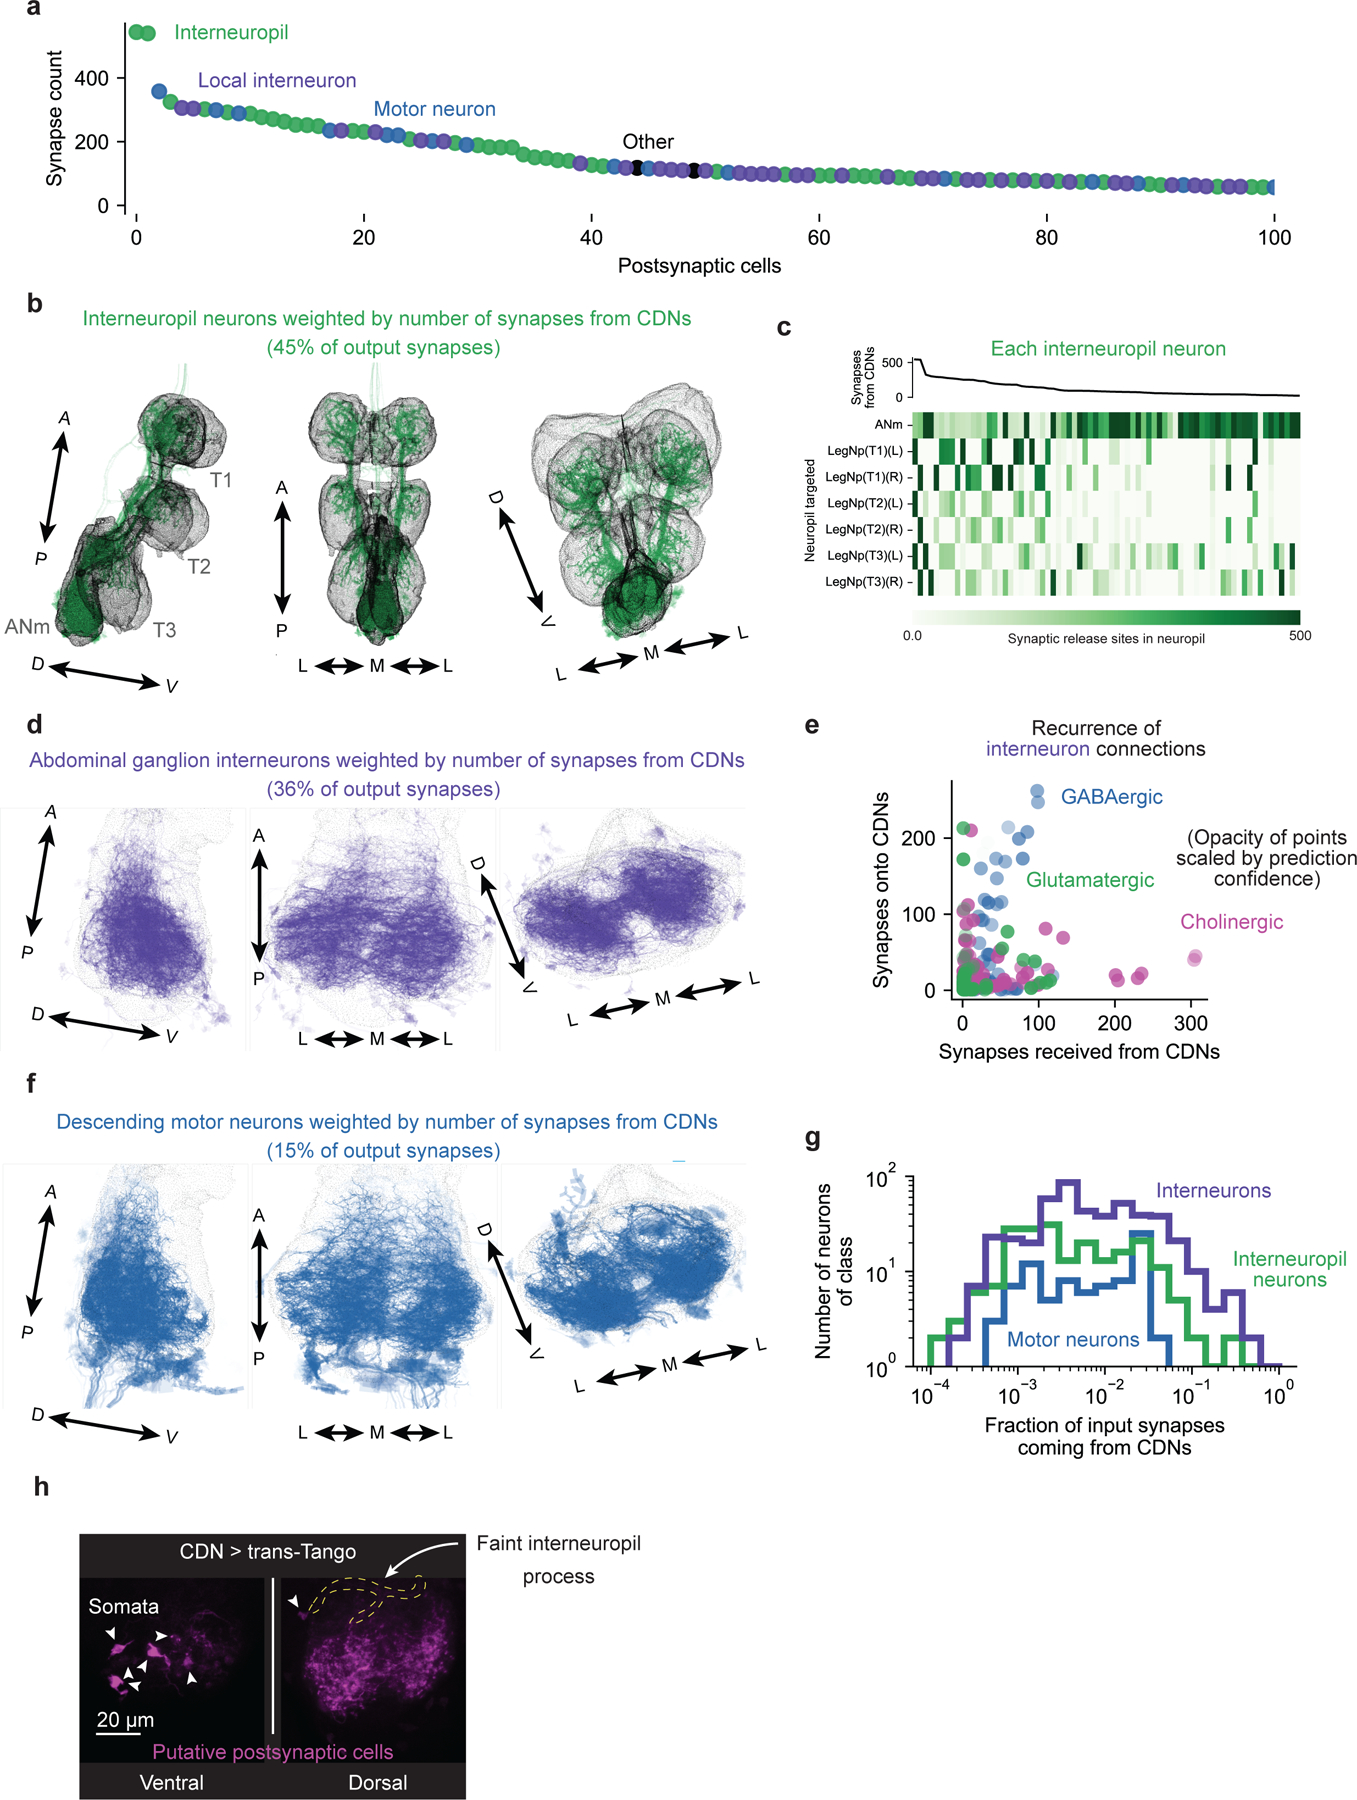
(a) The 100 cells receiving the most input from the presumed CDNs make up over 80% of all output synapses and can be divided into three classes: interneuropil neurons of the VNS, local interneurons of the abdominal ganglion, and motor neurons descending the abdominal trunk nerve.
(b) The interneuropil targets of the CDNs innervate all three leg neuropil.
(c) Most interneuropil targets of the CDNs that receive a substantial amount of CDN input do not innervate the abdominal ganglion, and instead transmit information to all of the leg neuropil (rather than innervating a single neuropil).
(d) The abdominal ganglion interneurons targeted by the CDNs densely innervate both halves of the AG with very little input or output in the medial third of the ganglion.
(e) The local interneurons of the AG do not strongly reciprocate synaptic input from the CDNs, though a subset of neurons weakly predicted to be GABAergic do synapse back onto the CDNs, providing the opportunity for recurrence through disinhibition.
(f) The minority descending neuron output of the CDNs.
(g) Motor neurons targeted by the CDNs receive only a very small fraction of their inputs from the CDNs. Most interneuropil neurons receive <10% of their synaptic input from the CDNs. In contrast, many AG interneurons receive a large fraction of their input from the CDNs.
(h) Trans-synaptic labeling of CDN targets identifies six large AG interneurons, matching the number of major interneuron targets in the EM volume, but mostly fails to resolve motor or interneuropil neurons.
Extended Data Figure 11: Putative CDNs receive integrative inputs from the brain and other VNS neuropil.

(a) The 150 primary inputs to the CDNs are divided into four classes: interneuropil neurons of the VNS, local interneurons of the abdominal ganglion, descending neurons from the brain, and ascending sensory neurons from the periphery.
(b) Most neurons that target the CDNs target them indiscriminately, with little preferential innervation of individual cells, arguing that the functional unit of the CDNs is the collective, and that their individual differences are not a primary feature.
(c,d) Descending neurons from the brain targeting the CDNs typically innervate other neuropil as well.
(e) A few descending neurons preferentially target the CDNs, with ¼ to ½ of their synapses being specific to the CDNs, but other direct descending input to the CDNs is minimal.
(f,g) A quarter of input synapses to the CDNs come from interneuropil neurons of the VNS that receive input from multiple other leg neuropil
(h) Four interneuropil neurons heavily innervate the CDNs, making up their four largest inputs, and two of these almost exclusively synapse on the CDNs (dotted black line is the unity line, indicating all synapses being restricted to the CDNs)
(i) The four interneuropil neurons targeting the CDNs target them mostly indiscriminately, rather than singling out individual CDNs (other than hemispheric preferences).
(j) The interneuropil neurons innervating the CDNs receive input from multiple cell classes in other neuropil, with some pooling hundreds of synapses from descending neurons coming from the brain.
Extended Data Figure 12: EM analysis of putative Corazonin neurons.

(a) Four neurons in the MANC volume closely resembling the morphology of the Crz neurons. Individual release sites (localized to both sides of the AG) shown in pink. Three perspectives are shown: from the right side of the fly (left column), from the ventral side of the fly (central column), and from the anterior side (right column).
(b) Single cell labeling of individual Crz neurons using a heat-shock induced recombinase. Data from Thornquist et al., 20213.
(c) Cosine similarity of the synaptic output vectors of six Crz-like neurons (body IDs shown) suggests a set of four neurons are approximately equally similar to one another and a separate pair that is more similar internally than to the other two.
(d) Most postsynaptic targets of the four Crz-like neurons identified are shared.
(e) Most of the Crz neurons’ postsynaptic targets are local neurons of the abdominal ganglion. ~30% of their output synapses are onto descending cells, likely to drive ejaculation and the accompanying abdominal movements. 10% of their synapses are reciprocal (innervating one another), and ~50% of their outputs are onto many different cell classes in the AG.
(f) Top: One of the primary classes of neurons targeted by the putative Crz neurons is a set of enervating neurons projecting down the abdominal trunk nerve. These neurons resemble the ejaculation-driving Tph2/CrzR expressing cells from Tayler et al. Bottom: The GABAergic neurons targeted by the Crz neurons are largely restricted to the posterio-lateral portion of the AG, but predominantly do not appear CDN-like.
(g) A large fraction of the inputs the Crz neurons receive come from either other Crz neurons, or four other local neurons of the AG.
(h) The primary source of synaptic input to the Crz neurons are four peptidergic cells in the AG resembling the neurons labeled by Dh44-Gal4 (unpublished data).
Supplementary Material
Acknowledgements
We thank: Dragana Rogulja for discussions, comments on the manuscript, and hosting us in her lab for the early stages of this project; Ryohei Yasuda and Long Yan for assistance building the two-photon microscope used in these experiments; the following undergraduates for assistance performing experiments related to or inspiring those in this work - Jiaxiang Zhang, Liam Kerrick, Roshinie Persaud, Peter Rifkin, Ashna Singh, Megan Hoffman, Evan Zheng, Mary Dello Russo, Gabriel Verderame; Barret Pfeiffer, David Anderson, and Gerry Rubin for sharing the UAS and LexAop2 Cs-Chrimson-tdTomato stocks before publication; Ofer Mazor and Pavel Gorelik (Harvard Medical School Neuroinstrumentation Core) for technical advice on designing the experimental apparatuses; Jazz Weisman for assistance machining the ex vivo physiology apparatus in Figure 4b and Extended Data Figure 7i–l and Ezgi Hacisuleyman for assistance stabilizing the preparation; Gaby Maimon for hosting SCT during the revision of this work; Yulong Li for sharing the 10x-UAS-GRAB-DA3m plasmid ahead of publication; members of the Maimon Lab for feedback on concepts and experiments; and current and former members of the Crickmore and Rogulja Labs for comments on the manuscript. This work was funded by the NIH (R01NS111441). SCT was supported by the National Science Foundation Graduate Research Fellowship (DGE1144152) and Helen Hay Whitney Postdoctoral Fellowship. LEM was supported by the National Science Foundation Graduate Research Fellowship (DGE2140743).
Footnotes
Competing Interests
The authors declare no competing interests.
Data Availability
Source data are provided with this paper and can also be found at https://figshare.com/account/home#/projects/200581
References
- 1.Crickmore MA & Vosshall LB Opposing dopaminergic and GABAergic neurons control the duration and persistence of copulation in drosophila. Cell 155, 881 (2013). [DOI] [PMC free article] [PubMed] [Google Scholar]
- 2.Thornquist SC, Langer K, Zhang SX, Rogulja D & Crickmore MA CaMKII Measures the Passage of Time to Coordinate Behavior and Motivational State. Neuron 105, 334–345.e9 (2020). [DOI] [PMC free article] [PubMed] [Google Scholar]
- 3.Thornquist SC, Pitsch MJ, Auth CS & Crickmore MA Biochemical evidence accumulates across neurons to drive a network-level eruption. Mol Cell 81, 675–690.e8 (2021). [DOI] [PMC free article] [PubMed] [Google Scholar]
- 4.Flavell SW, Gogolla N, Lovett-Barron M & Zelikowsky M The emergence and influence of internal states. Neuron vol. 110 2545–2570 Preprint at 10.1016/j.neuron.2022.04.030 (2022). [DOI] [PMC free article] [PubMed] [Google Scholar]
- 5.Hindmarsh Sten T, Li R, Otopalik A & Ruta V Sexual arousal gates visual processing during Drosophila courtship. Nature 595, 549–553 (2021). [DOI] [PMC free article] [PubMed] [Google Scholar]
- 6.Ko KI et al. Starvation promotes concerted modulation of appetitive olfactory behavior via parallel neuromodulatory circuits. Elife 4, (2015). [DOI] [PMC free article] [PubMed] [Google Scholar]
- 7.Aton SJ Set and setting: How behavioral state regulates sensory function and plasticity. Neurobiol Learn Mem 106, 1–10 (2013). [DOI] [PMC free article] [PubMed] [Google Scholar]
- 8.Lange RD & Haefner RM Characterizing and interpreting the influence of internal variables on sensory activity. Curr Opin Neurobiol 46, 84–89 (2017). [DOI] [PMC free article] [PubMed] [Google Scholar]
- 9.McLachlan IG et al. Diverse states and stimuli tune olfactory receptor expression levels to modulate food-seeking behavior. 11, 79557 (2022). [DOI] [PMC free article] [PubMed] [Google Scholar]
- 10.Vogt K et al. Internal State Configures Olfactory Behavior and Early Sensory Processing in Drosophila Larvae. Sci. Adv vol. 7 https://www.science.org (2021). [DOI] [PMC free article] [PubMed] [Google Scholar]
- 11.Richman EB, Ticea N, Allen WE, Deisseroth K & Luo L Neural landscape diffusion resolves conflicts between needs across time. Nature 623, 571–579 (2023). [DOI] [PMC free article] [PubMed] [Google Scholar]
- 12.Wu Z et al. Context-Dependent Decision Making in a Premotor Circuit. Neuron 106, 316–328.e6 (2020). [DOI] [PubMed] [Google Scholar]
- 13.Burgess CR et al. Hunger-Dependent Enhancement of Food Cue Responses in Mouse Postrhinal Cortex and Lateral Amygdala. Neuron 91, 1154–1169 (2016). [DOI] [PMC free article] [PubMed] [Google Scholar]
- 14.Allen WE et al. Thirst regulates motivated behavior through modulation of brainwide neural population dynamics. Science (1979) 364, (2019). [DOI] [PMC free article] [PubMed] [Google Scholar]
- 15.Yasuda R, Hayashi Y & Hell JW CaMKII: a central molecular organizer of synaptic plasticity, learning and memory. Nature Reviews Neuroscience vol. 23 666–682 Preprint at 10.1038/s41583-022-00624-2 (2022). [DOI] [PubMed] [Google Scholar]
- 16.Silva AJ, Paylor R, Wehner JM & Tonegawa S Impaired Spatial Learning in α-Calcium-Calmodulin Kinase II Mutant Mice. Science (1979) 257, 206–211 (1992). [DOI] [PubMed] [Google Scholar]
- 17.Sebastian Seung H, Lee DD, Reis BY & Tank DW Stability of the Memory of Eye Position in a Recurrent Network of Conductance-Based Model Neurons. Neuron 26, 259–271 (2000). [DOI] [PubMed] [Google Scholar]
- 18.Major G & Tank D Persistent neural activity: prevalence and mechanisms. Curr Opin Neurobiol 14, 675–84 (2004). [DOI] [PubMed] [Google Scholar]
- 19.Mohammad F et al. Optogenetic inhibition of behavior with anion channelrhodopsins. Nat Methods 14, 271–274 (2017). [DOI] [PubMed] [Google Scholar]
- 20.Klapoetke NC et al. Independent optical excitation of distinct neural populations. Nat Methods 11, 338–346 (2014). [DOI] [PMC free article] [PubMed] [Google Scholar]
- 21.Inagaki HK et al. Optogenetic control of Drosophila using a red-shifted channelrhodopsin reveals experience-dependent influences on courtship. Nat Methods 11, 325–332 (2014). [DOI] [PMC free article] [PubMed] [Google Scholar]
- 22.Seeds AM et al. A suppression hierarchy among competing motor programs drives sequential grooming in Drosophila. Elife 3, e02951 (2014). [DOI] [PMC free article] [PubMed] [Google Scholar]
- 23.Namiki S, Dickinson MH, Wong AM, Korff W & Card GM The functional organization of descending sensory-motor pathways in Drosophila. (2018) doi: 10.7554/eLife.34272.001. [DOI] [PMC free article] [PubMed] [Google Scholar]
- 24.Tombes RM, Faison MO & Turbeville JM Organization and evolution of multifunctional Ca2+/CaM− dependent protein kinase genes. Gene vol. 322 17–31 Preprint at 10.1016/j.gene.2003.08.023 (2003). [DOI] [PubMed] [Google Scholar]
- 25.Park D, Coleman MJ, Hodge JJL, Budnik V & Griffith LC Regulation of neuronal excitability in Drosophila by constitutively active CaMKII. J Neurobiol 52, 24–42 (2002). [DOI] [PubMed] [Google Scholar]
- 26.Hanson PI, Meyer T, Stryer L & Schulman H Dual Role of Calmodulin in Autophosphorylation of Multifunctional CaM Kinase May Underlie Decoding of Calcium Signals. Neuron vol. 12 (1994). [DOI] [PubMed] [Google Scholar]
- 27.Elgersma Y et al. Inhibitory Autophosphorylation of CaMKII Controls PSD Association, Plasticity, and Learning. Neuron 36, (2002). [DOI] [PubMed] [Google Scholar]
- 28.Miner LE, Gautham AK & Crickmore MA Local desensitization to dopamine devalues recurring behavior. BioRxiv doi: 10.1101/2024.02.20.581276. [DOI] [Google Scholar]
- 29.Hamada FN et al. An internal thermal sensor controlling temperature preference in Drosophila. Nature 454, 217–220 (2008). [DOI] [PMC free article] [PubMed] [Google Scholar]
- 30.Zhuo Y et al. Improved green and red GRAB sensors for monitoring dopaminergic activity in vivo. Nat Methods (2023) doi: 10.1038/s41592-023-02100-w. [DOI] [PMC free article] [PubMed] [Google Scholar]
- 31.Scholz N et al. Mechano-dependent signaling by Latrophilin/CIRL quenches cAMP in proprioceptive neurons. Elife (2017) doi: 10.7554/eLife.28360.001. [DOI] [PMC free article] [PubMed] [Google Scholar]
- 32.Chen TW et al. Ultrasensitive fluorescent proteins for imaging neuronal activity. Nature 499, 295–300 (2013). [DOI] [PMC free article] [PubMed] [Google Scholar]
- 33.Huk AC & Shadlen MN Neural activity in macaque parietal cortex reflects temporal integration of visual motion signals during perceptual decision making. Journal of Neuroscience 25, 10420–10436 (2005). [DOI] [PMC free article] [PubMed] [Google Scholar]
- 34.Wang S, Faeder JR, Setlow P & Li YQ Memory of germinant stimuli in bacterial spores. mBio 6, (2015). [DOI] [PMC free article] [PubMed] [Google Scholar]
- 35.Wang K et al. Neural circuit mechanisms of sexual receptivity in Drosophila females. Nature 589, 577–581 (2021). [DOI] [PubMed] [Google Scholar]
- 36.Kimura K. ichi, Hachiya T, Koganezawa M, Tazawa T & Yamamoto D Fruitless and Doublesex Coordinate to Generate Male-Specific Neurons that Can Initiate Courtship. Neuron 59, 759–769 (2008). [DOI] [PubMed] [Google Scholar]
- 37.Hoopfer ED, Jung Y, Inagaki HK, Rubin GM & Anderson DJ P1 interneurons promote a persistent internal state that enhances inter-male aggression in Drosophila. (2015) doi: 10.7554/eLife.11346.001. [DOI] [PMC free article] [PubMed] [Google Scholar]
- 38.Feng K, Palfreyman MT, Häsemeyer M, Talsma A & Dickson BJ Ascending SAG neurons control sexual receptivity of Drosophila females. Neuron 83, 135–148 (2014). [DOI] [PubMed] [Google Scholar]
- 39.Zhou C, Pan Y, Robinett CC, Meissner GW & Baker BS Central brain neurons expressing doublesex regulate female receptivity in Drosophila. Neuron 83, 149–163 (2014). [DOI] [PubMed] [Google Scholar]
- 40.Zhang SX, Miner LE, Boutros CL, Rogulja D & Crickmore MA Motivation, Perception, and Chance Converge to Make a Binary Decision. Neuron 99, 376–388.e6 (2018). [DOI] [PMC free article] [PubMed] [Google Scholar]
- 41.Kallman BR, Kim H & Scott K Excitation and inhibition onto central courtship neurons biases Drosophila mate choice. doi: 10.7554/eLife.11188.001. [DOI] [PMC free article] [PubMed] [Google Scholar]
- 42.Ebitz RB & Hayden BY The population doctrine in cognitive neuroscience. Neuron vol. 109 3055–3068 Preprint at 10.1016/j.neuron.2021.07.011 (2021). [DOI] [PMC free article] [PubMed] [Google Scholar]
- 43.Jackman SL & Regehr WG The Mechanisms and Functions of Synaptic Facilitation. Neuron vol. 94 447–464 Preprint at 10.1016/j.neuron.2017.02.047 (2017). [DOI] [PMC free article] [PubMed] [Google Scholar]
- 44.Südhof TC Calcium control of neurotransmitter release. Cold Spring Harb Perspect Biol 4, (2012). [DOI] [PMC free article] [PubMed] [Google Scholar]
- 45.Zucker RS & Regehr WG Short-term synaptic plasticity. Annual Review of Physiology vol. 64 355–405 Preprint at 10.1146/annurev.physiol.64.092501.114547 (2002). [DOI] [PubMed] [Google Scholar]
Methods references
- 46.Zhang SX, Rogulja D & Crickmore MA Dopaminergic Circuitry Underlying Mating Drive. Neuron 91, 168–181 (2016). [DOI] [PubMed] [Google Scholar]
- 47.Mussells Pires P, Zhang L, Parache V, Abbott LF & Maimon G Converting an allocentric goal into an egocentric steering signal. Nature 626, 808–818 (2024). [DOI] [PMC free article] [PubMed] [Google Scholar]
- 48.Nern A, Pfeiffer BD & Rubin GM Optimized tools for multicolor stochastic labeling reveal diverse stereotyped cell arrangements in the fly visual system. Proc Natl Acad Sci U S A 112, E2967–E2976 (2015). [DOI] [PMC free article] [PubMed] [Google Scholar]
Associated Data
This section collects any data citations, data availability statements, or supplementary materials included in this article.
Supplementary Materials
Data Availability Statement
Source data are provided with this paper and can also be found at https://figshare.com/account/home#/projects/200581