

Abstract
Carbon–sulfur bond-forming reactions in natural product biosynthesis largely involve Lewis acid/base chemistry with relatively few examples catalysed by radical S-adenosyl-l-methionine (SAM) enzymes. The latter have been limited to radical-mediated sulfur insertion into carbon–hydrogen bonds with the sulfur atom originating from a sacrificial auxiliary iron–sulfur cluster. Here we show that the radical SAM enzyme AbmM encoded in the albomycin biosynthetic gene cluster catalyses a sulfur-for-oxygen swapping reaction, transforming the furanose ring of cytidine 5′-diphosphate to a thiofuranose moiety that is essential for the antibacterial activity of albomycin δ2. Thus, in addition to its canonical function of mediating the reductive cleavage of SAM, the radical SAM catalytic cluster of AbmM appears to play a role in providing the sulfur introduced during the AbmM-catalysed reaction. These discoveries not only establish the origin of the thiofuranose core in albomycin δ2 but, more importantly, also emphasize the functional diversity of radical SAM catalysis.
Albomycins (1–3) are produced by species of Streptomycetes and are characterized by a thioheptose dipeptide structural component known as SB-217452 (4), which is a potent seryl-tRNA synthetase inhibitor1–6 (Fig. 1). SB-217452 is linked in albomycins to the ferrichrome-type siderophore 5, which is critical for the uptake of albomycins by pathogenic bacteria via their iron acquisition systems such that they operate as ‘Trojan horse’ antibiotics7. Albomycins are further distinguished by a thioether linkage that connects C1′ and C4′ of the furanose ring, rendering them structurally unique among primary and secondary nucleoside metabolites. Moreover, a synthetic analogue of 3 which contains an oxygen in place of the sulfur is biologically inactive, indicating that the thiofuranose ring is critical for the antibacterial activity of albomycins8. However, the mechanism by which sulfur is incorporated into the furanose ring in albomycins remains obscure.
Fig. 1 |. Proposed biosynthetic pathway of albomycins.
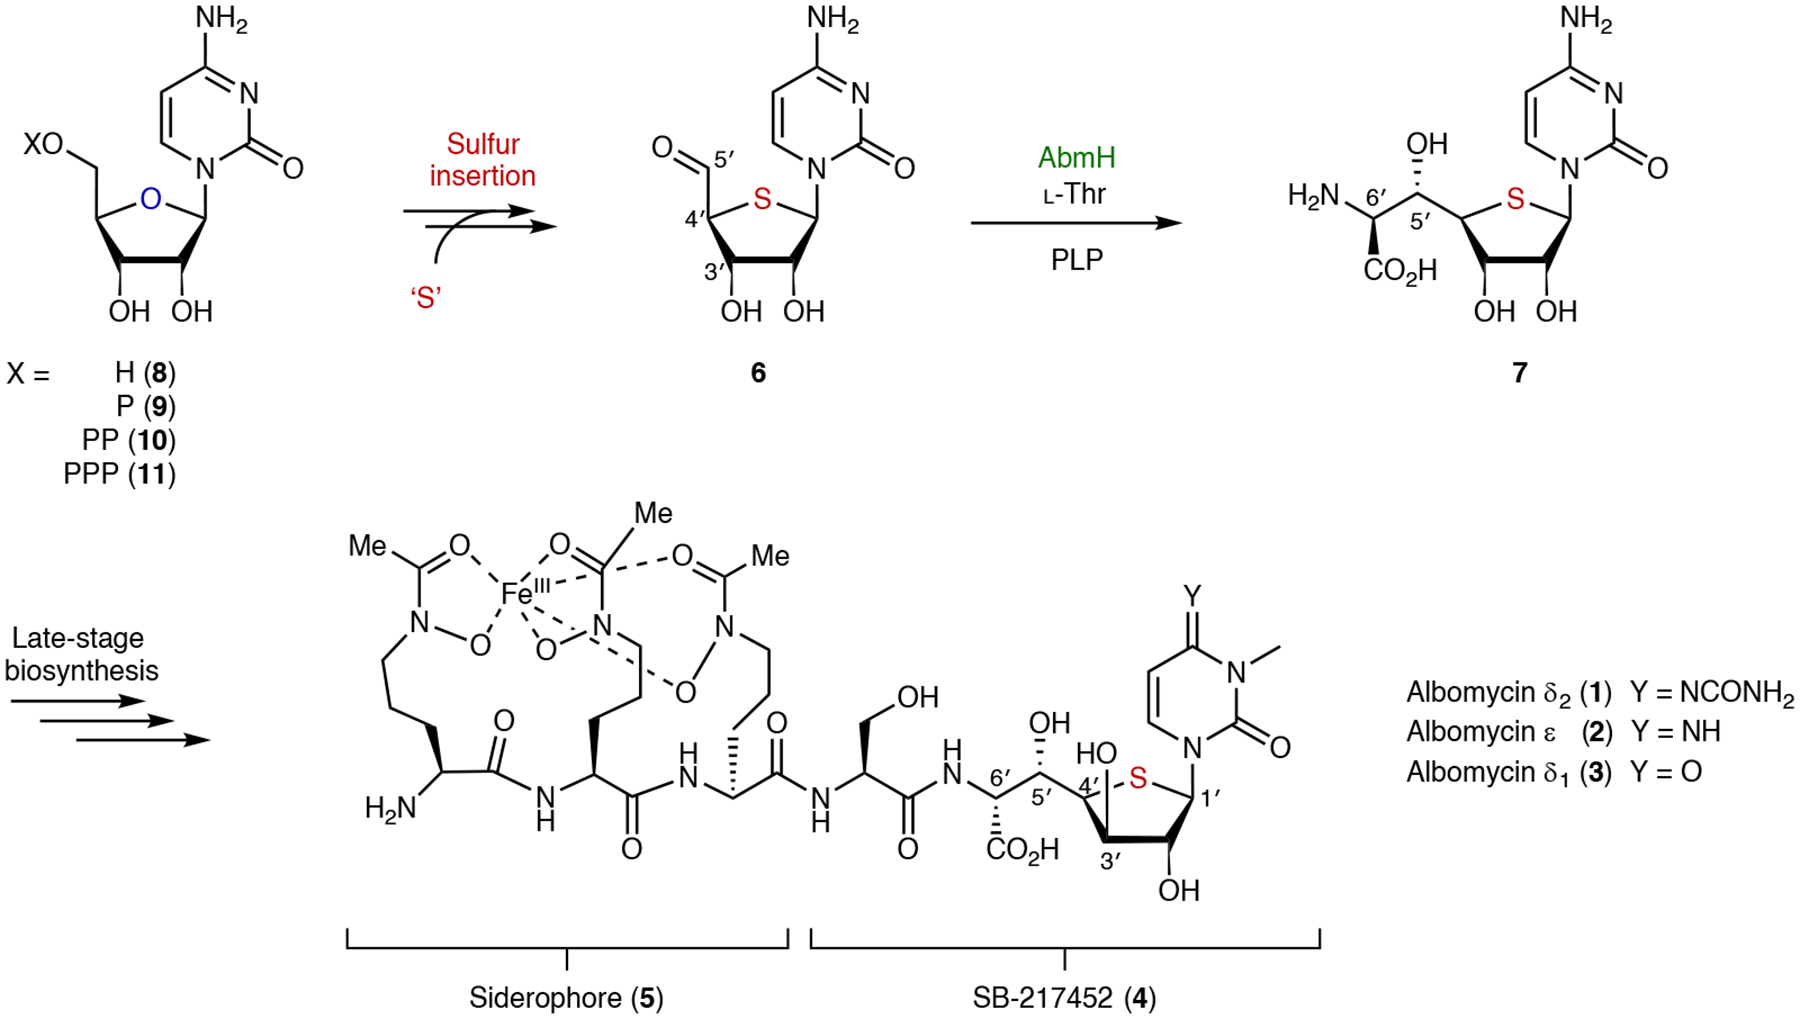
Albomycins are composed of two principal structural features including a siderophore (5) and the seryl-tRNA synthetase inhibitor SB-217452 (4), which has a unique thiofuranose moiety. Construction of the thiofuranose involves the formation of intermediate 6 but is otherwise unclear. P, phosphate group; PP, diphosphate group; PPP, triphosphate group; PLP, pyridoxal 5′-phosphate.
In this Article a radical-mediated, sulfur-for-oxygen swapping reaction is identified in the biosynthetic pathway of albomycin δ2. The swapping of the bridging oxygen for sulfur is catalysed by the twitch radical S-adenosyl-l-methionine (SAM) enzyme AbmM encoded in the albomycin biosynthetic abm gene cluster and results in transformation of the furanose core of cytidine 5′-diphosphate (CDP) to a thiofuranose ring. Moreover, the incorporated sulfur appears to be associated with the radical SAM catalytic iron–sulfur (FeS) cluster rather than an auxiliary cluster. Thus, beyond its widely recognized role in mediating the reductive cleavage of SAM, the catalytic [Fe4S4] cluster in AbmM may also be responsible for donating the sulfur atom to be incorporated into the furanose core.
Results
Functional characterization of AbmM
Most of the proteins encoded in the abm gene cluster responsible for the biosynthesis of albomycin δ2 (1) have already been characterized9–11. In particular, AbmH has been shown to be a PLP-dependent transaldolase that catalyses coupling of the 5′-oxo-4′-thionucleoside 6 and l-threonine to form the (5′S,6′S)-α-amino-β-hydroxyacid-containing adduct 7 (ref. 10; Fig. 1). However, the oxyribose analogue of 6 is a poor substrate for AbmH10, implying that the incorporation of sulfur into the nucleoside occurs before AbmH-catalysed C5′–C6′ bond formation. Among the few genes that remain unassigned in the abm cluster, abmM is a likely candidate for the putative sulfur insertion activity. AbmM (UniProt ID I1ZAZ9) is annotated as a twitch radical SAM enzyme12–14 and is predicted to harbour two [Fe4S4] clusters on the basis of sequence analysis9,15. As albomycin δ2 (1) is a cytidine-type nucleoside, AbmM is hypothesized to catalyse the conversion of cytidine or a cytidine-based ribonucleotide (for example, 9–11) to its thiosugar counterpart during the early stages of albomycin biosynthesis.
To investigate the possible involvement of AbmM in albomycin biosynthesis, the abmM gene in the producing strain Streptomyces sp. ATCC 700974 was deleted, and the resulting strain was found to produce neither albomycin δ2 (1) nor SB-217452 (4). However, production could be restored when the abmM gene was reintroduced to the deletion mutant (Extended Data Fig. 1a–d). Thus, a functional abmM gene is essential for the in vivo production of albomycins. The N-His6-small ubiquitin-like modifier (SUMO)-tagged AbmM was expressed in Escherichia coli, aerobically purified and treated with SUMO protease Ulp1 to yield AbmM with the native sequence (Extended Data Fig. 1e). Ultraviolet–visible (UV–vis) absorption spectroscopy of the as-isolated protein showed a broad band at 410 nm that decreased upon treatment with dithionite, consistent with one or more [Fe4S4]2+ clusters bound by AbmM (ref. 16; Extended Data Fig. 1f).
Subsequent iron/sulfide quantitation showed that the as-purified AbmM contains 7.0 ± 0.4 equiv. Fe and 4.7 ± 0.4 equiv. S per protein monomer. Repeating the iron/sulfur quantitation after the mutation of all three conserved cysteine residues in the CxxxCxxC radical SAM domain to alanines (AbmM-C56/C60/C63A, the ΔRS-cluster variant) yielded 5.9 ± 0.1 equiv. Fe and 3.8 ± 0.2 equiv. S. These results implied that AbmM has one auxiliary [Fe4S4] cluster (AUX cluster) in addition to the canonical radical SAM [Fe4S4] cluster (RS cluster) with at least partial decomposition of the latter during aerobic purification from E. coli.
To study the activity of AbmM, cytidine (8) and cytidine-based nucleotides (9–11) were initially tested as possible substrates for AbmM under anaerobic conditions without previous FeS cluster reconstitution of the enzyme, which appeared to exhibit sufficient activity for the purposes of substrate screening (Methods). When 0.4 mM CDP (10) was incubated with 34 μM AbmM, 0.6 mM SAM, 10.0 mM 1,4-dithiothreitol (DTT), 1.0 mM reduced nicotinamide adenine dinucleotide phosphate (NADPH), 1.0 mM methyl viologen (MV) and 2.0 mM sodium sulfide (Na2S), which can serve as a potential sulfur donor, a new product was detected after 12 h, together with 5′-deoxyadenosine (5′-dA) in an approximate 1:1 ratio using HPLC (Fig. 2b). l-Methionine was also detected via liquid chromatography–mass spectrometry (LCMS) analysis (Extended Data Fig. 2a). It was noted that the reducing system comprising NADPH and MV could be substituted by sodium dithionite (DT) to detect the new product. Electrospray ionization mass spectrometry (ESI-MS) analysis of the new product revealed a mass increase of 32 Da from CDP, implying the insertion of one sulfur atom into CDP (Extended Data Fig. 2b). The new product was dephosphorylated using calf intestinal phosphatase (CIP) to facilitate further characterization. ESI-MS fragmentation analysis of the resulting nucleoside indicated that sulfur incorporation is at the ribose moiety instead of the cytosine nucleobase, the molecular mass of which remained unchanged (mass-to-charge ratio (m/z) 111.04) (Fig. 2c).
Fig. 2 |. AbmM-catalysed sulfur insertion into CDP.
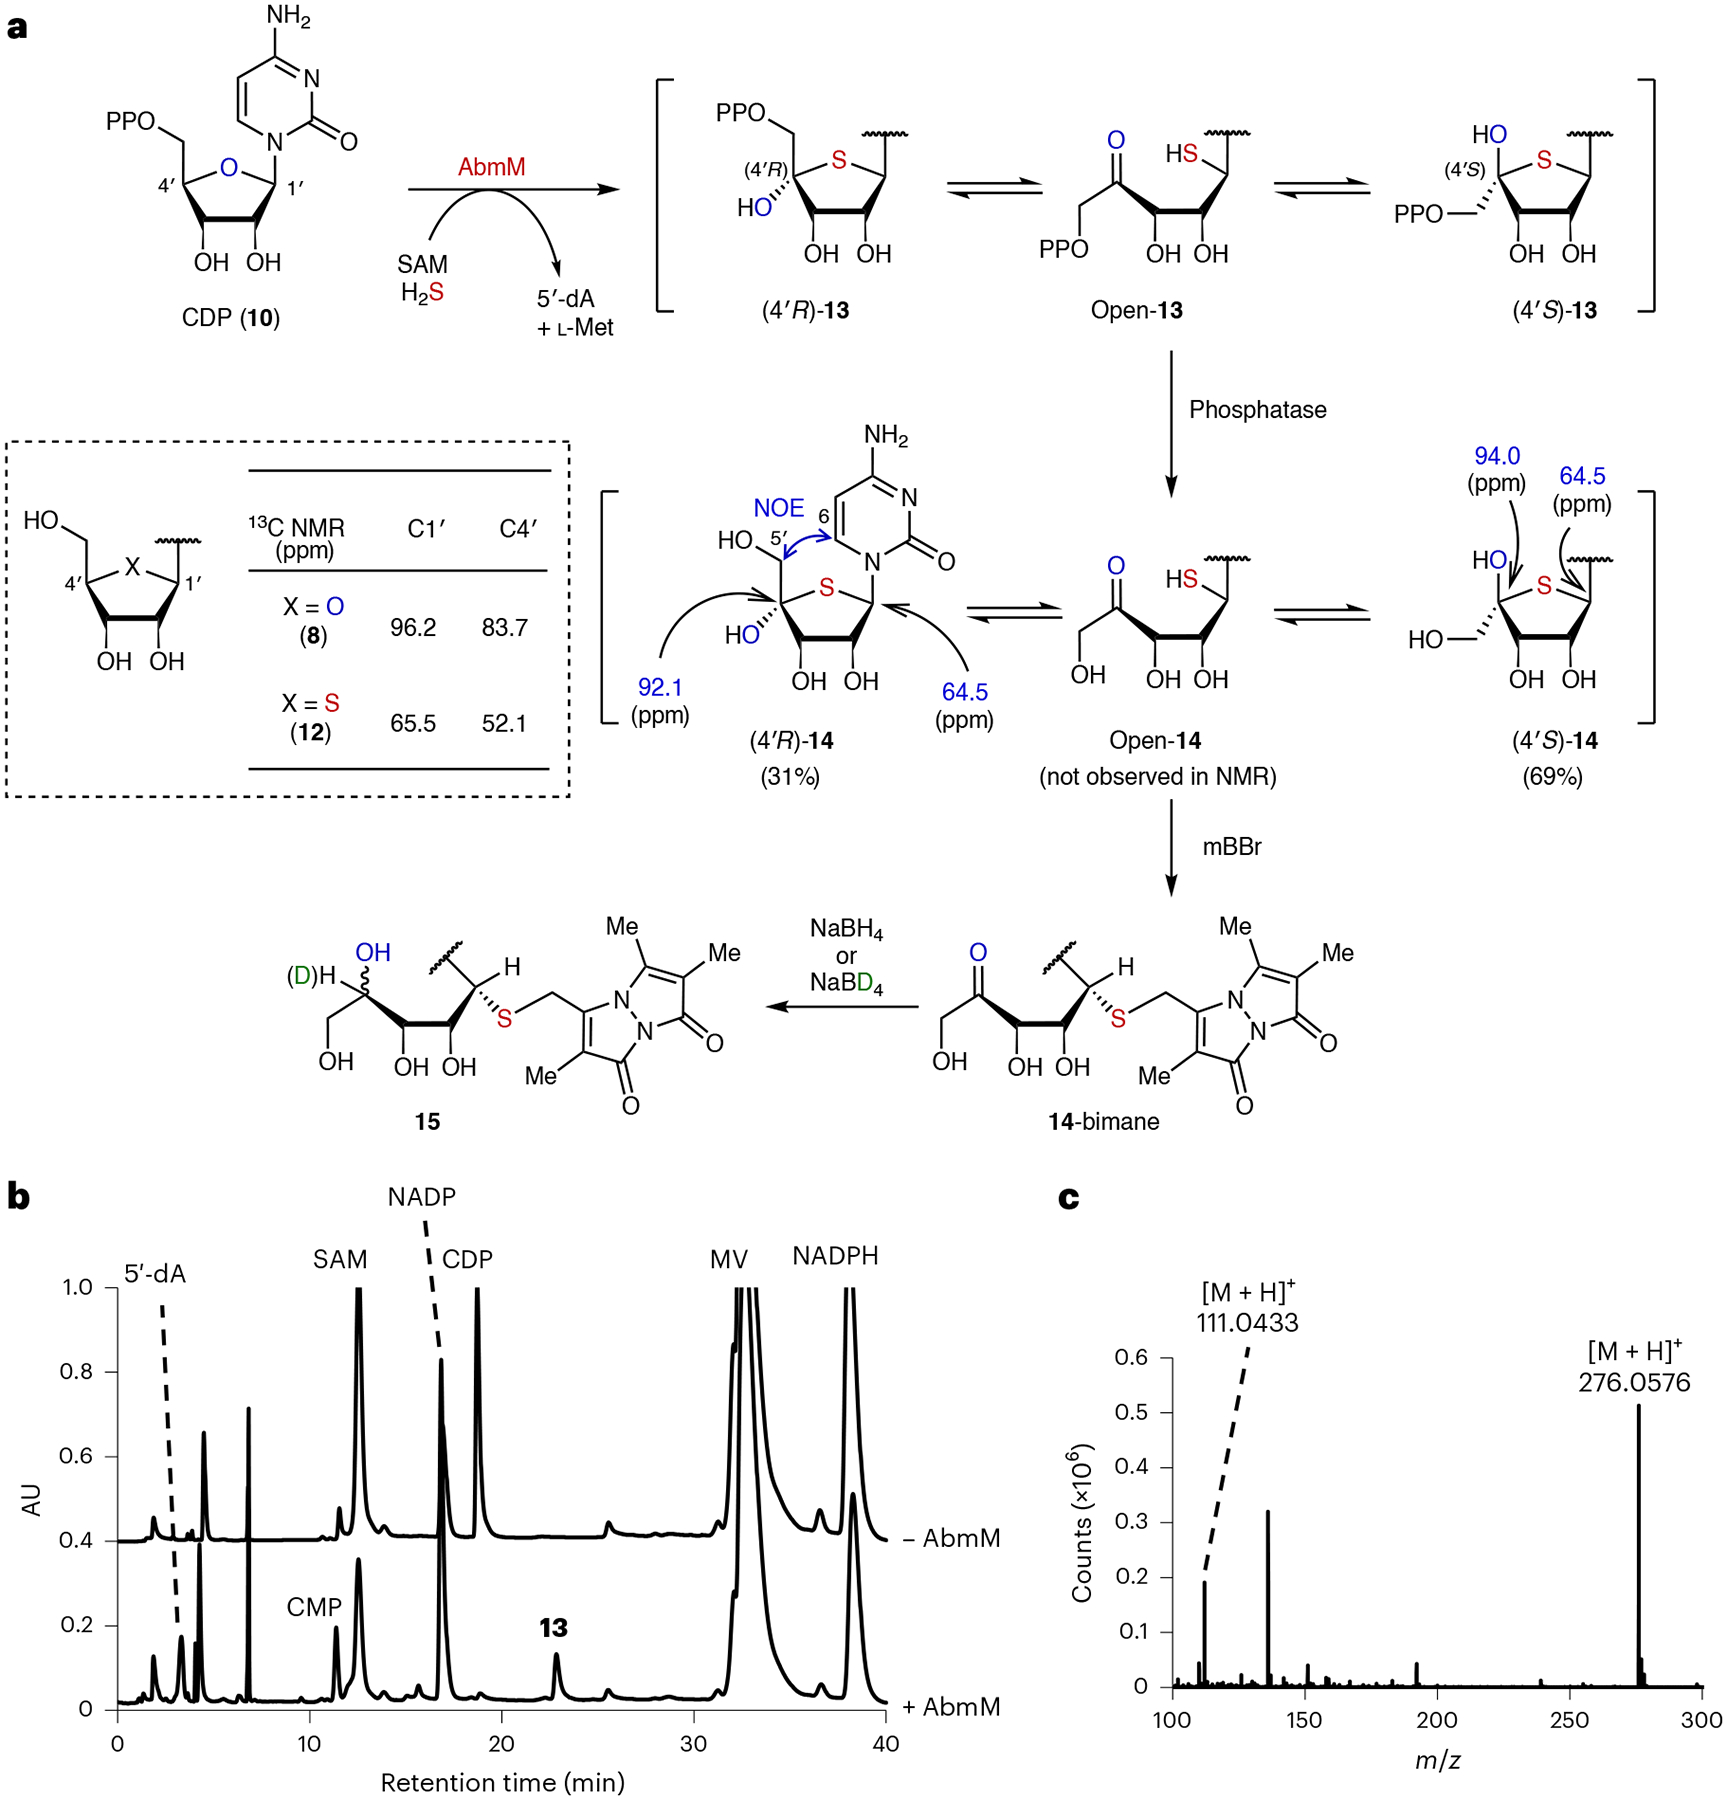
a, Structural characterization of the AbmM product. b, HPLC analysis of the AbmM reaction with CDP (10). AU, absorbance units. c, ESI-MS spectrum of 14 (m/z 276) generated from the AbmM product (13) following dephosphorylation with CIP.
Whereas the dephosphorylated product 14 eluted as a single peak via HPLC analysis (Extended Data Fig. 2e), its NMR spectrum showed a 69:31 mixture of two isomers at pH 5–6 (Supplementary Fig. 3). Notably, no H-4′ peak was observed for either isomer (Supplementary Fig. 3), and the 13C resonance of C1′ for both isomers appears at 64.5 ppm, which is similar to that of 4′-thiocytidine (12; 65.5 ppm) but clearly distinct from that of cytidine (8; 96.2 ppm) (Fig. 2a and Supplementary Fig. 3). By contrast, the C4′ signal for both isomers is shifted downfield (94.0 or 92.1 ppm) compared with 8 (83.7 ppm) and 12 (52.1 ppm) (Fig. 2a). These results indicated that the AbmM product has a thiobridge between C1′ and C4′ and a hemithioketal moiety at C4′. Thus, the major and minor product species after dephosphorylation were assigned as (4′S)-14 and (4′R)-14, respectively, because through-space correlation between H-6 and H-5′ was only observed for the minor epimer via NOESY (nuclear Overhauser effect spectroscopy) (Supplementary Fig. 7). Off-diagonal exchange cross-peaks were also observed for 14 using EXSY (exchange spectroscopy), suggesting that the two stereoisomers are interconvertible (Supplementary Fig. 8b–d). Furthermore, when 14 was reacted with monobromobimane (mBBr), which forms adducts with free thiols17, a new product consistent with open-14-bimane was detected via LCMS (Extended Data Fig. 3a,b). This adduct could be reduced using NaBH4 (or NaBD4) to yield two isomeric species (15) with a mass increase of 2 Da (or 3 Da with NaBD4). Collectively, these results support assignment of the AbmM product as 13 (Fig. 2a). AbmM was also found to accept cytidine 5′-triphosphate (CTP; 11) as a substrate, but not cytidine (8) or cytidine 5′-monophosphate (CMP; 9) (Extended Data Fig. 2d).
Isotope labelling experiments
A putative mechanism for the AbmM-catalysed reaction is shown in Fig. 3a. This hypothesis predicts hydrogen-atom abstraction from the C4′ position of CDP (10) by a 5′-deoxyadenosyl radical (5′-dA•; 16) following the reductive cleavage of SAM16,18. This is consistent with the observation of 95% deuterium incorporation into 5′-dA (17) and no deuterium retention in dephosphorylated 14 when [4′-2H]-CDP (98% D) was used as the substrate (Fig. 3b,c). Experiments with [3′-2H]-CDP and [5′,5′′-2H2]-CDP led to no deuterium transfer to 5′-dA and retention of the deuterium label(s) in 14 (Extended Data Fig. 3c,d). The proposed mechanism is also consistent with the absence of observable 18O incorporation into 13 when the reaction was conducted in H218O, which implies that the bridging oxygen atom in CDP (10) is retained as the C4′-hydroxyl group in 13 (Extended Data Fig. 3e).
Fig. 3 |. Mechanistic investigation of AbmM catalysis.
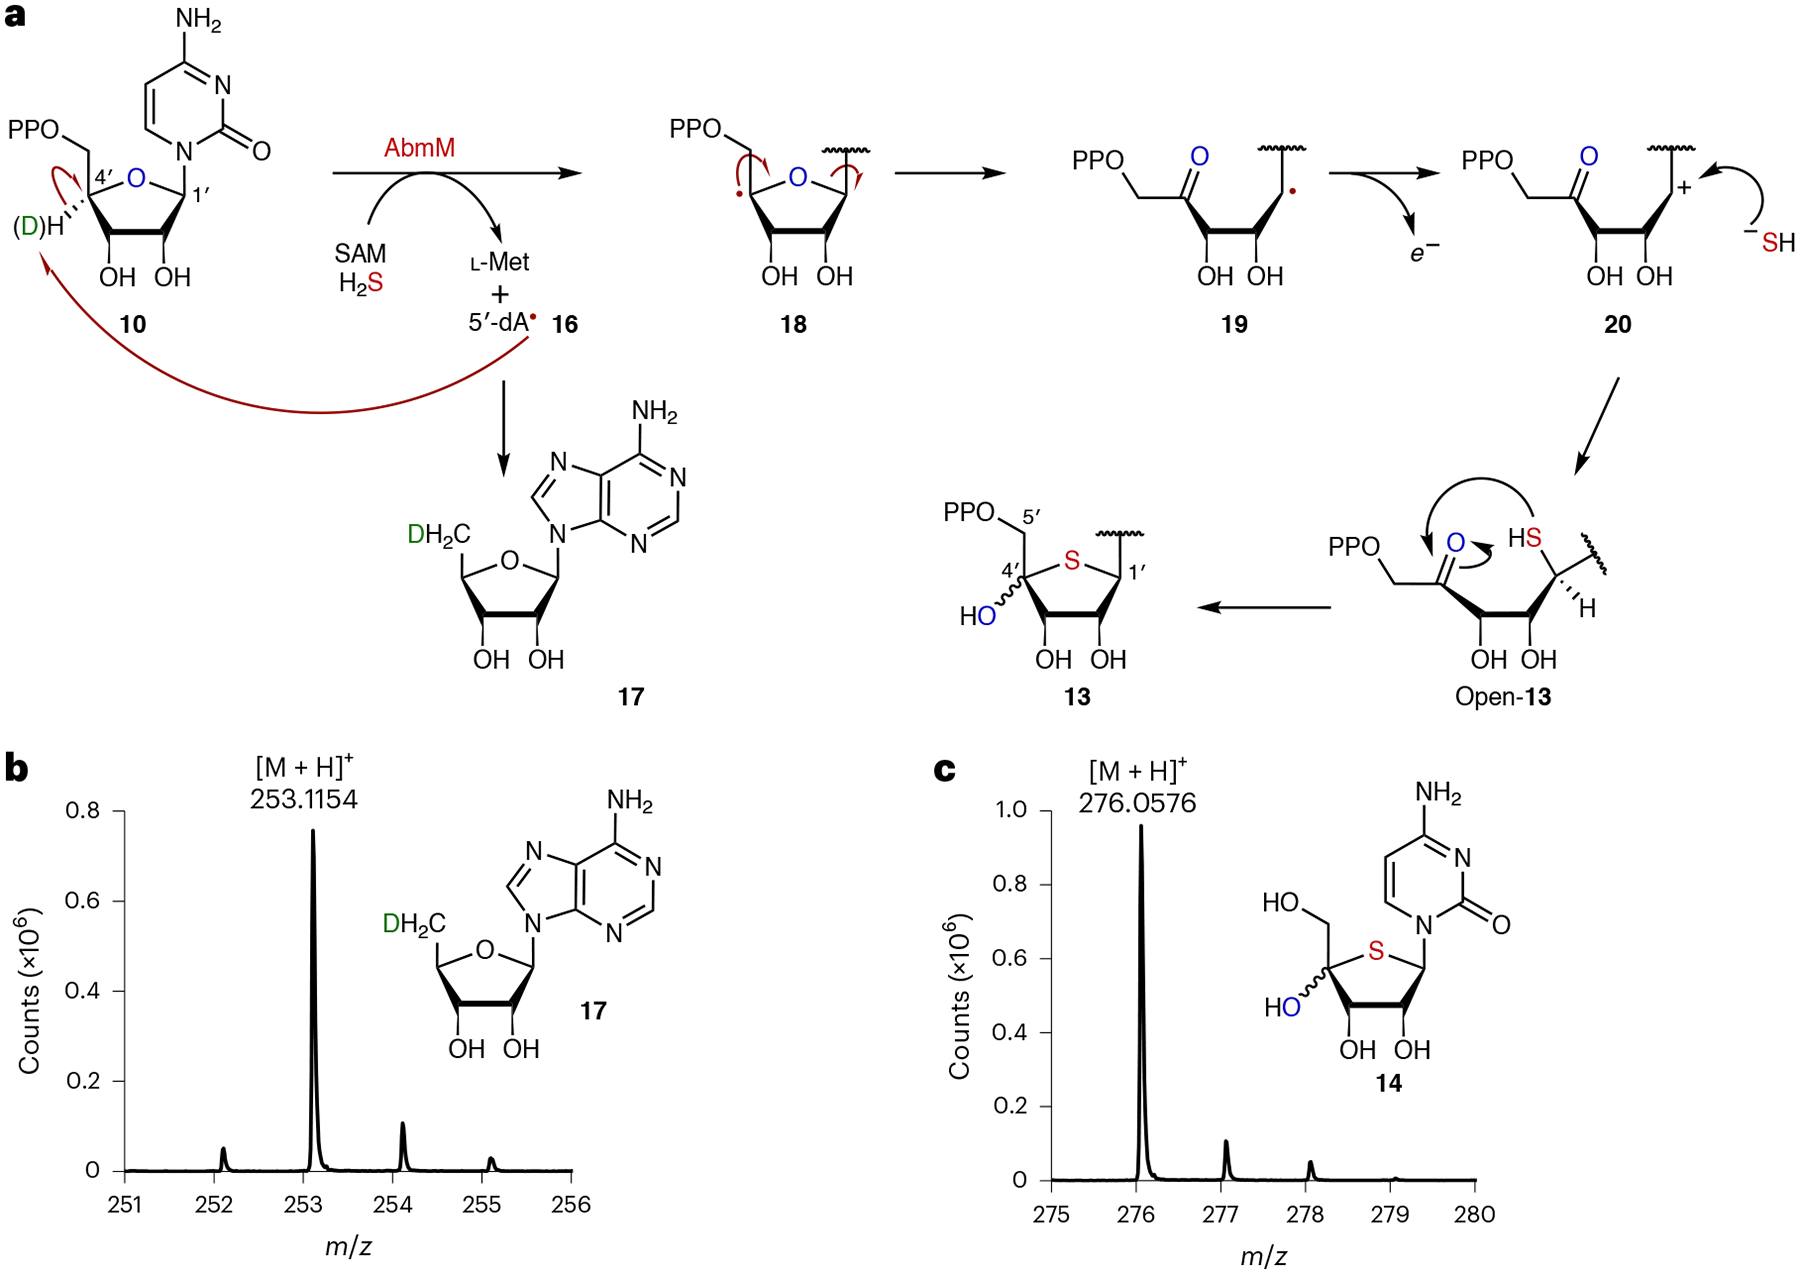
a, Proposed mechanism of AbmM catalysis with CDP (10). b,c, ESI-MS analysis of 5′-dA (17) (b) and 14 (c) produced in the AbmM-catalysed reaction with [4′-2H]-CDP. The analysis was performed after workup with CIP.
Reconstitution by the FeS cluster scaffold proteins
The mechanism in Fig. 3a implies that the incorporated sulfur originates from free sulfide (19 → 20 → open-13). To test this hypothesis, the reaction using as-purified AbmM was repeated with Na234S (>99% 34S). Following overnight incubation, 14 was found to contain 90% 34S; however, this value was reduced to 64% when the reaction was analysed after 10 min (Fig. 4a). Furthermore, 14 and 5′-dA (17) were still produced in reactions without Na2S, although the presence of 2 mM Na2S boosted the number of turnovers from one to between seven and eight per protein monomer following incubation for 12 h (Extended Data Fig. 2c). These results suggested that exogenous Na2S is not the immediate sulfur donor in the AbmM-catalysed reaction, and an enzyme-bound donor such as an FeS cluster that can be replenished by free sulfide to facilitate multiple turnovers instead serves in this role.
Fig. 4 |. In vitro reactions of AbmM with various sulfur sources.
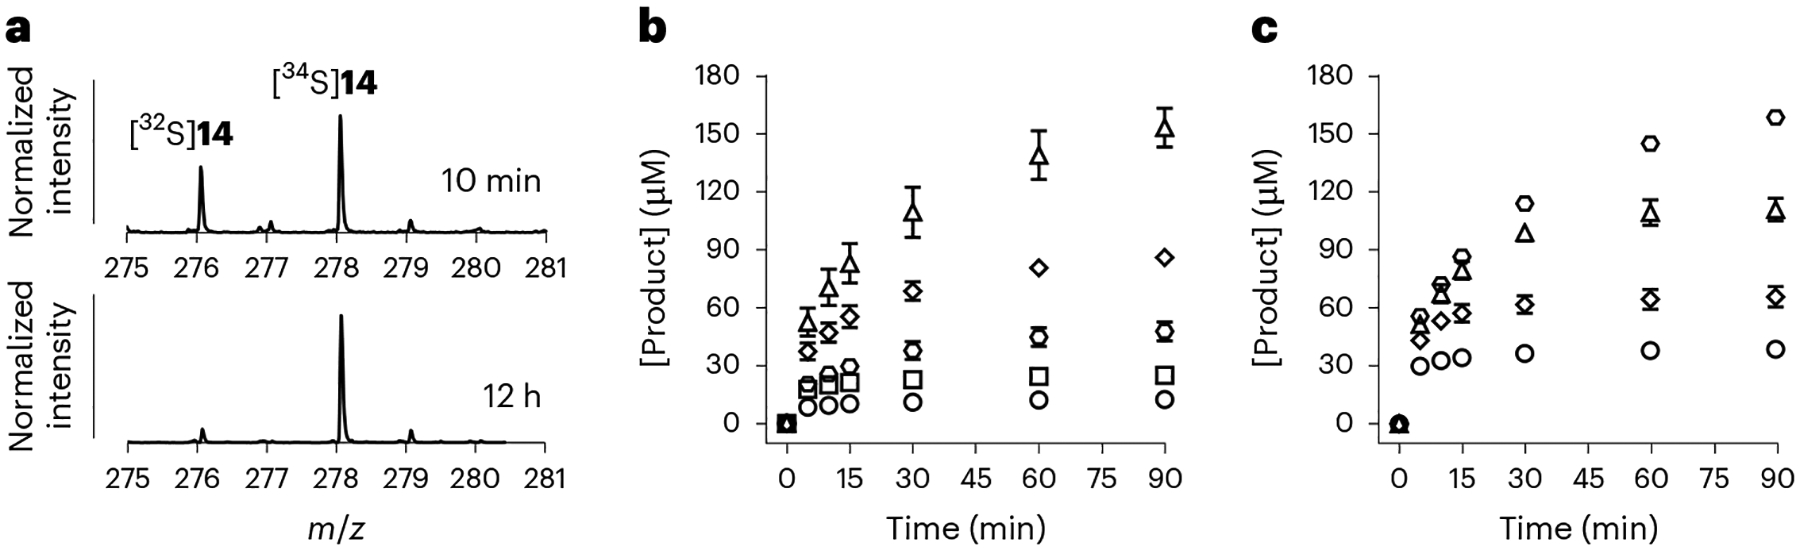
a, ESI-MS analysis of 14 produced during the AbmM-catalysed reaction using Na234S after 10 min (top) and after 12 h (bottom). b, Formation of 14 (product) in the AbmM reaction with various external sulfur sources. The reaction mixtures contained 267 μM CDP, 600 μM SAM, 15 μM AbmM, 2 mM DT, 300 μM Na2S or 150 μM FeS cluster carriers or scaffold proteins. The analysis was performed after the incubation mixture had been treated with CIP. Circles, incubation with AbmM alone; squares, with Na2S; hexagons, with IscU; rhombuses, with SufU; triangles, with NfuA. [Product], product (14) concentration. c, Formation of 14 (product) in the AbmM reaction with various concentrations of NfuA. Circles, incubation with 20 μM NfuA; rhombuses, with 40 μM NfuA; triangles, with 80 μM NfuA; hexagons, with 160 μM NfuA. In b and c, the time courses were measured in triplicate, and the data points denote the mean ± s.d.
Whereas in vitro FeS cluster reconstitution in radical SAM proteins can be facilitated by the presence of Na2S and FeCl3 alone, in vivo this process typically involves multiple proteins19–21. For example, the FeS cluster carrier protein NfuA and the scaffold protein IscU have been shown to facilitate reconstitution of the enzyme lipoyl synthase (LipA) to sustain its catalytic activity in E. coli22. Scaffold protein SufU is a homologue of IscU (34%/55% identity/similarity) encoded by the suf operon of the albomycin-producing strain Streptomyces sp. ATCC 700974. Therefore, to investigate a model where an [Fe4S4] cluster in AbmM acts as the sulfur donor and SufU serves to support AbmM catalysis, the sufU gene was heterologously expressed in E. coli, and partially purified SufU was reconstituted with FeCl3 and Na2S before desalting (Supplementary Fig. 1). A broad absorbance at 410 nm of the reconstituted SufU suggested the presence of an [Fe4S4]2+ cluster as reported for E. coli IscU22 (Supplementary Fig. 2). Incubation of 150 μM SufU with 15 μM reconstituted AbmM and 267 μM CDP for 90 min in the absence of Na2S generated 86 ± 2 μM 14 after CIP treatment (Fig. 4b). By contrast, an equivalent concentration (300 μM) of Na2S led to much less production of 14 (25 ± 3 μM) although it still increased the production of 14 compared with conditions without an added sulfur source (12 ± 2 μM). Furthermore, NfuA and IscU from E. coli could also be substitutes for SufU in the AbmM assay, with the former displaying a more pronounced effect in supporting AbmM turnover with up to 153 ± 10 μM 14 produced after a 90 min incubation (Fig. 4b). Moreover, total product generation after incubation for 90 min correlated with increasing NfuA concentration, with a slope of 0.9 ± 0.1 and an intercept of 23 ± 8 μM (Fig. 4c), which implies one additional micromole of turnover per micromole NfuA once the initially reconstituted AbmM has been consumed. These results are consistent with one of the two [Fe4S4] clusters in AbmM serving as the sulfur donor, and that this cluster can be reconstituted by SufU, NfuA or IscU to support multiple turnovers.
X-ray crystal structure of AUX-cluster-bound AbmM
Iron–sulfur clusters ([Fe4S4] or [Fe2S2]) are known to act as sulfur donors in C–S bond-forming reactions catalysed by radical SAM enzymes such as biotin synthase (BioB)23,24 and LipA25–27 in the biosynthesis of biotin and lipoic acid, respectively. In both cases, one bridging sulfur of the auxiliary cluster serves as the sulfur donor. In addition, one of the residues coordinating the auxiliary clusters of BioB and LipA is not cysteine but is instead an arginine residue in BioB or a serine in LipA. It has been suggested that this unique ligand may facilitate iron dissociation and thus sulfur transfer during lipoic acid biosynthesis27. The reactions catalysed by the methylthiotransferases MiaB28 and RimO29 are two other related examples in which their auxiliary clusters also participate in sulfur transfer. For MiaB, the sulfur donor is the methylated sulfide component of its [Fe3S4] auxiliary cluster28.
The structure of AbmM was determined at 2.5 Å resolution following crystallization under anaerobic conditions (Extended Data Fig. 4a,b and Extended Data Table 1). The asymmetric unit contains two molecules of AbmM. The structure solved for AbmM was found to bind only one auxiliary [Fe4S4] cluster (AUX cluster), which is coordinated by C267/C270/C276/C294 in the C-terminal domain as predicted (Extended Data Fig. 4c). By contrast, the catalytic [Fe4S4] cluster (RS cluster) was not observed, and the loop containing the conserved C56/C60/C63 motif was found to be disordered. Attempts to obtain a structure of AbmM with the RS cluster bound were unsuccessful. A comparison between the crystal structure of AbmM and its structure predicted using the neural network-based model AlphaFold230 (Extended Data Fig. 4d) revealed a root mean squared deviation value of 0.71 Å, which suggests that the latter is a reasonable model for AbmM. The disordered region in the predicted structure adopts a conformation that is suitable for binding an RS cluster and aligns well with that of other twitch radical SAM enzymes such as MoaA (refs. 31,32; Extended Data Fig. 4e). However, the AUX cluster in AbmM appears less likely to be the sulfur source, because it is coordinated by four cysteine residues, which may render this cluster more stable (Extended Data Fig. 4c). Moreover, the AUX cluster may be difficult to access as it is located ~19 Å away from the RS cluster where formation of the substrate radical occurs (for example, 18 or 19); however, a conformational change of AbmM upon substrate binding or RS cluster reconstitution cannot be excluded13 (Extended Data Fig. 4f). This distance is longer than those observed in BioB and LipA, for which the AUX cluster is positioned within 12–16 Å from the RS cluster24,27. Hence, the RS cluster may be a more suitable sulfur donor during the AbmM-catalysed reaction, given its closer proximity to the predicted substrate radical.
Mössbauer spectroscopy
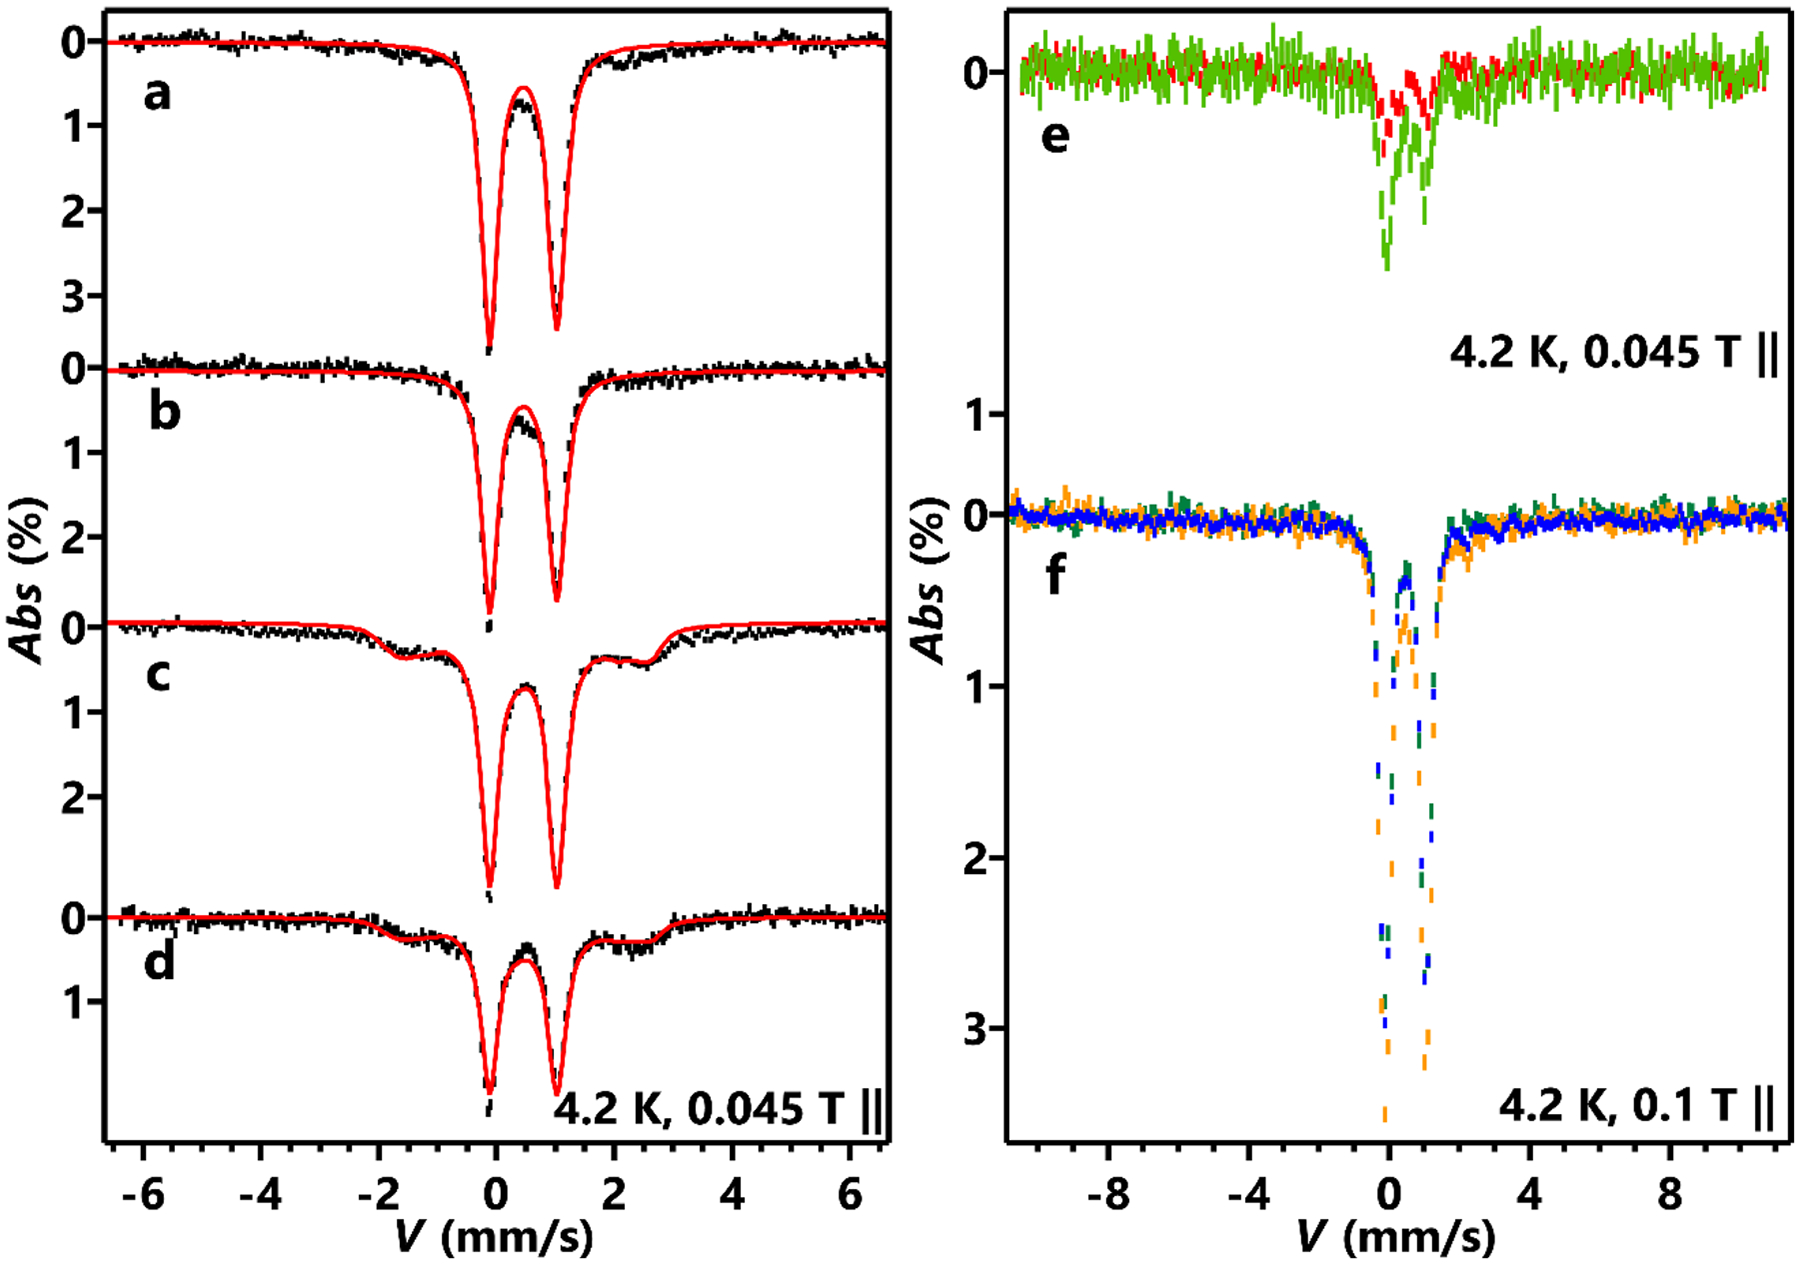
To study the roles of the two [Fe4S4] clusters during AbmM catalysis, they were characterized using a combination of 57Fe Mössbauer spectroscopy and electron paramagnetic resonance (EPR) spectroscopy following expression in 57Fe-enriched media. The preparation of an AbmM mutant that does not coordinate the auxiliary cluster (that is, ΔAUX cluster) proved futile due to insolubility; by contrast, however, the C56/C60/C63A (ΔRS cluster) mutant, which does not bind the RS cluster, could be obtained in soluble form. Before reduction, both reconstituted 57Fe-labelled wild-type AbmM and ΔRS-cluster AbmM showed almost identical Mössbauer spectra (Extended Data Fig. 5a,b) exhibiting a major quadrupole doublet feature that is typical of [Fe4S4]2+ clusters, with an isomer shift (δ) of ~0.45 mm s−1 and a quadrupole splitting (|ΔEQ|) of 1.16 mm s−1 (see Extended Data Tables 2 and 3 for simulation parameters). Upon treatment with DT, a mixture of [Fe4S4]2+ and [Fe4S4]+ clusters was found for both enzymes (Extended Data Fig. 5c,d). After incubating SAM and CDP (10) with reduced wild-type AbmM (reacted 57Fe-AbmM), the formation of a high-spin (S = 2) ferrous species (FeII-A) was detected, which represented ~17% of the total iron in the sample (Fig. 5a,b and Extended Data Tables 2 and 3). The Mössbauer parameters of this species (δ = 0.80 mm s−1, |ΔEQ | = 3.30 mm s−1) are consistent with ferrous ions coordinated by a thiolate-rich ligand environment. Thus, the formation of FeII-A may be attributed to the coordination of DTT in the buffer with iron released following degradation of one of the two clusters during AbmM catalysis.
Fig. 5 |. 57Fe Mössbauer spectra of wild-type AbmM with selective 57Fe labelling.
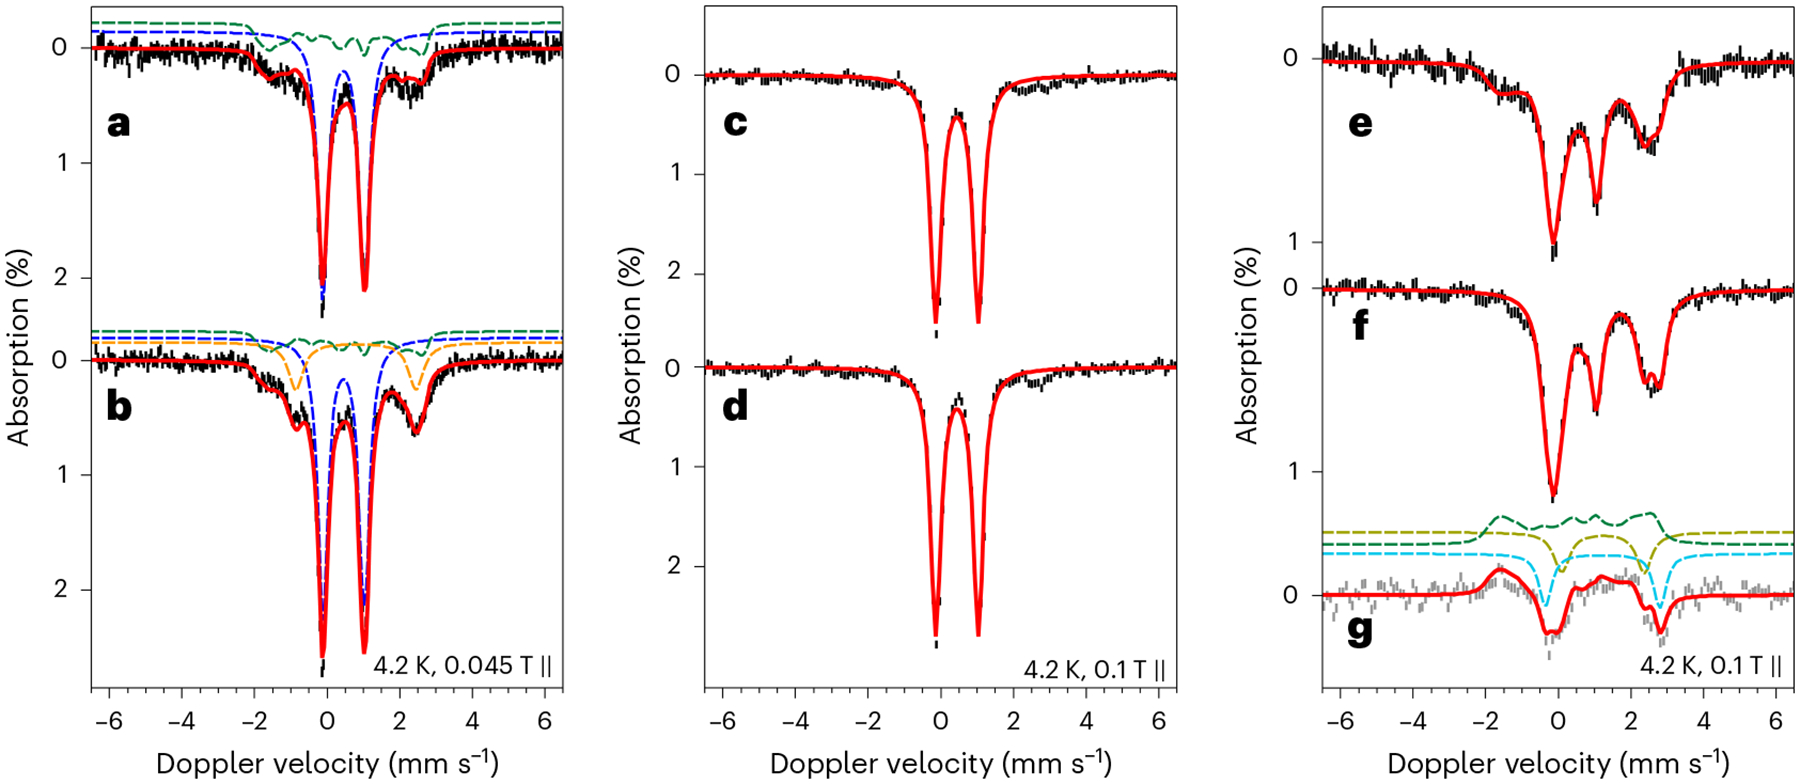
a–f, Mössbauer spectra of DT-treated 57Fe-AbmM (a), reacted DT-treated 57Fe-AbmM in the presence of 10 and SAM (b), DT-treated 57Fe-PT–56Fe-AbmM (AUX-labelled) (c), reacted DT-treated 57Fe-PT–56Fe-AbmM (AUX-labelled) in the presence of 10 and SAM and freeze-trapped after 15 min (d), DT-treated 56Fe-PT–57Fe-AbmM (RS-labelled) (e) and reacted DT-treated 56Fe-PT–57Fe-AbmM (RS-labelled) in the presence of 10 and SAM and freeze-trapped after 15 min (f). g, Difference spectrum of spectrum f minus spectrum e. The measurement conditions were 4.2 K and the applied external magnetic fields parallel to the γ-radiation as indicated in the figure. Throughout, black bars show the experimental data with the bar length indicating the statistical uncertainty of each data point, red solid lines represent the overall simulations, dashed coloured lines show the individual components of the spectroscopic simulations: blue, [Fe4S4]2+; green, [Fe4S4]+; orange, FeII-A; light green, FeII-B; cyan, FeII-C. The simulation parameters are listed in Extended Data Tables 2 and 3.
As the Mössbauer parameters of unreacted wild-type and ΔRS-cluster enzymes were indistinguishable (Extended Data Fig. 5), selective 57Fe labelling experiments were performed to study the structural integrity of the RS and AUX clusters. To determine the degree to which the AUX cluster is susceptible to iron exchange, the ΔRS-cluster variant was overexpressed in natural-abundance Fe-enriched media and analysed via Mössbauer spectroscopy without previous reconstitution. A very weak quadrupole doublet signal typical of an [Fe4S4]2+ cluster (Extended Data Fig. 5e, red trace) was observed in the as-isolated enzyme before and after treatment with the chelating agent 1,10-phenanthroline (PT). This weak Mössbauer signal is due to the small amount (2.2%) of 57Fe present at natural abundance. The Mössbauer spectrum was essentially unchanged after reconstitution with 57Fe and treatment with PT, despite a small increase in the overall intensity (Extended Data Fig. 5e, green trace). A comparison of the iron content (Extended Data Fig. 5 caption) with changes in the Mössbauer signal intensity before and after 57Fe reconstitution implied that less than 10% of the AUX cluster in the ΔRS-cluster variant was either exchanged or introduced into the enzyme from externally supplied iron during Fe reconstitution. Therefore, the majority of the AUX cluster does not appear to be susceptible to iron exchange, thereby facilitating the selective labelling of the AUX and RS clusters with 56Fe versus 57Fe.
Accordingly, wild-type AbmM was subsequently overexpressed in 57Fe-enriched media and characterized without previous reconstitution. A Mössbauer quadrupole doublet typical of an [Fe4S4]2+ cluster (Extended Data Fig. 5f, orange trace) was observed and remained essentially unchanged upon incubation with PT (Extended Data Fig. 5f, blue trace), despite losing most of its activity (Supplementary Fig. 14). Consistent with the aforementioned controls using the ΔRS-cluster variant, these results indicated that the Mössbauer signal of 57Fe-AbmM without reconstitution is mostly due to the AUX cluster and that iron extraction of the AUX cluster by PT is minimal. Therefore, wild-type AbmM was prepared containing a 57Fe-enriched AUX cluster and a natural-abundance RS cluster (57Fe-PT–56Fe-AbmM, AUX-labelled) by overexpressing AbmM in 57Fe-enriched media followed by treatment of the isolated protein with PT and then reconstitution with natural-abundance FeCl3. The corresponding construct of 56Fe-PT–57Fe-AbmM (RS-labelled), which contains a natural-abundance AUX cluster and a 57Fe-enriched RS cluster, was prepared in an analogous manner.
The 57Fe-PT–56Fe-AbmM (AUX-labelled) construct exhibited nearly identical Mössbauer spectra, indicative of a quadrupole doublet with parameters typical of an [Fe4S4]2+ cluster before and after incubation with DT. The latter spectrum showed less than 10% (relative to the total iron in the sample) [Fe4S4]+ cluster signal (Fig. 5c). In addition, the Mössbauer spectrum of reduced the 57Fe-PT–56Fe-AbmM (AUX-labelled) construct remained unchanged after incubation with SAM and CDP for 15 min before freeze-trapping (Fig. 5c,d and Extended Data Tables 2 and 3). These results indicated that the AUX cluster in AbmM cannot be easily reduced by DT and does not show detectable degradation during the enzymatic reaction. By contrast, spectra of the reduced 56Fe-PT–57Fe-AbmM (RS-labelled) construct showed a greater mixture of ~29% [Fe4S4]2+ and 36% [Fe4S4]+ clusters (Fig. 5e and Extended Data Tables 2 and 3). Two additional mononuclear high-spin ferrous species (FeII-B and FeII-C; Extended Data Tables 2 and 3) accounted for an additional ~23% of the total iron in the sample, probably due to non-cluster-bound iron. Moreover, the [Fe4S4]+ species in reduced 56Fe-PT–57Fe-AbmM (RS-labelled) was no longer discernible after incubation with SAM and CDP for 15 min before freeze-trapping, whereas the two mononuclear ferrous species increased to ~50% of the total iron (Fig. 5f and Extended Data Tables 2 and 3). These observations suggest that the AUX cluster remains unchanged during the enzymatic reaction, whereas the RS cluster is susceptible to both reduction by DT and degradation to mononuclear ferrous species after incubation with SAM and CDP. As shown in Extended Data Tables 2 and 3, the depletion of the reduced RS cluster (from 36% to undetectable) matches the increase in mononuclear ferrous ion (from 23% to 50%). The aforementioned Mössbauer results were further corroborated by EPR data (Supplementary Figs. 15 and 16), which showed that two slightly different S = ½ [Fe4S4]+ cluster signals—corresponding to the AUX-[Fe4S4]+ and the RS-[Fe4S4]+ clusters—were observed via EPR (g = [2.06, 1.92, 1.87] for AUX-[Fe4S4]+ and g = [2.02, 1.91, 1.90] for RS-[Fe4S4]+)21. The S = ½ [Fe4S4]+ signal from the RS-[Fe4S4]+ cluster was almost depleted upon the reaction of AbmM with CDP in the presence of SAM and DT.
Labelling experiments with 34S
Labelling experiments with 34S were also performed to narrow down the immediate sulfur donor during AbmM catalysis. Controls examining the susceptibility of the AUX cluster to sulfide exchange involved treatment of the as-isolated ΔRS-cluster variant with PT before the reconstitution with FeCl3 and with Na234S before a final round of PT treatment to remove possible FeS aggregates. When the resulting protein was denatured and worked up with mBBr, only 5% S-(bimane)2 was found to contain 34S (Extended Data Fig. 6a). This outcome indicates that the AUX cluster does not undergo extensive sulfide exchange during the FeS reconstitution protocol, which is consistent with the aforementioned Mössbauer results regarding AUX cluster stability and resistance to Fe exchange. Therefore, a solution of as-isolated wild-type AbmM expressed in the presence of natural-abundance sulfide was treated with PT and reconstituted with FeCl3 and Na234S to selectively enrich the RS cluster with 34S (32S-PT–34S-AbmM, RS-labelled). Indeed, denaturation and derivatization of the enriched enzyme with mBBr demonstrated that approximately 45% of the resulting S-(bimane)2 contained 34S (Extended Data Fig. 6b), consistent with selective enrichment of only the RS cluster and not the AUX cluster. When the selectively enriched wild-type AbmM (32S-PT–34S-AbmM, RS-labelled) was subsequently incubated with 10 in the absence of additional sulfide, ESI-MS analysis of the product indicated the incorporation of 95% 34S into the product (Extended Data Fig. 6c). These results are consistent with a mechanistic model where the RS cluster rather than the AUX cluster serves as the sulfide donor during AbmM catalysis. The substantial incorporation of 34S (64%) into 14 after a 10 min incubation with Na234S and reductants (DT or NADPH/MV) in the presence of DTT suggests that the sulfur atoms in the RS cluster can exchange with exogenous sulfide before sulfur insertion into CDP (Fig. 4a). The apparently rapid exchange is consistent with a previous report that the RS cluster in the DT-treated twitch radical SAM enzyme BtrN undergoes rapid exchange with exogenous Fe, whereas the AUX cluster remains inert33.
Discussion
In this Article we have demonstrated that AbmM is a twitch radical SAM enzyme that catalyses the oxidation of CDP/CTP to the 4′-hydroxy-4′-thionucleotide 13. Our mechanistic studies indicate that this reaction proceeds via hydrogen-atom abstraction from C4′, which subsequently induces cleavage of the C1′–O bond and the addition of sulfur to C1′. Subsequent cyclization generates the sulfur-bridged ribose, effectively swapping oxygen for sulfur in the furanose ring. This chemistry differs from that of other radical SAM-catalysed thiolation reactions, which typically involve sulfur insertion into C–H bonds22,24,27. Incorporation of sulfur leads to the deactivation of AbmM with minimal reactivation in the presence of Na2S, which suggests that free sulfide is not an immediate sulfur donor and must first be more tightly integrated into the structure of AbmM before it can participate in the reaction. Moreover, the observation of improved catalytic turnover with external FeS cluster carrier proteins implies that the sulfur donor is a component of an FeS cluster bound by AbmM. However, the AUX cluster in AbmM remains stable during turnover. This stands in contrast to the RS cluster, which both undergoes decomposition during turnover—observable via Mössbauer spectroscopy—and appears to be the source of the incorporated sulfur according to selective 34S labelling of the RS- and AUX-[Fe4S4] clusters in AbmM.
These findings indicate a model in which the RS cluster serves in some manner as the immediate sulfur donor (Fig. 6). This chemistry would distinguish AbmM catalysis from that of BioB23,24 and LipA22,25–27, which instead rely on an auxiliary [Fe2S2] or [Fe4S4] cluster as the sulfur donor. Unlike the radical SAM enzymes BioB and LipA, AbmM is a twitch radical SAM enzyme, for which the AUX-[Fe4S4] cluster is typically situated quite distant from the site of initial substrate radical generation and is stabilized via by four cysteine ligands, features which appear to be recapitulated in the partial crystal structure of AbmM. Thus, the AUX cluster may not be a suitable donor in the active sites of twitch radical SAM enzymes, in contrast to BioB and LipA. Nevertheless, substituting any one of the four cysteine residues coordinating the AUX cluster with alanine resulted in protein insolubility, suggesting that the AUX cluster plays a structural role. Furthermore, AUX clusters in twitch radical SAM enzymes are typically difficult to reduce, as exemplified by BtrN34; however, EPR analysis indicated that the AUX cluster in AbmM can be partially reduced by DT, raising the possibility that it could participate in redox processes during catalysis, a hypothesis that requires further investigation.
Fig. 6 |. Proposed mechanism of AbmM.
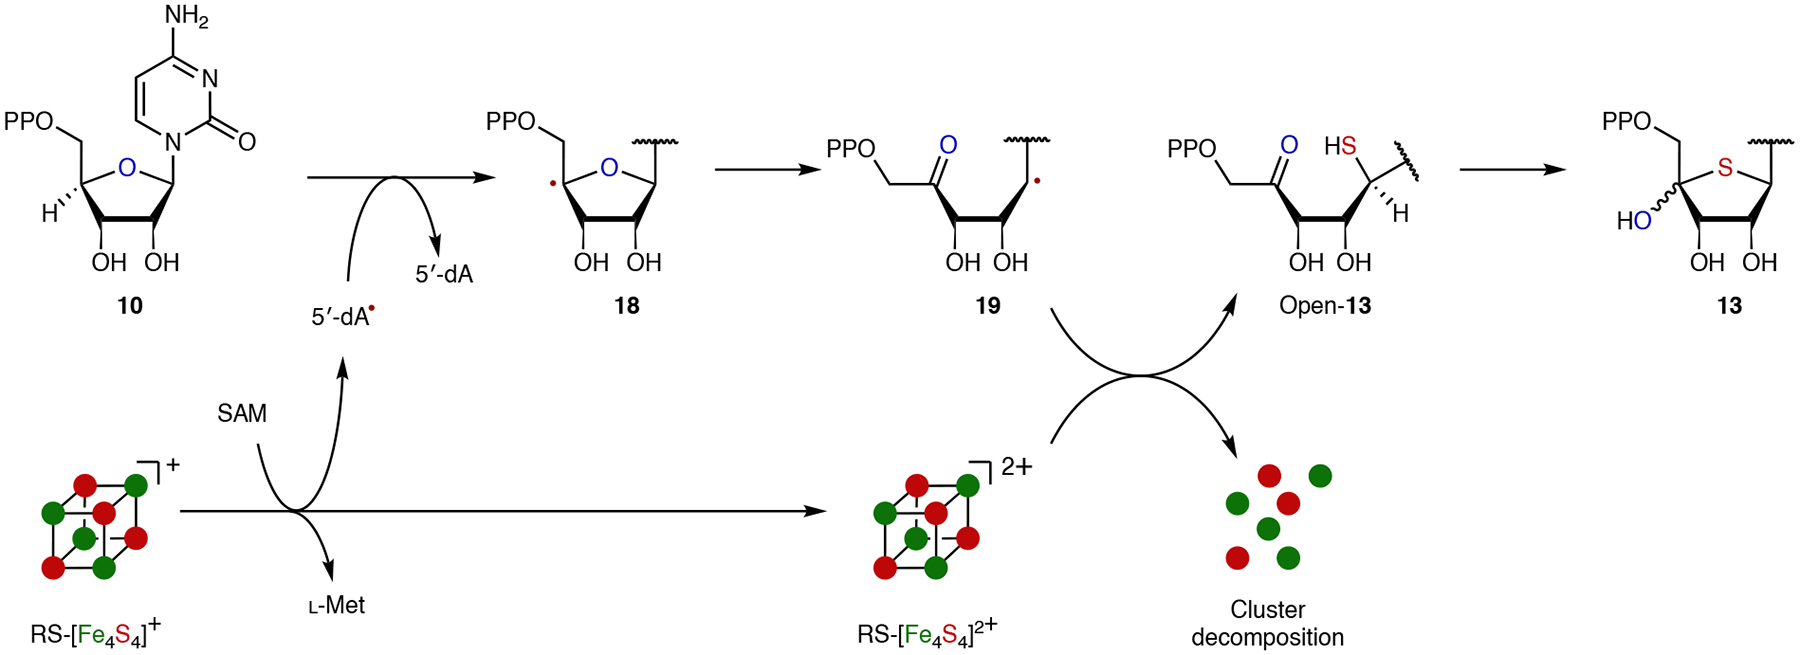
In this mechanism, the RS cluster in AbmM serves both to mediate the reductive cleavage of SAM and to donate the incorporated sulfur.
Exactly how the RS cluster participates in the radical thiolation step likewise remains to be fully clarified. In particular, the reduction products of SAM (that is, 5′-dA and methionine) would presumably block access to the RS cluster by the substrate radical. This may require an unanticipated disposition of the substrate radical relative to the RS-[Fe4S4] cluster, an FeS cluster with an additional sulfur ligand or decomposition of the RS cluster to liberate free sulfide before the thiolation step, possibly induced by methionine dissociation. In any case, entry into the albomycin δ2 biosynthetic pathway involves a novel radical-mediated swapping of the bridging furanose oxygen for sulfur and may have broad implications in the biosynthesis of sulfur-containing natural products15,35–37.
Methods
Materials and general methods
Streptomyces sp. strain ATCC 700974 was obtained from the American Type Culture Collection. E. coli DH5α, from Bethesda Research Laboratories, was used for routine cloning procedures38. The protein overexpression host E. coli BL21 Star (DE3) was obtained from Invitrogen. Vector pET28b(+) for protein overexpression was purchased from Novagen. Vector pYH7 used for the gene inactivation experiments was a gift from Y. Sun at Wuhan University39. Methylation-deficient E. coli ET12567/pUZ8002 was used for the intergeneric conjugation40. Plasmid pIB139 is a Streptomyces–E. coli shuttle vector that can site-specifically integrate into Streptomyces chromosomes41. The vector pSUMO was kindly provided by S. Booker at The Pennsylvania State University.
All chemicals and reagents were purchased from Sigma-Aldrich or Fisher Scientific and were used without further purification unless otherwise specified. Standard genetic manipulations of E. coli were performed as described by Sambrook and Russell38. DNA sequencing was performed at the core facility of the Institute of Cellular and Molecular Biology, the University of Texas at Austin. Tetrahydrofuran was distilled from sodium/benzophenone, and dichloromethane was distilled from calcium hydride under an argon atmosphere. Oligonucleotide primers were prepared by Integrated DNA Technologies. Kits for DNA gel extraction and spin minipreps are products of Qiagen. The PureLink Genomic DNA Mini Kit used was acquired from Invitrogen. Enzymes and molecular weight standards used in the cloning experiments were obtained from New England Biolabs. KAPA HiFi DNA polymerase was purchased from KAPA Biosystems. Reagents for SDS–PAGE were ordered from Bio-Rad. Sterile syringe filters were bought from Fisher Scientific. Amicon YM-10 ultrafiltration membranes are products of Millipore. Silica gel column chromatography was carried out using SiliaFlash P60 (230–400 mesh, SiliCycle). NaBD4 (99% D), elemental 34S (99.79% 34S) and [18O]water (97% 18O) were obtained from Cambridge Isotope Laboratories. d-[3-2H]Ribose (99% D) and d-[4-2H]ribose (99% D) were purchased from Omicron Biochemicals.
DNA concentrations were measured using a NanoDrop ND-1000 UV-vis instrument from Thermo Fisher Scientific. HPLC was performed using a Beckman System Gold 125 Solvent Module with a 166 detector or an Agilent Technologies 1260 Infinity HPLC System with a diode array multiple wavelength UV–vis absorbance detector (G1315D, Agilent Technologies) using a C18 reversed-phase column (Microsorb 100–5 C18 4.6 × 250 mm, Agilent Technologies) unless otherwise noted. LC-ESI-TOFMS analysis was performed using an Agilent Technologies HPLC system equipped with a pump (G1311C), an auto sampler (G1329B) and a time-of-flight mass spectrometer (G6230B) with an electrospray ionization source. LCMS separations were performed using a Poroshell 120 EC-C18 column (2.7 μm, 4.6 × 100 mm) along with an Eclipse plus C18 guard column (1.8 μm, 2.1 × 5 mm) at a flow rate of 0.4 ml min−1 using 0.1% formic acid in H2O (solvent A) and acetonitrile (solvent B). The elution was conducted using the following gradient programme unless otherwise specified: 0–10 min, 0–30% B; 10–12 min, 30–100% B; 12–13 min, 100–0% B; 13–18 min, 0% B. The obtained LCMS data were analysed using MassHunter software (Agilent Technologies). NMR spectra were recorded using a Varian DirectDrive 600 MHz spectrometer, a Bruker Avance III HD 500 MHz NMR spectrometer equipped with a CryoProbe Prodigy or a Varian DirectDrive 400 MHz spectrometer at the Nuclear Magnetic Resonance Facility at the University of Texas at Austin. MestRe Nova42 was used to analyse the NMR spectra. Deuterated solvents were used as internal standards in the NMR spectra unless stated otherwise. Chemical shifts are reported as parts per million (ppm) relative to those of CDCl3, 7.26 ppm for 1H NMR and 77.16 ppm for 13C NMR, respectively. Anaerobic work was performed in an anaerobic glovebox (Coy Laboratory Products) under an atmosphere of >98% N2, ~2% H2 and <25 ppm O2.
Cloning of sufU and abmM
The sufU gene was amplified via polymerase chain reaction (PCR) from the genomic DNA of Streptomyces sp. ATCC 700974 using primers sufU-F and sufU-R shown in Supplementary Table 3. The PCR-amplified gene fragment was purified using a Gel Extraction Kit from Qiagen, digested with NdeI and XhoI restriction enxymes, and ligated into pET28b(+) vector, which had also been digested using the same restriction enzymes. The resulting plasmid sufU/pET28b(+) was sequenced using the T7 or T7-terminal universal primers. The abmM gene was PCR-amplified from the genomic DNA of Streptomyces sp. ATCC 700974 using primers abmM-F and abmM-R listed in Supplementary Table 3. The PCR-amplified gene fragment was purified using the Gel Extraction Kit from Qiagen and inserted into the pSUMO vector after digestion with BsaI and XhoI restriction enzymes. The procedures were based on the cloning method using SLiCE (Seamless Ligation Cloning Extract)43. The resulting plasmid abmM/pSUMO was sequenced using the T7 or T7-terminal universal primers. The plasmids abmM/pET28b(+) and abmM-ΔRS/pET28b(+) used for expression of N-His6-AbmM and N-His6-AbmM-ΔRS were constructed using primers abmM-pET28b(+)-F and abmM-pET28b(+)-R listed in Supplementary Table 3.
Expression and purification of SufU
The plasmid sufU/pET28b(+) was used to transform the E. coli BL21 Star (DE3) strain for protein expression. An overnight culture of E. coli BL21 Star (DE3)-sufU/pET28b(+) grown in the LB medium (10 ml) containing kanamycin (50 μg ml−1) was used to inoculate one litre of the same growth medium. The culture was incubated at 37 °C with shaking (200 revolutions per min (r.p.m.)) until the absorbance at 600 nm (A600) reached ~0.6. Protein expression was then induced by the addition of isopropyl β-d-1-thiogalactopyranoside to a final concentration of 0.1 mM, and the cells were allowed to grow at 18 °C and 120 r.p.m. for an additional 20 h. The cells were collected by centrifugation at 4,000 × g for 10 min and stored at −80 °C until lysis. All purification steps were carried out at 4 °C. The thawed cells were re-suspended in 50 mM HEPES buffer (pH 7.5) containing 10% (v/v) glycerol, 10 mM imidazole and 300 mM NaCl. The cells were disrupted by sonication using ten pulses of 10 s each with a 20 s cooling pause between each pulse. The resulting lysate was centrifuged at 20,000 × g for 20 min, and the supernatant was mixed with Ni-nitrilotriacetic acid (NTA) resin. Bound protein was eluted using 50 mM HEPES buffer (pH 7.5) buffer containing 10% (v/v) glycerol, 250 mM imidazole and 300 mM NaCl. The collected protein solution was dialysed against 50 mM HEPES buffer (pH 7.5) (3 × 1 l) containing 300 mM NaCl and 10% (v/v) glycerol. The protein solution was then flash-frozen in liquid nitrogen and stored at −80 °C until use (Supplementary Fig. 1).
Expression and purification of AbmM
N-His6-SUMO-AbmM was also expressed and purified on the basis of the same procedure described for SufU. After purification by Ni-NTA resin and dialysis against 50 mM HEPES buffer (pH 7.5) containing 300 mM NaCl and 10% (v/v) glycerol, the SUMO-tagged AbmM was treated with SUMO protease Ulp1403–621 (prepared as previously described44,45, 0.87 μM) in the presence of DTT (1 mM) at 4 °C for 6 h. The protein solution was loaded onto a column filled with Ni-NTA resin that had been pre-equilibrated with 50 mM HEPES buffer (pH 7.5) containing 300 mM NaCl and 10% (v/v) glycerol. The desired native AbmM appeared as a brown-coloured band on the column and was eluted with 50 mM HEPES buffer (pH 7.5) containing 10% (v/v) glycerol, 10 mM imidazole and 300 mM NaCl. The collected protein solution was dialysed against 50 mM HEPES buffer (pH 7.5) (3 × 1 l) containing 300 mM NaCl and 10% glycerol. Iron and sulfur bound to AbmM were quantified on the basis of the reported methods46,47. The protein solution was concentrated to approximately 170 μM, as determined using the NanoDrop instrument, flash-frozen in liquid nitrogen and stored at −80 °C until use (Extended Data Fig. 1e).
Typical AbmM assay conditions and analysis
CDP (10, 0.2 or 0.4 mM) was incubated with as-purified AbmM (34 μM), Na2S (2 mM), SAM (0.6 mM), NADPH (1 mM), MV (1 mM) and DTT (10 mM) in HEPES buffer (40 mM, pH 7.5) at room temperature under an anaerobic atmosphere. Assays were conducted using AbmM without iron and sulfur reconstitution unless otherwise noted. The AbmM reaction was also performed using DT (2 mM) instead of NADPH and MV. The reaction volume was typically 50–100 μl. After the incubation, the reaction mixture was removed from the glovebox and filtered through a YM-10 membrane filter. The filtrate was then analysed using LCMS or HPLC with UV absorbance detection. For the LCMS analysis, the filtrate (10 μl) was diluted in H2O (400 μl), and a 10 μl volume of the diluted sample was subjected to LCMS analysis using the method described above. For the HPLC-UV analysis, the filtrate (100 μl) was injected onto an anion exchange column (Dionex CarboPac PA1, 4 × 250 mm) and the column was eluted using H2O as mobile phase A and 1 M ammonium acetate in H2O as mobile phase B at a flow rate of 1 ml min−1 with the following gradient programme: 0–33 min, 0–90% B; 33–36 min, 90% B; 36–37 min, 90–0% B; 37–42 min, 0% B. Elution was monitored by setting the UV detector at 271 nm (Fig. 2). Analysis of the AbmM reaction was also performed after the incubation mixture was treated with CIP (0.05 U μl−1) for 1 h. The mixture was filtered using YM-10 centrifugal filtration to remove protein and analysed by LCMS as described above. Methods for the isolation and characterization of 14 are described in Supplementary Information.
Expression and purification of AbmM and the ΔRS-cluster variant for Mössbauer and 34S cluster labelling experiments
The plasmid abmM/pET28b(+) and the plasmid pDB128248 were used to co-transform the E. coli BL21 Star (DE3) strain for protein expression. An overnight culture of E. coli BL21 Star (DE3)-abmM/pET28b(+)-pDB1282 grown in the LB medium (5 ml) containing kanamycin (50 μg ml−1) and ampicillin (100 μg ml−1) was used to inoculate of M9 medium (1 l) with the identical antibiotics. The culture was incubated at 37 °C with shaking (200 r.p.m.) until A600 reached ~0.3. l-Arabinose (2 g) was added to the culture, which was then incubated further until A600 reached ~0.6. The culture was cooled on ice for 1 h. Protein expression was then induced by the addition of isopropyl β-d-1-thiogalactopyranoside and FeCl3 to a final concentration of 0.1 mM and 50 μM, respectively. The cells were allowed to grow at 18 °C and 120 r.p.m. for an additional 20 h. The purification was carried out in the same way as described for NfuA. The N-His6-AbmM-ΔRS cluster was expressed and purified using the same procedure as described for N-His6-AbmM. For 57Fe-enriched N-His6-AbmM and the N-His6-AbmM-ΔRS cluster, regular FeCl3 was replaced with 57FeCl3.
Reconstitution of N-His6-AbmM and the ΔRS-cluster variant for Mössbauer analysis
All of the procedures are performed anaerobically. A solution of 100 μM as-isolated 57Fe-enriched N-His6-AbmM in 50 mM HEPES buffer (pH 7.5) containing 300 mM NaCl and 10% (v/v) glycerol in a total volume of 3 ml was chilled on ice packs and equilibrated with the anaerobic atmosphere for 1 h. DTT was added to a final concentration of 5 mM. After incubation for 1 h, a solution of 57FeCl3 was added over 20 min to a final concentration of 0.5 mM. This was followed by the addition of a solution of Na2S over 20 min to a final concentration of 0.5 mM. The resulting mixture was incubated for 3 h before desalting with an Econo-Pac 10DG Desalting Prepacked Gravity Flow Column (PD-10 column, Bio-Rad) using 50 mM HEPES buffer (pH 7.5) containing 300 mM NaCl and 10% (v/v) glycerol as the elution buffer. The brown-coloured protein eluate was concentrated using an Amicon Ultra-0.5 centrifugal filter unit with a molecular weight cut-off of 10 kDa (Millipore). Reconstitution of the 57Fe-enriched ΔRS-cluster variant was carried out in the same way as described above.
Selective 57Fe labelling experiments on the AbmM-ΔRS cluster
All of the procedures were conducted anaerobically. The buffer system was 50 mM HEPES buffer (pH 7.5) containing 300 mM NaCl and 10% (v/v) glycerol. A solution of 135 μM as-isolated ΔRS-cluster variant was incubated with 2 mM PT and 2 mM DT on ice packs overnight. After desalting through a PD-10 column, the protein eluate was obtained as a 56Fe-PT-AbmM-ΔRS cluster. A solution of 105 μM 56Fe-PT-AbmM-ΔRS cluster was reconstituted with 5 mM DTT, 0.84 mM 57FeCl3 and 0.84 mM Na2S. After desalting through the PD-10 column, the obtained protein eluate was concentrated as the 56Fe-PT–57Fe-AbmM-ΔRS cluster. Another round of PT treatment was conducted on the 56Fe-PT–57Fe-AbmM-ΔRS cluster to remove excess FeS aggregates, where a solution of 178 μM 56Fe-PT–57Fe-AbmM-ΔRS cluster was incubated with 3 mM PT and 3 mM DT on ice packs overnight. After desalting through the PD-10 column, the obtained protein eluate was concentrated as the 56Fe-PT–57Fe-PT-AbmM-ΔRS cluster. The iron content analysis is shown in caption of Extended Data Fig. 5.
Selective 57Fe labelling experiments on wild-type AbmM
All of the procedures were conducted anaerobically. The buffer system was 50 mM HEPES buffer (pH 7.5) containing 300 mM NaCl and 10% (v/v) glycerol. A solution of 118 μM as-isolated 57Fe-enriched N-His6-AbmM was incubated with 2 mM PT and 2 mM DT on ice packs overnight. After desalting through the PD-10 column, the protein eluate was obtained as 57Fe-PT-AbmM. A solution of 76 μM 57Fe-PT-AbmM was reconstituted with 5 mM DTT, 0.3 mM regular FeCl3 and 0.3 mM Na2S. After desalting through the PD-10 column, the obtained protein eluate was concentrated as 57Fe-PT–56Fe-AbmM (AUX-labelled). A solution of 112 μM as-isolated N-His6-AbmM was incubated with 2 mM PT and 2 mM DT on ice packs overnight. After desalting through the PD-10 column, the protein eluate was obtained as 56Fe-PT-AbmM. A solution of 77 μM 56Fe-PT-AbmM was reconstituted with 5 mM DTT, 0.31 mM 57FeCl3 and 0.31 mM Na2S. After desalting through the PD-10 column, the obtained protein eluate was concentrated as 56Fe-PT–57Fe-AbmM (RS-labelled).
Preparation of Mössbauer samples
All of the procedures were conducted anaerobically. Each sample was in a total volume of 300 μl, in 50 mM HEPES buffer (pH 7.5) containing 300 mM NaCl and 10% (v/v) glycerol. For the 0.3 mM DT-treated ΔRS-cluster variant (Extended Data Fig. 5c), a solution of 0.3 mM reconstituted N-His6-tagged AbmM-ΔRS cluster was incubated with 10 mM DTT and 2 mM DT for 10 min. For 0.2 mM DT-treated AbmM (Extended Data Fig. 5d), a solution of 0.2 mM reconstituted N-His6-tagged AbmM was incubated with 10 mM DTT and 2 mM DT for 10 min. For Fig. 5a, the sample is the same as that in Extended Data Fig. 5d. For Fig. 5b, a solution of 0.2 mM reconstituted N-His6-tagged AbmM was incubated with 10 mM DTT, 2 mM DT, 0.3 mM SAM and 0.2 mM CDP for 10 min. For Fig. 5c, a solution of 0.15 mM 57Fe-PT–56Fe-AbmM (AUX-labelled) was incubated with 4 mM DT for 15 min. For Fig. 5d, a solution of 0.15 mM 57Fe-PT–56Fe-AbmM (AUX-labelled) was incubated with 1 mM CDP, 1.5 mM SAM and 4 mM DT for 15 min. For Fig. 5e, a solution of 0.15 mM 56Fe-PT–57Fe-AbmM (RS-labelled) was incubated with 4 mM DT for 15 min. For Fig. 5f, a solution of 0.15 mM 56Fe-PT–57Fe-AbmM (RS-labelled) was incubated with 1 mM CDP, 1.5 mM SAM and 4 mM DT for 15 min.
Mössbauer spectroscopy
Mössbauer spectra were recorded using constant acceleration Mössbauer spectrometers equipped with a Janis SVT-400 variable-temperature cryostat (weak-field). Isomer shift (δ) values are reported with respect to the centroid of the spectrum of α-iron metal at room temperature. Simulations of Mössbauer spectra were carried out using the program WMOSS (SEE Co.) and SpinCount (M. P. Hendrich, Carnegie Mellon University)49. For simulations of diamagnetic species, the spin Hamiltonian formalism was invoked according to equation (1) shown below, in which the first term describes the interaction between the electric field gradient and the nuclear quadrupole moment, and the last term represents the nuclear Zeeman splitting of 57Fe nuclei. All symbols have their usual meanings. For the simulation of paramagnetic species arising from the [Fe4S4]+ clusters, the additional spin Hamiltonian terms were considered according to equation (2) listed below, where the first term describes the electronic Zeeman interactions and the second term describes the 57Fe electron–nuclear hyperfine interactions50.
| (1) |
where Hn represents nuclear spin Hamiltonian; e is the elementary charge; Q is the nuclear quadrupole moment; Ii is the nuclear spin quantum number of the ith nucleus (for 57Fe nuclei, I = 3/2); Vxx,i, Vyy,i and Vzz,i are the principal components of the electric field gradient tensor at the ith nucleus, Vi, following the convention |Vxx,i| ≤ |Vyy,i| ≤ |Vzz,i|; ηi is the asymmetry parameter of Vi, defined as is the total nuclear spin operator of the ith nucleus, with Cartesian components Ix,i, Iy,i and Iz,i defined in the same principal axis frame; gn is the nuclear g factor; βn is the nuclear magneton; and B is the external magnetic field vector.
| (2) |
where He represents electron spin Hamiltonian, β is the Bohr magneton, B is the external magnetic field vector, g is the electron g tensor, S is the total electron spin operator, Ai is the hyperfine coupling tensor between the electron spin and the nuclear spin for the ith nucleus, and Ii is the total nuclear spin operator of the ith nucleus.
Extended Data
Extended Data Fig. 1 |. Gene deletion of abmM and analysis of purified AbmM.
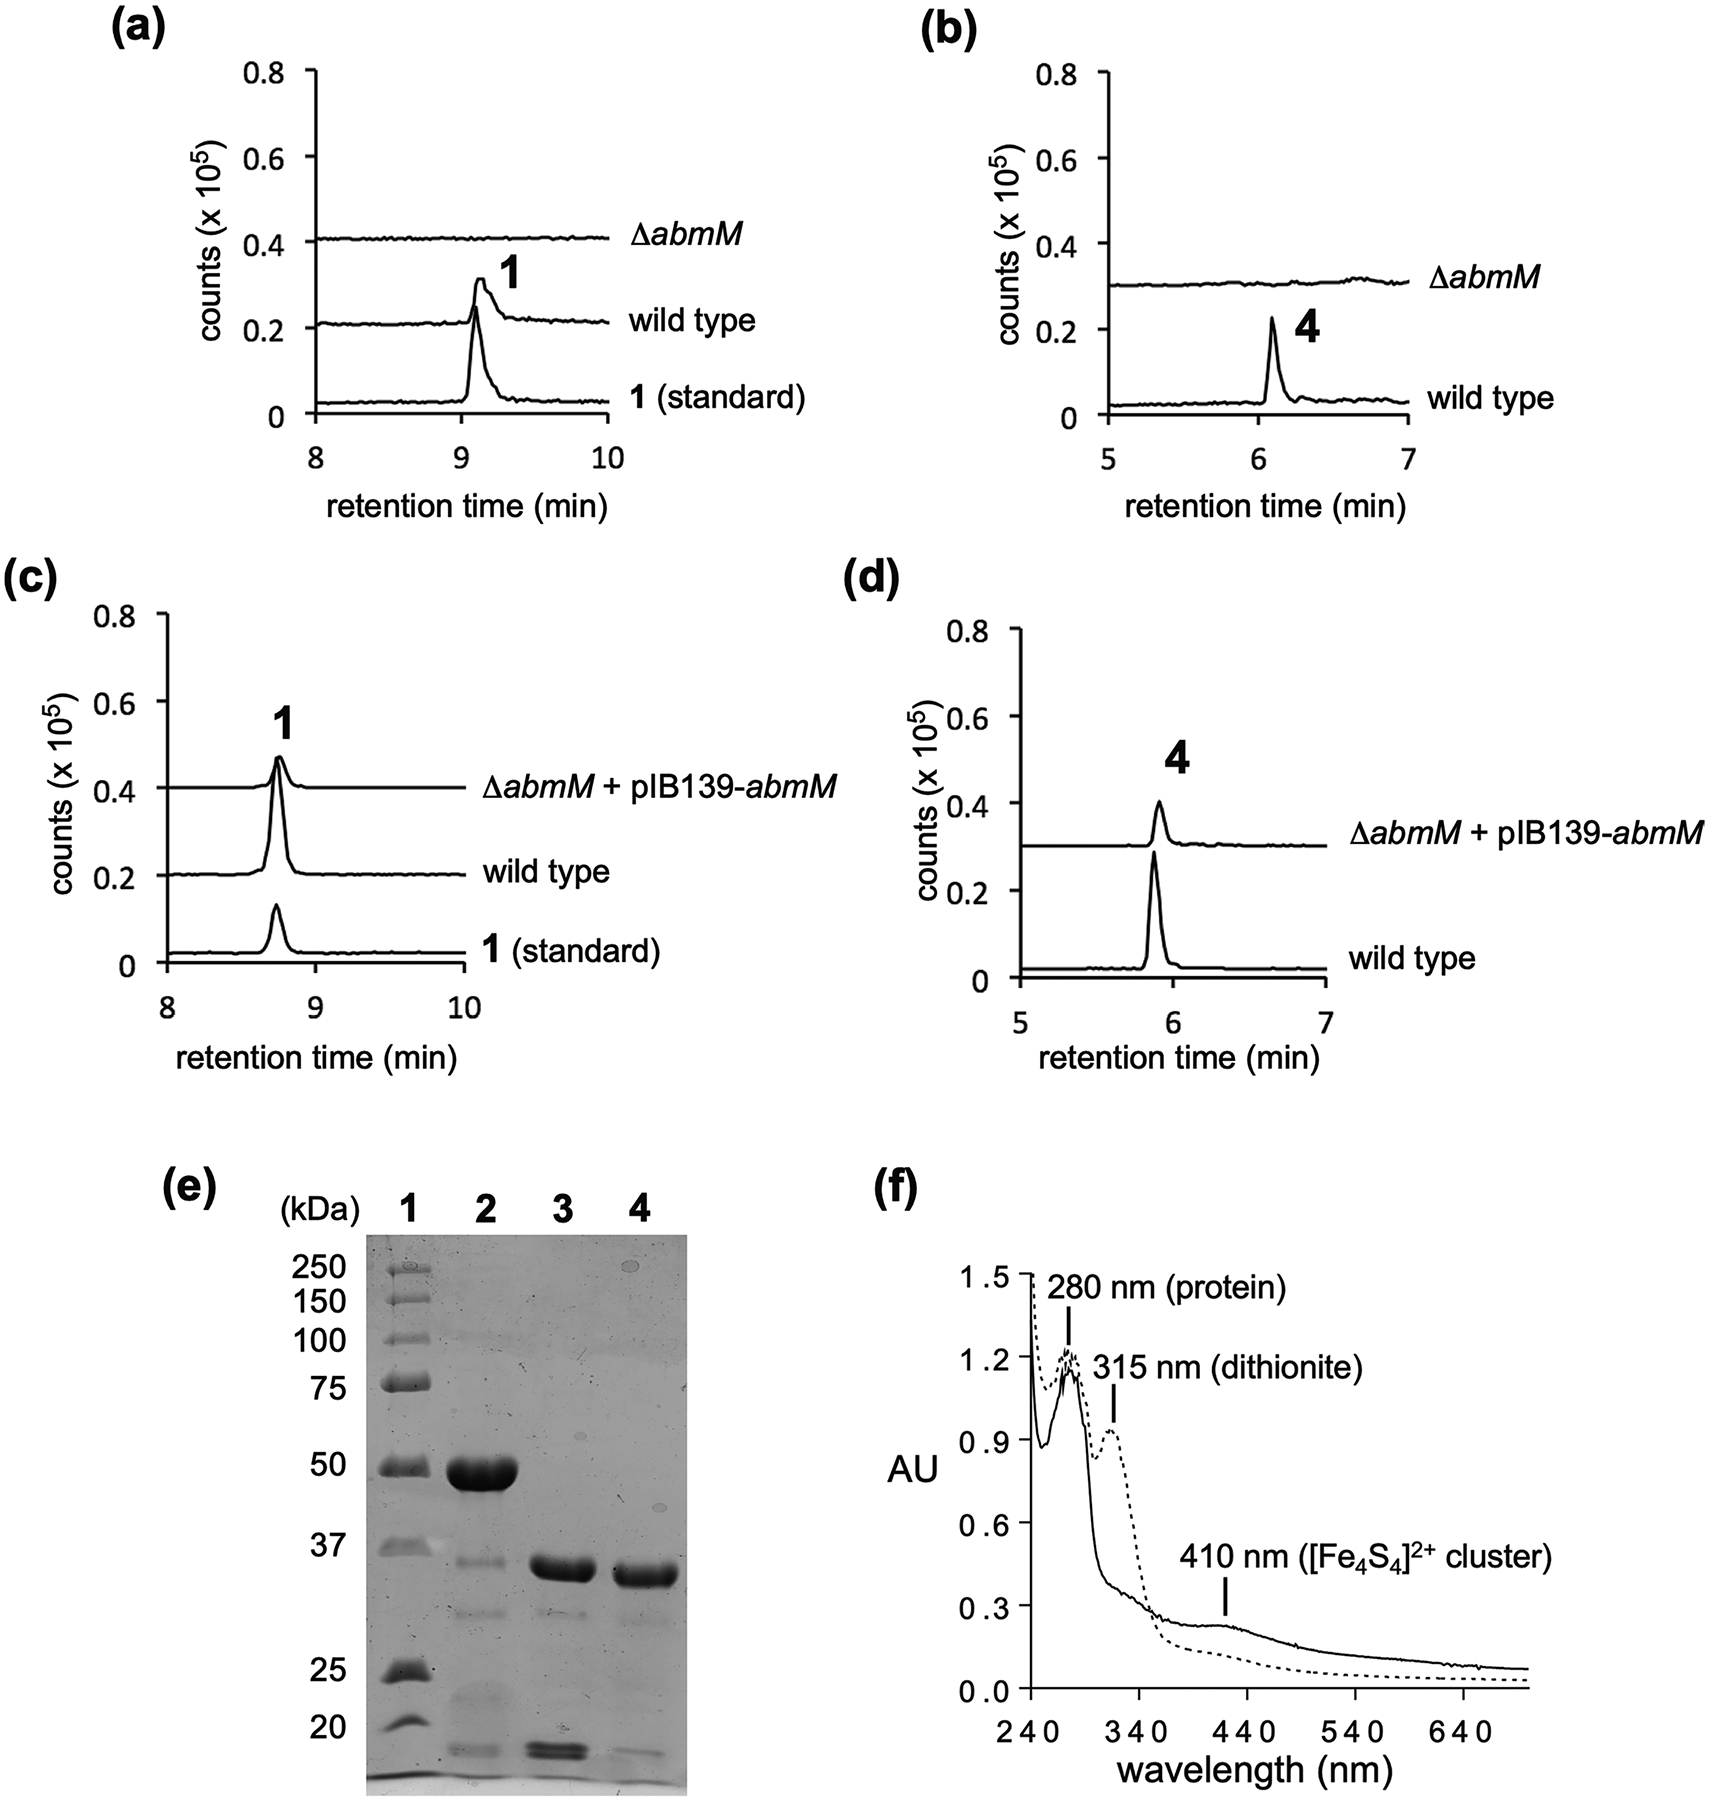
(a) LCMS analysis of the culture of the ΔabmM deletion mutant showing extracted ion chromatogram (EIC) traces corresponding to the [M + H]+ signal from albomycin δ2 (1) (m/z = 1046.3). (b) LCMS analysis of the culture of the ΔabmM deletion mutant showing EIC traces corresponding to the [M + H]+ signal from SB-217452 (4) (m/z = 477.1). (c) LCMS analysis of the culture of the ΔabmM strain complemented with abmM showing EIC traces corresponding to the [M + H]+ signal from albomycin δ2 (1) (m/z = 1046.3). (d) LCMS analysis of the culture of the ΔabmM strain complemented with abmM showing EIC traces corresponding to the [M + H]+ signal from SB-217452 (4) (m/z = 477.1). (e) SDS-PAGE of AbmM purification. Lane 1: molecular weight markers; Lane 2: purified N-His6-SUMO-AbmM (48.2 kDa); Lane 3, digestion of N-His6-SUMO-AbmM; Lane 4, purified AbmM without the tag (36.1 kDa). This experiment was repeated independently three times with similar results. (f) UV-vis absorption spectra of AbmM. Solid line, 15 μM as-isolated AbmM; dotted line, 15 μM as-isolated AbmM after treatment with 200 μM sodium dithionite.
Extended Data Fig. 2 |. Studies of the AbmM reaction.
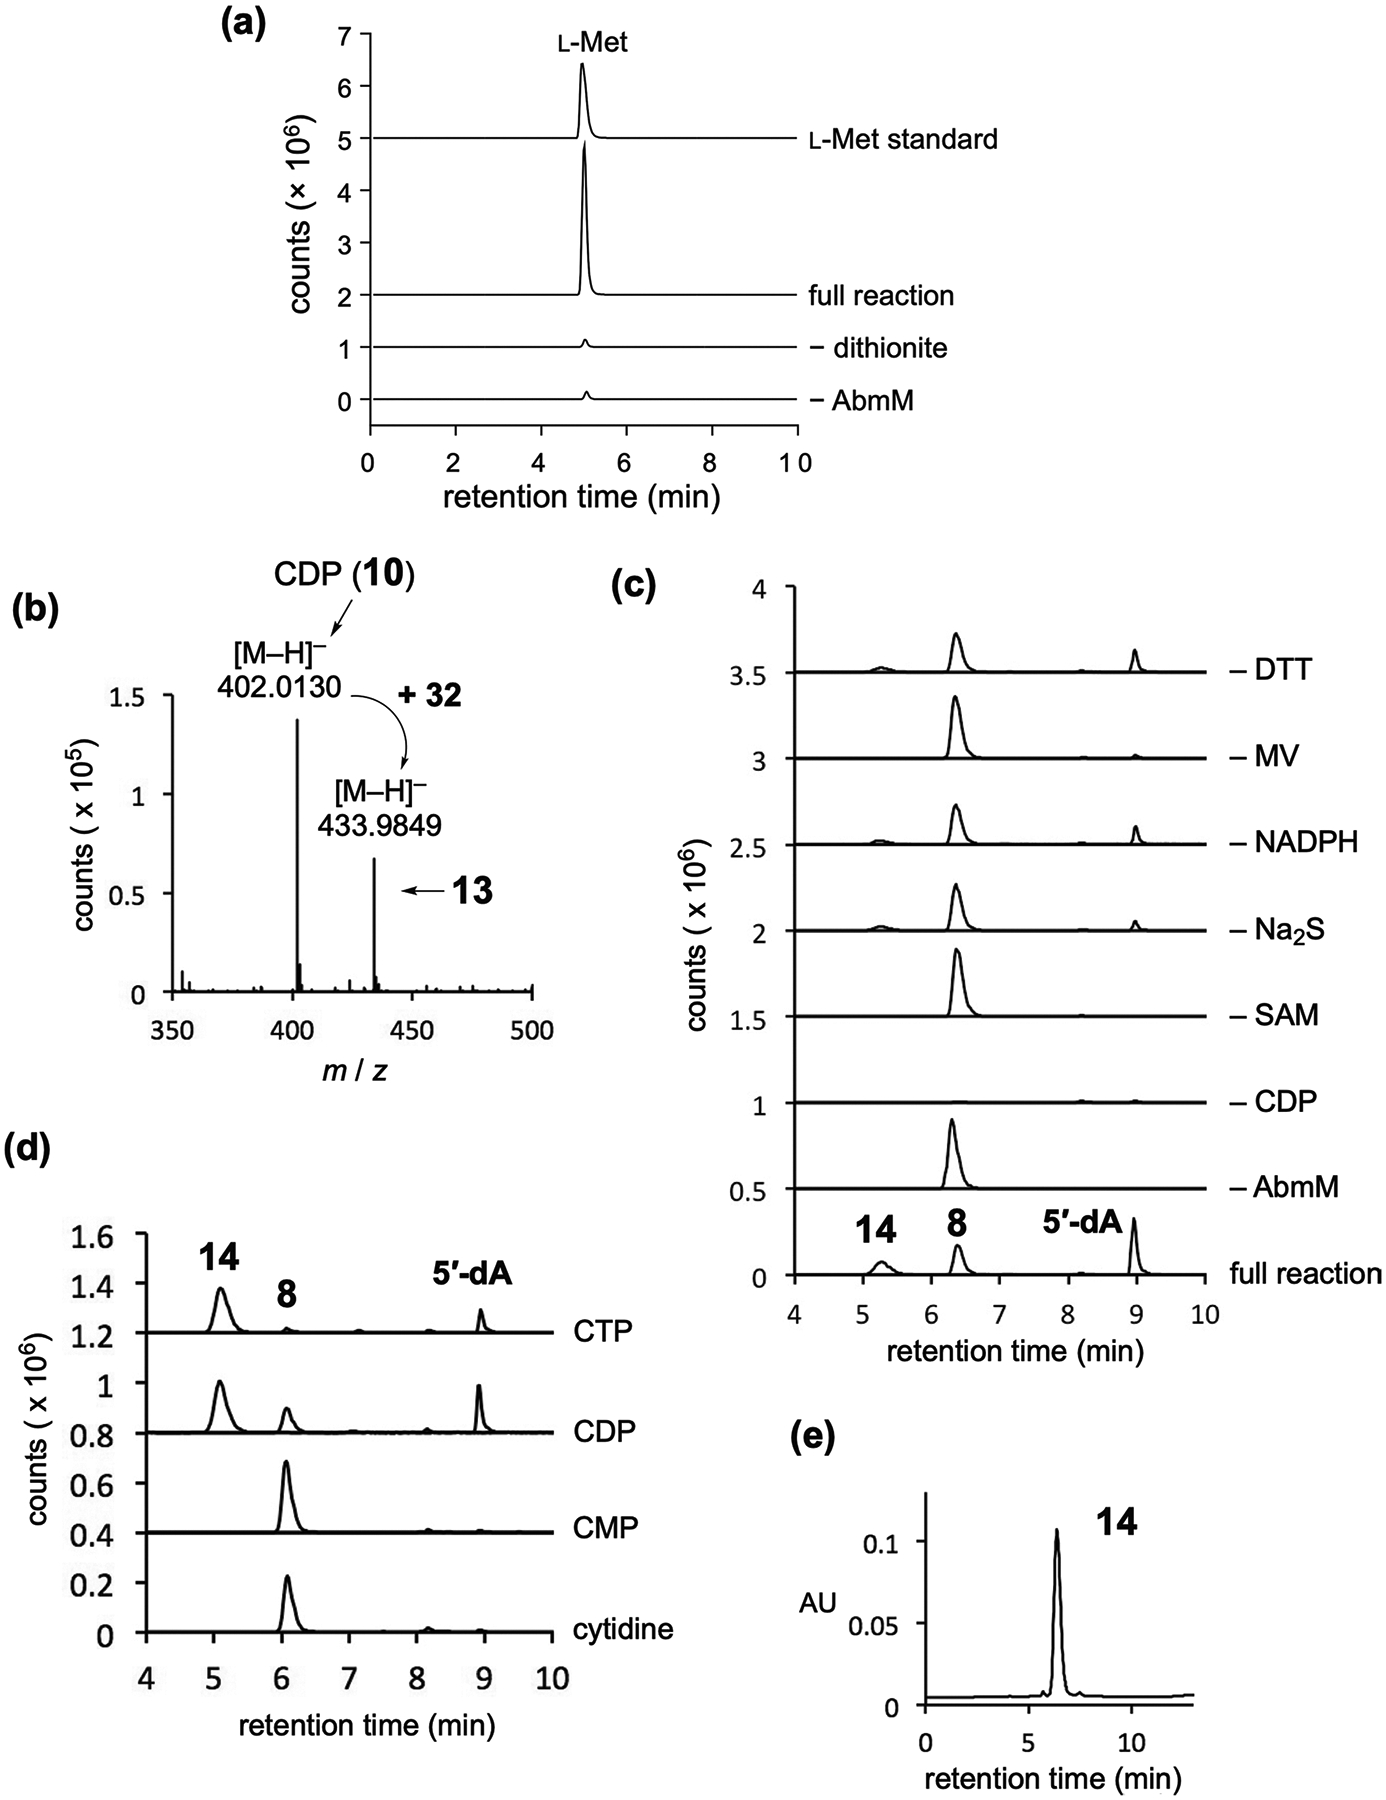
(a) Detection of l-methionine by LCMS. EIC traces corresponding to the [M + H]+ signal of l-methionine (m/z = 150.0583) are shown. A small amount of l-methionine was detected from the reaction mixture without AbmM or dithionite likely due to nonenzymatic degradation of SAM. (b) LCMS analysis of the AbmM reaction mixture. The [M – H]− signal at m/z 402.0130 arises from CDP (10, calc for C9H14N3O11P2−, 402.0109). The [M – H]− signal at m/z 433.9849 is consistent with the mass of 13 (calc. for C9H14N3O11P2S−, 433.9830). (c) LCMS analysis of the AbmM reaction carried out under different conditions. The analysis was conducted after the incubation mixture was treated with CIP. Three EIC traces (m/z = 276.06, 244.09, and 252.2, corresponding to the [M + H]+ signals from 14, 8, and 5′-deoxyadenosine, respectively) are overlaid. (d) LCMS analysis of the AbmM reaction with different substrates such as cytidine, CMP, CDP and CTP (8-11). Prior to the analysis, the incubation mixture was treated with CIP. Three EIC traces (m/z = 276.06, 244.09, and 252.2, corresponding to the [M + H]+ signals from 14, 8, and 5′-deoxyadenosine, respectively) are overlaid. Other tested compounds, cytidine 2′:3′-cyclic monophosphate (2′:3′-cyclic CMP), cytidine 3′:5′-cyclic monophosphate (3′:5′-cyclic CMP), 2′-deoxycytidine (2′-dC), 2′-deoxycytidine 5′-monophosphate (2′-dCMP), 2′-deoxycytidine 5′-diphosphate (2′-dCDP), deoxycytidine 5′-triphosphate (2′-dCTP), adenosine 5′-diphosphate (ADP), adenosine 5′-triphosphate (ATP), guanosine 5′-diphosphate (GDP), guanosine 5′-triphosphate (GTP), thymidine 5′-diphosphate (TDP), thymidine 5′-triphosphate (TTP), uridine 5′-diphosphate (UDP), and uridine 5′-triphosphate (UTP), were not accepted by AbmM as judged by no formation of 5′-deoxyadenosine (data not shown). (e) HPLC analysis of purified 14.
Extended Data Fig. 3 |. AbmM product and deuterium labelling experiments.
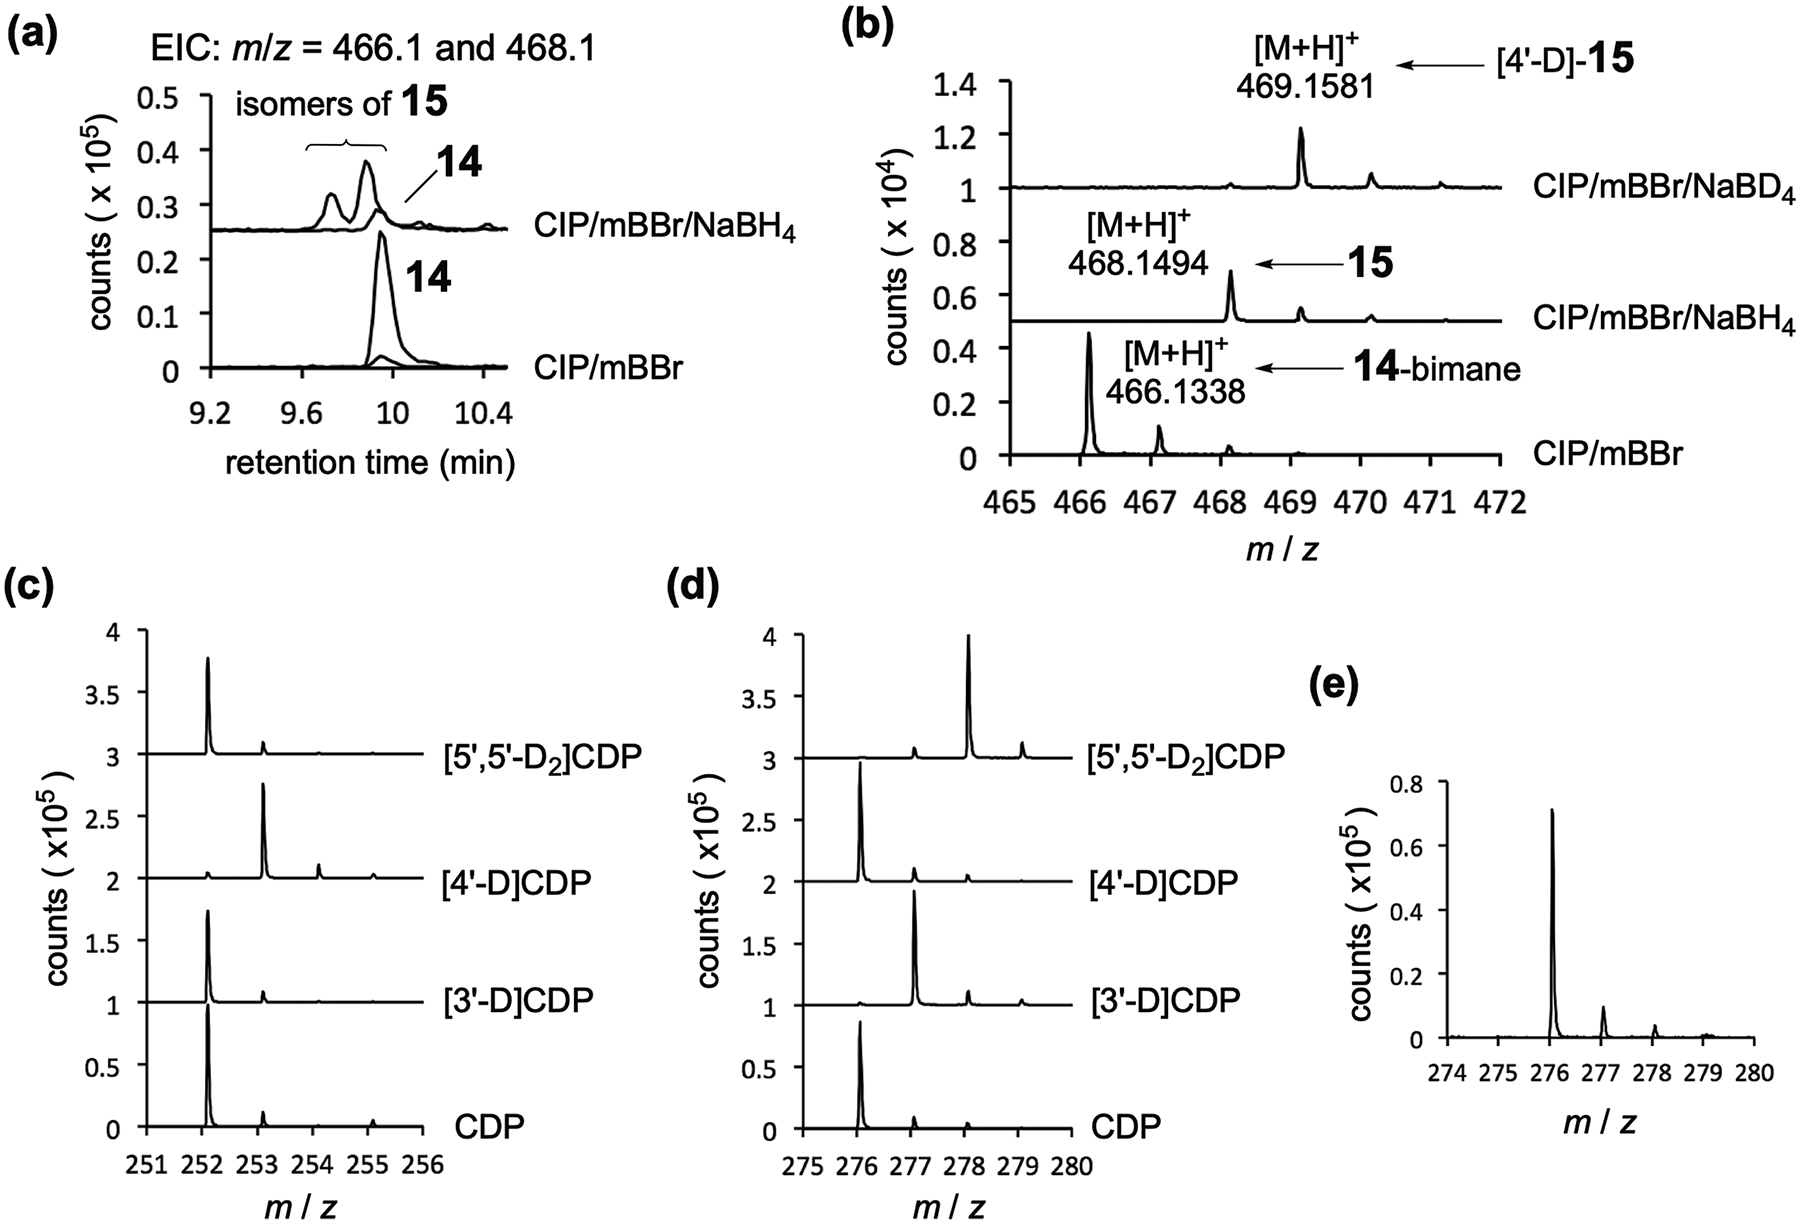
(a) and (b) LCMS analysis of the AbmM reaction mixture treated with CIP/mBBr or CIP/mBBr/NaBH4. EIC traces corresponding to the [M + H]+ signal from each species are overlaid (m/z 466.14 for 14-bimane and m/z 468.16 for 15). In (b): Bottom trace: ESI-MS analysis of 14-bimane generated from the AbmM product upon treatment with CIP/mBBr (calc for C19H24N5O7S+, 466.1391). Middle trace: ESI-MS analysis of 15 generated from the AbmM product upon treatment with CIP/mBBr/NaBH4 (calc for C19H26N5O7S+, 468.1547). Top trace: ESI-MS analysis of [4′-2H]-15 generated from the AbmM product upon treatment with CIP/mBBr/NaBD4 (calc for C19H25DN5O7S+, 469.1610). (c) ESI-MS analysis of 5′-dA and (d) 14 generated in the AbmM reaction using deuterated CDPs as substrates. The analysis was conducted after the incubation mixture was treated with CIP (5′-dA, calc for C10H14N5O3+, 252.1091; 14, calc for C9H14N3O5S+, 276.0649; [3′-2H]-14, calc for C9H13DN3O5S+, 277.0711; [5′,5′-2H2]-14, calc for C9H12D2N3O5S+, 278.0774). (e) ESI-MS analysis of 14 (calc for C9H14N3O5S+, 276.0649) generated in the AbmM reaction in H218O (52% 18O). The analysis was conducted after the incubation mixture was treated with CIP.
Extended Data Fig. 4 |. Structural analysis of AbmM.
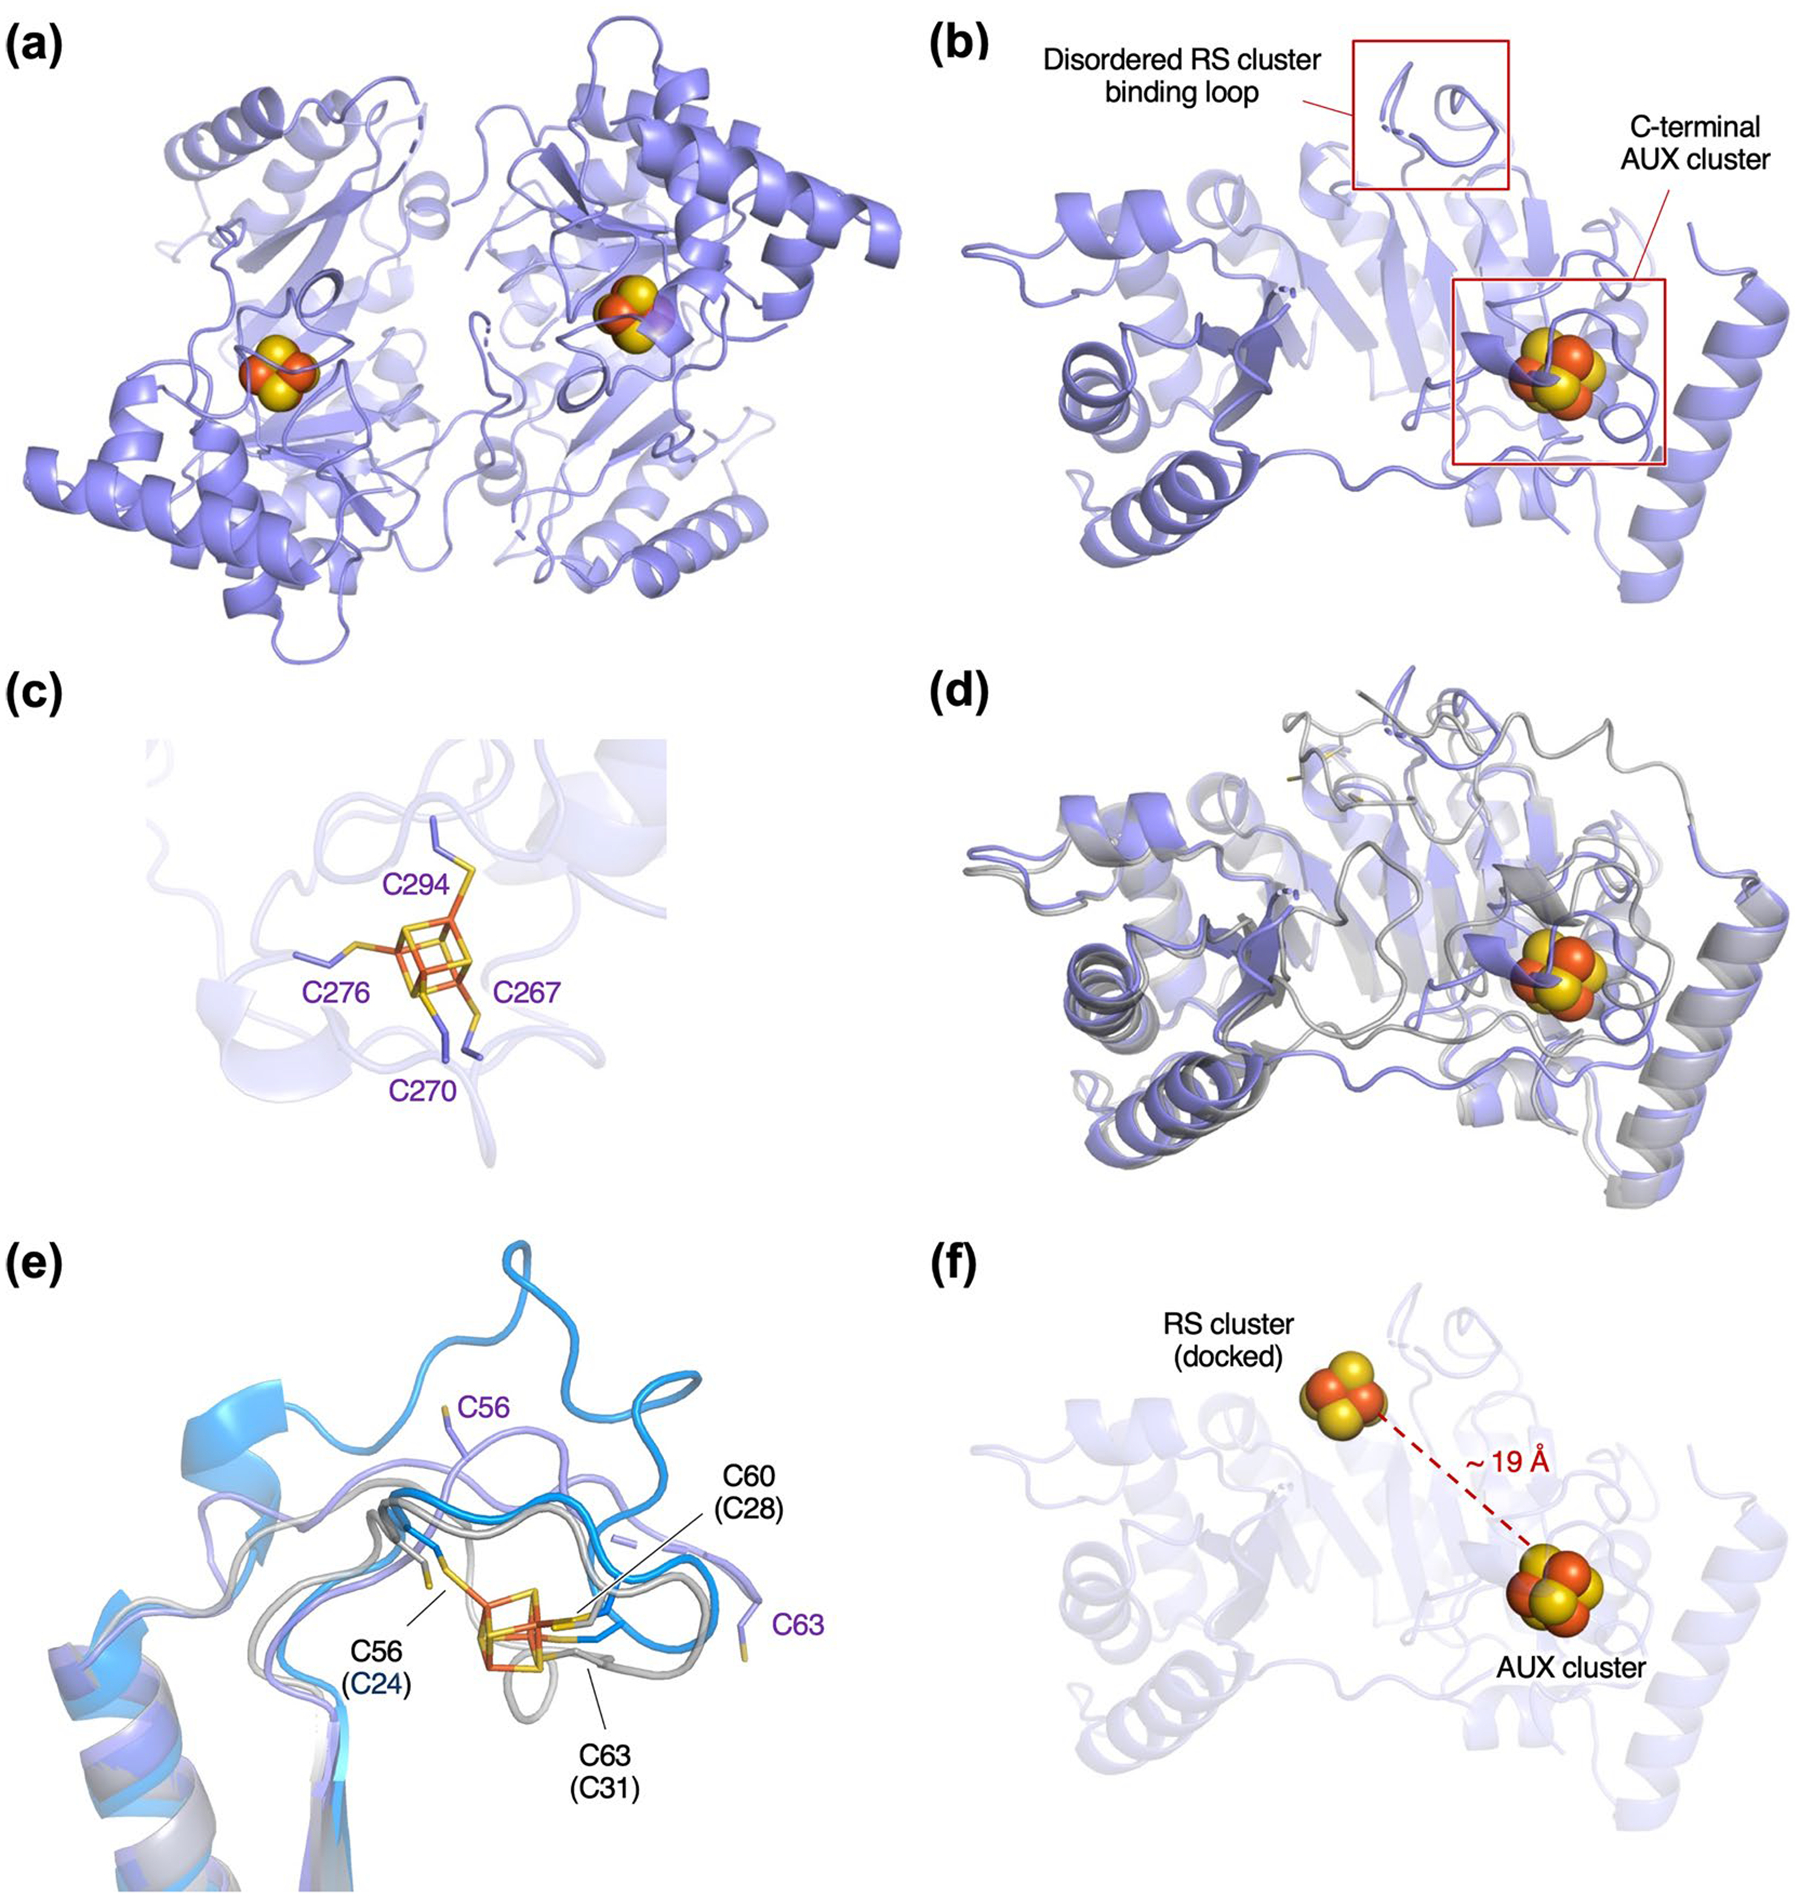
(a) Overall dimeric structure of AbmM shown in purple. (b) Monomer of AbmM. (c) C-terminal AUX cluster. (d) Overlay of the crystal and predicted structures of AbmM. The predicted structure is shown in grey. (e) The RS cluster binding loops of AbmM (crystal and predicted structures) and MoaA (shown in blue, PDB 2FB3). (f) Distance between the docked RS cluster and AUX cluster in AbmM.
Extended Data Fig. 5 |. 57Fe Mössbauer spectra of selected AbmM samples.
(a) 0.3 mM reconstituted ΔRS-cluster variant; (b) 0.2 mM reconstituted AbmM; (c) 0.3 mM DT-treated ΔRS-cluster variant; (d) 0.2 mM DT-treated AbmM; (e) 0.3 mM 56Fe-PT-AbmM-ΔRS cluster (red) and 0.3 mM 56Fe-PT-57Fe-PT-AbmM-ΔRS cluster (green); (f) 0.15 mM as-isolated 57Fe-AbmM (orange), 0.15 mM 57Fe-PT-AbmM (blue), and 0.15 mM 57Fe-PT-56Fe-AbmM (AUX-labelled) (dark green). The measurement conditions are indicated with external magnetic fields parallel to the γ-radiation. Bars show experimental data with statistical uncertainty of the data (the length of the vertical bars), red solid lines represent overall simulations. Simulation parameters are listed in Extended Data Table 2. The sample of 57Fe-PT-AbmM was prepared by overexpressing AbmM in media enriched with 57Fe and subsequently treated with PT before spectroscopic characterization. The sample of 56Fe-PT-57Fe-PT-AbmM-ΔRS cluster was prepared by overexpressing AbmM ΔRS-cluster variant in media containing natural abundance Fe, followed by treatment of the isolated protein with PT and then reconstitution with 57FeCl3. The resulting sample was further treated with PT. Other combinations such as 56Fe-PT-AbmM-ΔRS cluster were prepared in an analogous manner. The Fe content analysis yielded (Fe/protein monomer) 2.4 for as-isolated AbmM-ΔRS cluster, 2.4 for 56Fe-PT-AbmM-ΔRS cluster, 6.0 for 56Fe-PT-57Fe-AbmM-ΔRS cluster, and 2.7 for 56Fe-PT-57Fe-PT-AbmM-ΔRS cluster.
Extended Data Fig. 6 |. 34S labelling experiments.
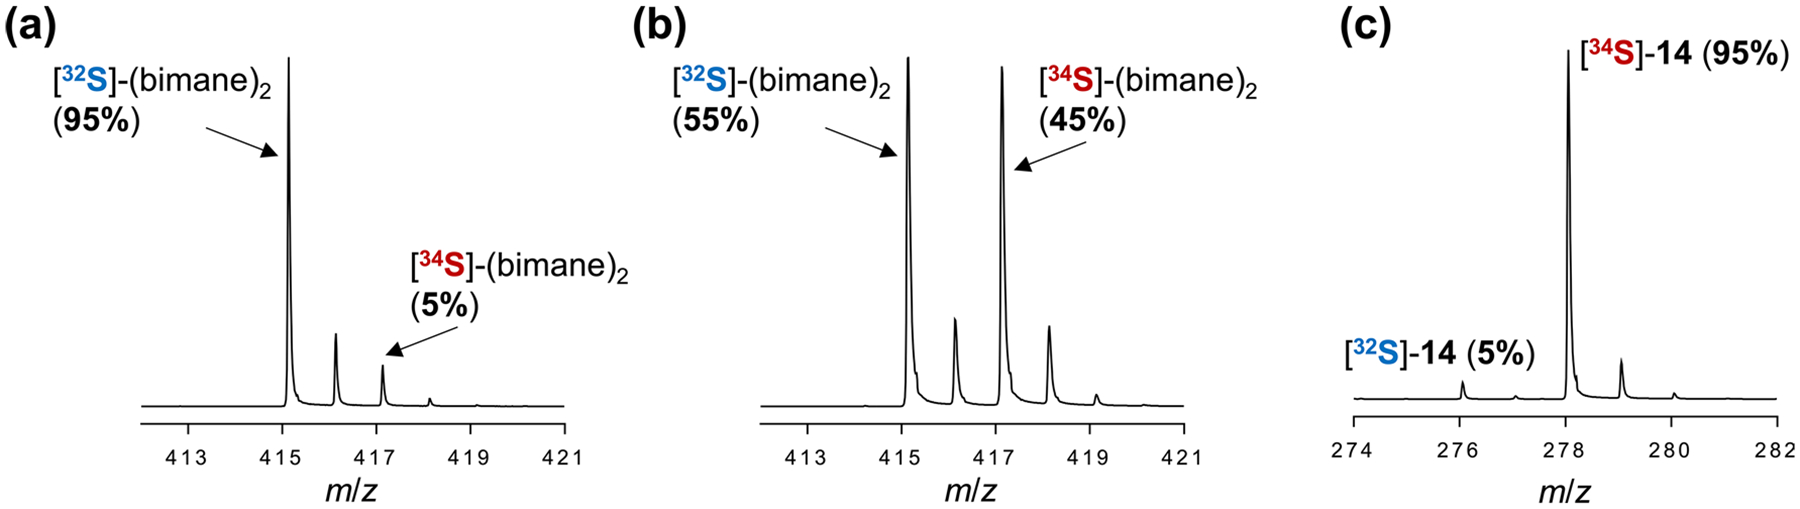
(a) ESI-MS spectrum of S-(bimane)2 obtained by reacting mBBr with the denatured 34S-reconstituted ΔRS-cluster AbmM variant after another round of PT treatment. (b) ESI-MS spectrum of S-(bimane)2 obtained by reacting mBBr with the denatured 34S-reconstituted wildtype AbmM (32S-PT-34S-AbmM, RS-labelled). (c) ESI-MS spectrum of 14 generated from the single-turnover reaction of 10 with 34S-reconstituted wildtype AbmM (32S-PT-34S-AbmM, RS-labelled). The 34S enrichment was determined after correcting for natural abundance of 34S.
Extended Data Table 1 |.
Data collection and refinement statistics
| AbmM | |
|---|---|
| Data collection a | |
| Space group | P 21 21 21 |
| Cell dimensions | |
| a, b, c (Å) | 70.79, 81.03, 131.84 |
| β (°) | 90.0, 90.0, 90.0 |
| Resolution (Å) | 48.24–2.5 (2.6–2.5)b |
| Rmerge (%) | 8.4 (84.6)b |
| //σ/ | 14.2 (2.1)b |
| Completeness (%) | 99.9 (99.9)b |
| CC1/2 | 0.998 (0.790) |
| Redundancy | 6.7 (7.0)b |
| Refinement | |
| Resolution (Å) | 48.2–2.5 |
| No. reflections | 26864 |
| Rwork/Rfree | 22.9/27.9 |
| No. atoms | |
| Protein | 4545 |
| Ligand/ion | 56 |
| Water | 65 |
| B-factors | |
| Protein | 54.0 |
| Ligand/ion | 62.7 |
| Water | 46.0 |
| R.m.s. deviations | |
| Bond lengths (Å) | 0.002 |
| Bond angles (°) | 0.479 |
| Data access | |
| PDB | 8WM2 |
Data were collected from one crystal.
Values in parentheses are for highest-resolution shell.
Extended Data Table 2 |.
Mössbauer parameters of 57Fe sites employed in the simulations
| Site | S | δ (mm/s) | |ΔEQ| (mm/s) | η | A/gnβn (T) | Note |
|---|---|---|---|---|---|---|
| I | 0 | 0.45(2)b | 1.16(2)b,c | - | - | [Fe4S4]2+ |
| II | ½ | 0.50a | +1.32a | 0.8a | [−23.1, −23.7, −20.2]a | [Fe4S4]+, the FeII/FeIII pair |
| III | ½ | 0.58a | +1.89a | 0.32a | [+19.3, +9.8, +6.3]a | [Fe4S4]+, the FeII/FeII pair |
| IV | 2 | 0.80(1)b | 3.30(2)b,c | - | - | Mononuclear FeII_A |
| V | 2 | 1.15(1)b | 2.19(2)b,c | - | - | Mononuclear FeII_B |
| VI | 2 | 1.20(1)b | 3.12(2)b,c | - | - | Mononuclear FeII_C |
The spectral simulation parameters for the [Fe4S4]+ cluster are adapted from ref. 51.
The values included in the parentheses indicate the uncertainty of the simulation parameters.
The signs of |ΔEQ| are not determined.
Extended Data Table 3 |.
Iron species contents in Mössbauer simulations
| Sample | [Fe4S4]2+ | [Fe4S4]+ | FeII_A | FeII_B | FeII_C |
|---|---|---|---|---|---|
| Reconstituted 57Fe-ΔRS-cluster variant | 90%a | - | - | - | - |
| Reconstituted 57Fe AbmM | 90%a | - | - | - | - |
| DT-treated 57Fe-ARS-cluster variants | 64%a | 36%b | - | - | - |
| DT-treated 57Fe-AbmM | 64%a | 30%b | ≤ 5% | - | - |
| Reacted 57Fe-AbmM | 65%a | 18%b | 17% | - | - |
| DT-treated 57Fe-PT-56Fe-AbmM (AUX-labelled) | 90% | - | - | - | - |
| Reacted 57Fe-PT-56Fe-AbmM (AUX-labelled) | 93% | - | - | - | - |
| DT-treated 56Fe-PT-57Fe-AbmM (RS-labelled) | 29% | 36%b | - | 12% | 11% |
| Reacted 56Fe-PT-57Fe-AbmM (RS-labelled) | 34% | - | - | 23% | 27% |
Two doublets within uncertainty or asymmetric doublet are employed.
Site II and III are fixed to 1:1 ratio. The best simulation requires the use of the slightly different parameters (δ = 0.75 mm/s, |ΔEQ | = 3.16 mm/s) from the listed parameters for FeII_A site in Extended Data Table 2.
Supplementary Material
The online version contains supplementary material available at https://doi.org/10.1038/s41929-025-01367-w.
Acknowledgements
This work was supported by grants from the National Institutes of Health (GM035906 and GM153203 to H-w.L.; GM125924 to Y.G.), the Welch Foundation (F-1511 to H.-w.L.), the Ministry of Education, Culture, Sports, Science and Technology, Japan (JSPS KAKENHI grant numbers JP20KK0173, JP21K18246 and JP23H00393 to I.A.; JP22H05123, JP23K13847, JP24H01309, 25H02006 and 25K02417 to R.U.), the New Energy and Industrial Technology Development Organization (NEDO; grant number JPNP20011 to I.A.), the Japan Agency for Medical Research and Development (AMED; grant number JP21ak0101164 to I.A.), and the Japan Science and Technology Agency (JST FOREST; grant number JPMJFR2305 to R.U.; JPMJFR226I to T.M.). This work was also supported by funds from the Astellas Foundation, Mochida Memorial Foundation, Naito Foundation, Japan Foundation for Applied Enzymology, Uehara Memorial Foundation and Suzuken Memorial Foundation to R.U. We thank S. Booker at The Pennsylvania State University, D. Dean at Virginia Polytechnic Institute and State University, and Y. Sun at Wuhan University for kindly providing the vectors pSUMO, pDB1282 and pYH7, respectively. We also thank M. Ruszczycky for his critical suggestions during preparation of the paper.
Footnotes
Competing interests
The authors declare no competing interests.
Extended data is available for this paper at https://doi.org/10.1038/s41929-025-01367-w.
Reporting summary
Further information on research design is available in the Nature Portfolio Reporting Summary linked to this article.
Data availability
The data that support the findings of this study are available within the article and its Supplementary Information. The coordinates and the structure factor amplitudes for AbmM have been deposited at the Protein Data Bank with accession code 8WM2. Source data are provided with this paper.
References
- 1.Gause GF Recent studies on albomycin, a new antibiotic. Br. Med. J 12, 1177–1179 (1955). [DOI] [PMC free article] [PubMed] [Google Scholar]
- 2.Stapley EO & Ormond RE Similarity of albomycin and grisein. Science 125, 587–589 (1957). [DOI] [PubMed] [Google Scholar]
- 3.Benz G Enzymatische Spaltung der Desferriform der Albomycine δ1, δ2. Liebigs Ann. Chem 1984, 1399–1407 (1984). [Google Scholar]
- 4.Benz G et al. Absolute Konfiguration der Desferriform der Albomycine. Liebigs Ann. Chem 1984, 1408–1423 (1984). [Google Scholar]
- 5.Lin Z et al. Total synthesis and antimicrobial evaluation of natural albomycins against clinical pathogens. Nat. Commun 9, 3445 (2018). [DOI] [PMC free article] [PubMed] [Google Scholar]
- 6.Stefanska AL, Fulston M, Houge-Frydrych CSV, Jones JJ & Warr SR A potent seryl tRNA synthetase inhibitor SB-217452 isolated from a Streptomyces species. J. Antibiot 53, 1346–1353 (2000). [DOI] [PubMed] [Google Scholar]
- 7.Clarke TE, Braun V, Winkelmann G, Tari LW & Vogel HJ X-ray crystallographic structures of the Escherichia coli periplasmic protein FhuD bound to hydroxamate-type siderophores and the antibiotic albomycin. J. Biol. Chem 277, 13966–13972 (2002). [DOI] [PubMed] [Google Scholar]
- 8.Paulsen H, Brieden M & Benz G Synthese des Sauersstoffanalogons der Desferriform von δ1-Albomycin. Liebigs Ann. Chem 1987, 565–575 (1987). [Google Scholar]
- 9.Zeng Y et al. Biosynthesis of albomycin δ2 provides a template for assembling siderophore and aminoacyl-tRNA synthetase inhibitor conjugates. ACS Chem. Biol 7, 1565–1575 (2012). [DOI] [PMC free article] [PubMed] [Google Scholar]
- 10.Ushimaru R & Liu HW Biosynthetic origin of the atypical stereochemistry in the thioheptose core of albomycin nucleoside antibiotics. J. Am. Chem. Soc 141, 2211–2214 (2019). [DOI] [PMC free article] [PubMed] [Google Scholar]
- 11.Ushimaru R, Chen Z, Zhao H, Fan P. h. & Liu H -w. Identification of the enzymes mediating the maturation of the seryl-tRNA synthetase inhibitor SB-217452 during the biosynthesis of albomycins. Angew. Chem. Int. Ed 59, 3558–3562 (2020). [DOI] [PMC free article] [PubMed] [Google Scholar]
- 12.Lanz ND & Booker SJ Auxiliary iron–sulfur cofactors in radical SAM enzymes. Biochim. Biophys. Acta 1853, 1316–1334 (2015). [DOI] [PubMed] [Google Scholar]
- 13.Grell TA, Goldman PJ & Drennan CL SAPSM and twitch domains in S-adenosylmethionine (SAM) radical enzymes. J. Biol. Chem 290, 3964–3971 (2015). [DOI] [PMC free article] [PubMed] [Google Scholar]
- 14.Oberg N, Precord TW, Mitchell DA & Gerlt JA RadicalSAM. org: a resource to interpret sequence-function space and discover new radical SAM enzyme chemistry. ACS Bio Med. Chem. Au 2, 22–35 (2022). [DOI] [PMC free article] [PubMed] [Google Scholar]
- 15.Dunbar KL, Scharf DH, Litomska A & Hertweck C Enzymatic carbon–sulfur bond formation in natural product biosynthesis. Chem. Rev 117, 5521–5577 (2017). [DOI] [PubMed] [Google Scholar]
- 16.Broderick JB, Duffus BR, Duschene KS & Shepard EM Radical S-adenosylmethionine enzymes. Chem. Rev 114, 4229–4317 (2014). [DOI] [PMC free article] [PubMed] [Google Scholar]
- 17.Sasaki E et al. Co-opting sulphur-carrier proteins from primary metabolic pathways for 2-thiosugar biosynthesis. Nature 510, 427–431 (2014). [DOI] [PMC free article] [PubMed] [Google Scholar]
- 18.Ruszczycky MW & Liu H.-w. Initiation, propagation and termination in the chemistry of radical SAM enzymes. Biochemistry 63, 3161–3183 (2024). [DOI] [PMC free article] [PubMed] [Google Scholar]
- 19.Roche B et al. Iron/sulfur proteins biogenesis in prokaryotes: formation, regulation and diversity. Biochim. Biophys. Acta 1827, 923–937 (2013). [DOI] [PubMed] [Google Scholar]
- 20.Boyd ES et al. Interplay between oxygen and Fe–S cluster biogenesis: insights from the Suf pathway. Biochemistry 53, 5834–5847 (2014). [DOI] [PMC free article] [PubMed] [Google Scholar]
- 21.Outten FW Recent advances in the Suf Fe–S cluster biogenesis pathway: beyond the Proteobacteria. Biochim. Biophys. Acta Mol. Cell. Res 1853, 1464–1469 (2015). [DOI] [PMC free article] [PubMed] [Google Scholar]
- 22.McCarthy EL & Booker SJ Destruction and reformation of an iron–sulfur cluster during catalysis by lipoyl synthase. Science 358, 373–377 (2017). [DOI] [PMC free article] [PubMed] [Google Scholar]
- 23.Guianvarc’h D, Florentin D, Tse Sum Bui B, Nunzi F & Marquet A Biotin synthase, a new member of the family of enzymes which uses S-adenosylmethionine as a source of deoxyadenosyl radical. Biochem. Biophys. Res. Commun 236, 402–406 (1997). [DOI] [PubMed] [Google Scholar]
- 24.Berkovitch F, Nicolet Y, Wan JT, Jarrett JT & Drennan CL Crystal structure of biotin synthase, an S-adenosylmethionine-dependent radical enzyme. Science 303, 76–79 (2004). [DOI] [PMC free article] [PubMed] [Google Scholar]
- 25.Ollagnier-de Choudens S & Fontecave M The lipoate synthase from Escherichia coli is an iron–sulfur protein. FEBS Lett 453, 25–28 (1999). [DOI] [PubMed] [Google Scholar]
- 26.Busby RW, Schelvis JPM, Yu DS, Babcock GT & Marletta MA Lipoic acid biosynthesis: LipA is an iron–sulfur protein. J. Am. Chem. Soc 121, 4706–4707 (1999). [Google Scholar]
- 27.McLaughlin MI et al. Crystallographic snapshots of sulfur insertion by lipoyl synthase. Proc. Natl Acad. Sci. USA 113, 9446–9450 (2016). [DOI] [PMC free article] [PubMed] [Google Scholar]
- 28.Esakova OA et al. Structural basis for tRNA methylthiolation by the radical SAM enzyme MiaB. Nature 597, 566–570 (2021). [DOI] [PMC free article] [PubMed] [Google Scholar]
- 29.Foroubar F et al. Two Fe–S clusters catalyze sulfur insertion by radical–SAM methylthiotransferases. Nat. Chem. Biol 9, 333–338 (2013). [DOI] [PMC free article] [PubMed] [Google Scholar]
- 30.Jumper J et al. Highly accurate protein structure prediction with AlphaFold. Nature 596, 583–589 (2021). [DOI] [PMC free article] [PubMed] [Google Scholar]
- 31.Hänzelmann P & Schindelin H Crystal structure of the S-adenosylmethionine-dependent enzyme MoaA and its implications for molybdenum cofactor deficiency in humans. Proc. Natl Acad. Sci. USA 101, 12870–12875 (2004). [DOI] [PMC free article] [PubMed] [Google Scholar]
- 32.Hänzelmann P & Schindelin H Binding of 5′-GTP to the C-terminal FeS cluster of the radical S-adenosylmethionine enzyme MoaA provides insights into its mechanism. Proc. Natl Acad. Sci. USA 103, 6829–6834 (2006). [DOI] [PMC free article] [PubMed] [Google Scholar]
- 33.Namkoong G & Suess DLM Cluster-selective 57Fe labeling of a Twitch-domain-containing radical SAM enzyme. Chem. Sci 14, 7492–7499 (2023). [DOI] [PMC free article] [PubMed] [Google Scholar]
- 34.Maiocco SJ, Grove TL, Booker SJ & Elliott SJ Electrochemical resolution of the [4Fe–4S] centers of the AdoMet radical enzyme BtrN: evidence of proton coupling and an unusual, low-potential auxiliary cluster. J. Am. Chem. Soc 137, 8664–8667 (2015). [DOI] [PubMed] [Google Scholar]
- 35.Zhao Q, Wang M, Xu D, Zhang Q & Liu W Metabolic coupling of two small-molecule thiols programs the biosynthesis of lincomycin A. Nature 518, 115–119 (2015). [DOI] [PubMed] [Google Scholar]
- 36.Chen X & Li B How nature incorporates sulfur and selenium into bioactive natural products. Curr. Opin. Chem. Biol 76, 102377 (2023). [DOI] [PMC free article] [PubMed] [Google Scholar]
- 37.Steele AD, Kiefer AF & Shen B The many facets of sulfur incorporation in natural product biosynthesis. Curr. Opin. Chem. Biol 76, 102366 (2023). [DOI] [PMC free article] [PubMed] [Google Scholar]
- 38.Sambrook J & Russell DW Molecular Cloning: A Laboratory Manual 3rd edn (Cold Spring Harbor Laboratory Press, 2001) [Google Scholar]
- 39.Sun YH et al. Organization of the biosynthetic gene cluster in Streptomyces sp. DSM 4137 for the novel neuroprotectant polyketide meridamycin. Microbiology 152, 3507–3515 (2006). [DOI] [PubMed] [Google Scholar]
- 40.MacNeil DJ et al. Analysis of Streptomyces avermitilis genes required for avermectin biosynthesis utilizing a novel integration vector. Gene 111, 61–68 (1992). [DOI] [PubMed] [Google Scholar]
- 41.Wilkinson CJ et al. Increasing the efficiency of heterologous promoters in actinomycetes. J. Mol. Microbiol. Biotechnol 4, 417–426 (2002). [PubMed] [Google Scholar]
- 42.Willcott MR MestRe Nova. J. Am. Chem. Soc 131, 13180–13180 (2009). [Google Scholar]
- 43.Zhang Y, Werling U & Edelmann W SLiCE: a novel bacterial cell extract-based DNA cloning method. Nucleic Acids Res 40, e55 (2012). [DOI] [PMC free article] [PubMed] [Google Scholar]
- 44.Guerrero F, Ciragan A & Iwai H Tandem SUMO fusion vectors for improving soluble protein expression and purification. Protein Expr. Purif 116, 42–49 (2015). [DOI] [PubMed] [Google Scholar]
- 45.Marblestone JG et al. Comparison of SUMO fusion technology with traditional gene fusion systems: enhanced expression and solubility with SUMO. Protein Sci 15, 182–189 (2006). [DOI] [PMC free article] [PubMed] [Google Scholar]
- 46.Fish WW Rapid colorimetric micromethod for the quantitation of complexed iron in biological samples. Methods Enzymol 158, 357–364 (1988). [DOI] [PubMed] [Google Scholar]
- 47.Beinert H Semi-micro methods for analysis of labile sulfide and of labile sulfide plus sulfane sulfur in unusually stable iron–sulfur proteins. Anal. Biochem 131, 373–378 (1983). [DOI] [PubMed] [Google Scholar]
- 48.Zheng L, Cash VL, Flint DH & Dean DR Assembly of iron–sulfur clusters: identification of an iscSUA-hscBA-fdx gene cluster from Azotobacter vinelandii. J. Biol. Chem 273, 13264–13272 (1998). [DOI] [PubMed] [Google Scholar]
- 49.Petasis DT & Hendrich MP Quantitative interpretation of multifrequency multimode EPR spectra of metal containing proteins, enzymes, and biomimetic complexes. Methods Enzymol 563, 171–208 (2015). [DOI] [PMC free article] [PubMed] [Google Scholar]
- 50.Münck E in Physical Methods in Bioinorganic Chemistry: Spectroscopy and Magnetism (ed. Que L Jr) 287–319 (University Science Books, 2000). [Google Scholar]
- 51.Middleton P, Dickson DPE, Johnson CE & Rush JD Interpretation of the Mössbauer spectra of the four-iron ferredoxin from Bacillus stearothermophilus. Eur. J. Biochem 88, 135–141 (1978). [DOI] [PubMed] [Google Scholar]
Associated Data
This section collects any data citations, data availability statements, or supplementary materials included in this article.
Supplementary Materials
Data Availability Statement
The data that support the findings of this study are available within the article and its Supplementary Information. The coordinates and the structure factor amplitudes for AbmM have been deposited at the Protein Data Bank with accession code 8WM2. Source data are provided with this paper.