

Abstract
Background
The efficacy of radiographs in studying bone mineral density (BMD) through fractal dimension (FD) analysis represents a conservative method compared to other traditional examinations. Periapical and panoramic radiographs are routine imaging tests in the radiographic evaluation of pediatric patients with Osteogenesis Imperfecta (OI). Anti-resorptive therapies with bisphosphonates constitute the gold standard in the treatment of these patients, and assessing their effectiveness on bone mineral density is essential to determine the necessity of administering any of these drugs or their combinations. Therefore, this study aims to analyze the differences in fractal dimension measured on orthopantomographs of a sample of patients with OI compared to a matched control group.
Methods
Panoramic radiographs from 66 patients with OI were analyzed, identifying six regions of interest (ROIs), in mandibular cortical and trabecular bone, using the ImageJ software (version 1.54d). Differences related to the impact of Osteogenesis Imperfecta and the administered anti-resorptive treatment were examined. Statistical analysis of the data was performed with SPSS Statistics 25.0 for Windows.
Results
The values obtained for ROI 3 showed statistically significant differences between the groups (p 0.002), while ROI 5 yielded values close to statistical significance (p 0.090). When analyzing the influence of antiresorptive therapy in these patients, a strong indication of a relationship was found between the values obtained for ROI 1 and 4 and the administration of zoledronic acid.
Conclusions
The studied OI patients showed lower bone mineral density compared to healthy controls. The type of OI influenced the fractal dimension values obtained, with those suffering from severe OI being more affected. Although no statistically significant differences were found, the statistical effect size related to zoledronic acid administration suggested a possible direct relationship with the bone mineral density of these patients.
Keywords: Osteogenesis imperfecta, Fractal dimension, Pediatric patient, Bisphosphonates, Orthopantomography
Introduction
The evaluation of trabecular bone structure has multiple and significant applications in various fields of medicine. Finding a quantitative, precise, and reliable method to measure trabecular bone structure has been the focus of extensive research.
The literature describes fractal analysis as a method to evaluate the trabecular pattern using conventional radiographs [1–4]. This method has gained popularity in recent years due to its ability to provide objective data [2, 5, 6], further supported by digital dental systems [7].
Since the 1960 s, the efficacy of radiographs in diagnosing bone mineral density has been evaluated both systemically and in the oral region [3–5, 7–12]. Advances in radiographic digitalization and modern software have significantly enhanced this field. Several studies have used different software programs to analyze the FD of radiographs obtained from patients with altered BMD, such as those with osteoporosis or OI [3, 6, 8, 10, 13–20].
The oral and dental alterations present in pediatric patients with OI indicate the need for a standardized orthopantomography, which becomes particularly relevant at the onset of the mixed dentition stage. This imaging technique aims to assess eruption patterns, growth, and specific developmental characteristics in these patients, as well as to enable early detection of such alterations. This radiographic record can be highly useful for analyzing the bone implications of antiresorptive therapy received by these patients, which is intended to improve BMD. Several studies have been conducted over the years to measure bone changes in adult patients, most of which have focused on postmenopausal women due to their increased osteoporotic risk with aging [3, 4, 8, 14, 16–18, 21–24]. All these studies examined BMD and reported statistically significant increases following intravenous and oral bisphosphonate therapy in adults. However, these results cannot be extrapolated to pediatric patients, as childhood and adolescence are characterized by high bone turnover and open epiphyses. Furthermore, additional studies focusing on the maxillary bones in pediatric patients with Osteogenesis Imperfecta are required. For these reasons, the present study analyzes the fractal dimension in panoramic radiographs of growing patients with OI, using ImageJ software and comparing the results with a control group of healthy patients matched for age and sex.
Materials and methods
For the present study, a cross-sectional, retrospective, and observational study was conducted using orthopantomographies of children with OI, analyzing different regions of interest (ROI). The study received approval from the Research Ethics Committee for Medicines of the San Carlos Clinic Hospital (C.I. 21/316-O_M_OD).
Study and control samples
Inclusion criteria included patients with OI, treated or not with bisphosphonates, of European descent and Spanish origin, aged between 5 and 25 years, having a previous high-quality orthopantomography, and having obtained signed informed consent from the patient or their parents/guardians. Subjects were excluded if they had disorders directly affecting bone mineral density, poor quality panoramic radiographic records or lacked informed consent from patients/parents/guardians.
Following these criteria, the study sample consisted of 66 subjects (27 boys and 39 girls), aged 5 to 23 years, who attended the Master’s Program in Pediatric Dentistry and the Specialized Program in “Integrated Dental Care for Children with Special Needs” at the Faculty of Dentistry, Complutense University of Madrid. These subjects were compared with a control sample of healthy children matched by age and sex, who also had high-quality panoramic radiographs and provided signed consent for participation. The formula for calculating a proportion of a finite population was used to calculate the sample size. In addition, a confidence level of 95%, an alpha error of 0.05, beta error of 0.2 and a bilateral hypothesis were assumed, resulting in a minimum of 29 subjects required.
Research systematics
In each radiograph provided by the patients, five regions of interest (ROIs) were selected (Fig. 1):
Fig. 1.
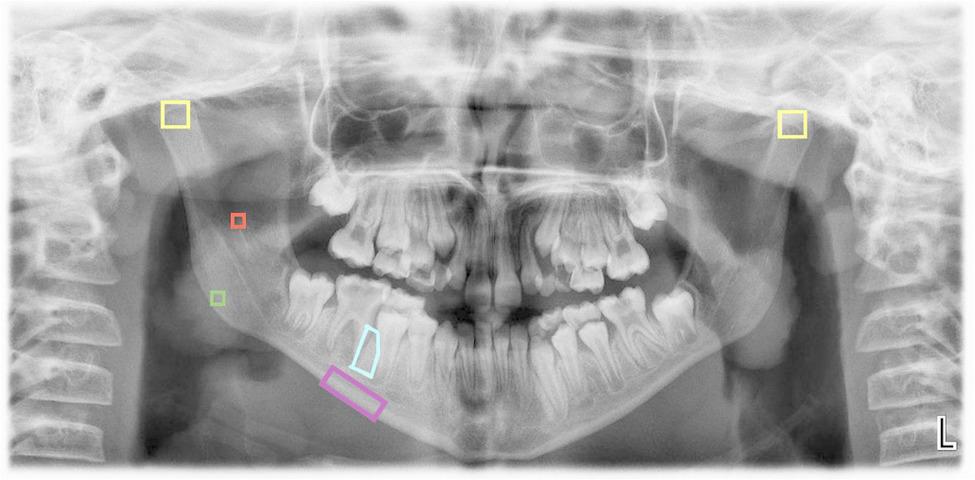
ROIs selected using the ImageJ application
ROI 1: A 25x25-pixel square in the trabecular bone at the geometric center of the mandibular ramus.
ROI 2: A 25x25-pixel square in the trabecular bone at the geometric center of the mandibular angle.s
ROI 3: A 60x60-pixel square in the trabecular bone at the cortical boundaries of each condyle (right and left), with the upper vertices positioned as high as possible.
ROI 4: A rectangle in the basal cortical bone, starting distal to the mental foramen and extending to the distal edge of the mesial root of the first permanent molar, encompassing only the mandibular cortex. This measurement is performed using the polygon tool in the ImageJ software.
ROI 5: A polygonal region within the trabecular bone at the level of the interradicular septum, between the mesial root of the first permanent molar and the distal root of the second permanent premolar; or, alternatively, the distal root of the second primary molar, depending on the patient’s developmental stage. The ROI extends from the furcation of the first permanent molar to its apex. In cases where the apex remains open, the distal limit is defined by the end of the dental follicle, whether corresponding to the first permanent molar or the developing germ of the second premolar. In younger patients in whom the first molar has not yet erupted, the ROI is proportionally smaller, although its anatomical boundaries are preserved. This measurement was performed using the polygon selection tool in ImageJ software. Notably, this region of interest was specifically designed for the present study and has not been previously described in the literature.
All areas were analyzed using the software ImageJ version 1.54d, designed for processing and analyzing 8, 16, and 32-bit images, capable of recognizing different image formats. (Fig. 2)
Fig. 2.

Stages of fractal analysis: (A) Selection and cutout of the region of interest (ROI); (B) Gaussian filter application; (C) subtraction from the original image; (D) addition of the gray value of 128; (E) binarization; (F) erosion; (G) dilation; (H) inversion; (I) skeletonization; and (J) skeletonization overlapping the initial ROI. (L) graphic representation of the D value corresponding to the fractal dimension
All measurements were conducted by two examiners under a double-blind protocol. The first examiner measured the entire sample and performed a second measurement on 20% of the sample after a 30-day interval. The second examiner independently evaluated 20% of the sample. Intra-examiner reliability and inter-examiner agreement were assessed.
Statistical analysis
The statistical analysis of the data was performed using SPSS Statistics 25.0 for Windows. The Student’s t-test was used for normally distributed variables, while a non-parametric alternative (Wilcoxon test) was applied for variables that did not follow a normal statistical distribution. For categorical variables in paired groups, the McNemar test was employed. Inter-observer reliability was calculated using correlation coefficients, scatter plots, and contrast tests for difference = 0.
Results
Following the described methodology, six regions of interest were analyzed in the 132 patients included in the sample (66 with OI and 66 controls matched by age and sex). The mean age of the sample was 9.88 years (median: 9), with a slight predominance of females (57.6%) over males, although this difference was not statistically significant. Among the 66 patients in the study sample, 30 had type I OI (45.5%), 14 had type III OI (21.2%), 15 had type IV OI (22.7%), 6 had type V OI (9.1%), and 1 had type II OI (1.5%).
Intra- and inter-examiner concordance was determined for each of the regions of interest, yielding indices between 0.8 and 0.95 (p < 0.001), confirming the high reliability of the measurements performed.
The study sample showed no significant differences from either age or sex on the analyzed ROIs. When analyzing sex-related differences, only ROI 1 showed a slight variation (p < 0.1), although with a very small statistical effect (R²: 1.7%). For the study of age influence, the sample was dichotomized based on the median age, classifying patients into two groups: ≤9 years and ≥ 10 years. Similarly, when analyzing differences with respect to age, ROI 5 presented a small effect, with an R² of 2.5%.
Influence of OI on bone mineral density
When analyzing the differences between patients with OI and their healthy matched controls, statistical differences were found in the case of ROI 3, both right and left. For ROI 2, 4, and 5, the differences were close to statistical significance, although in all three cases the effect size was moderate (R²: 3.5% for ROI 2; 4.5% for ROI 4; and 4.3% for ROI 5). In the case of ROI 1, no differences were found between the two groups (Table 1).
Table 1.
Comparative analysis of the regions of interest between both groups (N=132)
| Variable | Mean (±SD) | Contrast test (Student or Wilcoxon) | Effect sizeR2 | ||
|---|---|---|---|---|---|
| OI | CONTROL | Statistics | P-value | ||
| ROI 1 | 1.1339 (±0.3007) | 1.1306 (±0.2149) | ZW=0.55 | .581 | .013 |
| ROI 2 | 1.1512 (±0.2710) | 1.1639 (±0.2027) | ZW=1.04 | .299 | .035 |
| ROI 3 right | 1.2536 (±0.1736) | 1.3457 (±0.1323) | t=3.21 | .002 | .137 |
| ROI 3 left | 1.2557 (±0.1548) | 1.3474 (±0.1425) | t=3.24 | .002 | .139 |
| ROI 4 | 1.1368 (±0.1353) | 1.0984 (±0.1307) | t=1.67 | .101 | .041 |
| ROI 5 | 1.2466 (±0.1059) | 1.2773 (±0.1064) | t=1.72 | .090 | .043 |
Based on these results, the study sample showed lower bone mineral density at the condylar level compared to the matched control sample, reaching statistical significance. Bone mineral density in the cortical bone of the OI group (ROI 4) also showed lower values when compared to their healthy matches, with clinical significance observed, although the values were close to statistical significance. Similar trends were observed in the case of ROI 5 for trabecular bone.
The present results demonstrate a clear decrease in bone mineral density in patients with OI. However, most patients included in the study sample were undergoing antiresorptive therapy, which may introduce bias in the conclusions obtained. To address this, the measurements from the six regions of interest were analyzed in patients without any antiresorptive therapy and compared to their matched controls.
In this subset, no significant differences were observed for any of the measured values. However, it is important to note the small sample size (N = 18). When analyzing the results shown in Table 2, values close to significance were observed for ROI 5, with a very large effect size (p < 0.1; R²: 16.5%), suggesting a strong indication of a relationship between these factors. A similar observation was made for ROI 3, particularly on the left side, although the statistical evidence for this relationship was weaker compared to ROI 5.
Table 2.
Comparative analysis of bone mineral density in patients with OI without antiresorptive therapy (N = 18)
| Variable | Mean (±SD) | Contrast test (Student or Wilcoxon) |
Effect size
R 2 |
||
|---|---|---|---|---|---|
| OI | CONTROL | Statistics | P-value | ||
| ROI 1 | 1.1969 (±0.3159) | 1.1172 (±0.2615) | ZW=0.11 | .932 | .001 |
| ROI 2 | 1.2031 (±0.3171) | 1.1734 (±0.2423) | ZW=0.63 | .551 | .042 |
| ROI 3 right | 1.2629 (±0.1551) | 1.3350 (±0.1407) | ZW=1.33 | .196 | .088 |
| ROI 3 left | 1.2879 (±0.1171) | 1.3477 (±0.1370) | ZW=1.63 | .106 | .091 |
| ROI 4 | 1.1370 (±0.1633) | 1.1340 (±0.1319) | ZW=0.02 | .991 | .000 |
| ROI 5 | 1.2333 (±0.0946) | 1.2988 (±0.1114) | ZW=1.68 | .099 | .165 |
The type of diagnosed OI was also analyzed to determine whether the observed fractal dimension exhibited differences based on disease severity. For this purpose, patients in the sample were classified into mild OI (OI type I; n = 30; 45.5%), moderate OI (OI types IV and V; n = 21; 31.8%), and severe OI (OI types III and II; n = 15; 22.7%).
The results of the contrast tests for the ROI variables (Table 3) indicate that none of these variables showed statistically significant differences (p > 0.05), nor did they approach significance (p > 0.20). Only the left ROI 3 and ROI 5 exhibited moderate effect sizes (4.3% and 4.9%), which may suggest a potential relationship that failed to reach significance due to insufficient sample size. Our data suggest that if such a relationship exists, it could be attributed to the fact that cases with severe OI (or greater severity) tend to have a lower mean in left ROI 3 and a higher mean in ROI 5, while cases with moderate OI exhibit the opposite pattern.
Table 3.
Influence of the type of OI on the fractal dimension in the study sample (n=66)
| Variable | Mean (±SD) | Contrast test (ANOVA or Kruskal-W) | Size effect R2 | |||
|---|---|---|---|---|---|---|
| MILD OI (n=30) | MODERATE OI (n=21) | SEVERE OI (n=15) | Statistics | P-value | ||
| ROI 1 | 1.1242 (0.3075) | 1.1282 (0.2877) | 1.1588 (0.2018) | ZKW=0.37 | .831 | .009 |
| ROI 2 | 1.1770 (0.3657) | 1.1436 (0.1617) | 1.1489 (0.3659) | ZKW=0.12 | .941 | .011 |
| ROI 3 right. | 1.2426 (±0.1884) | 1.2795 (±0.1297) | 1.2395 (±0.2002) | F=0.34 | .715 | .011 |
| ROI 3 left. | 1.2518 (±0.1278) | 1.2952 (±0.1441) | 1.2082 (±0.2074) | F=1.42 | .250 | .043 |
| ROI 4 | 1.1550 (±0.1414) | 1.1180 (±0.1476) | 1.1268 (±0.1051) | F=0.51 | .604 | .016 |
| ROI 5 | 1.2531 (±0.1027) | 1.2155 (±0.1073) | 1.2772 (±0.1061) | F=1.61 | .207 | .049 |
Effect of antiresorptive therapy on BMD in OI patients
Considering that the OI patients included in the sample underwent various antiresorptive treatment regimens, an analysis was conducted to evaluate the effect of these therapies on BMD. For this purpose, the study patients were classified according to the bisphosphonate administered, as shown in Fig. 3. Approximately one-quarter of the patients did not receive any therapy, while nearly 50% underwent a combined administration of pamidronate and zoledronic acid. Of the remaining sample, 10 patients (15.2%) received pamidronate exclusively, and 11 patients (16.7%) were treated with zoledronic acid alone.
Fig. 3.

Antiresorptive therapy administration in the study sample
Table 4 presents the descriptive statistics of the cumulative doses (mg/kg/cycle) of bisphosphonates administered. Pamidronate doses followed a normal distribution (p > 0.05), with a range of 9–120 mg/kg/cycle (mean ± SD: 47.43 ± 28.43). In contrast, zoledronic acid doses did not follow a normal distribution (p < 0.01), with a range of 0.05–0.7 mg/kg/cycle (median: 0.2; interquartile range: 0.2).
Table 4.
Descriptive statistics of medication doses (OI cases– N = 66)
| Variable | N | Central tendency | Variability | |||
|---|---|---|---|---|---|---|
| Mean (95% CI) | Median | Min./Máx. | SD | IQR | ||
| Pamidronate (mg/kg/cycle) | 37 | 47.43 (37.95 - 56.91) | 45.00 | 9/120 | 28.43 | 49.5 |
| Zoledronic acid (mg/kg/cycle) | 38 | 0.27 (0.21 - 0.32) | 0.20 | 0.05/0.70 | 0.17 | 0.20 |
There were no statistical significant differences obtained for any of the ROIs analyzed. However, the values obtained in the case of ROI 4 were close to significance (p < 0.1) with a high effect size (R2: 11.6%), showing a strong indication of a relationship between the type of therapy administered and BMD in the cortical bone of these patients (Table 5).
Table 5.
Fractal dimension variables, according to pharmacological treatment (N=48)
| Variable | Mean (±SD) | Contrast test (ANOVA o Kruskal-W) | Effect sizeR2 | |||
|---|---|---|---|---|---|---|
| Both drugs (n=27) | Pamidronate (n=10) | Zoledronic acid (n=11) | ||||
| Statistics | P-value | |||||
| ROI 1 | 1.1208 (±0.2737) | 1.1339 (±0.1884) | 1.0661 (±0.3191) | ZKW=0.45 | .797 | .003 |
| ROI 2 | 1.1078 (±0.1943) | 1.1682 (±0.2812) | 1.0883 (±0.5042) | ZKW=0.53 | .769 | .028 |
| ROI 3 right. | 1.2364 (±0.1746) | 1.3262 (±0.2134) | 1.2149 (±0.1637) | F=0.34 | .319 | .050 |
| ROI 3 left. | 1.2460 (±0.1799) | 1.2801 (±0.1468) | 1.2046 (±0.1531) | F=1.42 | .589 | .023 |
| ROI 4 | 1.1399 (±0.1323) | 1.1995 (±0.0701) | 1.0722 (±0.1231) | F=0.51 | .062 | .116 |
| ROI 5 | 1.2548 (±0.1145) | 1.2779 (±0.0909) | 1.2197 (±0.1179) | F=1.61 | .480 | .032 |
When analyzing the relationship between each of the ROIs and bisphosphonate doses using Pearson’s and Spearman’s correlation coefficients, no association was observed between pamidronate doses and the ROIs. However, in the case of zoledronic acid, the coefficients were somewhat more statistically relevant, particularly for ROI 1 (Table 6), indicating a relationship with a linear trend and inverse direction (Fig. 4).
Table 6.
Association of Fractal Dimension variables with the doses of bisphosphonates administered
| Padrominate(N=37) | Zoledronic acid(N=38) | |||
|---|---|---|---|---|
| Coef. | P-value | Coef. | P-value | |
| ROI 1 | -.01 | .478 | -.24 | .075 |
| ROI 2 | -.05 | .386 | .15 | .172 |
| ROI 3 right | -.02 | .459 | .16 | .173 |
| ROI 3 left | .03 | .437 | .18 | .144 |
| ROI 4 | .02 | .454 | -.16 | .177 |
| ROI 5 | .03 | .435 | -.10 | .269 |
Fig. 4.

Association between FD and Zoledronic Acid Dose (N = 38)
Discussion
Knowledge of changes in bone mineral density is one of the objectives in the evaluation of the efficacy of antiresorptive therapies administered in patients with OI. Based on this premise, it becomes increasingly relevant to incorporate minimally invasive diagnostic methods, especially when dealing with growing pediatric patients. Traditional dual X-ray densitometry tests [15, 21, 25, 26] have taken a back seat with the implementation of orthopantomography as a diagnostic method [1, 13, 22, 27, 28]. Panoramic radiography serves as a routine tooth development diagnostic method in the dental practice for growing patients, and combined with periapical radiography [7, 10, 29, 30] they are less invasive diagnostic methods that provide valuable information in the evaluation of bone mineral density.
For the present research, a cross-sectional study design was chosen. Longitudinal studies would offer greater objectivity when analyzing radiographic changes in the same patient and relating them to the doses of bisphosphonates administered. However, this type of study is subject to participant loss over time, and since we are studying patients with a low-prevalence disease, it would compromise the objectivity of the results. Cross-sectional studies allow for the examination of a broader and more representative sample, providing more objective and generalizable results.
The fractal dimension has been used as a tool for analyzing BMD by multiple authors in the literature (Law et al., 1996 [10]; White et al., 1999 [31], 2002 [4]; Tosoni et al., 2006 [22]; Koh et al., 2012 [23]; Oliveira et al., 2013 [8]; Sindeaux et al., 2014 [32]; Camargo et al., 2015 [21]), recognizing the importance of pairing study and control samples by age and gender. However, the number of studies on BMD in growing patients is significantly reduced, compounded by the fact that OI has a low incidence. Rauch et al. [33, 34] analyzed the effectiveness of antiresorptive treatments in pediatric patients with OI, being among the first publications in the literature in this field, although their methodology relied on serological markers.
Apolinario et al. [11] in 2016, employed this methodology to evaluate differences in bone mineral density in 197 pediatric patients with OI. They concluded that these children exhibited alterations in cortical bone following the initiation of Pamidronate treatment, finding higher fractal dimension values in the cortical bone of children with OI. These authors correlated low bone mineral density to OI through the analysis of three regions of interest, with ROI 1 and ROI 2 being the same regions described in the present investigation. Additionally, these authors analyzed a third region not included in this study. Later, Pantoja et al. [12] in 2021 analyzed bone changes occurring in the condylar region of these patients, comparable to ROI 3 examined in the current research. Demiralp et al. [13] in 2019 described ROI 4, which is used in the present study for analyzing BMD in patients undergoing antiresorptive treatment; however, they did not study pediatric patients with OI. ROI 5, as described in this study, was specifically designed for this investigation, focusing on changes in trabecular BMD at the interradicular level, proposing the utility of periapical radiographs for diagnosis in this field. This is not a standardized measurement, as the analysis was conducted on a sample with a wide age range (5–25 years), during which continuous bone changes occur in this region. However, the literature reports numerous studies that analyze fractal dimension using periapical radiographs [6, 7, 35], since they constitute one of the most routine diagnostic tests in the dental office, whether for the diagnosis of pathologies or for regular check-ups.
In line with existing literature [11, 12], age and gender did not show significant differences in the BMD of these patients. However, in the present investigation, a slight difference was observed in ROI 5, where patients older than 10 years exhibited higher bone mineral density, which can also be attributed to development during growth, although it did not reach statistical significance.
According to the observed results, patients with OI exhibited lower bone mineral density at the condylar level, showing statistically significant differences (ROI 3, right and left). Cortical and trabecular bone at ROI 4 and 5 also demonstrated lower bone mineral density in the OI group; however, in this case, statistical significance was not reached. According to Pantoja et al. [12], the patients in their study sample exhibited lower bone mineral density compared to their matched controls, similar to the findings of the present study, where statistically significant differences were also observed at the condylar level. To avoid potential bias from the influence of antiresorptive therapy in these patients, and given that a percentage of the study sample had not undergone such treatments, an analysis was conducted to examine differences between these untreated patients and their healthy matched controls. Through this analysis, the authors attempt to obtain a more objective understanding of the relationship between BMD and OI.
Although this second analysis did not reveal significant differences at the condylar bone level, as observed in the initial case, it is important to consider the small sample size and note that the observed effect size was moderate, suggesting a potential relationship. In the case of trabecular bone at the interradicular level (ROI 5), the data obtained were very close to statistical significance, with a high effect size, indicating a strong suggestion of a relationship.
Pantoja et al. [12] assert that the type of OI and antiresorptive therapy are influential factors in the analyzed fractal dimension. According to the results of this research, zoledronic acid produces a greater increase in bone mineral density compared to pamidronate, with the increase being more pronounced the earlier the therapy is initiated. Additionally, the type of OI also shows differences in the analyzed fractal dimension values, with types III and IV presenting lower bone mineral density, while type I exhibits higher bone mineral density. This contrasts with the findings of Pantoja et al. [12], who reported lower values in patients with type I OI.
None of the studies by Apolinario et al. [11, 15] specifically analyzed the relationship between disease severity and the type of OI in each patient. According to the results obtained in the present investigation, bone mineral density at the level of the mandibular condyles (ROI 3) was lower in cases of severe OI, where osteopenia levels were higher. However, at the level of the trabecular bone between the second premolar and the first permanent molar (ROI 5), BMD in cases of severe OI was higher than in cases of mild or moderate OI.
The different antiresorptive therapies administered to these patients also revealed differences in the fractal dimension results observed. The study sample includes various therapies with different bisphosphonates as well as combinations of them, so the analysis was conducted considering the cumulative doses of each over time. The antiresorptive administration regimen in these patients is determined according to the Rheumatology Protocol of the Spanish Association of Pediatrics (Table 7) [36].
Table 7.
Administration protocol of bisphosphonates in patients with OI
| Antiresorptive | Route of administration | Doses |
|---|---|---|
| Pamidronat | Intravenous |
· <2 years: 0.37-0.75 mg/kg for 2-3 days every 2 months · 2-3 years: 0.56-1.125 mg/kg for 2-3 days every 3 months · >3 years: 0.75-1.5 mg/kg for 2-3 days every 4 months · 1 st infusion at half dose |
| Zoledronic acid | Intravenous |
· <2 years: 0.025 mg/kg every 3 months · >2 years: 0.05 mg/kg every 6 months · 1 st infusion at half dose |
| Alendronate | Oral |
· <40 kg: 5 mg/day or 35 mg/week · >40 kg: 10 mg/day or 70 mg/week |
| Risedronate | Oral | · 2,5-5 mg/day or 15-35 mg/week |
None of the analyzed ROIs showed a relationship with pamidronate administration; however, there were indications of a relationship with zoledronic acid, though in this case, the effect size was small, requiring a new study with a larger sample size.
In light of the results, a direct relationship is observed between the administration of zoledronic acid and the FD values in ROI 2 and 3, concluding in a greater bone mineral density in the condylar trabecular bone and the mandibular angle, which are centers of growth in these patients, coinciding with the results shown by Pantoja et al. in 2021 [12], and being supported by the influence of mastication during the development of growing patients at early ages; while at older ages, growth is concentrated in the mandibular body and interradicular bone (ROI 1 and 5). Increasing the study sample would enhance the statistical power of the results obtained, allowing for a more comprehensive analysis of the influence of different bisphosphonate therapies administered to these patients throughout their development.
Bisphosphonate therapy is the gold standard in antiresorptive therapy for growing OI patients. In addition to this antiresorptive therapy, the literature includes studies in which fractal dimension analysis is used to quantify the results of other therapies such as intravenous corticosteroids [2], long-term corticosteroid therapy [37, 38], and even inhaled corticosteroids [39]. Fractal dimension analysis is a very useful tool in the study of BMD in a multitude of pathologies affecting bone metabolism such as osteoporosis [14], diabetes [24], hyperparathyroidism [17, 18], renal [16] etc.; and craniofacial alterations [40]. Recently, Özden et al. published in 2024 [40] a pilot study that examined the fractal dimension in the condyle, mandibular body and angle, as well as the coronoid process, in patients with cleft lip palate (either unilateral or bilateral), compared with a control group of healthy patients. The results obtained supported the previous findings of Pantoja et al. [12], who found that fractal dimension values were higher in the condylar region and mandibular body compared to the mandibular angle and coronoid process in healthy individuals, as well as on the healthy side of patients with unilateral cleft. This suggests higher metabolic activity in the condyle and mandibular body in growing patients.
Other drugs, such as proton pump inhibitors (PPIs) [41] or L-thyroxine (LT4) [42] (the synthetic thyroid hormone used in hormone replacement therapy) are administered for the treatment of various conditions and have been shown to affect mandibular bone structures. Research has been conducted to investigate this association through fractal dimension analysis of the condyle and mandible. These studies revealed no significant differences in the selected ROIs within trabecular bone areas; however, differences were found in the mandibular cortical index (MCI). An erosive effect on the mandibular cortex and lower MCI values were observed in patients undergoing treatment with these drugs, similar to the reduced values found in OI patients treated with bisphosphonates [41, 42].
The fractal dimension is a useful tool for analyzing BMD in patients with disorders of bone metabolism, since it was originally developed to quantify the texture of trabecular bone, which has a porous and anisotropic architecture. However, the literature includes studies in which this analysis has been extended to the mandibular cortical bone, as is the case of Apolinario et al. [11, 15], who study patients with OI treated with bisphosphonates; and Kavitha et al. in 2015 [14], with a sample of osteoporotic women, although the latter agree with the authors of the present study that this analysis should be accompanied by others such as the MCW in order to have greater reliability of the results.
Conclusions
The fractal dimension analysis shows higher values in the trabecular and condylar bone (ROIs 3 and 5) compared to cortical bone (ROI 4) in both the study sample and their healthy matched controls. Patients with type III and IV OI exhibit lower bone mineral density than those with type I OI. Among patients with severe OI, higher levels of osteopenia are observed at the condylar level (ROI 3). Additionally, the administration of zoledronic acid demonstrates a direct relationship with the fractal dimension between ROI 2 and ROI 3.
The results presented should be expanded in future studies with a larger sample of patients with OI, allowing for a greater number of subjects in each group to increase the statistical power of the findings.
Acknowledgements
This study was made possible thanks to the support of the AHUCE Foundation, which, by sponsoring research into Osteogenesis Imperfecta, contributes to improving both the quality of life and the care of these patients. The authors of the present work thank all the patients and their tutors for their participation in this research.
Clinical trial registration
Clinical trial number: not applicable
Abbreviations
- OI
Osteogenesis Imperfecta
- BMD
Bone Mineral Density
- ROI
Region of Interest
- FD
Fractal dimension
Authors’ contributions
M.J.dN-G contributed to the conceptualization of the research together with L.B-T and led the study, providing access to the patients in both the study and control groups. Additionally, M.J.dN-G actively participated in the supervision of each stage of the research.L.G-B was responsible for data collection, with the support of L.B-T in methodology. L.G-B served as the primary examiner, while L.B-T acted as the second investigator.L.B-T co-led the research together with M.J.dN-G. Furthermore, L.B-T worked on data processing as well as the various measurements carried out to obtain the analyzed results. L.B-T also prepared the original manuscript and handled its subsequent review and editing.All authors have read and agree to the publication of the present manuscript.
Funding
This research received no external funding.
Data availability
The data that support the findings of this study are not openly available due to reasons of sensitivity and are available from the corresponding author upon reasonable request.
Declarations
Ethics approval and consent to participate
The present research received approval from the Research Ethics Committee for Medicines of the San Carlos Clinic Hospital (Approval number C.I. 21/316-O_M_OD). Signed informed consent was obtained from the patient or their parents/guardians. The development has followed the parameters of the Declaration of Helsinki and complies with the data protection laws in force in Spain (Organic Law 3/2018, of December 5, on the Protection of Personal Data and Guarantee of Digital Rights (LOPD)).
Consent for publication
The manuscript does not contain any individual personal data.
Competing interests
The authors declare no competing interests.
Footnotes
Publisher’s Note
Springer Nature remains neutral with regard to jurisdictional claims in published maps and institutional affiliations.
References
- 1.Hwang JJ, Lee JH, Han SS, Kim YH, Jeong HG, Choi YJ, et al. Strut analysis for osteoporosis detection model using dental panoramic radiography. Dentomaxillofac Radiol. 2017;46(7): 20170006. 10.1259/dmfr.20170006. [DOI] [PMC free article] [PubMed] [Google Scholar]
- 2.Aktuna Belgin C, Serindere G. Fractal and radiomorphometric analysis of mandibular bone changes in patients undergoing intravenous corticosteroid therapy. Oral Surg Oral Med Oral Pathol Oral Radiol. 2020;130(1):110–5. 10.1016/j.oooo.2019.12.009. [DOI] [PubMed] [Google Scholar]
- 3.Neves FS, Barros AS, Cerqueira GA, Cruz GA, Reis AA, Alves LB, et al. Assessment of fractal dimension and panoramic radiomorphometric indices in women with celiac disease. Oral Radiol. 2020;36(2):141–7. 10.1007/s11282-019-00388-z. [DOI] [PubMed] [Google Scholar]
- 4.White SC. Oral radiographic predictors of osteoporosis. Dentomaxillofac Radiol. 2002;31(2):84–92. 10.1038/sj.dmfr.4600674. [DOI] [PubMed] [Google Scholar]
- 5.Göller Bulut D, Bayrak S, Uyeturk U, Ankarali H. Mandibular indexes and fractal properties on the panoramic radiographs of the patients using aromatase inhibitors. Br J Radiol. 2018;91(1091): 20180442. 10.1259/bjr.20180442. [DOI] [PMC free article] [PubMed] [Google Scholar]
- 6.Baksi BG, Fidler A. Fractal analysis of periapical bone from lossy compressed radiographs: a comparison of two lossy compression methods. J Digit Imaging. 2011;24(6):993–8. 10.1007/s10278-011-9383-0. [DOI] [PMC free article] [PubMed] [Google Scholar]
- 7.Toghyani S, Nasseh I, Aoun G, Noujeim M. Effect of image resolution and compression on fractal analysis of the periapical bone. Acta Inf Med. 2019;27(3):167–70. 10.5455/aim.2019.27.167-170. [DOI] [PMC free article] [PubMed] [Google Scholar]
- 8.Oliveira ML, Pedrosa EF, Cruz AD, Haiter-Neto F, Paula FJ, Watanabe PC. Relationship between bone mineral density and trabecular bone pattern in postmenopausal osteoporotic Brazilian women. Clin Oral Investig. 2013;17(8):1847–53. 10.1007/s00784-012-0882-2. [DOI] [PubMed] [Google Scholar]
- 9.Bollen AM, Taguchi A, Hujoel PP, Hollender LG. Fractal dimension on dental radiographs. Dentomaxillofac Radiol. 2001;30(5):270–5. 10.1038/sj/dmfr/4600630. [DOI] [PubMed] [Google Scholar]
- 10.Law AN, Bollen AM, Chen SK. Detecting osteoporosis using dental radiographs: a comparison of four methods. J Am Dent Assoc. 1996;127(12):1734–42. 10.14219/jada.archive.1996.0134. [DOI] [PubMed] [Google Scholar]
- 11.Apolinário AC, Sindeaux R, de Souza Figueiredo PT, Guimarães AT, Acevedo AC, Castro LC, et al. Dental panoramic indices and fractal dimension measurements in osteogenesis imperfecta children under pamidronate treatment. Dentomaxillofac Radiol. 2016;45(4):20150400. 10.1259/dmfr.20150400. [DOI] [PMC free article] [PubMed] [Google Scholar]
- 12.Pantoja LLQ, Lustosa M, Yamaguti PM, Rosa LS, Leite AF, Figueiredo PTS, et al. Pamidronate therapy increases trabecular bone complexity of mandibular condyles in individuals with osteogenesis imperfecta. Calcif Tissue Int. 2022;110(3):303–12. 10.1007/s00223-021-00915-3. [DOI] [PubMed] [Google Scholar]
- 13.Demiralp KÖ, Kurşun-Çakmak EŞ, Bayrak S, Akbulut N, Atakan C, Orhan K. Trabecular structure designation using fractal analysis technique on panoramic radiographs of patients with bisphosphonate intake: a preliminary study. Oral Radiol. 2019;35(1):23–8. 10.1007/s11282-018-0321-4. [DOI] [PubMed] [Google Scholar]
- 14.Kavitha MS, An SY, An CH, Huh KH, Yi WJ, Heo MS, et al. Texture analysis of mandibular cortical bone on digital dental panoramic radiographs for the diagnosis of osteoporosis in Korean women. Oral Surg Oral Med Oral Pathol Oral Radiol. 2015;119(3):346–56. 10.1016/j.oooo.2014.11.009. [DOI] [PubMed] [Google Scholar]
- 15.Apolinário AC, Figueiredo PT, Guimarães AT, Acevedo AC, Castro LC, Paula AP, et al. Pamidronate affects the mandibular cortex of children with osteogenesis imperfecta. J Dent Res. 2015;94(3 Suppl):S95–102. 10.1177/0022034514567334. [DOI] [PMC free article] [PubMed] [Google Scholar]
- 16.Gumussoy I, Miloglu O, Cankaya E, Bayrakdar IS. Fractal properties of the trabecular pattern of the mandible in chronic renal failure. Dentomaxillofac Radiol. 2016;45(5): 20150389. 10.1259/dmfr.20150389. [DOI] [PMC free article] [PubMed] [Google Scholar]
- 17.Canturk F, Miloglu O, Gumussoy I, Dayanan R. The investigation of radiographic findings of mandibles on panoramic radiographs of patients with primary hyperparathyroidism using fractal analysis. Eurasian J Med. 2021;53(3):185–91. 10.5152/eurasianjmed.2021.20140. [DOI] [PMC free article] [PubMed] [Google Scholar]
- 18.Ergün S, Saraçoglu A, Güneri P, Ozpinar B. Application of fractal analysis in hyperparathyroidism. Dentomaxillofac Radiol. 2009;38(5):281–8. 10.1259/dmfr/24986192. [DOI] [PubMed] [Google Scholar]
- 19.Schanda JE, Huber S, Behanova M, Haschka J, Kraus DA, Meier P, et al. Analysis of bone architecture using fractal-based TX-analyzer™ in adult patients with osteogenesis imperfecta. Bone. 2021;147:115915. 10.1016/j.bone.2021.115915. [DOI] [PubMed] [Google Scholar]
- 20.Prado HV, Debossan SAT, Loayza KS, Abreu LG, Brasileiro CB, Borges-Oliveira AC. Radiomorphometric indices and fractal dimension of the mandible in individuals with osteogenesis imperfecta: a matched cross-sectional study. Oral Surg Oral Med Oral Pathol Oral Radiol. 2023;136(1):102–11. 10.1016/j.oooo.2023.02.002. [DOI] [PubMed] [Google Scholar]
- 21.Camargo AJ, Arita ES, De Fernández MCC, Watanabe PCA, Camargo AJ. Comparison of two radiological methods for evaluation of bone density in postmenopausal women. Int J Morphol. 2015;33(2):732–6. [Google Scholar]
- 22.Tosoni GM, Lurie AG, Cowan AE, Burleson JA. Pixel intensity and fractal analyses: detecting osteoporosis in perimenopausal and postmenopausal women by using digital panoramic images. Oral Surg Oral Med Oral Pathol Oral Radiol Endod. 2006;102(2):235–41. 10.1016/j.tripleo.2005.08.020. [DOI] [PubMed] [Google Scholar]
- 23.Koh KJ, Park HN, Kim KA. Prediction of age-related osteoporosis using fractal analysis on panoramic radiographs. Imaging Sci Dent. 2012;42(4):231–5. 10.5624/isd.2012.42.4.231. [DOI] [PMC free article] [PubMed] [Google Scholar]
- 24.Kurşun-Çakmak EŞ, Bayrak S. Comparison of fractal dimension analysis and panoramic-based radiomorphometric indices in the assessment of mandibular bone changes in patients with type 1 and type 2 diabetes mellitus. Oral Surg Oral Med Oral Pathol Oral Radiol. 2018;126(2):184–91. 10.1016/j.oooo.2018.04.010. [DOI] [PubMed] [Google Scholar]
- 25.Kato CN, Barra SG, Tavares NP, Amaral TM, Brasileiro CB, Mesquita RA, et al. Use of fractal analysis in dental images: a systematic review. Dentomaxillofac Radiol. 2020;49(2): 20180457. 10.1259/dmfr.20180457. [DOI] [PMC free article] [PubMed] [Google Scholar]
- 26.Rocha-Claros JJ. Osteoporosis of the jaws and its diagnostic methods: review of the literature. Odovtos [internet]- Int J Dent Sci. 2021;21(1):55–63. 10.15517/ijds.2020.39367. [Google Scholar]
- 27.Marçal FF, Ribeiro EM, Costa FWG, Fonteles CSR, Teles GS, de Barros Silva PG, et al. Dental alterations on panoramic radiographs of patients with osteogenesis imperfecta in relation to clinical diagnosis, severity, and bisphosphonate regimen aspects: a STROBE-compliant case-control study. Oral Surg Oral Med Oral Pathol Oral Radiol. 2019;128(6):621–30. 10.1016/j.oooo.2019.07.001. [DOI] [PubMed] [Google Scholar]
- 28.Arsan B, Köse TE, Çene E, Özcan İ. Assessment of the trabecular structure of mandibular condyles in patients with temporomandibular disorders using fractal analysis. Oral Surg Oral Med Oral Pathol Oral Radiol. 2017;123(3):382–91. 10.1016/j.oooo.2016.11.005. [DOI] [PubMed] [Google Scholar]
- 29.Jolley L, Majumdar S, Kapila S. Technical factors in fractal analysis of periapical radiographs. Dentomaxillofac Radiol. 2006;35(6):393–7. 10.1259/dmfr/30969642. [DOI] [PubMed] [Google Scholar]
- 30.Taguchi A, Sugino N, Miki M, Kozai Y, Mochizuki N, Osanai H, et al. Detecting young Japanese adults with undetected low skeletal bone density using panoramic radiographs. Dentomaxillofac Radiol. 2011;40(3):154–9. 10.1259/dmfr/30045588. [DOI] [PMC free article] [PubMed] [Google Scholar]
- 31.White SC, Rudolph DJ. Alterations of the trabecular pattern of the jaws in patients with osteoporosis. Oral Surg Oral Med Oral Pathol Oral Radiol Endod. 1999;88:628–35. [DOI] [PubMed] [Google Scholar]
- 32.Sindeaux R, Figueiredo PT, de Melo NS, Guimarães AT, Lazarte L, Pereira FB, et al. Fractal dimension and mandibular cortical width in normal and osteoporotic men and women. Maturitas. 2014;77(2):142–8. 10.1016/j.maturitas.2013.10.011. [DOI] [PubMed] [Google Scholar]
- 33.Rauch F, Plotkin H, Travers R, Zeitlin L, Glorieux FH. Osteogenesis imperfecta types I, III, and IV: effect of pamidronate therapy on bone and mineral metabolism. J Clin Endocrinol Metab. 2003;88(3):986–92. 10.1210/jc.2002-021371. [DOI] [PubMed] [Google Scholar]
- 34.Rauch F, Munns C, Land C, Glorieux FH. Pamidronate in children and adolescents with osteogenesis imperfecta: effect of treatment discontinuation. J Clin Endocrinol Metab. 2006;91(4):1268–74. 10.1210/jc.2005-2413. [DOI] [PubMed] [Google Scholar]
- 35.Soltani P, Sami S, Yaghini J, Golkar E, Riccitiello F, Spagnuolo G. Application of fractal analysis in detecting trabecular bone changes in periapical radiograph of patients with periodontitis. Int J Dent. 2021;2021:3221448. 10.1155/2021/3221448. [DOI] [PMC free article] [PubMed] [Google Scholar]
- 36.Bou Torrent R. Osteogénesis imperfecta. Protoc Diagn Ter Pediatr. 2020;2:349–59. https://www.aeped.es/sites/default/files/documentos/30_osteogenesis_imp.pdf. [Google Scholar]
- 37.Lespessailles E, Siroux V, Poupon S, Andriambelosoa N, Pothuaud L, Harba R, Benhamou CL. Long-term corticosteroid therapy induces mild changes in trabecular bone texture. J Bone Min Res. 2000;15(4):747–53. 10.1359/jbmr.2000.15.4.747. [DOI] [PubMed] [Google Scholar]
- 38.Ersu N, Akyol R, Etöz M. Fractal properties and radiomorphometric indices of the trabecular structure of the mandible in patients using systemic glucocorticoids. Oral Radiol. 2022;38(2):252–60. 10.1007/s11282-021-00552-4. [DOI] [PubMed] [Google Scholar]
- 39.Günen-Yılmaz S, Aytekin Z. Evaluation of jaw bone changes in patients with asthma using inhaled corticosteroids with mandibular radiomorphometric indices on dental panoramic radiographs. Med Oral Patol Oral Cir Bucal. 2023;28(3):e285–92. 10.4317/medoral.25722. [DOI] [PMC free article] [PubMed] [Google Scholar]
- 40.Özden S, Cicek O. Assessment of the mandibular osseous architecture in cleft lip and palate using fractal dimension analysis: A pilot study. J Clin Med. 2024;13(23):7334. 10.3390/jcm13237334. [DOI] [PMC free article] [PubMed] [Google Scholar]
- 41.Kaya S, Koç A. Is there an association between proton pump inhibitors and radiomorphometric parameters of the mandible? A preliminary study. Oral Radiol. 2022;38(4):586–93. [DOI] [PubMed] [Google Scholar]
- 42.Gulec M, Tassoker M, Erturk M. Evaluation of cortical and trabecular bone structure of the mandible in patients using L-thyroxine. BMC Oral Health. 2023;23(1):886. [DOI] [PMC free article] [PubMed] [Google Scholar]
Associated Data
This section collects any data citations, data availability statements, or supplementary materials included in this article.
Data Availability Statement
The data that support the findings of this study are not openly available due to reasons of sensitivity and are available from the corresponding author upon reasonable request.