

The prefrontal cortex (PFC) plays a critical role in the control of many physiological processes including attention, learning, and decision-making (Arnsten & Li, 2005; Dalley, Cardinal, & Robbins, 2004; Funahashi & Andreau, 2013). This brain region receives dopamine (DA) and norepinephrine (NE) axons from the ventral tegmental area (VTA) and locus coeruleus (LC), respectively (Chandler, Lamperski, & Waterhouse, 2013; Waterhouse, Lin, Burne, & Woodward, 1983). Therefore, revealing alterations in catecholamine (CA) dynamics in these circuitries is necessary to understand the pathogenesis of different psychiatric diseases, including addiction to drugs and alcohol. Since the PFC is widely involved in complex mental functions, ethanol-induced neuroadaptations can be implicated in impaired cognitive ability and aversive outcomes that facilitate dependence on alcohol. However, changes in cortical CA release under ethanol effects remain unclear.
In fact, real-time electrochemical measurements of cortical DA and NE release are complicated due to electrochemical similarity and the relatively low concentrations of these catecholamines in this area (Nakatsuka & Andrews, 2017). The contribution of NE to the CA response in the PFC evoked by electrical activation of the VTA was effectively explored by combining fast-scan cyclic voltammetry (FSCV) with pharmacological identification of the signals (Shnitko & Robinson, 2014). These findings suggest that the CA release in the PFC arising from VTA stimulation is predominantly dopaminergic rather than noradrenergic. Recently, FSCV was applied to measure cortical NE release following electrical stimulation of the LC in an animal model of epilepsy (Kumar et al., 2016; Medel-Matus, Shin, Sankar, & Mazarati, 2017). However, the characterization and, more importantly, pharmacological verification of detected CA is still required to exclude the possible contribution of DA to the voltammetric signal.
Therefore, we combined voltammetric measurements with pharmacological analysis to clarify the nature of PFC CA release triggered by LC stimulation. In addition, we explored the distribution of the signal over a large dorsal–ventral range and its frequency dependence. Finally, the effect of ethanol on the cortical NE release was evaluated under the same experimental condition.
Adult male Long Evans rats were used for in vivo voltammetric recordings. Animal handling, procedures, and protocols were conducted in accordance with the National Institutes of Health Guide for the Care and Use of Laboratory Animals and approved by the Wake Forest University School of Medicine Institutional Animal Care and Use Committee. Rats were anesthetized via urethane (1.5 g/kg; i.p.) then secured in a stereotaxic frame. The skull was revealed and holes were drilled to allow placement of a carbon fiber recording electrode in the infralimbic cortex (IL) (AP: +3.0 mm from bregma; ML: +0.7 mm from bregma; DV: −4.8 to −5.2 mm from skull surface) and a bipolar stimulating electrode in the LC (AP: −9.8 mm from bregma; ML: +1.3 mm from bregma; DV: −6.8 to −7.2 mm from skull surface) with a third hole drilled in the contralateral hemisphere for insertion of a Ag/AgCl reference wire. CA release was evoked by applying a 2-s electrical stimulation at 60 Hz (120 rectangular pulses, 300 μA, 4 ms/phase, monophasic). This supraphysiological stimulation was necessary in order to trigger detectable stable NE concentrations which could be reliably used for electrochemical and pharmacological analyses and uptake rate determination. CA effluxes were recorded at the carbon fiber electrode every 10 min until a baseline signal of three consecutive stimulations with no more than 10% variability was established. The CA signal was identified using background-subtracted cyclic voltammograms characterized by oxidation and reduction peaks occurring at ~+0.6 and ~−0.2 V, respectively (Mateo, Budygin, Morgan, Roberts, & Jones, 2004; Shnitko & Robinson, 2014). An injection (i.p.) of saline, raclopride (DA D2 receptor antagonist; 2 mg/kg), idazoxan (α2 adrenergic receptor antagonist; 5 mg/kg), or ethanol (2 g/kg) was administered and voltammetric recordings were taken for 60 min. Parametric and nonparametric one- and two-way ANOVAs as well as post hoc tests, where appropriate, were conducted using GraphPad Prism (GraphPad Software version 7.04, San Diego, CA, USA). The criterion for significance was set at p < 0.05.
Electrical stimulation of the LC produced a voltammetric signal with electrochemical characteristics which matched the detection of CA in the IL (Figure 1a). The average reuptake rate of the measured neurotransmitter was 206 ± 39 nM/s (n = 5 rats). Measurements were taken stepwise along the dorsal–ventral PFC extent that contains the medial prelimbic and infralimbic cortices following stimulation of the LC (−7.0 mm below bregma) and converted to a percentage of the maximum peak efflux value obtained within each subject (Figure 1b). A Friedman test found a significant effect of recording depth (; p < 0.01) and a post hoc Dunn’s multiple comparisons test showed that the depths −4.8 mm and −5.0 mm were significantly different from baseline, −2.2 mm (92.0% ± 3.53% and 88.7% ± 6.56 compared to 43.2% ± 11.1, respectively; p < 0.05). Antagonists of α2 adrenergic and D2 DA receptors, which are able to modulate release of the respective monoamine via blockade of autoreceptors, were used to parse out the individual contributions of NE and DA to this evoked CA release in the IL cortex (Figure 2). A repeated measures two-way ANOVA found a main effect of time (F(8,296) = 15.45; p < 0.0001) and drug (F(3,37) = 15.24; p < 0.0001) as well as a significant interaction (F(24,296) = 14.3; p < 0.0001). Dunnett’s multiple comparisons test found that administration of the α2 adrenergic receptor antagonist, idazoxan, resulted in significantly higher CA efflux compared to the saline control (mean at 10-min post-injection: 211.8% ± 22.5% and 100.5% ± 2.9, respectively; p < 0.0001). In contrast, administration of the DA D2 receptor antagonist, raclopride, caused no significant changes in voltammetric signal when compared to the control (mean at 10-min post-injection: 115.9% ± 7.6% and 100.5% ± 2.9, respectively; p > 0.05). This indicates that the measured CA release is predominantly NE. Catecholamine signal identification was not pursued further using uptake inhibitors due to the promiscuous nature of CA reuptake in the PFC (Morón et al., 2002). Because DA released in the PFC can be reuptaken through the NE transporter in the PFC, this pharmacological analysis cannot be conclusive.
FIGURE 1.
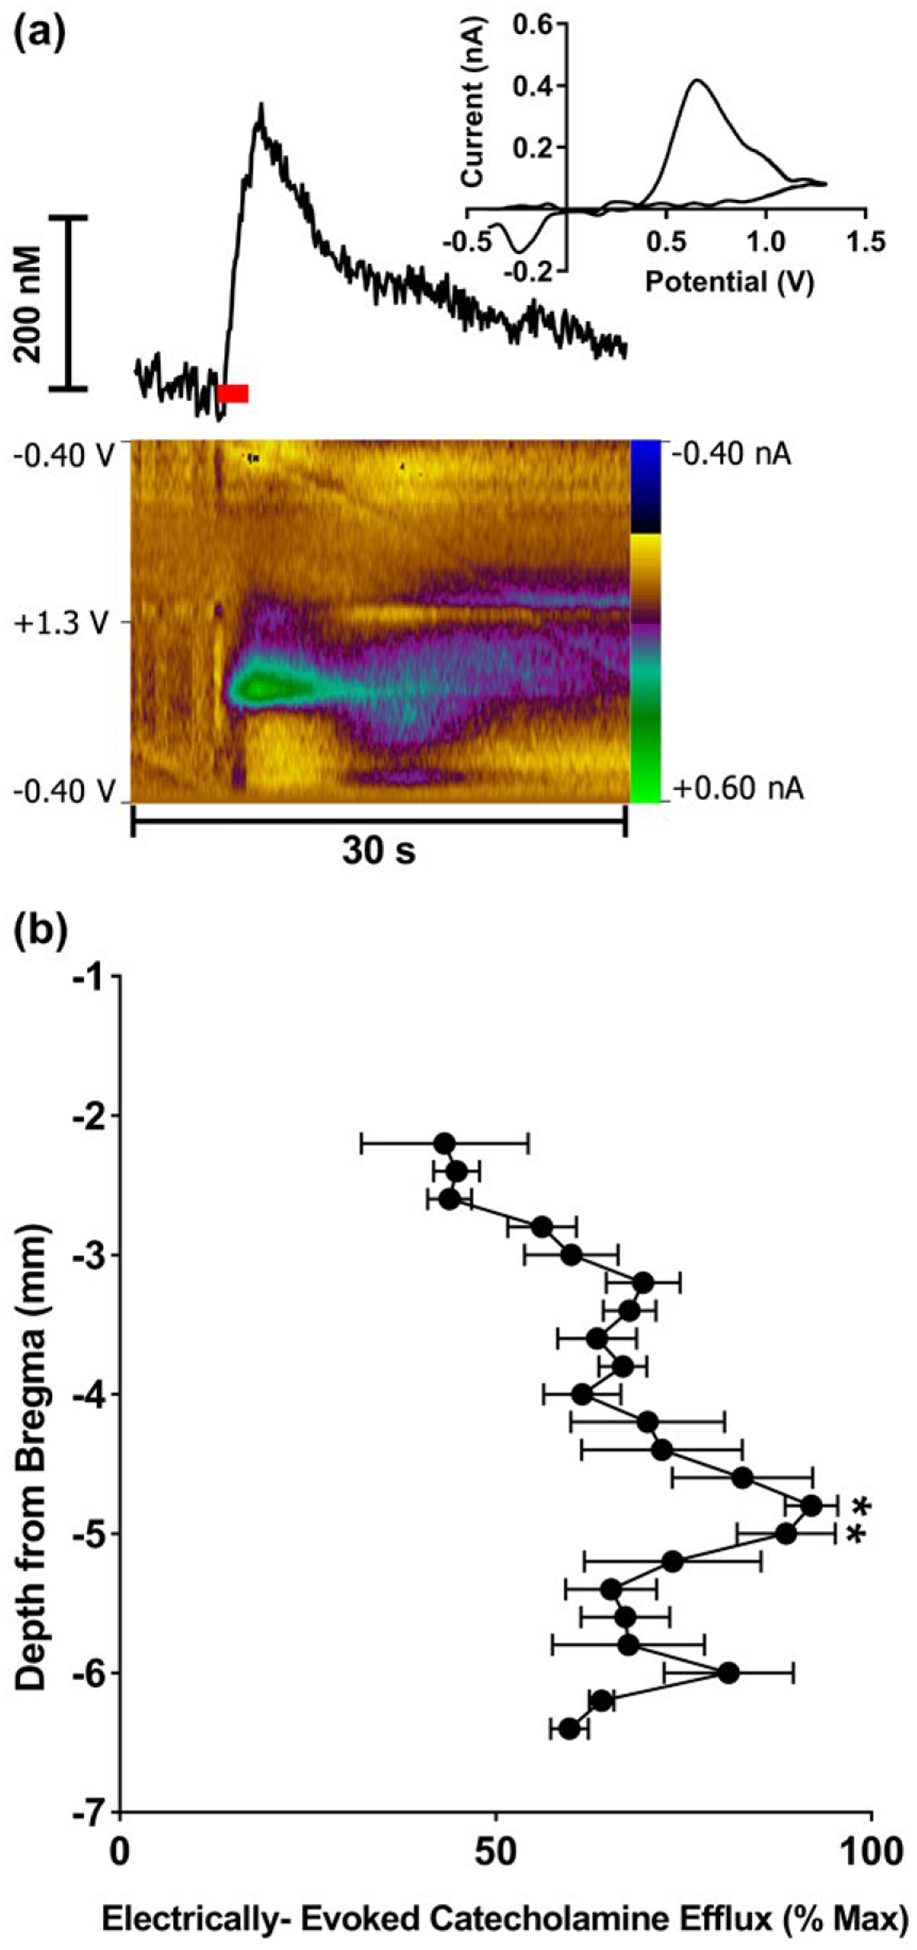
Electrically evoked catecholamine (CA) release in the medial prefrontal cortex (PFC) following stimulation of the locus coeruleus (LC) as measured by fast-scan cyclic voltammetry (FSCV). (a) A representative trace shows changes in CA concentration over time (top left). The cyclic voltammogram (top right) indicates current measured at the full range of applied potentials at the peak of the CA efflux. The color plot (bottom) topographically depicts the voltammetric data with time on the x-axis, applied scan potential on the y-axis, and background-subtracted faradaic current shown on the z-axis in pseudo-color. The red bar indicates duration of electrical stimulus. (b) Catecholamine efflux as a function of recording depth following LC stimulation (−7.0 mm below bregma). Data presented as mean percent (±SEM) of maximum efflux per subject (n = 6). *p < 0.05
FIGURE 2.

Pharmacological verification of the catecholamine (CA) release in the infralimbic cortex (IL). Electrically evoked CA efflux was measured following stimulation of the locus coeruleus (LC) before and after injection of idazoxan (5 mg/kg, i.p.), raclopride (2 mg/kg, i.p.), or ethanol (2 g/kg, i.p.). Idazoxan resulted in increased CA efflux, while there was no change in CA efflux measured following injection of raclopride. The administration of ethanol had no effect on CA release. Inserts show representative concentration-time plots comparing pre- and 10 min post-injection efflux of the CA as a percentage of individual baselines. Values are presented as a mean percent (± SEM) of the pre-injection baseline. Arrow indicates injection. ****p < 0.0001 compared to saline. The number of rats per group were n = 13 for saline, n = 11 for idazoxan, n = 10 for raclopride and n = 7 for ethanol
The effect of ethanol on NE release in the IL was assessed under the same experimental condition. Similarly to raclopride, acutely admin-istrated ethanol (2 g/kg; i.p.) did not have a significant effect on NE release induced by the electrical stimulation of the LC (mean at 10-min post-injection: 95.2% ± 4.7% and 100.5% ± 2.9, respectively; p > 0.05). Finally, we revealed that the NE efflux in the IL is dependent on the frequency of stimulation. Higher frequency stimulations resulted in increased concentrations of NE release compared to lower frequency (Figure 3; repeated measures one-way ANOVA: F(2.378,14.27)=23.37; p < 0.0001). Detected concentrations vary from 50 to 250 nM.
FIGURE 3.

Norepinephrine (NE) release in the infralimbic cortex (IL) induced by electrical stimulation of the LC is frequency-dependent. (a) Representative concentration–time traces of NE release in the IL of an individual rat demonstrate an increased response as stimulation frequency increases. (b) Averaged NE responses show higher frequency stimulations result in increased efflux concentrations compared to lower frequency stimulations. Data presented as mean (± SEM), n = 6
At first glance, the finding that the CA release in the IL PFC triggered by LC stimulation was principally noradrenergic, rather than dopaminergic, should be anticipated. However, cortical DA could be released through long-loop indirect networks, since the LC projects diffusely throughout the brain and modulates many neurotransmissions. In fact, previous studies revealed ascending fibers of LC-NE neurons terminate in the VTA and the presence of NE receptors in this area (Chen & Reith, 1994; Liprando, Miner, Blakely, Lewis, & Sesack, 2004; Mejias-Aponte, 2016). Furthermore, a number of studies have shown a net excitatory effect of LC-NE on VTA-DA neural activity through NE receptors, which are localized on presynaptic neurons in the VTA (Goertz et al., 2015; Grenhoff, Nisell, Ferre, Aston-Jones, & Svensson, 1993; Mejias-Aponte, 2016; Weinshenker & Schroeder, 2007). Moreover, an electrical stimulation of the LC resulted in excitation of VTA-DA neurons with subsequent inhibition (Grenhoff et al., 1993). These responses were not observed after pretreatment with reserpine, implicating NE as a mediator that is responsible for the effect. VTA-DA projections target many limbic structures including the PFC and nucleus accumbens. A recent study, which combined FSCV with pharmacological analysis (Park, Bhimani, & Park, 2017), demonstrated that the electrical stimulation of the LC induces NE release in the VTA, resulting in activation of DA neurons via NE receptors with consequential DA release in the nucleus accumbens. The present data rule out the significance of the same circuitry (LC-VTA-PFC) for the initiation of DA release in IL PFC. In fact, pharmacological analysis revealed that LC stimulation selectively induces NE release in these terminals. NE was released in a frequency-dependent manner at the concentration range that was previously found in other NE terminals following LC stimulation (Fox, Bucher, Johnson, & Wightman, 2016; Herr et al., 2012; Park, Kile, & Wightman, 2009; Park et al., 2017).
In sharp contrast to DA, the effect of ethanol on NE release in different brain areas including the PFC was not previously explored with FSCV. The most consistent findings on DA are that acute ethanol administration decreases terminal DA release induced by electrical stimulation of the VTA in freely moving and anesthetized preparations (Budygin et al., 2001; Jones, Mathews, & Budygin, 2006; Schilaty et al., 2014; Shnitko et al., 2014; Shnitko, Spear, & Robinson, 2016). The mechanism of this ethanol action is unclear still. Since ethanol-induced increases in extracellular DA levels measured by microdialysis (Yim et al., 2000) show a quite similar time course to the reduction in electrically evoked DA detected by FSCV (Jones et al., 2006), it was speculated that the decreased amplitude of the evoked DA signal may be due to D2 DA autoreceptor feedback triggered by enhanced DA concentrations in the synaptic cleft. However, as assessed by microdialysis, ethanol at a dose of 2 g/kg significantly inhibited cortical NE levels in awake rats (Rossetti, Longu, Mercuro, Hmaidan, & Gessa, 1992), while no changes in the evoked NE release were evident in our experiments in anesthetized animals. Thus, the decrease in cortical NE concentration may be associated with the sedative-hypnotic properties of ethanol at this dose (Rossetti et al., 1992). Perhaps this effect overlaps with anesthesia and therefore it cannot take place in anesthetized rats. Thus, ethanol differentially affects catecholamines in the PFC, decreasing DA (Shnitko et al., 2014) and not changing NE release under the same experimental condition.
In conclusion, using FSCV in vivo, we demonstrated that electrical stimulation of the LC triggers detectable CA release in the PFC. Electrochemical and pharmacological evidence clearly indicated that the CA release measured in the IL at a nanomolar range is noradrenergic but not dopaminergic. These data also suggest that despite a high neurochemical similarity and equal densities of NE and DA terminals in the PFC, these neurotransmitters are differently regulated and affected by ethanol.
ACKNOWLEDGMENTS
We would like to thank Joanne Konstantopoulos for help in preparing this manuscript. The research for this study was funded by NIH grants AA022449, P50 AA026117-01(E.A.B.), T32AA007565 (A.L.D.), the Tab Williams Family Endowment Fund (E.A.B.) and by the Russian Science Foundation grant no. 14-50-00069 (M.A.M. and R.R.G.).
Funding information
National Institute on Alcohol Abuse and Alcoholism, Grant/Award Number: AA022449, P50 AA026117-01 and T32AA007565; Tab Williams Family Endowment Fund; Russian Science Foundation, Grant/Award Number: 14-50-00069
REFERENCES
- Arnsten AFT, & Li B-M (2005). Neurobiology of executive functions: Catecholamine influences on prefrontal cortical functions. Biological Psychiatry, 57, 1377–1384. 10.1016/j.biopsych.2004.08.019 [DOI] [PubMed] [Google Scholar]
- Budygin EA, Phillips PEM, Robinson DL, Kennedy AP, Gainetdinov RR, & Wightman RM (2001). Effect of acute ethanol on striatal dopamine neurotransmission in ambulatory rats. Journal of Pharmacology and Experimental Therapeutics, 297, 27–34. [PubMed] [Google Scholar]
- Chandler DJ, Lamperski CS, & Waterhouse BD (2013). Identification and distribution of projections from monoaminergic and cholinergic nuclei to functionally differentiated subregions of prefrontal cortex. Brain Research, 1522, 38–58. 10.1016/j.brainres.2013.04.057 [DOI] [PMC free article] [PubMed] [Google Scholar]
- Chen NH, & Reith ME (1994). Autoregulation and monoamine interactions in the ventral tegmental area in the absence and presence of cocaine: a microdialysis study in freely moving rats. Journal of Pharmacology and Experimental Therapeutics, 271, 1597–1610. [PubMed] [Google Scholar]
- Dalley JW, Cardinal RN, & Robbins TW (2004). Prefrontal executive and cognitive functions in rodents: Neural and neurochemical substrates. Neuroscience & Biobehavioral Reviews, 28, 771–784. 10.1016/j.neubiorev.2004.09.006 [DOI] [PubMed] [Google Scholar]
- Fox ME, Bucher ES, Johnson JA, & Wightman RM (2016). Medullary norepinephrine projections release norepinephrine into the contralateral bed nucleus of the stria terminalis. ACS Chemical Neuroscience, 7, 1681–1689. 10.1021/acschemneuro.6b00210 [DOI] [PMC free article] [PubMed] [Google Scholar]
- Funahashi S, & Andreau JM (2013). Prefrontal cortex and neural mechanisms of executive function. Journal of Physiology-Paris, 107, 471–482. 10.1016/j.jphysparis.2013.05.001 [DOI] [PubMed] [Google Scholar]
- Goertz RB, Wanat MJ, Gomez JA, Brown ZJ, Phillips PE, & Paladini CA (2015). Cocaine increases dopaminergic neuron and motor activity via midbrain alpha1 adrenergic signaling. Neuropsychopharmacology, 40, 1151–1162. 10.1038/npp.2014.296 [DOI] [PMC free article] [PubMed] [Google Scholar]
- Grenhoff J, Nisell M, Ferre S, Aston-Jones G, & Svensson TH (1993). Noradrenergic modulation of midbrain dopamine cell firing elicited by stimulation of the locus coeruleus in the rat. Journal of Neural Transmission, 93, 11–25. 10.1007/BF01244934 [DOI] [PubMed] [Google Scholar]
- Herr NR, Park J, McElligott ZA, Belle AM, Carelli RM, & Wightman RM (2012). In vivo voltammetry monitoring of electrically evoked extracellular norepinephrine in subregions of the bed nucleus of the stria terminalis. Journal of Neurophysiology, 107, 1731–1737. 10.1152/jn.00620.2011 [DOI] [PMC free article] [PubMed] [Google Scholar]
- Jones SR, Mathews TA, & Budygin EA (2006). Effect of moderate ethanol dose on dopamine uptake in rat nucleus accumbens in vivo. Synapse, 60, 251–255. 10.1002/syn.20294 [DOI] [PubMed] [Google Scholar]
- Kumar U, Medel-Matus JS, Redwine HM, Shin D, Hensler JG, Sankar R, & Mazarati A (2016). Effects of selective serotonin and norepinephrine reuptake inhibitors on depressive- and impulsive-like behaviors and on monoamine transmission in experimental temporal lobe epilepsy. Epilepsia, 57, 506–515. 10.1111/epi.13321 [DOI] [PMC free article] [PubMed] [Google Scholar]
- Liprando LA, Miner LH, Blakely RD, Lewis DA, & Sesack SR (2004). Ultrastructural interactions between terminals expressing the norepinephrine transporter and dopamine neurons in the rat and monkey ventral tegmental area. Synapse, 52, 233–244. 10.1002/syn.20023 [DOI] [PubMed] [Google Scholar]
- Mateo Y, Budygin EA, Morgan D, Roberts DC, & Jones SR (2004). Fast onset of dopamine uptake inhibition by intravenous cocaine. European Journal of Neuroscience, 20, 2838–2842. 10.1111/j.1460-9568.2004.03736.x [DOI] [PubMed] [Google Scholar]
- Medel-Matus JS, Shin D, Sankar R, & Mazarati A (2017). Galanin contributes to monoaminergic dysfunction and to dependent neurobehavioral comorbidities of epilepsy. Experimental Neurology, 289, 64–72. 10.1016/j.expneurol.2016.12.008 [DOI] [PMC free article] [PubMed] [Google Scholar]
- Mejias-Aponte CA (2016). Specificity and impact of adrenergic projections to the midbrain dopamine system. Brain Research, 1641(Pt B), 258–273. 10.1016/j.brainres.2016.01.036 [DOI] [PMC free article] [PubMed] [Google Scholar]
- Morón JA, Brockington A, Wise RA, Rocha BA, & Hope BT (2002). Dopamine uptake through the norepinephrine transporter in brain regions with low levels of the dopamine transporter: Evidence from knock-out mouse lines. Journal of Neuroscience, 22, 389–395. 10.1523/JNEUROSCI.22-02-00389.2002 [DOI] [PMC free article] [PubMed] [Google Scholar]
- Nakatsuka N, & Andrews AM (2017). Differentiating siblings: The case of dopamine and norepinephrine. ACS Chemical Neuroscience, 8, 218–220. 10.1021/acschemneuro.7b00056 [DOI] [PubMed] [Google Scholar]
- Park JW, Bhimani RV, & Park J (2017). Noradrenergic modulation of dopamine transmission evoked by electrical stimulation of the locus coeruleus in the rat brain. ACS Chemical Neuroscience, 8, 1913–1924. 10.1021/acschemneuro.7b00078 [DOI] [PubMed] [Google Scholar]
- Park J, Kile BM, & Wightman RM (2009). In vivo voltammetric monitoring of norepinephrine release in the rat ventral bed nucleus of the stria terminalis and anteroventral thalamic nucleus. European Journal of Neuroscience, 30, 2121–2133. 10.1111/j.1460-9568.2009.07005.x [DOI] [PMC free article] [PubMed] [Google Scholar]
- Rossetti ZL, Longu G, Mercuro G, Hmaidan Y, & Gessa GL (1992). Biphasic effect of ethanol on noradrenaline release in the frontal cortex of awake rats. Alcohol and Alcoholism, 27, 477–480. [PubMed] [Google Scholar]
- Schilaty ND, Hedges DM, Jang EY, Folsom RJ, Yorgason JT, McIntosh JM, & Steffensen SC (2014). Acute ethanol inhibits dopamine release in the nucleus accumbens via α6 nicotinic acetylcholine receptors. Journal of Pharmacology and Experimental Therapeutics, 349, 559–567. 10.1124/jpet.113.211490 [DOI] [PMC free article] [PubMed] [Google Scholar]
- Shnitko TA, Kennerly LC, Spear LP, & Robinson DL (2014). Ethanol reduces evoked dopamine release and slows clearance in the rat medial prefrontal cortex. Alcoholism: Clinical and Experimental Research, 38, 2969–2977. 10.1111/acer.12587 [DOI] [PMC free article] [PubMed] [Google Scholar]
- Shnitko TA, & Robinson DL (2014). Anatomical and pharmacological characterization of catecholamine transients in the medial prefrontal cortex evoked by ventral tegmental area stimulation. Synapse (New York, N. Y.), 68, 131–143. 10.1002/syn.21723 [DOI] [PMC free article] [PubMed] [Google Scholar]
- Shnitko TA, Spear LP, & Robinson DL (2016). Adolescent binge-like alcohol alters sensitivity to acute alcohol effects on dopamine release in the nucleus accumbens of adult rats. Psychopharmacology, 233, 361–371. 10.1007/s00213-015-4106-8 [DOI] [PMC free article] [PubMed] [Google Scholar]
- Waterhouse BD, Lin CS, Burne RA, & Woodward DJ (1983). The distribution of neocortical projection neurons in the locus coeruleus. Journal of Comparative Neurology, 217, 418–431. 10.1002/cne.902170406 [DOI] [PubMed] [Google Scholar]
- Weinshenker D, & Schroeder JP (2007). There and back again: A tale of norepinephrine and drug addiction. Neuropsychopharmacology, 32, 1433–1451. 10.1038/sj.npp.1301263 [DOI] [PubMed] [Google Scholar]
- Yim HJ, Robinson DL, White ML, Jaworski JN, Randall PK, Lancaster FE, & Gonzales RA (2000). Dissociation between the time course of ethanol and extracellular dopamine concentrations in the nucleus accumbens after a single intraperitoneal injection. Alcoholism: Clinical and Experimental Research, 24, 781–788. 10.1111/j.1530-0277.2000.tb02056.x [DOI] [PubMed] [Google Scholar]