

Summary
Proneural transcription factors establish molecular cascades to orchestrate neuronal diversity. One such transcription factor, Atoh1, gives rise to cerebellar excitatory neurons and over 30 distinct nuclei in the brainstem critical for hearing, breathing, and balance. Although Atoh1-lineage neurons have been qualitatively described, the transcriptional programs that drive their fate decisions and the full extent of their diversity remain unknown. Here, we analyzed single-cell RNA-sequencing and ATOH1 DNA binding in Atoh1-lineage neurons of the developing mouse hindbrain. This high-resolution dataset identified markers for specific brainstem nuclei and demonstrated transcriptionally heterogeneous progenitors require ATOH1 for proper migration. Moreover, we identified a sizable population of proliferating unipolar brush cell progenitors in the mouse Atoh1-lineage, previously described in humans as the origin of one medulloblastoma subtype. Collectively, our data provide insights into the developing mouse hindbrain and markers for functional assessment of understudied neuronal populations.
eTOC Blurb
Atoh1 plays a critical role in the development of neurons involved in hearing, breathing, and balance. In this study, Butts et al. track the Atoh1-lineage throughout development, demonstrating key transcriptional events that drive neural fate decisions and identifying markers of brainstem nuclei.
Graphical Abstract

Introduction
The hindbrain is crucial to autonomic function, proprioception, and motor control, coordinated through interactions among diverse neuronal groups in the brainstem, cerebellum, and broader central nervous system (CNS). Despite its functional importance, our understanding of the transcriptional trajectories driving the development of diverse neuronal populations in the hindbrain remains limited. Understanding the role of proneural transcription factors, such as Atonal homolog 1 (Atoh1), are key to elucidating this development, as they initiate the molecular cascade necessary for establishing neuronal diversity in CNS.
The development of many sensory neuronal lineages in the hindbrain requires the basic-helix-loop-helix transcription factor Atoh11–7. Mouse models lacking Atoh1 exhibit neonatal lethality due to respiratory failure1. In humans, a homozygous missense mutation in ATOH1 has been associated with developmental delay, hearing deficits, and pontine hypoplasia 8. Lastly, phosphorylation of ATOH1 is necessary for the development of Sonic Hedgehog (SHH) medulloblastoma, a subtype of one of the most prevalent pediatric brain cancers9. Atoh1’s critical role in development in disease underscores the need to better understand neural fate decisions within the Atoh1-lineage.
In the hindbrain, Atoh1 is expressed in the most dorsal neuroepithelium known as the rhombic lip (RL)10. Atoh1 progenitors in the RL give rise to over 30 distinct nuclei in the brainstem and to excitatory neurons in the cerebellum, which collectively are critical for hearing, proprioception, arousal, breathing, and motor function2,3,11. Lineage tracing experiments have revealed distinct stages in Atoh1-lineage development, including progenitor proliferation and maintenance at the RL, migration away from the RL, and maturation into functional neurons3. Atoh1-expressing progenitors arise at the RL at mouse embryonic day (E)9.5 and persist until E16.52. Around E10.5, progenitors leave the RL in time-specific migration streams, giving rise to differentiating Atoh1-lineage cell types (Figure 1A)2,3. The upper RL (URL) generates excitatory neurons in the cerebellum and rostral pons including cerebellar granule neurons and neurons in the rostral pontine tegmentum via the rostral rhombic lip stream (RLS)1,2,6,7. Progenitors from the lower RL (LRL) migrate through the anterior extramural stream (AES), cochlear extramural stream (CES), posterior pre-cerebellar extramural stream (PES), and caudal rhombic lip migration stream (CLS) to produce the basilar pons, cochlear nuclei, and various nuclei in the medulla2–6. The Atoh1-lineage also gives rise to neurons in the caudal pons, including the vestibular nuclei (Ve), the superior olive nucleus (SON), and intermediate lateral lemniscus (ILL) 3,12–15. Although it is firmly established that Atoh1 gives rise to these critical nuclei, the transcriptional cues that initiate the migration and fate decision of these cells are largely unknown.
Figure 1: Description of Atoh1-lineage development and scRNA-seq experimental design.

(A) Schematic depicting Atoh1-lineage migration streams and differentiating nuclei location and function. Abbreviations in Supplemental Table 1.
(B) Schematic of genetic mouse alleles used to track real-time Atoh1 expression (Atoh1-GFP fusion allele) and constitutively track the Atoh1-lineage (Atoh1Cre/+ knock in; Rosa26lsl-TdTomato/+).
(C) Light sheet microscopy image of E13.5 optically cleared embryo, αGFP for ATOH1 (green), TdTom (red), DAPI (blue), scale bar = 500 μm.
(D) Schematic depicting scRNA-seq sample preparation from hindbrain tissue dissection.
(E) UMAP of 24 samples representing 183,027 cells colored by sample. For each timepoint, at least 3 embryos from 2 distinct litters were used.
(F) Expression of Atoh1 and TdTom (through expression of WPRE) visualized on the UMAP.
(G) UMAP of full dataset with cells colored by cluster.
Prior studies have qualitatively assessed the Atoh1-lineage in the hindbrain, but they have lacked the transcriptomic resolution required to understand how neural fate decisions are made. Here, we capture the transcriptional changes of the Atoh1-lineage in mice from E9.5 to E16.5 with single cell RNA-sequencing (scRNA-seq). We also profiled DNA binding of ATOH1 at E12.5 and E14.5 to assess the loci at which ATOH1 influences neural fate decisions. Using these data and extensive in vivo validations, we uncover important biological insights into the diversity of Atoh1 progenitors, drivers of neuronal migration, and markers of brainstem nuclei. We also leverage these data to characterize a proliferating unipolar brush cell progenitors in the mouse Atoh1-lineage that is thought to be the origin of a subtype of medulloblastoma. While there have been many reports of single cell atlases of various mouse brain regions16,17, this is an in-depth characterization of a single lineage in the brainstem.
Results
Development of Atoh1-lineage and establishment of scRNA-seq dataset.
To track the Atoh1-lineage fate decisions from progenitors to differentiating neurons (Figure 1A), we utilized a combination of two genetic mouse models. The first allele, an Atoh1-GFP fusion, allows for real-time tracking of Atoh1-expressing cells (Figure 1B)11. Because Atoh1 is expressed early in development, this population consists of progenitors and early migrating cells. Atoh1 expression is downregulated with differentiation and GFP-expression is lost11. To trace the migrating and differentiating cells derived from Atoh1 progenitors, we used an Atoh1-Cre knock-in mouse allele combined with a Rosa26-lsl-TdTomato reporter (Figure 1B)18. Crossing all three together allowed us to track both the Atoh1-expressing (GFP+) and the Atoh1-lineage populations (TdTomato+) within the same embryo. We evaluated if there was ectopic expression of the Atoh1-Cre reporter line in the hindbrain at E14.5 by comparing TdTomato (TdTom) expression across multiple sections of Atoh1Cre/FlpO; Rosa26TdTomato/+ (Atoh1-null)19 embryos to Atoh1Cre/+; Rosa26TdTomato/+ (WT) embryos. We did not observe TdTom signal outside of the RL when functional ATOH1 was lost, providing confidence that the TdTom+ cells we analyzed are from the Atoh1-lineage (Figure S1A-B). Lightsheet imaging of an optically cleared E13.5 embryo demonstrated the expected spatial distribution of GFP and TdTom fluorescence (Figure 1C): GFP was expressed at the RL and in newly migrating cells, whereas TdTom was expressed in later migrating and differentiating populations.
To determine the transcriptional changes that drive Atoh1-lineage fate decisions, we performed scRNA-seq in the mouse hindbrain from E9.5, E10.5, E11.5, E12.5, E13.5, E14.5, and E16.5 embryos. Because the Atoh1-lineage comprises ~5% of the total hindbrain tissue as estimated from fluorescent activated cell sorting (FACS), we dissected and dissociated the embryonic hindbrains to sort the Atoh1-lineage into GFP+ and TdTom+ populations. For E9.5 and E10.5, we collected only GFP+ cells because the number of TdTom+ cells was minimal. For E11.5 – E16.5, we combined GFP+-only and GFP+/TdTom+ cells into one sample and kept TdTom+-only cells separate. We then prepared the sorted cells into scRNA-seq libraries as detailed in Methods (Figure 1D).
We recovered 229,782 cells across 7 developmental timepoints and 24 samples. Following the removal of doublets20, low-quality cells, and extraneous clusters (including inhibitory cells, meninges, endothelial cells, white blood cells, smooth muscle cells, and platelets), there were 183,027 Atoh1-lineage cells available for downstream analyses (see Methods). We performed standard dimensionality reduction and cell clustering on the full dataset. In the uniform manifold approximation and projection (UMAP)21 visualization of the clusters, we observed a smooth transition from early embryonic stages in the upper left of the plot to later staged TdTom+ cells in the bottom right (Figure S2A) with overlap of the two replicates (Figure S2B). Moreover, GFP+ cells were abundant on the left side of the UMAP, followed by stream-like clusters in the middle that lead to TdTom+ cells on the right side of the UMAP, indicative of increasing neuronal differentiation (Figure 1E). Consistent with this, Atoh1 expression was highest on the left side of the UMAP, and WPRE—the 3’ genetic element of the TdTom transcript—was highest on the right side (Figure 1F).
A transcriptional map of hindbrain Atoh1-lineage development.
Unsupervised clustering detected a total of 40 clusters (Figure 1G). We performed differential gene expression analysis and visualized the expression of canonical markers to annotate each cell type (Supplemental Table 1). These markers included genes involved in neuronal developmental cell state, rostral-caudal identity, and Atoh1 target genes3,5,22,23. The expression patterns of Mki67 (dividing cells), Sox2 (neural progenitors), Nhlh1 (migrating cells), and Mapt (differentiating neurons) further demonstrated the increase in neuronal maturity along the x-axis of the UMAP (Figure 2A)24,25. While Nhlh1 has been used to annotated migrating cells in the AES25, we found Nhlh1 to be expressed across all migration streams and confirmed this finding by dual fluorescent RNA in situ hybridization (ISH, Figure S2C-E). Further, the use of Mki67, Sox2, Nhlh1, and Mapt to track cell state were confirmed by ISH across the AES migration stream (Figure S3A-D).
Figure 2: Annotation of Atoh1-lineage throughout development and differentiating Atoh1-lineage nuclei.

(A) UMAP visualization of expression of markers for progression through cell state.
(B) UMAP visualization of expression of rostral-caudal identity markers – En1 and En2 (rostral), Hoxa2 and Hoxb5 (caudal).
(C) UMAP of full dataset with cells colored by migration trajectory.
(D) Dot plot displaying marker genes for each migration trajectory.
(E) UMAP of cells with Mapt expression > 2.5 colored in blue.
(F, G) UMAP of differentiating subset with cells colored by cluster (F) and sample (G).
(H) UMAP annotating differentiating Atoh1-lineage neurons. Abbreviations in Supplemental Table 1.
(I, K, M, O, Q) Expression of differentiating markers visualized on the UMAP.
(J, L, N, P, R) In situ hybridization of coronal E14.5 mouse embryo, Tcf24, Kcnip2, Sox7, Arid5a, and Spx (green), TdTom (red), DAPI (blue), scale bar = 1 mm; inset identified by dotted square, scale bar = 100 μm.
The URL and LRL migration streams were identified using canonical markers for each (En1 and En2 for the URL; Hoxa2 and Hoxa5 for the LRL, Figure 2B)26,27. Specific Atoh1 nuclei are further defined based on their expression of Atoh1 targets, such as Barhl1, Barhl2, Lhx2, and Lhx9 (Figure S4A)3,22. To assign identities to the full dataset, we defined clusters into a progenitor state and migration stream lineages using a combination of factors, including developmental timing, cell state, rostral-caudal identity, and known markers of the Atoh1-lineage (Figure S4B, Supplemental Table S1). We successfully identified the known Atoh1-lineage migration streams and their corresponding differentiating lineages, which together we call migration trajectories. Known migration trajectories include the cerebellar (cb) RLS, Early RLS, CES, AES, PES, and CLS. We identified an early migratory population expressing both rostral and caudal markers that we label the “Early Pons”. Excitingly, we also identified a migration stream corresponding to neurons in the caudal pons that we label the “Caudal Pons”. While prior studies had described Atoh1-derived cells in the pons, they were unable to define their migration origins3,12. We also annotated a spinal cord population, somatostatin-expressing neurons, and non-RL derived populations.
We then used differential gene expression to identify additional markers for each annotated cluster (Figure 2C, 2D). For this study, we define differentially expressed genes as minimum percentage ≥ 0.25 and log fold change ≥ 0.25 (Methods). Two previously undescribed markers for the “Early Pons” and “Caudal Pons” include Onecut2 and C1ql3. The Onecut family of transcription factors has been implicated in neuronal patterning28, and here it may be involved in the development of a specific Atoh1-lineage in space (early and caudal pons) and time (from the E10.5-E12.5 timepoint). The expression of C1ql3 is typically involved in regulating excitatory synapse density29.
Transcriptional definition of differentiated Atoh1-lineage nuclei and discovery of brainstem nuclei markers.
We have poor understanding of the transcriptional identity of the 30 Atoh1-lineage nuclei. Thus, after annotating the migration trajectories, we sought to transcriptionally define the differentiating nuclei. To annotate the differentiating cell types, we selected and re-clustered neurons with high Mapt expression (expression > 2.5, Figure 2E-F, S4C-D,). As expected, this subset mostly contained TdTom+ cells that are skewed towards later developmental timepoints (E10.5-E16.5; Figure 2G). Considering sample timepoint, we analyzed expression patterns of Hox genes, known Atoh1-lineage markers, neurotransmitters, and differentially expressed genes to resolve over 25 neuronal populations (Figure 2H, Supplemental Table 1).
To aid in cluster identification and validation, we performed ISH on Atoh1Cre/GFP; RosaTdTom/+ E14.5 mouse embryos. We found Rora to be expressed in the principal trigeminal nucleus (Pr5), vestibular nuclei, rostral pons, and the spinal trigeminal (Sp5) (Figure S4E). Both Rgs4 and Pou4f1 had localized expression to the caudal medulla, including the cuneate (Cu) and gracile (Gra) nuclei. In the MdD, Rgs4 expression was more restricted compared to Pou4f1 (Figure S4F and S4G).
Some markers were largely restricted to single clusters of neurons, suggesting they might provide markers of Atoh1-derived nuclei. For example, Tcf24, a putative transcription factor, was specifically expressed in cluster 31 (Figure 2F, I). Following ISH for Tcf24 in combination with TdTom, we localized this population to the intermediate lateral lemniscus (ILL, Figure 2J). Tcf24 and TdTom expression overlapped with additional genes expressed within the top 10 genes of cluster 31 including Onecut3, C1ql1, and Islr2, providing additional markers for the ILL (Figure S5A). Kcnip2 (encoding a voltage-gated potassium channel interacting protein) and Sox7 (encoding an SRY-related HMG-box transcription factor) were expressed in different subdivisions of cluster 11 (Figure 2F, 2K, and 2M). ISH revealed Kcnip2 localized to the superior olive nucleus (SON, Figure 2L), whereas Sox7 was expressed in the vestibular nuclei (Figure 2N). Arid5a (AT-Rich Interaction Domain 5A) was expressed in clusters 10 and 33 (Figure 2F, 2O). ISH confirmed that the expression of Arid5a was concentrated in the ventral cochlear nuclei (Figure 2P). Spx, which encodes the protein for Spexin hormone, was expressed in part of cluster 8, initially broadly annotated as the rostral pons nuclei (Figure 2F-H, 2Q). Dual ISH for Spx and TdTom further narrowed this population to be expressed largely in the pedunculopontine tegmental nuclei (PPTg, Figure 2R). Spx and TdTom expression overlapped with additional genes expressed within the top 10 genes of cluster 8 including Nr4a2, C1ql4, and Prph, providing additional markers for the PPTg (Figure S5B). These markers could provide increased experimental access to explore the development and function of these Atoh1-lineage brainstem nuclei.
Annotated Atoh1-lineage populations are lost upon loss of functional ATOH1
To ensure the annotated populations are truly of the Atoh1-lineage, we evaluated the presence of a few Atoh1-lineage markers in Atoh1Cre/+; Rosa26TdTomato/+ (WT) and Atoh1Cre/FlpO; Rosa26TdTomato/+ (Atoh1-null) E14.5 embryos (Figure S5C-G). We observed loss of the identified Atoh1-lineage markers (Spx, Tcf24, and Sox7), in comparable sections of hindbrain tissue with loss of ATOH1 (Figure S5D-F). We also observed loss of C1ql3+/TdTom+ and Pou4f1+/TdTom+ regions but not full loss of C1ql3 or Pou4f1 with loss of ATOH1 suggesting these genes are expressed more broadly across hindbrain tissue (Figure S5C and G).
Atoh1 progenitors are heterogenous in developmental time and space.
The Atoh1-expressing progenitor population persists at the RL throughout development, but it is unclear whether this population remains transcriptionally similar through this duration or whether it changes with time and/or spatial location (Figure 3A). To address this question, we subset and reclustered the cycling progenitor cells (i.e., Mki67 >1, Figure 3B, S6A-B). The cycling progenitor subset consisted mostly of GFP+ cells with a few TdTom+ cells from the E16.5 timepoint (Figure 3C). Unbiased clustering revealed distinct clusters that appeared to be driven by embryonic time point and rostral-caudal identity, suggesting a level of heterogeneity among the proliferating Atoh1-lineage (Figure 3D and Figure S6C). Differential gene expression analysis also revealed that these cycling progenitor populations expressed different marker genes (Figure 3E).
Figure 3: Atoh1 progenitors are heterogenous in developmental time and space.
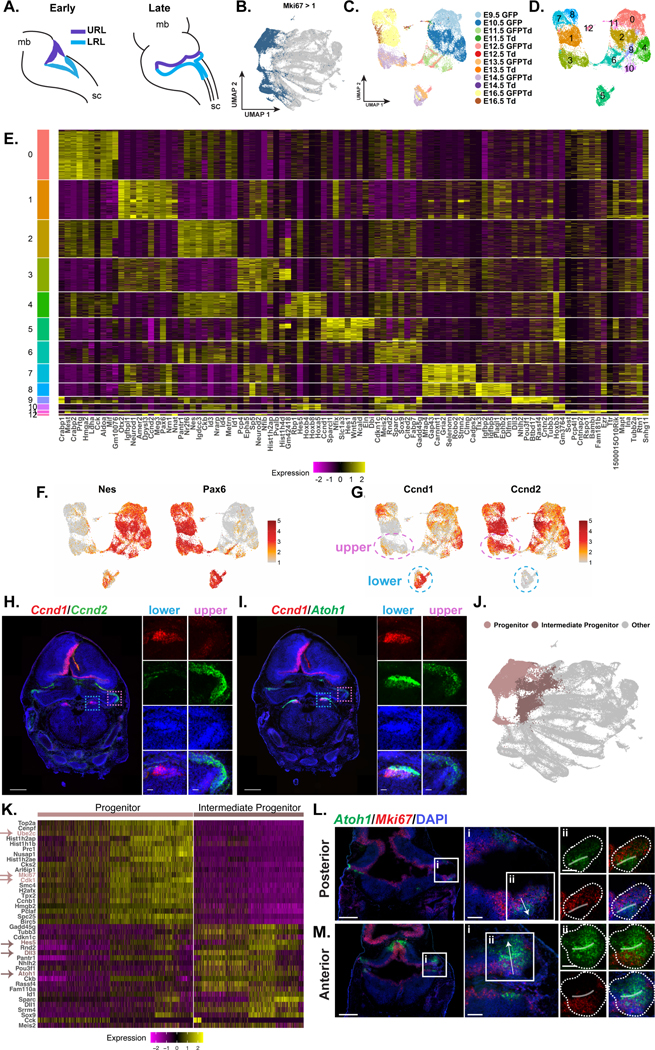
(A) Schematic depicting Atoh1 progenitors at the RL in early and late developmental stages. mb = midbrain, sc = spinal cord
(B) UMAP of cells with Mki67 expression > 1 colored in blue
(C, D) UMAP of cycling Atoh1 progenitor subset with cells colored by sample (C) and cluster (D).
(E) Heatmap of top 10 marker genes for each cluster. Yellow denotes upregulation and purple denotes downregulation.
(F) Expression of Nes and Pax6 visualized on the UMAP.
(G) Expression of Ccnd1 and Ccnd2 visualized on the UMAP. URL cells from E13.5 and E14.5 circled with dotted pink outline. LRL cells from E13.5 and E14.5 circled with dotted blue outline.
(H, I) ISH of coronal E14.5 RL, Ccnd2 (H) and Atoh1 (I, green), Ccnd1 (red), DAPI (blue), scale bar = 500 μm. Upper and lower RL inset identified by pink and blue dotted line, respectively, scale bar = 50 μm.
(J) UMAP of full dataset with cells colored to denote the progenitors and intermediate progenitors.
(K) Heatmap of top 20 genes upregulated in progenitors and intermediate progenitors. Yellow denotes upregulation and purple denotes downregulation. Arrows denote genes mentioned within the text.
(L, M) ISH of posterior LRL (L) and anterior URL (M) coronal E12.5 embryos, Atoh1 (green), Mki67 (red), DAPI (blue), scale bar = 500 μm. i) Signifies zoomed in area. Arrow denoting direction of migrating cells, scale bar = 100 μm. ii) Signifies further zoomed in area. Dotted lines outline the Atoh1 expression area. Opaque line is drawn over peak Atoh1 expression. Scale bar = 100 μm.
Of note, there were two broad groups of clusters separated by expression of Nes and Pax6 (Supplemental Table 1). Visualization of Nes and Pax6 expression reveals the progenitor population shifts from Nes expression at early developmental stages (E9.5 – E12.5) to Pax6 expression at later stages (E12.5 – E16.5, Figure 3C and 3F). When we considered the expression of Nes and Pax6 in the full dataset, it was strikingly clear that the distinction in gene expression persists throughout development. The progenitors that give rise to early migrating populations express Nes, whereas progenitors that give rise to later migrating populations express Pax6 (Figure S6D). Interestingly, Nes appears to be downregulated as cells differentiate, whereas Pax6-derived lineages continue to express Pax6 throughout migration.
Further, we identified two cyclin family genes, Ccnd1 and Ccnd2, among the top 10 differentially expressed genes for each cluster to be distinct between the rostral (upper) and caudal (lower) populations (Supplemental Table 1). More specifically, at E13.5 and E14.5, there was high expression of Ccnd1 in the lower progenitors but not in the upper progenitors. Conversely, high expression of Ccnd2 was found in the upper progenitors but not in the lower progenitors (Figure 3G). To confirm in vivo, we performed ISH on E14.5 coronal sections. Indeed, Ccnd1 was expressed at the LRL and Ccnd2 was expressed at the URL (Figure 3H). We also confirmed that Ccnd1 and Ccnd2 were co-expressed with Atoh1 in these populations (Figure 3I, S6E). Further, we observed Atoh1+/Ccnd1− cells which we believe correspond to the migrating cell population (Figure 3I). Altogether, these data suggest that although the cycling progenitors are maintained at the RL throughout development, they change transcriptionally in space and time, and are primed for neuronal fate decisions prior to migration.
Atoh1 is upregulated as proliferating progenitors leave the RL.
There were three clusters in the full dataset that expressed Nes and Sox2 but low levels of Mki67, which we deemed were intermediate progenitors (clusters 7, 8, and 35 in Figure 1G and Figure S4B). We investigated the transcriptional differences between these two progenitor states to understand what drives the transition from proliferation to a post-mitotic state (Figure 3J). Differential expression analysis between these populations revealed that cycling progenitors expressed genes related to cell proliferation and cycling (e.g., Ube2c and Cdk1), which were downregulated in the intermediate progenitor population. The intermediate progenitor displayed increased expression of Notch signaling pathway genes, including Hes5, Dll1, and Dll3, but most notable was its increased expression of Atoh1 (Figure 3K, Supplemental Table 1). The Notch signaling pathway is important for differentiation of Atoh1 populations in other tissues, including the inner hair cells of the cochlea and secretory cells in the intestine30,31. Gene Ontology (GO) analysis of upregulated genes in the progenitor cells revealed enrichment of several cell division ontologies, such as “mitotic spindle organization” and “mitotic sister chromatid segregation” (Figure S6F). Upregulated genes in the intermediate progenitors were enriched for terms more relevant to neuronal progenitor development, including “generation of neurons” and “negative regulation of cell population proliferation” (Figure S6G). This finding suggests that the increase of Atoh1 expression initiates neuron differentiation.
To investigate whether the downregulation of a cell proliferation program and upregulation of Atoh1 corresponds to a change in spatial organization, we performed ISH for Atoh1 and Mki67 on E12.5 embryos. Mki67 expression lined the border of the 4th ventricle (Figure 3L and 3M). At the RL, which is best visualized on the lateral edges, Atoh1 expression was present but at low levels in the Mki67+ regions (Figure 3Li and 3Mi). The highest expression of Atoh1 (opaque line) was more lateral to the 4th ventricle and corresponded to loss of Mki67 expression (Figure 3Lii and 3Mii). This pattern was present in the upper and lower RL and across posterior and anterior sections. The finding that progenitors migrate away from the RL as Mki67 is downregulated and Atoh1 is upregulated is consistent with the scRNA-seq data. Together, this suggests that the cycling progenitor population is maintained at the RL and once Atoh1 is upregulated, the cycling program is downregulated as cells begin to migrate and differentiate.
ATOH1 is functionally critical during migration.
The observation that Atoh1 is upregulated as cells start to leave the RL raises the question of where the ATOH1 protein is functionally critical. To address this question, we categorized the full dataset clusters into 5 broader groups using markers of cell state: progenitors (Mki67 and Ube2c), intermediate progenitors (Sox2, Nes, and Atoh1), migrating_1 (Atoh1 and Nhlh1), migrating_2 (Nhlh1, Mapt, and Slc17a6), differentiating (Mapt and Slc17a6), and “non-RL derived” cells (Figure 4A, B).
Figure 4: Atoh1 is functionally critical during migration.

(A) UMAP of full dataset with cells colored by cell state.
(B) Violin plots of genes demarcating cell state.
(C) Odds ratio describing enrichment of upregulated DEGs that contain ATOH1 binding peaks across cell state. Bonferroni adjusted p-value for each cell state denoted on the graph. Error bars denote 95% confidence interval. For the CUT&RUN study, 28 embryos from 4 litters were combined and for E14.5, 24 embryos from 3 litters.
(D) UMAP displaying the module score of the average expression change of genes with ATOH1 binding peaks.
(E) Ridge plot of the Module Score by cell state. * denotes Bonferroni adjusted p-value < 3.8×10−79.
(F, G) ISH of RL of Atoh1Cre/+; Rosalsl-TdTom/+ and Atoh1Cre/FlpO; Rosalsl-TdTom/+ coronal E12.5 embryos, Sox2 (green), Cre (F) and TdTomato (G) (red), and DAPI (blue), scale bar = 500 μm; inset identified by dotted square, scale bar = 100 μm.
(H) Percent of Cre+ area that is Sox2+. Statistic was performed for 3 sections per group from 3 independent litters by a linear mixed model (ꭓ2(1) = 0.652, p=0.42). The same color dot denotes embryos from the same litter. Cross bar denotes the median.
ATOH1 binds DNA to regulate gene expression32,33. To determine which genes are direct targets of ATOH1, we performed Cleavage Under Target and Release Using Nuclease (CUT&RUN)34 in GFP+ and GFP− populations at E12.5 and E14.5. ATOH1 peaks were determined by comparing the enrichment of GFP signal in GFP+ versus GFP− cells. (Figure S7A). De-novo motif analysis identified an E-Box consensus motif consistent with studies of ATOH1 binding in the postnatal cerebellum and hair cells of the cochlea with 66.6% and 66.5% of peaks containing a motif in the E12.5 and E14.5 samples, respectively (Figure S7B)32,35. To validate these findings, we demonstrated that known ATOH1 targets (Atoh1, Barhl1, and Lhx9) had robust peaks, whereas Neurog2, a different proneural transcription factor, showed no peaks (Figure S7C).
To determine the cell state where ATOH1 binding is most actively driving gene expression changes, we tested for enrichment of ATOH1 binding peaks in upregulated differentially expressed genes across each cell state. We determined ATOH1 targets by curating genes that either had a peak within 5,000 base-pairs of its transcription start site or a peak within the gene body at E12.5 or E14.5. (11,218 peak-containing genes, Supplemental Table 2). We found that ATOH1 binding was significantly enriched in the migrating_1 (Fisher’s exact test p=8.3×10⁻²⁵, Odds Ratio (OR)=1.90), migrating_2 (p=2.7×10⁻³², OR=1.97), and differentiating cell states (p=2.3×10⁻⁵, OR=1.28) (Figure 4C). To further validate this observation, we calculated Module Scores36 for the list of ATOH1 target genes determined by the CUT&RUN experiment across the dataset. Consistent with the enrichment analysis, peak-containing genes were significantly upregulated in the migrating_1, migrating_2, and differentiating cell states (Bonferroni-adjust p = 7.1×10−88, p<1.00×10−302, and p<1.00×10−302, respectively; Figure 4D-E). Collectively, these results suggest ATOH1 drives transcriptional changes in migrating cells of the Atoh1-lineage.
Evaluation of progenitor development and migration without functional ATOH1
Whereas Atoh1 is described as a proneural transcription factor initially expressed at the RL, our results reveal a substantial role for ATOH1 in the migration of Atoh1 progenitors away from the RL. To evaluate this further, we compared E12.5 embryos with functional ATOH1 (Atoh1Cre/+; RosaTdTom/+) to embryos without functional ATOH1 (Atoh1Cre/FlpO; RosaTdTom/+) to assess whether loss of ATOH1 affects progenitor generation and migration19. To identify Atoh1 progenitors, we performed ISH for Sox2 (progenitor marker) and Cre (indicative of Atoh1 expression).
Surprisingly, we were able to identify Cre+/Sox2+ populations in both the Atoh1Cre/+; RosaTdTom/+ and Atoh1Cre/FlpO; RosaTdTom/+ animals, suggesting that Atoh1 progenitors are generated in the absence of functional ATOH1 (Figure 4F, 4H, and S7D-E). We then performed ISH for Sox2 and TdTom to demarcate migrating Atoh1-lineage neurons away from progenitors. While robust signal was present in the Atoh1Cre/+; RosaTdTom/+embryos, little TdTom signal was observed in the Atoh1Cre/FlpO; RosaTdTom/+ embryos (Figure 4G). Given that progenitors are still born in ATOH1-deficient mice, a critical role of ATOH1 seems to be in progenitor migration away from the RL.
The transcriptional signatures of Atoh1 migrating populations.
Atoh1-lineage neurons leave the RL through migration streams that occur at specific developmental stages (Figure 5A). Previously we annotated migration trajectories along with their corresponding differentiating lineages (Figure 2C). To understand more about the timing and transcriptional changes that drive migration initiation, we focused on the clusters from the “migrating_1 or migrating_2” category for each migration stream (Figure 5B). To determine if we observed the same time dependency in migration initiation within our transcriptional dataset, we assessed the number of cells from the GFP+/TdTom− or GFP+/TdTom+ samples within the different migrating clusters across time. We removed TdTom-only samples as we have determined those cells are likely more mature and further removed from the migration initiation process. Indeed, the computationally annotated migration streams were comprised of specific developmental stages reflecting the time dependency observed in vivo (Figure 5C).
Figure 5: Atoh1-lineage migration streams have both a shared and unique transcriptional signature.

(A) Cartoon of Atoh1-lineage migration streams.
(B) UMAP of full dataset with cells colored by migration stream.
(C) Line plot denoting the number of cells from each sample for each migration stream.
(D) UMAP of migration streams colored by pseudotime reordering. Gray denotes early pseudotime, purple denotes later pseudotime.
(E-G) Line plot depicting expression of cell state genes (E), shared genes (F), and unique genes
(G) plotted as a function of pseudotime for each migration stream.
(H) Example of ATOH1 binding peaks on genes shared between migration streams.
Because the migration events of each stream occur at different developmental stages, we wondered whether ATOH1 regulates a shared set of genes in each of these migratory streams. We analyzed six migration streams—the early pons, CLS, caudal pons, PES, CES, and AES-early—to answer this question. We excluded the later migration streams for which migration is not yet complete by E16.5. To identify genes shared among migrating cells, we overlapped the marker genes across the six migration streams. We identified 38 genes that were shared across at least five of the six clusters (Supplemental Table 1). Due to the differences in developmental timing, we reordered the migrating cells and their corresponding intermediate progenitor cluster in pseudotime to compare gene expression levels during migration (Figure 5D). After pseudotime reordering, the gene expression changes of cell state genes (Mki67, Sox2, and Mapt) changed similarly across migration streams despite occurring at different embryonic stages, confirming the validity of reordering (Figure 5E). The expression of the genes (Atoh1, Dll3, Mfng, Lzts1, Gadd45g, and Cntn2) that were shared between migration streams changed similarly over pseudotime (Figure 5F). We confirmed these shared migratory genes are expressed in migrating cells in vivo by evaluating expression across the AES and CES migration streams in E14.5 embryos (Figure S8A-B). Among the shared genes were Dll3 and Mfng of the Notch signaling pathway, again suggesting a potential role of Notch signaling in progenitors leaving the RL. Of the 38 genes that were found in at least 5 of the 6 migration streams, 35 genes contained an ATOH1 binding peak (92.1%, whereas 36.12% of all genes detected by single cell contained an ATOH1 binding peak) further confirming the role of ATOH1 in molecularly instructing the migration process (representative gene tracks – Dll3, Mfng, and Lzts1, Figure 5H).
Although each lineage migrates from the RL, differentiated neurons reside in spatially different locations and carry out distinct functions. We sought to determine whether there were uniquely expressed genes in each migration stream that specify final spatial location. We identified the following genes whose expression distinguished one migration stream from another: Pxylp1 (early RLS), Lgals1 (Early Pons), Pou4f1 (CLS), C1ql3 (Caudal Pons and shared with Early Pons), Pvalb (CES), and S100a6 (AES, Figure 5G, Supplemental Table 1). We confirmed the specificity of these markers by assessing the unique migration gene expression in the migration streams in vivo (Figure S8C-H). Together, this suggests that while there is a shared transcriptional signature to specify migration, there are unique transcriptional programs for each stream to direct their final migration to their respective areas in the hindbrain.
Investigation of the caudal pons migration stream reveals cell type-specific transcriptional differences.
We next examined a previously undescribed migration stream that ends in the caudal pons. To understand what cell types this stream gives rise to and define the transcriptional landscape, we subset and re-clustered the caudal pons lineage from the full dataset (Figure 6A-B, S9A-C). We determined that the migrating cells were comprised largely of cells from the E11.5 and E12.5 timepoints (Figure 6C). While some of cluster 2 expressed En2, this was likely a carried over progenitor from the RLS stream through sub-setting. More importantly, we find part of cluster 2 and the migrating population of this subset expressed Hoxa2 and not Hoxa5, consistent with a caudal pons identity (Figure S9D).
Figure 6: A caudal pons migration stream gives rise to nuclei involved in proprioception, hearing, and balance.

(A) UMAP depicting the caudal pons migration stream in the full dataset labeled in blue.
(B, C) UMAP of caudal pons lineage with cell colored by cluster (B) and sample (C).
(D) Expression of genes that change with neuronal maturation visualized on the UMAP.
(E-I) Expression of marker genes of differentiating populations.
(J, K) ISH of Atoh1Cre/GFP; Rosalsl-TdTom/+ coronal E14.5 embryos, Mafb (J), and Sncg (K) (green), TdTom (red), DAPI (blue), scale bar = 1 mm. Inset identified by dotted line, scale bar = 100 μm.
(L, M) UMAP with cells colored by differentiating identity (L) and lineage (M).
(N-Q) Gene expression visualized on the UMAP of progenitor genes (N), Lineage 1 genes (O), Lineage 2 genes (P), and Lineage 3 genes (Q).
(R) Cartoon depicting the caudal pons migration stream and the lineages that result in distinct differentiating cell types. Genes in black text denote shared expression. Genes in colored text denote lineage-specific genes.
Expression of markers for intermediate progenitors (Nes, Sox2, and Atoh1), migrating neurons (Nhlh1, Vcan, and C1ql3), and differentiating neurons (Slc17a6 and Mapt) demonstrated increased maturation along the x-axis of the UMAP (Figure 6D). To determine the specific nuclei that come from this lineage, we mapped the differentiating IDs (Figure 2H) onto the caudal pons subset and found the SON/Ve (clusters 6, 11, and 9), ILL (cluster 10), and Pr5 (cluster 5) Atoh1-lineages (Figure S9E). To further refine the marker genes of these differentiating populations, we performed differential gene expression on the caudal pons subset and identified Mafb (cluster 5), Kcnip2 (cluster 9), Tcf24 (cluster 10), and Sncg (cluster 11) as upregulated. We also found Sox7 to be a marker of cluster 6 that had shared expression with cluster 9. (Figure 6E–6I, Supplemental Table 1).
To spatially confirm the populations from the caudal pons, we performed ISH using Tcf24, Sox7 and Kncip2, which we defined as markers specifically expressed in the ILL, vestibular nuclei, and SON respectively (Figure 2J, 2N, 2L and S9F-H). We confirmed Mafb was expressed in the Pr5 (Figure 6J). However, we found Sncg expressed more specifically in the superior vestibular nuclei (Figure 6K). We also found low expression of Sncg in the ILL and the SON, consistent with the expression in the Tcf24+ cluster 10 and the Kcnip2+ cluster 9 (Figure S9I). Previous descriptions of the Atoh1-lineage nuclei were unable to identify the migration stream for the Pr5, SON, and vestibular nuclei, and the ILL was predicted to from rhombomere 2/3, though this was not confirmed3,12. Here we describe a caudal pons migration stream gives rise to these nuclei as well as the ILL (Figure 6L).
We next sought to define the transcriptional changes that drove the neural fate decisions in the caudal pons. To do this, we separated the caudal pons subset into a common progenitor population and three lineages that were visually distinct on the UMAP (Lineage 1, Lineage 2, and Lineage 3, Figure 6M). We performed differential gene expression analysis between these four groups to determine the transcriptional events upregulated in each lineage. The progenitor population expressed markers of early neurons (Id1, Nes, and Hes5, Figure 6N). Further, we identified upregulated genes unique to each lineage (Supplemental Table 1), including Neurod6, Nrgn, and Foxb1 in Lineage 1; Lmo3, Cartpt, and C1ql4 in Lineage 2; and Hoxa3, Maf, and Lamp5 in Lineage 3 (Figure 6O – 6Q).
To validate these findings in vivo, we utilized spatial transcriptomics to observe markers of the Pr5, ILL, and SON within the same tissue section (Figure S9J-M). We observed expression of the common migratory markers, Onecut2 and C1ql3 across all nuclei (Figure S9J) and the progenitor lineage overlapped with the differentiating population (i.e Neurod6 with Mafb for the Pr5, C1ql4 with Tcf24 in the ILL, and Lamp5 with Kcnip2 for the SON, Figure S9K-L).
While previous studies have evaluated the development of vestibular and auditory brainstem nuclei from the prospective of their rhombomere and dorso-ventral origin12–14,37, here we describe the Atoh1-lineage contribution to these nuclei. We have identified a previously unknown Atoh1-lineage migration stream consisting of three lineages that give rise to cells within five distinct nuclei (Pr5, ILL, SuVe, Ve, SON). Lineage 1 gives rise to the Pr5, which is involved in proprioception. Lineage 2 gives rise to the ILL, involved in hearing. Lastly, lineage 3 gives rise to the SON and two different vestibular nuclei involved in hearing and balance (Figure 6R).
Proliferative unipolar brush cell progenitors are located in the mouse RL.
Recent reports suggested a difference in the developing mouse and human cerebellum, with the human RL uniquely split spatially into the ventricular zone (RLVZ) and the subventricular zone (RLSVZ) by a vascular plexus38. Further, it has been proposed that human-specific expansion of the proliferative unipolar brush cell (UBC) progenitors within the human RLSVZ gives rise to group 4 (G4) medulloblastoma, the most prevalent pediatric brain cancer39–41. The same study suggested that proliferative UBC progenitors are present in limited quantities in the mouse RL39,42. Given that UBCs derive from the Atoh1-lineage7, we checked if the proliferative UBC progenitors – denoted by co-expression of Ki67 and Eomes (Tbr2) – could be found within our dataset. We first looked within the progenitor subset for expression of progenitor UBC and RLSVZ markers (Eomes, Pax6, Otx2, Cbfa2t2, and Cbfa2t3, Figure 7A). We were surprised and pleased to find a significant number of cells that co-express the progenitor UBC markers from the Atoh1-lineage in the rostral RL (En2+) at the E16.5 timepoint, which is consistent with UBC migration beginning at approximately E15.5 (Figure S6C and 3C)3.
Figure 7: Atoh1-derived proliferative UCB progenitors are abundant in the mouse RL.

(A) Gene expression of proliferating UBC progenitor markers visualized on the cycling progenitor subset UMAP.
(B) Immunofluorescence image of Atoh1Cre/+; Rosalsl-TdTom/+ coronal E16.5 embryos stained for Eomes (Tbr2, green), Ki67 (white), RFP (TdTom read out, red), and DAPI (blue). RL region outlined in light blue, scale bar = 250 μm. (i) Inset of the RL region, scale bar = 75 μm. (iia, iib) Insets of the differentiating (iia) and proliferating (iib) populations. Light blue outline depicts the Eomes+ area, scale bar = 25 μm.
(C) UMAP of cerebellar subset with cells colored by cluster.
(D) Expression of progenitor markers, shared URL genes, UBCs, and granule progenitors visualized on the UMAP.
(E, F) UMAP of Eomes-expressing cells with cells colored by cluster (E) and pseudotime reordering (F).
(G) Line plot depicting expression level as a function of pseudotime of Eomes-expressing cells.
(H) Expression of markers for proliferating UBC progenitors visualized on the UMAP. * indicate genes with ATOH1 binding determined by CUT&RUN.
(I) Odds ratio describing enrichment of upregulated differentially expressed genes in medulloblastoma (MB) subtypes among differentially expressed genes in mouse URL lineages. Bonferroni adjusted p-value for each cell state denoted on the graph. Error bars denote 95% confidence interval.
We next sought to visualize the Atoh1-lineage UBC progenitors (Ki67+/Eomes+) within the E16.5 Atoh1Cre/+; RosaTdTom/+ mouse embryos. Because the TdTom signal was quenched during antigen retrieval, we used an RFP antibody to amplify the original TdTom signal. We identified a pool of Ki67+/Eomes+/RFP+ cells within the mouse RL across several anterior to posterior coronal planes (Figure 7B and S10A). Interestingly, we also identified a Ki67-/Eomes+/RFP+ population rostromedial to the RL (Figure 7Biia). This spatial distinction in loss of Ki67 expression in the developing UBCs is consistent with what was previously described in the human as the “inner” and “outer” RLSVZ 39.
We next sought to define the transcriptional trajectory of this population. The UBC progenitors were largely detected during the E16.5 timepoint (Figure 3C). Therefore, we subset and reclustered clusters 14, 15, 20, and 23, which represent the cerebellar RLS cells, from the full dataset (Figure 7C, S10B-C). While there is shared expression of progenitor markers (Mki67, Cdk1) and rostral lineage markers (Pax6, Reln), a bifurcation separates the UBCs (Eomes, Otx2 – differentially expressed genes in clusters 2, and 0, 1, respectively) from the granule progenitors (Tlx3, Robo2 – differentially expressed genes in clusters 3,8, 9 and 3, 5, 11, respectively, Figure 7D, Supplemental Table 1). We further subset the Eomes-expressing cells from the UBC lineage and reordered cells in pseudotime to determine if this population follows the same transcriptional trajectory as described in human cells (Figure 7E-F, S10D). In humans, OTX2 is initially expressed in the proliferating UBC progenitors at the RL. OTX2 initially inhibits CBFA2T2 but expression of both OTX2 and CBFA2T2 decrease as UBCs mature39. Consistent with what was described from the human UBC lineage, we found Mki67 and Eomes are expressed at the same time but as Mki67 expression drops, Eomes levels rise. Further, Otx2 expression is high initially and declines with increased pseudotime. Cbfa2t2 appears to increase slightly after Otx2 decreases and then decreases with maturity (Figure 7G).
Prior data suggest that G4 medulloblastoma originates in the proliferating UBC progenitors39,40,42. Hence, to identify markers of those progenitors, we performed differential gene expression on the cerebellum subset comparing UBC progenitors (cluster 0) to EGL cells (clusters 6 and 9). Excitingly, we found genes unique to the UBC progenitors including Barx2, Npnt, Neurod4, and Mgarp (Figure 7H and S10E, Supplemental Table 1). Further, our CUT&RUN data revealed ATOH1 binds sequences at these genes. Importantly, our analysis revealed markers for developing UBCs, which could aid future investigations into this critically important cell type.
To determine if the mouse cerebellar Atoh1-lineage has transcriptomic similarity to human medulloblastoma tumors, we utilized existing bulk RNA-sequencing of human medulloblastoma tumors from the SHH, G4, and group 3 (G3) subtypes39. We looked for enrichment of marker genes from our cerebellar clusters (full dataset clusters: 15, 14, 23, and 20 for the cerebellar progenitors, UBCs, early EGL, and late EGL) in the significantly upregulated differentially expressed genes of the medulloblastoma subtypes (see Methods). As expected for the SHH subtype, we found enrichment of differentially expressed genes in the mouse Atoh1-lineage EGL (early EGL: Fisher’s exact test p=9.6×10⁻⁷, OR=2.38, late EGL: p=2.6×10⁻³, OR=1.71) and modestly in the cerebellar progenitor (p=0.041, OR=1.35) (Figure 7I). For G4, which is predicated to have an origin in the UBCs, we found enrichment of differentially expressed genes in our mouse Atoh1-lineage UBC population (p=2.5×10⁻⁶, OR=3.14) as well as in the late EGL cluster (p=8.3×10⁻¹², OR=2.82, potentially due to overlap in markers between the UCBs and EGL (Figure 7I). Interestingly, the origins of G3 are predicted to be from the early RL41 and dependent on Notch1 activity43, however, we do not observe significant enrichment of the G3 differentially expressed genes within our cerebellar Atoh1-lineage (Figure 7I). This comparison suggests there is transcriptional concordance in gene expression between human medulloblastoma tumor samples and the developing mouse Atoh1-lineage. Specifically, in the G4 subtype, we see that there is enrichment of the Atoh1-derived UBCs reinforcing this population is found in the mouse and highlighting the conservation between mice and humans.
Discussion
While there is strong evolutionary evidence that atonal drives sensory organ development44, there is a lack of knowledge of how a proneural transcription factor can orchestrate neuronal diversity especially in a functionally critical tissue as the hindbrain. Transcriptomic profiling across seven developmental time points helped us define the transcriptional changes that drive neural fate decisions of the Atoh1-lineage (Figure S11). This dataset provided annotation of Atoh1-derived populations and provided biological insights including the heterogeneity of Atoh1 progenitors, markers for the Atoh1-derived neurons, a shared transcriptional signature across different migration streams, the discovery of a migration stream giving rise to Atoh1-lineage nuclei in the caudal pons, and the presence of a sizable mouse proliferative UBC progenitor population with transcriptomic similarity to human G4 medulloblastoma. By focusing on the lineage from one proneural transcription factor, we further elucidated the developmental process that could inform future regenerative medicine strategies.
Prior to this study, it was not clear whether Atoh1 progenitors were the same or different as development progressed. We found that progenitors were transcriptionally heterogeneous through time and space (Figure 3E). Moreover, there was a drastic transition between Nes-expressing cells to Pax6-expressing cells around E13.5, suggesting only a subpopulation of progenitors go on to express Pax6 during differentiation. It is likely that the early migration streams (RLS, caudal pons, and CLS) are dependent on Nes expression, whereas the later pre-cerebellar streams (PES and AES) are dependent on Pax6. Additionally, the progenitors appeared to show spatial transcriptomic patterns. For example, at E14.5, Ccnd2 was expressed in the URL and Ccnd1 was expressed in the LRL (Figure 3G-H). Collectively, these results highlight that Atoh1-lineage fate decisions begin to be determined as early as the progenitor stage in the RL. Future experiments could verify these findings through clonal fate-mapping techniques to sparsely label Atoh1-progenitors and trace them through differentiation.
While Atoh1 is necessary for specification of many hindbrain cell types, the direct targets of ATOH1 during development of these nuclei were not known. By integrating the scRNA-seq with ATOH1 CUT&RUN data on the GFP+ population, we determined that ATOH1 binding was most enriched in the migrating cell populations (Figure 4C). Consistent with this, Atoh1 expression appeared upregulated as the Atoh1 progenitors leave the RL (Figure 3K). Also, ATOH1 peaks were identified on the regulatory regions of 92.1% of the common migratory genes (Figure 5F, 5H). By assessing embryos without functional ATOH1 protein, we confirmed that progenitors were generated but could not migrate. This critical finding—only made possible with recently developed tools—broadens our understanding of ATOH1 beyond just being expressed at the RL. This study provides the first crucial steps in defining transcriptional differences in Atoh1-lineage neural fate decisions and sets the stage for future studies in defining gene regulatory networks.
Recent pioneering studies have proposed unique aspects of human cerebellar development. These include a) the existence of the RL for a long developmental period compared to the mouse; b) a spatially distinct RLVZ and RLSVZ separated by a vascular plexus; and c) the expansion of the proliferative UBC progenitors – origin of G4 medulloblastoma – within the RLSVZ 38,39,42,45. Whereas it was previously thought that many of these aspects were human-specific, our data revealed that mice also have a proliferative UBC population (Eomes+/Ki67+). Hendriske et al. detected this population but described it as considerably smaller population than what we observed in this study39. Smith et al. concluded the Eomes and Mki67 were minimally co-expressed at the RL however they evaluated the mouse RL at E13.5 and E14.5, before peak UBC development42. Critically, our data suggest that we can use the mouse as a model system to study developmental processes that occur in humans and pathogenesis of medulloblastoma. Further, we show that the proliferative UBC progenitor is of the Atoh1-lineage and find transcriptional similarity between the mouse Atoh1-lineage UBC and human G4 medulloblastoma. While the role of ATOH1 in SHH medulloblastoma has been well established9, this finding suggests a potential role of the Atoh1-lineage in G4 medulloblastoma. Together, Atoh1 may have a role in over half of medulloblastoma cases, solidifying the need to better understand the biology of Atoh1-dependent progenitors and their lineages.
Limitations of the study
This study provides high resolution data on the sorted Atoh1-lineage and thus focuses on the transcriptomic changes that occur only in the Atoh1 population throughout hindbrain development. One limitation is that cell types developing adjacent to the Atoh1-lineage could be influencing developmental decisions but are not included in this analysis. Especially in the case of Notch signaling at the RL or during migration, cell-cell interactions likely influence cell fate decisions. One way to address this consideration would be to perform microdissection of cells at the RL to reveal how the Atoh1-lineage interacts with adjacent cell populations. Additionally, this dataset does not directly account for any soluble exogenous signaling from secreted factors, including neurotransmitters or neuropeptides that may be providing attractive or repellant cues for migration. For example, Di Meglio et al. describes Nertrin1 signaling from the floor plate is critical for migration of the AES46. While this dataset can detect receptors for different morphogens, which can indirectly clue us in on external stimuli involved in migration, integration of this dataset with a scRNA-seq dataset of the whole brainstem may reveal external cell populations directly involved in Atoh1-lineage fate decisions. Lastly, future studies are needed to perturb various genes described here to assess their role in fate decisions.
STAR Methods
RESOURCE AVAILABILITY
Lead contact
Further information and requests for resources and reagents should be directed to and will be fulfilled by the lead contact, Jessica Butts (Jessica.butts@Rice.edu).
Materials availability
This study did not generate new unique reagents.
Data and code availability
Single-cell RNA-seq data have been deposited at GEO and are publicly available as of the date of publication. The bulk RNA sequencing data from G3, G4, and SHH MB tumors were generated by Hendriske et al.39 and has been deposited in the European Genome-Phenome Archive (EGA). Accession numbers are listed in the key resources table. All original code has been deposited at GitHub and is publicly available as of the date of publication. DOIs are listed in the key resources table. Any additional information required to reanalyze the data reported in this paper is available from the lead contact upon request.
KEY RESOURCES TABLE
| REAGENT or RESOURCE | SOURCE | IDENTIFIER |
|---|---|---|
| Antibodies | ||
| chicken anti-GFP | Abcam | Cat# ab13970, RRID: AB_300798 |
| guinea pig anti-Tbr2 | Synaptic Systems | Cat# 483 005, RRID:AB_2943519 |
| mouse anti-Ki-67 | BD Biosciences | Cat# 556003, RRID:AB_396287 |
| rabbit anti-RFP | Rockland | Cat# 600–401-379, RRID:AB_2209751 |
| rabbit anti-GFP | Thermo Fisher Scientific | Cat# G10362, RRID:AB_2536526 |
| Normal Rabbit IgG | Millipore | Cat# 12–370, RRID:AB_145841 |
| goat anti-chicken-Alexa 488 | Thermo Fisher Scientific | Cat# A-11039, RRID:AB_2534096 |
| goat anti-guinea pig-Alexa 488 | Thermo Fisher Scientific | Cat# A-11073, RRID:AB_2534117 |
| goat anti-mouse-Alexa 647 | Thermo Fisher Scientific | Cat# A-21236, RRID:AB_2535805 |
| goat anti-rabbit-Alexa 555 | Thermo Fisher Scientific | Cat# A-21428, RRID:AB_2535849 |
| Chemicals, peptides, and recombinant proteins | ||
| Papain | Worthington | Cat # LK003178 |
| CUTANA™ pAG-MNase for ChIC/CUT&RUN Workflows | EpiCypher | Cat # 15–1016 |
| CUTANA™ E. coli Spike-in DNA | EpiCypher | Cat # 18–1401 |
| Critical commercial assays | ||
| Chromium Next GEM Single Cell 3’ GEM, Library & Gel Bead Kit v3.1 | 10X Genomics | PN-1000128 |
| NEBNext® Multiplex Oligos for Illumina | New England Biolabs | Cat # E6440S |
| NEBNext® Ultra™ II DNA Library Prep Kit for Illumina | New England Biolabs | Cat # E7645S |
| Deposited data | ||
| Single Cell RNA sequencing data and CUT&RUN data generated in this paper | This paper | GEO: GSE233966 |
| Code used to generate figures | This paper | DOI: 10.5281/zenodo.12572621 |
| Bulk RNA sequencing from human medulloblastoma samples | Hendriske et al.39 | EGA: EGAS00001005826 |
| Experimental models: Organisms/strains | ||
| Mouse: Atoh1GFP/+ | Jackson Laboratory | RRID:IMSR_JAX:013593 |
| Mouse: Atoh1Cre/+ | Yang et al.18 | N/A |
| Mouse: Atoh1FlpO/+ | Jackson Laboratory | RRID:IMSR_JAX:03654119 |
| Mouse: Rosa26 lsl-TdTom/+ | Jackson Laboratory | RRID:IMSR_JAX:007914 |
| Mouse: wild type C57BL/6J | Jackson Laboratory | RRID:IMSR_JAX:000664 |
| Oligonucleotides | ||
| Probes for in situ hybridization | This Paper | Supplemental Table 3 |
| Software and algorithms | ||
| ImageJ2 v2.9.0 | Schindelin et al.53 | https://imagej.net/software/imagej2/ |
| Monocle3 | Trapnell et al.60 | https://cole-trapnell-lab.github.io/monocle3/ |
| Cell Ranger Version v5.0.1 | 10X Genomics | https://www.10xgenomics.com/support/software/cell-ranger/latest/release-notes/cr-release-notes |
| Seurat v3.5.1 | Hao et al.55 | https://github.com/satijalab/seurat |
| DoubletFinder v2 | McGinnis et al.20 | https://github.com/chris-mcginnis-ucsf/DoubletFinder |
| Bedtools v2.29.1 | Quinlan et al.65 | https://bedtools.readthedocs.io/en/latest/ |
| Trimmomatic v0.36 | Bolger et al.62 | http://www.usadellab.org/cms/?page=trimmomatic |
| MACSr v1.00 | Hu et al.66 | https://www.bioconductor.org/packages/release/bioc/html/MACSr.html |
| IGV v2.11.1 | Robinson et al.67 | https://software.broadinstitute.org/software/igv/ |
| MEME suite v4.11.2 | Bailey et al.64 | https://meme-suite.org/meme/ |
EXPERIMENTAL MODEL AND STUDY PARTICIPANT DETAILS
Mouse husbandry
The following mice were used in this study: Atoh1GFP/+ – JAX:01359311, Atoh1Cre/+ - Yang et al.18, Atoh1FlpO/+ – JAX:03654119, Rosa26 lsl-TdTom/+ – JAX:007914, wild type C57BL/6J - JAX:000664. All mice were backcrossed to C57BL/6J background. All mice were housed in a level 3, AALAS-certificated facility on a 14-hour light cycle. Husbandry, housing, euthanasia, and experimental guidelines were approved by IACUC at Baylor College of Medicine, according to the US National Institutes of Health Guidelines.
METHOD DETAILS
Sample preparation for scRNA-seq and CUT&RUN
Samples
The scRNA-seq experiments were performed on E9.5 and E10.5 Atoh1GFP/GFP and E11.5, E12.5, E13.5, E14.5, and E16.5 Atoh1GFP/Cre; RosaTdTom/+ embryos. Two replicates were collected from independent litters for each timepoint. At least 3 embryos from the same litter were combined prior to sorting for each replicate. Both male and female embryos were included in the study. Cleavage Under Targets & Release Using Nuclease (CUT&RUN) was performed on E12.5 and E14.5 Atoh1GFP/GFP embryos. For E12.5, 28 embryos from 4 litters were combined and for E14.5, 24 embryos from 3 litters were combined prior to sorting.
Dissection
Embryos were harvested from pregnant dams and placed immediately in ice cold HEGB Medium (0.8X B27 (50X, Thermo Fisher Scientific), and 0.25X glutamax (100X, Thermo Fisher Scientific, 35050–061) in Hibernate E (BrainBits, HE)). For litters that could be of the Atoh1GFP/Cre; RosaTdTom/+ genotype, embryos were screened for TdTomato expression under the fluorescent stereoscope (Zeiss Axio Zoom). A piece of tissue was collected from each embryo to confirm the genotype. The whole brain was dissected in cold HEGB medium and was trimmed to capture the hindbrain by cutting at the midbrain and curvature of the spinal cord. For each experiment, a TdTom− hindbrain was collected as a GFP-only control and a piece of forebrain was collected as a GFP−/TdTom− control for fluorescent activated cell sorting (FACS). Dissected hindbrains were stored in cold HEGB medium on ice.
Dissociation
Hindbrain samples were dissociated following the protocol described by Chen et al. 47 with some modifications. Briefly, the HEGB medium was removed from the dissected hindbrains and replaced with papain (Worthington, LK003178) resuspended in warmed Hibernate E without calcium (BrainBits, HECA100). Samples were incubated at 37°C for 30 minutes with agitation. The samples, which were not fully dissociated at this step, plus papain solution were then moved to a 15 mL conical (Falcon, 352095) with a wide bore pipette. The old tube was washed with one mL ice cold HEGB to ensure all tissue was moved to the new conical and then four additional mL of HEGB was added to each sample. The tissue was then triturated with a five mL pasture pipette for 15 times and then allowed to settle for one minute. The contents were transferred to a fresh 15 mL conical and centrifuged at 200 relative centrifugal force (rcf) for three minutes. The samples were washed with a fresh five mL of HEGB and centrifuged again at 200 rcf for three minutes. After removing the wash, the tissues were resuspended in one mL single cell sorting buffer (cold 1X phosphate buffered saline (PBS) with 0.05% fetal bovine serum (FBS)) and pipetted 20 times with a wide bore pipette and 10 times with a normal orifice pipette to fully dissociate the tissue. The cell suspension was then pushed through a 30 μm filter (CellTrics, SYSMEX 04–004-2326) into a fresh 15 mL conical. The old conical was washed once with 1 mL of single cell sorting buffer and again pushed through the filter. A small sample was removed from the single cell suspension as a DAPI− control. The remaining cell suspension was incubated with DAPI (1:5000) for 5 minutes on ice. The sample was then centrifuged for three minutes at 200 rcf, the DAPI solution was removed, and the sample was resuspended in cold single cell sorting buffer and kept on ice prior to sorting.
Sorting
Cell suspensions were sorted using the Sony SH800S. Viable cell populations were first determined by passing samples through a gate to select out debris (SSC-A vs FSC-A), two single cell gates (FSC-H vs FSC-A and SSC-H vs SSC-W), and a gate to remove DAPI+ non-viable cells (SSC-H vs Brilliant Violet 421). GFP+ and TdTom+ gates were set using proper controls (forebrain with DAPI, forebrain without DAPI, GFP-only with DAPI, GFP-only without DAPI, GFP+/TdTom+ with DAPI, and GFP+/TdTom+ without DAPI) and by performing compensation to minimize spectral overlap. Prior to sorting, the 15 ml collection conical was coated with 1% bovine serum albumin (BSA) and filled with 500 μL of single cell sorting buffer. For E9.5 and E10.5 scRNA-seq samples, GFP+ cells were collected. For E11.5 – E16.5 scRNA-seq samples, the GFP+/TdTom− and GFP+/TdTom+ cells were collected in one sample and the GFP−/TdTom+ cells were collected in a second sample. 100,000 – 150,000 cells were collected for each sample. For the CUT&RUN samples, GFP+ cells and GFP− cells were collected in distinct samples.
ScRNA-seq sample and library preparation
Following sorting, samples were spun down at 200 rcf for five minutes to pellet the sorted cells. The single cell sorting buffer was removed leaving behind enough volume to resuspend the cell pellet at a concentration of approximately 1,000 cells/μL. A sample of the cell suspension was diluted in trypan blue and analyzed on the Countess II (Invitrogen) to determine cell viability, which was greater than 80% for all samples. The cell suspensions were then processed into sequenceable cDNA libraries as described in the 10x Genomics 3’ v3.1 kit with a target capture rate of 10,000 cells per sample using the 10x Chromium controller. The cDNA libraries were sequenced on the Illumina NovaSeq 6000 with a goal of capturing at least 50,000 reads/cell.
CUT&RUN sample and library preparation
We followed the sorting described above and collected GFP+ and GFP− cells from the E12.5 and E14.5 hindbrains in distinct samples. The whole cells were prepared for CUT&RUN34 as described in Coffin et al48. Specifically, 200,000 cells per sample for both GFP+ and GFP− populations were bound to Conclavin A coated beads, washed, and incubated overnight in wash buffer containing 0.06% digitonin with Rabbit anti-GFP (1:1000, Invitrogen, G10362) or IgG (1:100, Millipore, 12–370) antibodies at 4°C with rotation. Following pAG-MNase administration and induction of DNA cleavage, fragments were collected, and libraries prepared as previously described (protocols.IO dx.doi.org/10.17504/protocols.io.bagaibse and Coffin et al)48.
Optical clearing and whole mount staining
Optical Clearing
E13.5 embryos were dissected from pregnant dams. Atoh1GFP/Cre; RosaTdTom/+ embryos were fixed in 4% PFA for 24 hours at 4°C with agitation. The head of the embryo was cut from the rest of the body and cleared following the Logos X-CLARITY™ protocol49. Briefly, embryos were incubated in the photo initiator hydrogel (VA-044) for 24 hours at 4°C and then polymerized for three hours at 37°C under a vacuum of −90kPa with the Logos X-CLARITY™ Polymerization System. The embryos were washed five times with 1X PBS for 30 minutes each with the last wash occurring overnight at RT. The embryos were cleared with the Logos X-CLARITY™ Tissue Clearing System under perfusion (30 RPM) and electrophoretic gradient (0.7A) for 1 hour 15 minutes. Samples were washed five times with PBST (1X PBS + 0.1% Triton X-100) for 30 minutes each with the last wash occurring overnight at RT.
Tissue Staining
Staining and mounting protocols were based off McCreedy et al50. Briefly, embryos were incubated with primary antibodies in PBST with 2% normal goat serum (NGS) and 0.01% sodium azide at room temperature (RT). The primary antibody solution was changed every 2 days for a total of 6 days. Samples were then washed five times with PBST for 30 minutes each with the last wash occurring overnight at RT. Samples were incubated with secondary antibodies in PBST with 2% NGS and 0.01% sodium azide with the solution changed every 2 days for a total of 6 days. The samples were washed as previously described then incubated with DAPI in PBST and 0.01% sodium azide for 3 days at RT. The samples then went through one more round of washes. The following antibodies and concentrations were used in this study: chicken anti-GFP (1:1000, Abcam, ab13970), goat anti-chicken-Alexa 488 (1:500, Invitrogen, A11039), and DAPI (1:5000 at 5mg/mL, Invitrogen, D1306).
Tissue mounting
To mount for imaging, samples were suspended in melted 1% agarose which then solidified at RT using a 3 mL syringe as a mold. A plastic screw and washer were inserted before the agarose solidified to enable suspension on the lightsheet microscope as described by Hsu et al51. The mounted samples were then submerged within the refractive index matching solution (RIMS, 30g Nycodenz (Fisher, NC9038974) in 0.02M phosphate buffer and 0.01% sodium azide) until equilibrated approximately a week at RT. Samples were stored long term at 4°C before imaging.
Immunofluorescence staining
E16.5 Atoh1Cre/+; RosaTdTom/+ embryos were dissected from pregnant dams. Embryos were screened for TdTom under the fluorescent stereoscope and a piece of tissue was taken for genotype confirmation. The heads of the embryos were fixed in 4% paraformaldehyde for 24 hours at 4°C with agitation. Samples were then washed with 1X PBS three times for 10 minutes each at RT. Next, samples were submerged into a 30% sucrose solution and were incubated at 4°C with agitation until they dropped to the bottom of the container. The samples were then cryopreserved in OCT and stored in −80°C until use. Coronal plane sections were collected directly onto the slide by cryostat (Leica CM3050) at a 20 μm thickness. The sections on the slides dried at RT and were stored at −20°C. To stain the sections, slides were air dried at RT for 15 min and incubated in 1X PBS for 15 minutes at RT to remove the OCT. Sections were post-fixed on the slide with 10% ice-cold formalin at RT for 10 minutes. Antigen retrieval was performed with sodium citrate buffer (10 mM sodium citrate, 0.05% Tween 20, pH 6.0) heated to 95°C. Slides were submerged for 9 minutes and then cooled at RT to 30 minutes. Slides were washed in 1X PBS three times for five minutes each. Sections were outlined on the slide by PAP pen (Life Technologies, 008899), permeabilized with 0.3% Triton X-100 in 1X PBS for 15 min at RT, and blocked for 2 hours at RT with blocking buffer (5% normal goat serum and 0.3% Triton X-100 in 1X PBS). Primary antibodies were then added to fresh blocking buffer and incubated on the slide at 4°C for 24 hours. Following three 1X PBS washes for 5 minutes each, secondary antibodies were added to the blocking buffer and incubated on the slides at RT for 2 hours. Slides were washed in 1X PBS three times for five minutes each and sections were incubated with DAPI at RT for 5 minutes. Following one 1X PBS wash, slides were mounted with Prolong Diamond (Invitrogen, P36961), dried overnight at RT, and stored at 4°C before imaging. The following antibodies and concentrations were used in this study: guinea pig anti-Tbr2 (Eomes, 1:400, Synaptic systems, 483 005), mouse anti-Ki-67 (1:50, BD Biosciences, 556003), rabbit anti-RFP (1:2000, Rockland, 600–401-379), goat anti-guinea pig-Alexa 488 (1:500, Invitrogen, A-11073), goat anti-mouse-Alexa 647 (1:500, Invitrogen, A-21236), goat anti-rabbit-Alexa 555 (1:500, Invitrogen, A-21428), DAPI (1:5000 at 5mg/mL, Invitrogen, D1306).
Dual-color fluorescence RNA in situ hybridization
E12.5 (whole embryo), as well as E14.5 and E16.5 (head) tissues were embedded in OCT, frozen on dry ice and stored in −80°C until use. Coronal sections, starting with the anterior pontine region and continuing posteriorly to the end of the tissue, were cut by cryostat (Leica CM3050) at 20 μm. We generated digoxigenin (DIG)-labeled or fluorescein (FITC)-labeled mRNA antisense probes for genes of interest (Supplemental Table 3). The probe templates were generated by PCR using reverse-transcribed mouse cDNA as template and DIG or FITC RNA labeling kits from Roche (Sigma). Primer sequences to generate each probe are listed in Supplemental Table 3. ISH was performed by the RNA In Situ Hybridization Core at Baylor College of Medicine using an automated robotic platform as previously described52 with modifications of the protocol for double ISH. Briefly, two probes were hybridized to the tissue simultaneously. After the wash and blocking steps, the DIG-labeled probes were visualized by incubating with tyramide-Cy3 Plus (1:75, Perkin Elmer) for 15 min. After washes in TNT, the remaining HRP-activity was quenched by a 10-min incubation in 0.2M HCl. The sections were then washed in TNT and blocked in TNB for 15 min, followed by incubation with HRP-labeled sheep anti-FITC antibody (1:500 in TNB, Roche) at RT for 30 min. After washes in TNT, the FITC-labeled probes were visualized by incubating with tyramide-FITC Plus (1:75, Perkin Elmer) for 15 min. Following washes in TNT the slides were stained with DAPI (Invitrogen), washed again, removed from the machine, and mounted with ProLong Diamond (Invitrogen).
Spatial Transcriptomics with 10X Genomics Xenium
E14.5 Atoh1Cre/GFP; Rosalsl-TdTom/+ embryos were coronally sectioned onto 10X Genomics Xenium slides. The 10X Xenium platform was performed with the pre-made mouse brain probe set plus 50 custom genes specific to our study. For visualization of single genes, we generated the transcript density map in Xenium Explorer. To visualize coexpression of several genes, the Xenium Explorer cell summary parquet file was utilized. In Python, data was filtered to include cells that expressed the specified gene of interest (WPRE, Tcf24, Onecut3, C1ql1, Islr2, Spx, Nr4a2, C1ql4, and Prph) and have a high confidence level (QV > 25). Scatter plots were then generated that showed the spatial distribution of expression for each gene of interest. The images were then overlayed in MATLAB to emphasize coexpression of genes.
Image Acquisition
The optically cleared whole embryo E13.5 embryo was imaged on the Zeiss Lightsheet Z.1 using 405/488/561 lasers and the 5x objective. Z-stacks were collected from left and right sides. Dual-side fusion and tiling was performed with the Zen software. Stitching of tiles was performed with Arivis Vision 4D and 3D rendering was performed with Imaris.
The dual ISH preparations were imaged on the Zeiss AxioScan_Z1 whole slide scanner with DAPI, EGFP, and Cy3 filters and the 20x objective. The channel exposure was set independently for each ISH probe and held constant when imaging across tissue sections and genotypes.
The sections prepared by immunofluorescence were imaged on the Leica TCS SP8X confocal with 405/488/561/640nm lasers and 20x and 40x objectives. Z-stacks of equal depths were collected across coronal sectioning planes. Laser intensity and gain was set independently for each laser and held constant when imaging across sections. Stitching of tiled images and average projection of z-stacks was performed within the Leica LAS X software.
Levels were changed within the respective capture software (Zen or Leica Z) and additionally within Photoshop if necessary. When comparing the same signal between genotypes or tissue sections, levels were changed in equal amounts. Cropping of images for increased feature resolution was performed in Photoshop.
Image Quantification
ImageJ2 v2.9.053 was used to quantify the overlapped expression of Cre within the Sox2+ area. First, we cropped the full ISH image to just include and equal area of the RL. We fit a mask to the Sox2 and Cre channels individually to outline the area with signal above a designated threshold. We then created a mask that contained the signal where Sox2 and Cre overlapped (Figure S7D). Because we were interested where Cre overlaps with the Sox2 signal, we calculated the percent overlap as the total area of overlap (Cre+/Sox2+) divided by the total area of Cre and multiplied by 100. This analysis was performed in 2 genotypes from 3 independent litters and across 3 sections of the RL in each animal. For the statistical test, we performed a mix model ANOVA to compare between genotypes using the lme4 package in R54. This test allows us to account for variation in technical and biological replicates.
Single Cell Computational Analysis
Data pre-processing
Using the 10x Genomics cloud with CellRanger Version v5.0.1, reads were aligned to a custom reference genome comprised of the mouse mm10 reference genome with the WPRE sequence added to detect cells expressing TdTomato. Using Seurat v3.5.155, filtered matrices from individual samples were filtered based on number of genes detected (nFeature) between 20000 and 8000, unique molecular identifiers (UMI, nCount) greater than 500, and percent mitochondria gene expression less than 0.4. Next, high confidence doublets as determined through the default parameters of DoubletFinder v220 were removed.
Normalization and clustering
All samples were merged into one Seurat object, UMIs were subset once more for percent mitochondria and blood gene expression less than 0.1, and then normalized and scaled using the SCTransform56 while regressing on precent mitochondrial genes and blood genes. Next, principal component analysis (PCA) was performed and the top 50 principal components were used to generate the k-Nearest Neighbors graph for clustering. We tested a combination of resolution, min.dist, and spread parameters that best represented the dataset to generate the UMAP used for visualization in downstream analysis.
Subsetting
Several times throughout the study, we subset the full dataset to gain an increased resolution of specific cell populations. If we reclustered the data, we ran through the pipeline of normalization and clustering as described above.
Full dataset:
The full dataset that was analyzed in this study was generated by first removing spurious clusters that were likely contamination from sorting. Clusters that were removed included inhibitory cells (expressed Tfap2b, Pax2, Gad2, Gad1, Slc6a5, and Slc32a1), meninges (expressed Col1a2, Col1a1, Dcn, Dkk2, Foxc2, Ogn), endothelial cells (expressed Klf2, Igfbp7, Ramp2, Pecam1, Foxl2, Foxq1), macrophages (expressed C1qb, Ccl4, Tyrobp, Ccr5, Ptprc, Irf5), smooth muscle cells (Rgs5, Vtn, Acta2, Ednra, Tagln, Tbx2), and platelets (expressed Ppbp, Clec1b, Femt3, F10, Vwf, Gp6). UMAP of the resultant subset colored by replicate and by original sample shown in Figure S2A and S2B.
Differentiating subset:
To generate the differentiating subset, we subset the full dataset for cells with Mapt > 2.5. UMAP of the resultant subset colored by replicate and by original sample shown in Figure S4C and S4D.
Progenitor subset:
To generate the progenitor subset, we subset the full dataset for cells with Mki67 > 1. UMAP of the resultant subset colored by replicate and by original sample shown in Figure S6A and S6B.
Caudal pons subset:
To subset the caudal pons, we initially subset the caudal pons migration trajectory from the full dataset (clusters 13, 24, 33, and 34) along with the adjacent intermediate progenitor clusters (7 and 8) and reclustered (Figure S9A). However, we visually noticed there were extra intermediate clusters that were distinct from the caudal pons trajectory of interest, so we performed another subset and reclustering (clusters 1, 2, 7, 8, 9, 10, 11, 13, and 15). These clusters were picked by visualizing continuity in the 3D projection and also by noticing that that cluster 12 had high Hoxa5 expression and is likely a population coming from the CLS. UMAP of the resultant subset colored by replicate and by original sample shown in Figure S9B and S9C.
Cerebellar subset:
To further investigate the Eomes+ cells, we subset and reclustered the later cerebellar RLS largely containing cells from the E16.5 timepoint from the full dataset (clusters 14, 15, 20, and 23). UMAP of the resultant subset colored by replicate and by original sample shown in Figure S10B and S10C.
Eomes+ subset:
To specifically look at the gene expression changes across the Eomes-expressing cells, we first subset out the unipolar brush cell lineage from the cerebellar subset (clusters 0, 1, 2, 12, and 3, Figure 7C). We then isolated just the Eomes-expressing cells but subsetting on gene expression (Eomes > 1). In this subset, we did not recluster the cells.
Annotations
For more in-depth analysis and marker identification, it was necessary to annotate the dataset. Below we describe how the annotations were determined:
Full dataset - migration trajectories:
We used a combination of cell state genes (Mki67, Sox, Nes, Mapt), rostral-caudal genes (En1, En2, Hoxa2, Hoxa5, and Hoxa7), known Atoh1-target genes (Pax6, Barhl1, and Lhx9) and neurotransmitter/neuropeptide genes (Slc16a6 and Sst) for annotation (Figure S4B and Supplemental Table 1). We also used 3D UMAPs to visualize contiguous streams to aid in annotation of migration trajectories.
Differentiating subset – differentiating nuclei:
We used a combination of rostral-caudal genes (En1, En2, Hoxa2, Hoxb2, Hoxb3, Hoxa3, Hoxb4, Hoxa4, Hoxa5, Hoxc6, Hoxb7, and Hoxc8), neurotransmitter/neuropeptide genes (Slc18a3, Tacr1, Th, Sst, Slc17a7, and Slc17a6), known Atoh1 targets (Lhx2, Lhx9, Barhl1, and Barhl2), and sample timepoint for annotation. We also performed differential gene expression analysis (as detailed below) to identify upregulated genes in each cluster and used what has been described in pervious literature to aid in annotation. Lastly, for marker genes that we were not able to find in the literature, we performed ISH to identify where the marker genes overlapped with the Atoh1-lineage in E14.5 mouse embryos (Supplemental Table 1).
Full dataset – progenitor vs. intermediate progenitor comparison:
We were interested in the transcriptional change between progenitors that expressed Mki67, Nes, and Sox2 and those clusters that lost Mki67 expression but still highly expressed Nes and Sox2. Therefore, from the full dataset we compared clusters 0, 3, and 29 (progenitors) to clusters 7, 8, and 35 (intermediate progenitors).
Full dataset – cell state:
To categorize the full dataset by cell state, we first labeled the clusters with high Mki67 expression as “progenitors” and the “intermediate progenitors” were defined as described above. To define the migrating and differentiating clusters, we mapped the differentiating subsetted cells (as described above) back on to the full dataset and evaluated the percentage of differentiating cells in each cluster of the full dataset. If the cluster was adjacent to a progenitor/intermediate progenitor cluster and had a percent of differentiating cells was less than 1%, the cluster was labeled “migrating 1”. If the cluster was not adjacent to a progenitor/intermediate progenitor cluster and have a differentiating cell percentage of < 20%, the cluster was labeled “migrating_2”. Clusters with > 20% differentiating cells were labeled “differentiating”. Non-RL clusters were consistent with what was described in Figure S4B.
Gene expression analysis
Prior to any visualization or assessment of gene expression, the RNA assay of the Seurat object was normalized. To generate the heatmaps, we also scaled the data prior to generating the image. To identify the genes that were upregulated in one cluster compared to all other clusters, we used the FindAllMarkers Seurat function with parameters of only returning upregulated genes, min.pct = 0.25 and logFC = 0.25. When specific pairwise comparison was made between specific clusters, we used FindMarkers Seurat function with logFC threshold = 0.25. Below are the specifics on how differential gene expression was performed for each Figure:
Figure 1: We performed FindAllMarkers on the initial fully merged dataset to aid in identification of spurious clusters that needed to be removed.
Figure 2: FindAllMarkers was performed on the subsetted full dataset to annotate the migration trajectories. After annotation, we down-sampled each group to 5000 cells per migration trajectory and used FindAllMarkers to identify new genes. Markers shown in dotplot were among the top 20 genes weighted by fold-change for each migration trajectory (Supplemental Table 1). For the differentiating subset, we performed FindAllMarkers and used the marker genes to aid in annotation of each cluster as detailed in Supplemental Table 1.
Figure 3: FindAllMarkers was performed on the progenitor subset. The heatmap was generated from the top 10 markers in each cluster weighted by fold-change and only non-repeated markers are shown. Markers of interest (Nes, Pax6, Ccnd1, and Ccnd2) were among the top 10 (Supplemental Table 1). FindMarkers was performed to identify upregulated genes in the progenitors versus intermediate progenitors. The heatmap was generated from the top 20 differentially expressed genes (Supplemental Table 1). Genes in Supplemental Table 1 were also used as input for GO analysis (see Methods on GO analysis).
Figure 4: Once the full dataset was annotated by cell state, we down-sampled the dataset to 2000 cells per category and performed FindAllMarkers but this time with a looser set of criteria to input into the Enrichment Analysis (See Enrichment Analysis): both upregulated and downregulated genes, min.pct = 0.05, logFC.threshold = 0, return.thresh = 1.
Figure 5: To identify the shared genes between migration streams, we found the overlap in the differentially expressed genes for the migrating clusters in the initial full dataset (Supplemental Table 1), cluster 2 = Early RLS, cluster 21 = Early Pons, cluster 10 = CLS, cluster 13 = Caudal Pons, cluster 17 = CES, cluster 5 = AES Early. To identify the unique genes for each migration stream, we compared the migration stream of interest to combination of all other migration streams using FindMarkers. Genes listed are among the top 10 genes weighted by fold-change for each comparison (Supplemental Table 1).
Figure 6: FindAllMarkers was used on the caudal pons subset to identify which genes were upregulated in the differentiating clusters. The genes that were listed are among the top 20 weighted by fold-change (Supplemental Table 1). Once annotations were performed to denote the caudal pons subset by lineage, we again performed FindAllMarkers to identify genes that were enriched in each lineage. The genes listed were among the top 20 (Supplemental Table 1).
Figure 7: FindAllMarkers was performed on the cerebellar subset to identify maker genes of unipolar brush cells and granule progenitors (Supplemental Table 1). We then performed a direct comparison between the unipolar brush cell progenitors (cluster 0) with the progenitors of the granule cells (cluster 6 and 9) with FindMarkers to identify new specific markers of the unipolar brush cells (Supplemental Table 1).
Gene Ontology (GO) Analysis
We used Enrichr57–59 to perform the GO analysis on the progenitors vs. intermediate progenitors. We input the upregulated differentially expressed genes that were generated as describe above (Supplemental Table 1). We input 250 genes for the progenitor and 127 genes for the intermediate progenitor. We report the top 10 GO terms for the Biological Process category.
Pseudotime analysis
The Seurat objects were subset to include cells of interest and pseudotime values were defined using Monocle360. For analysis of migration streams, the main migration stream cluster was subset along with the upstream intermediate progenitor. Addition subsetting occurred if there were clusters of intermediate progenitors that belonged to other migration stream. The pseudotime values were then added to the Seurat object metadata to plot gene expression across pseudotime.
CUT&RUN
Alignment and Data Processing
Our CUT&RUN data analysis pipeline was adapted from CUT&RUNTools61 and previously described in Coffin et al. Briefly, excess adapters were trimmed using Trimmomatic version 0.36 (2:15:4:4:true LEADING:20 TRAILING:20 SLIDINGWINDOW:4:15 MINLEN:25) and kseq61,62. Alignment was performed using bowtie2–2.3.4.1 (--dovetail --phred33) to both mm10 (GRCm38 GCA_000001635.2) and the spike-in Ecoli K12 Genomes (GCF_000005845.2_ASM584v2). Samtools (1.10) was used to isolate fragments specific to transcription factors under 120 bp as previously described61,63. Using bedtools (v2.29.1), BAM files were converted to BED files, mm10 blacklist removed, and bedgraphs generated. UCSC Bedgraph to Bigwig was used to generate Bigwig files visualized in IGV.
De-novo motif analysis was performed with peaks from both E12.5 GFP+ and E14.5 GFP+ samples using the MEME suite (4.11.264). Identified de-novo motif for each sample was compared to consensus ATOH1 motif from cerebellar ChIP-seq data using Tom Tom32,64.
Peaks were called between BAM files of GFP+ cells at E12.5 and E14.5 samples as treatment compared to control GFP− cells at each respective timepoint using MACSr (version 1.00, macs3 callpeak parameters “BAMPE”, qvalue = 0.05). A q-value and fold-change cutoff value was determined by identifying the values where 60% of peaks contained the de novo motif for each time point. The E12.5 and E14.5 peak lists were filtered by these values. Bedtools closest was used to associate a peak to gene filtering for genes within gene body or within 5kb of transcription start site. E12.5 and E14.5 tracks along with peaks were visualized using Integrated Genome Viewer (IGV) v2.11.0.
Combination of scRNA-seq with CUT&RUN
A list of genes with ATOH1 peaks was generated by combining unique peaks from E12.5 and E14.5 and including genes within 5kb upstream or downstream of the transcription start site leaving a list of 11,218 genes with Atoh1 peaks (Supplemental Table 2). To assess enrichment of ATOH1 binding across differentially expressed genes, we performed a fisher exact test for significantly upregulated genes in different cell states (described above) that contain an ATOH1 binding peak. Bonferroni-adjusted statistics are displayed on graph. To calculate how expression of genes that contained ATOH1 peaks collectively changed across the single-cell dataset, we first down-sampled the dataset to 10,000 cells per group and calculated the Module Score as described by Tirosh et al36. The list of ATOH1 peaks were used as the feature input. Bonferroni-adjusted statistics are denoted on graph.
Bulk RNA sequencing enrichment analysis
Differential gene expression was performed on bulk RNA sequencing data from the G3, G4, and SHH human medulloblastoma tumor samples using DESeq2 as described in Hendriske et al.39 To assess enrichment of human MB markers genes in our cerebellar subtypes we performed a fisher exact test for significantly upregulated genes in clusters 14, 15, 20 and 23 of our full dataset (described above) that were also significantly upregulated in the bulk RNA sequencing of human medulloblastoma samples (padj < 0.01 and fold2change > 0.25). Bonferroni-adjusted statistics are displayed on graph.
QUANTIFICATION AND STATISTICAL ANALYSIS
Experimental analysis was performed in a blinded manner when possible. Statistical tests were performed in accordance with the experimental design. Detailed description of the statistics performed are noted within the text and in the Method Details subsections. Where applicable, the p-values are provided in the text and figures.
Supplementary Material
Supplemental Table 1: Gene lists and annotations for single cell datasets, related to Figures 1 – 7.
Supplemental Table 2: ATOH1 binding peak list, related to Figure 4.
Supplemental Table 3: Primers for in situ hybridization probes, related to STAR Methods.
Highlights.
Single-cell and spatial transcriptomic atlas of the Atoh1-lineage in the hindbrain
Discovery of mature brainstem markers and caudal pons migration stream
Profiling of ATOH1 binding sites and its functional role in migration
Characterization of unipolar brush cell progenitors implicated in medulloblastoma
Acknowledgements
This work was made possible through funding from Howard Hughes Medical Institute (H.Y.Z). J.C.B. was supported by the NIH F32 NS117723 and R.S.D. was supported by the NIH F32 NS127854, NIH DP5 OD036131, and a Longevity Impetus Grant from Norn Group, Hevolution Foundation, and Rosenkranz Foundation. The establishment and use of the RNA In Situ Hybridization Core and Neurovisualization Core was supported by equipment grant NIH S10 OD016167 and through the NIH IDDRC Grant P50 HD103555 from the Eunice Kennedy Shriver National Institute of Child Health and Human Development, and the Duncan Neurological Research Institute at Texas Children’s Hospital. We would also like to acknowledge the Optical Imaging and Vital Microscopy Core, Cytometry and Cell Sorting Core, and Genome and RNA Profiling Core, and Center for Comparative Medicine at Baylor College of Medicine as well as the Advance Technology Genomics Core at MD Anderson. We thank the Zoghbi Lab for helpful experimental advice and discussions, especially Dr. Tiemo Klisch. We also thank Chloe Sands for her thoughtful editing of the manuscript.
Footnotes
Declaration of Interests
R.S.D is a paid consultant for AstraZeneca. H.Y.Z is a member of the Board of Regeneron, cofounder of Cajal Neuroscience and on the science advisory board of the Column group. This is work in the Zoghbi Lab and has not been licensed anywhere. The work in this paper has no connection to any of the consulting or companies named here.
Publisher's Disclaimer: This is a PDF file of an unedited manuscript that has been accepted for publication. As a service to our customers we are providing this early version of the manuscript. The manuscript will undergo copyediting, typesetting, and review of the resulting proof before it is published in its final form. Please note that during the production process errors may be discovered which could affect the content, and all legal disclaimers that apply to the journal pertain.
References
- 1.Ben-Arie N, Bellen HJ, Armstrong DL, McCall AE, Gordadze PR, Guo Q, Matzuk MM, and Zoghbi HY (1997). Math1 is essential for genesis of cerebellar granule neurons. Nature 390, 169–172. 10.1038/36579. [DOI] [PubMed] [Google Scholar]
- 2.Wang VY, Rose MF, and Zoghbi HY (2005). Math1 Expression Redefines the Rhombic Lip Derivatives and Reveals Novel Lineages within the Brainstem and Cerebellum. Neuron 48, 31–43. 10.1016/j.neuron.2005.08.024. [DOI] [PubMed] [Google Scholar]
- 3.Rose MF, Ahmad KA, Thaller C, and Zoghbi HY (2009). Excitatory neurons of the proprioceptive, interoceptive, and arousal hindbrain networks share a developmental requirement for Math1. Proceedings of the National Academy of Sciences 106, 22462–22467. 10.1073/pnas.0911579106. [DOI] [PMC free article] [PubMed] [Google Scholar]
- 4.Ben-Arie N, Hassan BA, Bermingham NA, Malicki DM, Armstrong D, Matzuk M, Bellen HJ, and Zoghbi HY (2000). Functional conservation of atonal and Math1 in the CNS and PNS. Development 127, 1039–1048. 10.1242/dev.127.5.1039. [DOI] [PubMed] [Google Scholar]
- 5.Bermingham NA, Hassan BA, Wang VY, Fernandez M, Banfi S, Bellen HJ, Fritzsch B, and Zoghbi HY (2001). Proprioceptor pathway development is dependent on MATH1. Neuron 30, 411–422. 10.1016/S0896-6273(01)00305-1. [DOI] [PubMed] [Google Scholar]
- 6.MacHold R, and Fishell G. (2005). Math1 is expressed in temporally discrete pools of cerebellar rhombic-lip neural progenitors. Neuron 48, 17–24. 10.1016/j.neuron.2005.08.028. [DOI] [PubMed] [Google Scholar]
- 7.Englund C, Kowalczyk T, Daza RAM, Dagan A, Lau C, Rose MF, and Hevner RF (2006). Unipolar brush cells of the cerebellum are produced in the rhombic lip and migrate through developing white matter. Journal of Neuroscience 26, 9184–9195. 10.1523/JNEUROSCI.1610-06.2006. [DOI] [PMC free article] [PubMed] [Google Scholar]
- 8.Višnjar T, Maver A, Writzl K, Maloku O, Bergant G, Jaklič H, Neubauer D, Fogolari F, Pečarič Meglič N, and Peterlin B. (2022). Biallelic ATOH1 Gene Variant in Siblings With Pontocerebellar Hypoplasia, Developmental Delay, and Hearing Loss. Neurol Genet 8, e677. 10.1212/NXG.0000000000000677. [DOI] [PMC free article] [PubMed] [Google Scholar]
- 9.Klisch TJ, Vainshtein A, Patel AJ, and Zoghbi HY (2017). Jak2-mediated phosphorylation of atoh1 is critical for medulloblastoma growth. Elife 6, e31181. 10.7554/eLife.31181. [DOI] [PMC free article] [PubMed] [Google Scholar]
- 10.Ben-Arie N, McCall AE, Berkman S, Eichele G, Bellen HJ, and Zoghbi HY (1996). Evolutionary conservation of sequence and expression of the bHLH protein Atonal suggests a conserved role in neurogenesis. Hum Mol Genet 5, 1207–1216. 10.1093/hmg/5.9.1207. [DOI] [PubMed] [Google Scholar]
- 11.Rose MF, Ren J, Ahmad KA, Chao H-T, Klisch TJ, Flora A, Greer JJ, and Zoghbi HY (2009). Math1 Is Essential for the Development of Hindbrain Neurons Critical for Perinatal Breathing. Neuron 64, 341–354. 10.1016/j.neuron.2009.10.023. [DOI] [PMC free article] [PubMed] [Google Scholar]
- 12.Di Bonito M, Studer M, and Puelles L. (2017). Nuclear derivatives and axonal projections originating from rhombomere 4 in the mouse hindbrain (Springer Berlin Heidelberg; ) 10.1007/s00429-017-1416-0. [DOI] [PMC free article] [PubMed] [Google Scholar]
- 13.Di Bonito M, and Studer M. (2017). Cellular and molecular underpinnings of neuronal assembly in the central auditory system during mouse development. Front Neural Circuits 11, 1–25. 10.3389/fncir.2017.00018. [DOI] [PMC free article] [PubMed] [Google Scholar]
- 14.Di Bonito M, Narita Y, Avallone B, Sequino L, Mancuso M, Andolfi G, Franzè AM, Puelles L, Rijli FM, and Studer M. (2013). Assembly of the Auditory Circuitry by a Hox Genetic Network in the Mouse Brainstem. PLoS Genet 9, e1003249. 10.1371/journal.pgen.1003249. [DOI] [PMC free article] [PubMed] [Google Scholar]
- 15.Di Bonito M, Glover JC, and Studer M. (2013). Hox genes and region-specific sensorimotor circuit formation in the hindbrain and spinal cord. Developmental Dynamics 242, 1348–1368. 10.1002/dvdy.24055. [DOI] [PubMed] [Google Scholar]
- 16.Cao J, Spielmann M, Qiu X, Huang X, Ibrahim DM, Hill AJ, Zhang F, Mundlos S, Christiansen L, Steemers FJ, et al. (2019). The single-cell transcriptional landscape of mammalian organogenesis. Nature 566, 496–502. 10.1038/s41586-019-0969-x. [DOI] [PMC free article] [PubMed] [Google Scholar]
- 17.Yao Z, van Velthoven CTJ, Kunst M, Zhang M, McMillen D, Lee C, Jung W, Goldy J, Abdelhak A, Aitken M, et al. (2023). A high-resolution transcriptomic and spatial atlas of cell types in the whole mouse brain. Nature 624, 317–332. 10.1038/s41586-023-06812-z. [DOI] [PMC free article] [PubMed] [Google Scholar]
- 18.Yang H, Xie X, Deng M, Chen X, and Gan L. (2010). Generation and characterization of Atoh1-Cre knock-in mouse line. Genesis 48, 407–414. 10.1002/dvg.20633. [DOI] [PMC free article] [PubMed] [Google Scholar]
- 19.van der Heijden ME, and Zoghbi HY (2018). Loss of Atoh1 from neurons regulating hypoxic and hypercapnic chemoresponses causes neonatal respiratory failure in mice. Elife 7, e38455. 10.7554/eLife.38455. [DOI] [PMC free article] [PubMed] [Google Scholar]
- 20.McGinnis CS, Murrow LM, and Gartner ZJ (2019). DoubletFinder: Doublet Detection in Single-Cell RNA Sequencing Data Using Artificial Nearest Neighbors. Cell Syst 8, 329–337.e4. 10.1016/j.cels.2019.03.003. [DOI] [PMC free article] [PubMed] [Google Scholar]
- 21.McInnes L, Healy J, Saul N, and Groβberger L. (2018). UMAP: Uniform Manifold Approximation and Projection. J Open Source Softw 3, 861. 10.21105/joss.00861. [DOI] [Google Scholar]
- 22.Saba R, Johnson JE, and Saito T. (2005). Commissural neuron identity is specified by a homeodomain protein, Mbh1, that is directly downstream of Math1. Development 132, 2147–2155. 10.1242/dev.01781. [DOI] [PubMed] [Google Scholar]
- 23.Landsberg RL, Awatramani RB, Hunter NL, Farago AF, DiPietrantonio HJ, Rodriguez CI, and Dymecki SM (2005). Hindbrain rhombic lip is comprised of discrete progenitor cell populations allocated by Pax6. Neuron 48, 933–947. 10.1016/j.neuron.2005.11.031. [DOI] [PubMed] [Google Scholar]
- 24.Graham V, Khudyakov J, Ellis P, and Pevny L. (2003). SOX2 Functions to Maintain Neural Progenitor Identity. Neuron 39, 749–765. 10.1016/S0896-6273(03)00497-5. [DOI] [PubMed] [Google Scholar]
- 25.Schmid T, Krüger M, and Braun T. (2007). NSCL-1 and −2 control the formation of precerebellar nuclei by orchestrating the migration of neuronal precursor cells. J Neurochem 102, 2061–2072. 10.1111/j.1471-4159.2007.04694.x. [DOI] [PubMed] [Google Scholar]
- 26.Tümpel S, Wiedemann LM, and Krumlauf R. (2009). Hox genes and segmentation of the vertebrate hindbrain. Curr Top Dev Biol 88, 103–137. 10.1016/S0070-2153(09)88004-6. [DOI] [PubMed] [Google Scholar]
- 27.Zervas M, Millet S, Ahn S, and Joyner AL (2004). Cell behaviors and genetic lineages of the mesencephalon and rhombomere 1. Neuron 43, 345–357. 10.1016/j.neuron.2004.07.010. [DOI] [PubMed] [Google Scholar]
- 28.Sagner A, Zhang I, Watson T, Lazaro J, Melchionda M, and Briscoe J. (2021). A shared transcriptional code orchestrates temporal patterning of the central nervous system. PLoS Biol 19, e3001450. 10.1371/journal.pbio.3001450. [DOI] [PMC free article] [PubMed] [Google Scholar]
- 29.Martinelli DC, Chew KS, Rohlmann A, Lum MY, Ressl S, Hattar S, Brunger AT, Missler M, and Südhof TC (2016). Expression of C1ql3 in Discrete Neuronal Populations Controls Efferent Synapse Numbers and Diverse Behaviors. Neuron 91, 1034–1051. 10.1016/j.neuron.2016.07.002. [DOI] [PMC free article] [PubMed] [Google Scholar]
- 30.Yang Q, Bermingham NA, Finegold MJ, and Zoghbi HY (2001). Requirement of Math1 for Secretory Cell Lineage Commitment in the Mouse Intestine. Science (1979) 294, 2155–2158. 10.1126/science.1065718. [DOI] [PubMed] [Google Scholar]
- 31.Bermingham NA, Hassan BA, Price SD, Vollrath MA, Ben-Arie N, Eatock RA, Bellen HJ, Lysakowski A, and Zoghbi HY (1999). Math1: an essential gene for the generation of inner ear hair cells. Science 284, 1837–1841. 10.1126/science.284.5421.1837. [DOI] [PubMed] [Google Scholar]
- 32.Klisch TJ, Xi Y, Flora A, Wang L, Li W, and Zoghbi HY (2011). In vivo Atoh1 targetome reveals how a proneural transcription factor regulates cerebellar development. Proc Natl Acad Sci U S A 108, 3288–3293. 10.1073/pnas.1100230108. [DOI] [PMC free article] [PubMed] [Google Scholar]
- 33.Lai HC, Klisch TJ, Roberts R, Zoghbi HY, and Johnson JE (2011). In vivo neuronal subtype-specific targets of Atoh1 (Math1) in dorsal spinal cord. Journal of Neuroscience 31, 10859–10871. 10.1523/JNEUROSCI.0445-11.2011. [DOI] [PMC free article] [PubMed] [Google Scholar]
- 34.Skene PJ, and Henikoff S. (2017). An efficient targeted nuclease strategy for high-resolution mapping of DNA binding sites. Elife 6, e21856. 10.7554/eLife.21856. [DOI] [PMC free article] [PubMed] [Google Scholar]
- 35.Yu HV, Tao L, Llamas J, Wang X, Nguyen JD, Trecek T, and Segil N. (2021). POU4F3 pioneer activity enables ATOH1 to drive diverse mechanoreceptor differentiation through a feed-forward epigenetic mechanism. Proc Natl Acad Sci U S A 118, 25. 10.1073/pnas.2105137118. [DOI] [PMC free article] [PubMed] [Google Scholar]
- 36.Tirosh I, Izar B, Prakadan SM, Wadsworth MH, Treacy D, Trombetta JJ, Rotem A, Rodman C, Lian C, Murphy G, et al. (2016). Dissecting the multicellular ecosystem of metastatic melanoma by single-cell RNA-seq. Science (1979) 352, 189–196. 10.1126/science.aad0501. [DOI] [PMC free article] [PubMed] [Google Scholar]
- 37.Louvi A, Yoshida M, and Grove EA (2007). The derivatives of the Wnt3a lineage in the central nervous system. Journal of Comparative Neurology 504, 550–569. 10.1002/cne.21461. [DOI] [PubMed] [Google Scholar]
- 38.Haldipur P, Aldinger KA, Bernardo S, Deng M, Timms AE, Overman LM, Winter C, Lisgo SN, Razavi F, Silvestri E, et al. (2019). Spatiotemporal expansion of primary progenitor zones in the developing human cerebellum. Science (1979) 366, 454–460. 10.1126/science.aax7526. [DOI] [PMC free article] [PubMed] [Google Scholar]
- 39.Hendrikse LD, Haldipur P, Saulnier O, Millman J, Sjoboen AH, Erickson AW, Ong W, Gordon V, Coudière-Morrison L, Mercier AL, et al. (2022). Failure of human rhombic lip differentiation underlies medulloblastoma formation. Nature 609, 1021–1028. 10.1038/s41586-022-05215-w. [DOI] [PMC free article] [PubMed] [Google Scholar]
- 40.Hovestadt V, Smith KS, Bihannic L, Filbin MG, Shaw MKL, Baumgartner A, DeWitt JC, Groves A, Mayr L, Weisman HR, et al. (2019). Resolving medulloblastoma cellular architecture by single-cell genomics. Nature 572, 74–79. 10.1038/s41586-019-1434-6. [DOI] [PMC free article] [PubMed] [Google Scholar]
- 41.Vladoiu MC, El-Hamamy I, Donovan LK, Farooq H, Holgado BL, Sundaravadanam Y, Ramaswamy V, Hendrikse LD, Kumar S, Mack SC, et al. (2019). Childhood cerebellar tumours mirror conserved fetal transcriptional programs. Nature 572, 67–73. 10.1038/s41586-019-1158-7. [DOI] [PMC free article] [PubMed] [Google Scholar]
- 42.Smith KS, Bihannic L, Gudenas BL, Haldipur P, Tao R, Gao Q, Li Y, Aldinger KA, Iskusnykh IY, Chizhikov VV, et al. (2022). Unified rhombic lip origins of group 3 and group 4 medulloblastoma. Nature 609, 1012–1020. 10.1038/s41586-022-05208-9. [DOI] [PMC free article] [PubMed] [Google Scholar]
- 43.Ballabio C, Gianesello M, Lago C, Okonechnikov K, Anderle M, Aiello G, Antonica F, Zhang T, Gianno F, Giangaspero F, et al. (2021). Notch1 switches progenitor competence in inducing medulloblastoma. Sci Adv 7, 2781–2804. 10.1126/sciadv.abd2781. [DOI] [PMC free article] [PubMed] [Google Scholar]
- 44.Weinberger S, Topping MP, Yan J, Claeys A, Geest N. De, Ozbay D, Hassan T, He X, Albert JT, Hassan BA, et al. (2017). Evolutionary changes in transcription factor coding sequence quantitatively alter sensory organ development and function. Elife 6, e26402. 10.7554/eLife.26402. [DOI] [PMC free article] [PubMed] [Google Scholar]
- 45.Aldinger KA, Thomson Z, Phelps IG, Haldipur P, Deng M, Timms AE, Hirano M, Santpere G, Roco C, Rosenberg AB, et al. (2021). Spatial and cell type transcriptional landscape of human cerebellar development. Nat Neurosci 24, 1163–1175. 10.1038/s41593-021-00872-y. [DOI] [PMC free article] [PubMed] [Google Scholar]
- 46.Di Meglio T, Kratochwil CF, Vilain N, Loche A, Vitobello A, Yonehara K, Hrycaj SM, Roska B, Peters AHFM, Eichmann A, et al. (2013). Ezh2 orchestrates topographic migration and connectivity of mouse precerebellar neurons. Science (1979) 339, 204–207. 10.1126/science.1229326. [DOI] [PMC free article] [PubMed] [Google Scholar]
- 47.Chen R, Wu X, Jiang L, and Zhang Y. (2017). Single-Cell RNA-Seq Reveals Hypothalamic Cell Diversity. Cell Rep 18, 3227–3241. 10.1016/j.celrep.2017.03.004. [DOI] [PMC free article] [PubMed] [Google Scholar]
- 48.Coffin SL, Durham MA, Nitschke L, Xhako E, Brown AM, Revelli JP, Villavicencio Gonzalez E, Lin T, Handler HP, Dai Y, et al. (2023). Disruption of the ATXN1-CIC complex reveals the role of additional nuclear ATXN1 interactors in spinocerebellar ataxia type 1. Neuron 111, 481–492.e8. 10.1016/j.neuron.2022.11.016. [DOI] [PMC free article] [PubMed] [Google Scholar]
- 49.Lee E, Choi J, Jo Y, Kim JY, Jang YJ, Lee HM, Kim SY, Lee H-J, Cho K, Jung N, et al. (2016). ACT-PRESTO: Rapid and consistent tissue clearing and labeling method for 3-dimensional (3D) imaging. Sci Rep 6, 18631. 10.1038/srep18631. [DOI] [PMC free article] [PubMed] [Google Scholar]
- 50.McCreedy DA, Jalufka FL, Platt ME, Min SW, Kirchhoff MA, Pritchard AL, Reid SK, Manlapaz R, Mihaly E, Butts JC, et al. (2021). Passive Clearing and 3D Lightsheet Imaging of the Intact and Injured Spinal Cord in Mice. Front Cell Neurosci 15, 684792. 10.3389/fncel.2021.684792. [DOI] [PMC free article] [PubMed] [Google Scholar]
- 51.Hsu C-W, Cerda J, Kirk JM, Turner WD, Rasmussen TL, Flores Suarez CP, Dickinson ME, and Wythe JD (2022). EZ Clear for simple, rapid, and robust mouse whole organ clearing. Elife 11, e77419. 10.7554/eLife.77419. [DOI] [PMC free article] [PubMed] [Google Scholar]
- 52.Yaylaoglu MB, Titmus A, Visel A, Alvarez-Bolado G, Thaller C, and Eichele G. (2005). Comprehensive expression atlas of fibroblast growth factors and their receptors generated by a novel robotic in situ hybridization platform. Developmental Dynamics 234, 371–386. 10.1002/dvdy.20441. [DOI] [PubMed] [Google Scholar]
- 53.Schindelin J, Arganda-Carreras I, Frise E, Kaynig V, Longair M, Pietzsch T, Preibisch S, Rueden C, Saalfeld S, Schmid B, et al. (2012). Fiji: an open-source platform for biological-image analysis. Nat Methods 9, 676–682. 10.1038/nmeth.2019. [DOI] [PMC free article] [PubMed] [Google Scholar]
- 54.Bates D, Mächler M, Bolker BM, and Walker SC (2015). Fitting linear mixed-effects models using lme4. J Stat Softw 67. 10.18637/jss.v067.i01. [DOI] [Google Scholar]
- 55.Hao Y, Hao S, Andersen-Nissen E, Mauck WM, Zheng S, Butler A, Lee MJ, Wilk AJ, Darby C, Zager M, et al. (2021). Integrated analysis of multimodal single-cell data. Cell 184, 3573–3587.e29. 10.1016/j.cell.2021.04.048. [DOI] [PMC free article] [PubMed] [Google Scholar]
- 56.Hafemeister C, and Satija R. (2019). Normalization and variance stabilization of single-cell RNA-seq data using regularized negative binomial regression. Genome Biol 20, 296. 10.1186/s13059-019-1874-1. [DOI] [PMC free article] [PubMed] [Google Scholar]
- 57.Chen EY, Tan CM, Kou Y, Duan Q, Wang Z, Meirelles GV, Clark NR, and Ma’ayan A. (2013). Enrichr: interactive and collaborative HTML5 gene list enrichment analysis tool. BMC Bioinformatics 14, 128. 10.1186/1471-2105-14-128. [DOI] [PMC free article] [PubMed] [Google Scholar]
- 58.Kuleshov MV, Jones MR, Rouillard AD, Fernandez NF, Duan Q, Wang Z, Koplev S, Jenkins SL, Jagodnik KM, Lachmann A, et al. (2016). Enrichr: a comprehensive gene set enrichment analysis web server 2016 update. Nucleic Acids Res 44, W90–W97. 10.1093/nar/gkw377. [DOI] [PMC free article] [PubMed] [Google Scholar]
- 59.Xie Z, Bailey A, Kuleshov MV, Clarke DJB, Evangelista JE, Jenkins SL, Lachmann A, Wojciechowicz ML, Kropiwnicki E, Jagodnik KM, et al. (2021). Gene Set Knowledge Discovery with Enrichr. Curr Protoc 1, e90. 10.1002/cpz1.90. [DOI] [PMC free article] [PubMed] [Google Scholar]
- 60.Trapnell C, Cacchiarelli D, Grimsby J, Pokharel P, Li S, Morse M, Lennon NJ, Livak KJ, Mikkelsen TS, and Rinn JL (2014). The dynamics and regulators of cell fate decisions are revealed by pseudotemporal ordering of single cells. Nat Biotechnol. 10.1038/nbt.2859. [DOI] [PMC free article] [PubMed] [Google Scholar]
- 61.Zhu Q, Liu N, Orkin SH, and Yuan G-C (2019). CUT&RUNTools: a flexible pipeline for CUT&RUN processing and footprint analysis. Genome Biol 20, 192. 10.1186/s13059-019-1802-4. [DOI] [PMC free article] [PubMed] [Google Scholar]
- 62.Bolger AM, Lohse M, and Usadel B. (2014). Trimmomatic: A flexible trimmer for Illumina sequence data. Bioinformatics 30, 2114–2120. 10.1093/bioinformatics/btu170. [DOI] [PMC free article] [PubMed] [Google Scholar]
- 63.Li H, Handsaker B, Wysoker A, Fennell T, Ruan J, Homer N, Marth G, Abecasis G, and Durbin R. (2009). The Sequence Alignment/Map format and SAMtools. Bioinformatics 25, 2078–2079. 10.1093/bioinformatics/btp352. [DOI] [PMC free article] [PubMed] [Google Scholar]
- 64.Bailey TL, Johnson J, Grant CE, and Noble WS (2015). The MEME Suite. Nucleic Acids Res 43, W39–W49. 10.1093/nar/gkv416. [DOI] [PMC free article] [PubMed] [Google Scholar]
- 65.Quinlan AR, and Hall IM (2010). BEDTools: a flexible suite of utilities for comparing genomic features. Bioinformatics 26, 841–842. 10.1093/bioinformatics/btq033. [DOI] [PMC free article] [PubMed] [Google Scholar]
- 66.Hu Q. (2022). MACSr: MACS: Model-based Analysis for ChIP-Seq. R package version 1.6.0., https://doi.org/10.18129/B9.bioc.MACSr 10.18129/B9.bioc.MACSr. [DOI] [Google Scholar]
- 67.Robinson JT, Thorvaldsdóttir H, Winckler W, Guttman M, Lander ES, Getz G, and Mesirov JP (2011). Integrative genomics viewer. Nat Biotechnol 29, 24–26. 10.1038/nbt.1754. [DOI] [PMC free article] [PubMed] [Google Scholar]
Associated Data
This section collects any data citations, data availability statements, or supplementary materials included in this article.
Supplementary Materials
Supplemental Table 1: Gene lists and annotations for single cell datasets, related to Figures 1 – 7.
Supplemental Table 2: ATOH1 binding peak list, related to Figure 4.
Supplemental Table 3: Primers for in situ hybridization probes, related to STAR Methods.
Data Availability Statement
Single-cell RNA-seq data have been deposited at GEO and are publicly available as of the date of publication. The bulk RNA sequencing data from G3, G4, and SHH MB tumors were generated by Hendriske et al.39 and has been deposited in the European Genome-Phenome Archive (EGA). Accession numbers are listed in the key resources table. All original code has been deposited at GitHub and is publicly available as of the date of publication. DOIs are listed in the key resources table. Any additional information required to reanalyze the data reported in this paper is available from the lead contact upon request.
KEY RESOURCES TABLE
| REAGENT or RESOURCE | SOURCE | IDENTIFIER |
|---|---|---|
| Antibodies | ||
| chicken anti-GFP | Abcam | Cat# ab13970, RRID: AB_300798 |
| guinea pig anti-Tbr2 | Synaptic Systems | Cat# 483 005, RRID:AB_2943519 |
| mouse anti-Ki-67 | BD Biosciences | Cat# 556003, RRID:AB_396287 |
| rabbit anti-RFP | Rockland | Cat# 600–401-379, RRID:AB_2209751 |
| rabbit anti-GFP | Thermo Fisher Scientific | Cat# G10362, RRID:AB_2536526 |
| Normal Rabbit IgG | Millipore | Cat# 12–370, RRID:AB_145841 |
| goat anti-chicken-Alexa 488 | Thermo Fisher Scientific | Cat# A-11039, RRID:AB_2534096 |
| goat anti-guinea pig-Alexa 488 | Thermo Fisher Scientific | Cat# A-11073, RRID:AB_2534117 |
| goat anti-mouse-Alexa 647 | Thermo Fisher Scientific | Cat# A-21236, RRID:AB_2535805 |
| goat anti-rabbit-Alexa 555 | Thermo Fisher Scientific | Cat# A-21428, RRID:AB_2535849 |
| Chemicals, peptides, and recombinant proteins | ||
| Papain | Worthington | Cat # LK003178 |
| CUTANA™ pAG-MNase for ChIC/CUT&RUN Workflows | EpiCypher | Cat # 15–1016 |
| CUTANA™ E. coli Spike-in DNA | EpiCypher | Cat # 18–1401 |
| Critical commercial assays | ||
| Chromium Next GEM Single Cell 3’ GEM, Library & Gel Bead Kit v3.1 | 10X Genomics | PN-1000128 |
| NEBNext® Multiplex Oligos for Illumina | New England Biolabs | Cat # E6440S |
| NEBNext® Ultra™ II DNA Library Prep Kit for Illumina | New England Biolabs | Cat # E7645S |
| Deposited data | ||
| Single Cell RNA sequencing data and CUT&RUN data generated in this paper | This paper | GEO: GSE233966 |
| Code used to generate figures | This paper | DOI: 10.5281/zenodo.12572621 |
| Bulk RNA sequencing from human medulloblastoma samples | Hendriske et al.39 | EGA: EGAS00001005826 |
| Experimental models: Organisms/strains | ||
| Mouse: Atoh1GFP/+ | Jackson Laboratory | RRID:IMSR_JAX:013593 |
| Mouse: Atoh1Cre/+ | Yang et al.18 | N/A |
| Mouse: Atoh1FlpO/+ | Jackson Laboratory | RRID:IMSR_JAX:03654119 |
| Mouse: Rosa26 lsl-TdTom/+ | Jackson Laboratory | RRID:IMSR_JAX:007914 |
| Mouse: wild type C57BL/6J | Jackson Laboratory | RRID:IMSR_JAX:000664 |
| Oligonucleotides | ||
| Probes for in situ hybridization | This Paper | Supplemental Table 3 |
| Software and algorithms | ||
| ImageJ2 v2.9.0 | Schindelin et al.53 | https://imagej.net/software/imagej2/ |
| Monocle3 | Trapnell et al.60 | https://cole-trapnell-lab.github.io/monocle3/ |
| Cell Ranger Version v5.0.1 | 10X Genomics | https://www.10xgenomics.com/support/software/cell-ranger/latest/release-notes/cr-release-notes |
| Seurat v3.5.1 | Hao et al.55 | https://github.com/satijalab/seurat |
| DoubletFinder v2 | McGinnis et al.20 | https://github.com/chris-mcginnis-ucsf/DoubletFinder |
| Bedtools v2.29.1 | Quinlan et al.65 | https://bedtools.readthedocs.io/en/latest/ |
| Trimmomatic v0.36 | Bolger et al.62 | http://www.usadellab.org/cms/?page=trimmomatic |
| MACSr v1.00 | Hu et al.66 | https://www.bioconductor.org/packages/release/bioc/html/MACSr.html |
| IGV v2.11.1 | Robinson et al.67 | https://software.broadinstitute.org/software/igv/ |
| MEME suite v4.11.2 | Bailey et al.64 | https://meme-suite.org/meme/ |