Abstract
The potential regrowth of fecal indicator bacteria released into coastal environments in recreational water bodies has been of concern, especially in tropical and subtropical areas where the number of these bacteria can be artificially elevated beyond that from fecal impacts alone. The task of determining the factors that influence indicator bacterial regrowth was addressed though a series of field sampling and laboratory experiments using in situ densities of Escherichia coli, enterococci, and Clostridium perfringens in river water, sediment, and soil. Field sampling efforts included the collection of surface sediments along the cross section of a riverbank, a 20-cm-deep soil core, and additional surface soils from remote locations. In addition to field sampling, two types of laboratory experiments were conducted. The first experiment investigated the survival of bacteria already present in river water with the addition of sterile and unsterile sediment. The second experiment was designed to simulate the wetting and drying effects due to tidal cycles. The results from the sampling study found elevated numbers of E. coli and C. perfringens in surficial sediments along the riverbank near the edge of the water. C. perfringens was found in high numbers in the subsurface samples obtained from the soil core. Results from laboratory experiments revealed a significant amount of regrowth for enterococci and E. coli with the simulation of tides and addition of sterile sediment. Regrowth was not observed for C. perfringens. This study demonstrates the need to further evaluate the characteristics of indicator microbes within tropical and subtropical water systems where natural vegetation, soil embankments, and long-term sediment accumulation are present. In such areas, the use of traditional indicator microbes to regulate recreational uses of a water body may not be appropriate.
Recreational water quality standards determine the extent of fecal contamination based on the number of total and fecal coliform bacteria, Escherichia coli, or enterococci (18, 34). Studies in coastal areas in the tropics and subtropics have shown that proliferation of E. coli and enterococci can occur in soil and natural vegetation in the absence of fecal contamination (4, 20, 27). In addition, several sampling studies have suggested that the changing environmental conditions in tidally influenced soils help support elevated populations of enteric bacteria (13, 32). The assimilation of these bacteria to the extraenteric environment casts doubt on the relevance of their use as a recreational water quality standard in those areas and has led to the suggestion of using other alternative indicator organisms in such areas (19, 21).
Earlier studies have used laboratory-grown bacteria, rather than organisms retrieved directly from the field, for experimentation. These studies showed that indicator bacteria could survive for several days in unsterile river sediment and, in some cases, grow in sterile sediment (6, 7, 9, 11, 25, 26, 31). Moreover, the long-term survival of previously cultured bacteria in natural soils depends on their ability to adapt and compete with indigenous soil microorganisms for nutrients. Further, most studies evaluate the response of bacterial populations in numbers several orders of magnitude higher than baseline levels found in the environment. The experimental design of the experiments presented here differ from those of earlier studies in that the present study did not involve the introduction of laboratory-grown bacteria to a foreign environment. Rather, the number of indicator bacteria already present in field samples was determined under various laboratory-controlled conditions. Such experiments are more representative of natural field conditions.
Previous research in the study river, the North Fork of the New River (NFNR), in Fort Lauderdale, Fla., has found chronic elevated E. coli numbers at high tide, mainly in areas with natural vegetation and muddy embankments (33, 38). It was hypothesized that bacterial regrowth within the tidally impacted soil embankments, in conjunction with sporadic contamination during storm events, was responsible for the high numbers of E. coli. These findings initiated the present study, which included the analysis of enterococci and Clostridium perfringens in an effort to identify whether those bacteria are suitable indicators for this river system.
The specific objective of the work described herein was to determine the distribution and factors that affect the number of E. coli, enterococci, and C. perfringens found in the water and sediments of the NFNR. The first phase of this study consisted of field sampling efforts to determine the distribution of indicator microbes in surface sediments along a cross section of one tidally impacted river bank, in subsurface sediments, and in surface soils from locations far removed from the river. The second phase was designed to determine the effect that sediment has on indicator microbes in river water. This task was achieved by monitoring the number of indicator bacteria in river water with time after the addition of sterile or unsterile sediment. The third and final phase of this study consisted of a tide simulation experiment that was designed to determine the effects of wetting and drying on indicator microbe numbers found in both sediment and water.
MATERIALS AND METHODS
Site description.
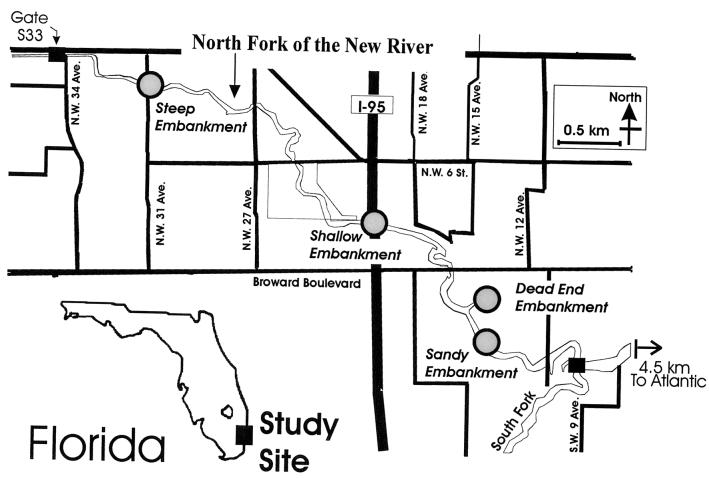
The NFNR, located in Fort Lauderdale, Fla., (Fig. 1), is a tidally influenced river system, with an average air temperature range of 14 to 33°C and annual rainfall of 147 cm. Situated approximately 4.5 km from the Atlantic Ocean, the river water is classified as brackish, with salinities ranging from 0 during storm events to 24 ppt during steady-state tidal mixing. The site can be separated into two distinct areas by the characteristics of local land usage and type of embankment. Natural soil and vegetative embankments dominate the low-income residential districts north of Broward Boulevard. This area is served by sanitary sewers. On the south side, boats and seawalls from affluent properties border the water's edge. The areas bordering this side of the river are served primarily by septic tanks.
FIG. 1.
Location of the study site and sediment sampling locations.
Analytical methods.
Large volumes (>2 liters) of river water were collected in plastic 20-liter bottles. These bottles were presterilized with a light bleach solution (50:1) and rinsed thoroughly with distilled water. For smaller volumes (<2 liters), an autoclaved 2-liter glass bottle was used. Sediment samples were collected using a sterilized metal spoon and presterilized Whirlpak bags. Samples were transported to the laboratory in an iced cooler and analyzed within 4 h.
Total coliform bacteria and E. coli were identified using Colilert18 (IDEXX, Atlanta, Ga.), a defined substrate technology (15-17). Enterococci were identified similarly, using Enterolert (IDEXX). These methods were shown to correlate well with traditional membrane filtration techniques for the analysis of both marine (1, 30) and freshwater samples (10, 14). The enumeration of both E. coli and enterococci was obtained using the Quantitray2000 (IDEXX), which utilizes a 97-test-well system and provides the most probable number. C. perfringens was measured using the traditional membrane filtration technique using mCP medium (3, 35). The accuracy and precision of these analyses were found to be similar to those presented in the literature (2, 12, 36). When possible, all bacterial analyses were performed in duplicate, which is indicated by those data points with an error bar, which indicates the standard deviation of the split sample.
Water samples were analyzed by directly pipetting the appropriate volume of water into the test bottle or filter funnel. Appropriate volumes of the sample water ranged from 0.01 to 10 ml for the Colilert and Enterolert methods and from 2 to 30 ml for the C. perfringens method. Sequential dilutions were made for sample volumes less than 10 ml using phosphate-buffered dilution water (2). The enumeration of bacteria in sediments and soils was achieved using a modified version of the procedure outlined originally by van Elsas and Smalla (37). Briefly, the sediment was added to sterile distilled water, mixed vigorously, and then filtered through a 30-μm-pore-size nylon filter. The filtrate was then analyzed in the same fashion as the water samples. The 90% confidence limits for the filtrate analysis were about 10% higher than those obtained for water samples for each microbe. For the determination of moisture content of sediments and soils, an aliquot of each sample was placed in a 100°C drying oven for 24 h, and the weight differential was recorded. Similarly, the determination of percent organic compounds was obtained by placing the soil in a furnace set to 550°C for 4 h. The efficiency of the drying and volatilization procedure was found to be accurate within 0.01 g (about 1% of the average weight). The determination of fines was obtained by passing the soil through a no. 200 sieve, thus defining fines as particles smaller than 0.075 mm.
Experimental design.
For the field sampling phase of this study, sediment samples were collected every 15 cm along a transect that extended from the water's edge to the outer banks on the south side of a steep embankment (Fig. 1). The sampling took place at low tide to sample the sediment that would be in contact with the water during the next high tide. A sediment boring was collected from the bank with a 30-cm-long steel auger that was fitted with a presterilized plastic sleeve (Forestry Suppliers, Inc., Jackson, Mich.). A total of 20 cm was collected and divided into 5-cm depth increments. In addition, remote soil samples were collected about 30 to 60 m away from the river at steep, shallow, and dead-end embankments (Fig. 1).
Two separate laboratory experiments were conducted: a sterile sediment mixing experiment and an unsterile sediment mixing experiment. For the sterile sediment mixing experiment, a large sample collected from the steep embankment was autoclaved and dried at 100°C for 1 day. Various amounts of sediment were then mixed with river water collected the day the experiment was initiated. A total of three ratios of sediment to river water were used: 10 g/600 ml, 60 g/600 ml, and 60 g/60 ml. For the sample containing 60 ml of river water, an additional 540 ml of sterile distilled water was added to bring the total water volume to 600 ml. In addition to these three samples, two controls were also tested: a river water control (no sediment added) and a sterile water control (60 g of sediment/600 ml of sterile distilled water). The initial number of the microbes in the river water was determined prior to the addition of sediment. The number of indicator bacteria in the sterile sediment was below detection limits. The sample was placed in a dark incubator set at 28°C, and the amount of microbes in the water was then determined every 6 to 24 h for 4 days. The sample was initially mixed and was not mixed again until 4 days later. For the unsterile sediment mixing experiment, the procedure was the same as that of the sterile experiment, with several exceptions. Sediment and water samples from the banks of the steep, shallow, sandy, and dead-end embankments were collected at low tide. The ratio of sediment to water used at each site was roughly 30 g/300 ml, although the individual moisture content of the samples produced slight variations in the actual amount added. At time zero, the numbers of microbes in the water and sediment samples were determined separately, and the results were added and expressed in terms of total population. The samples were mixed together, and the numbers of microbes in the water phase only were determined every 6 to 18 h for about 3 days. The sample was not mixed again during this experiment, except for the final enumeration after 66 h, where 200 ml of sterile distilled water was added to the beaker, and the mixture of sediment and water was then analyzed. This final enumeration provided the sum of microbes in both the water and sediment phases.
For the tide simulation, an experiment designed to simulate the wetting and drying effects produced by tidal fluctuations was performed. In this experiment, approximately 5 kg of sediment was cyclically immersed and removed from a large, presterilized glass tank containing 24 liters of river water. Prior to the start of these experiments, the sediment was air dried for 9 to 11 days, and the concentration of each microbe was analyzed daily. After drying, the entire apparatus was placed in a dark incubator set at 28°C. The schedule for the tray position was as follows: 6 h submerged, 6 h out, 12 h submerged, 6 h out, 6 h submerged, 12 h out, and so on for 4 days. The number of microbes was determined in the sediment and water 15 min before and after every cycle.
RESULTS
Field sampling.
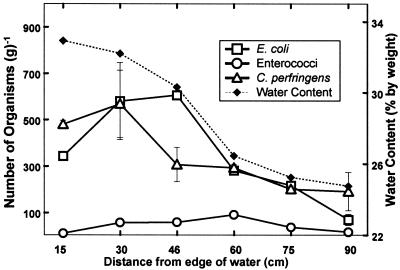
Results from the field sampling effort showed that the number of microbes in the sediment across the bank of the steep embankment varied with distance from the water's edge. The number of E. coli was considerably higher 30 and 46 cm from the edge of the water and then decreased with distance from the river (Fig. 2). The sediment core sample showed that E. coli does not survive deep in soil, as values were below detection limits in all core samples except for the sample corresponding to the top 5 cm. For the samples collected from remote locations (>20 m from river), the number of E. coli was also very low (Table 1).
FIG. 2.
Distribution of indicator microbes and sediment water content over the cross section of a river bank.
TABLE 1.
Summary of remote soil sample data
| Sampling location and date (mo/day/yr) | Water content (% [wt]) | Organics (%) | No. of bacteria (MPN/g of soil [dry wt])a (avg ± SD)
|
||
|---|---|---|---|---|---|
| E. coli | Enterococci | C. perfringens | |||
| Steep embankment, 7/2/00 | 17 | 10 | 22 ± 1 | 1,643 ± 904 | 604 ± 262 |
| Shallow embankment 8/8/00 | 8 | 5 | 8 ± 3 | 8 ± 3 | 120 ± 38 |
| Dead-end embankment, 8/8/00b | 10 | 6 | 9 | 9 | <6.7 |
MPN, most probable number.
No standard deviations available for the samples taken from the dead-end embankment.
Enterococci did not seem to vary significantly along the bank and was generally found in low numbers (<102 g of dry soil−1). The number of enterococci decreased with depth but not quite as drastically as did E. coli. In the remote soil samples, the concentration of enterococci was very high (1.6 × 10³ g of dry soil−1) at one location and very low at the other two.
The values for C. perfringens followed a pattern similar to that observed with E. coli, with a maximum value occurring a distance of 30 cm from the edge of the water. These bacteria were found in high numbers throughout the core, with highest values corresponding to a soil depth of 10 to 15 cm. C. perfringens concentrations varied considerably in the remote soil samples.
Laboratory experiments.
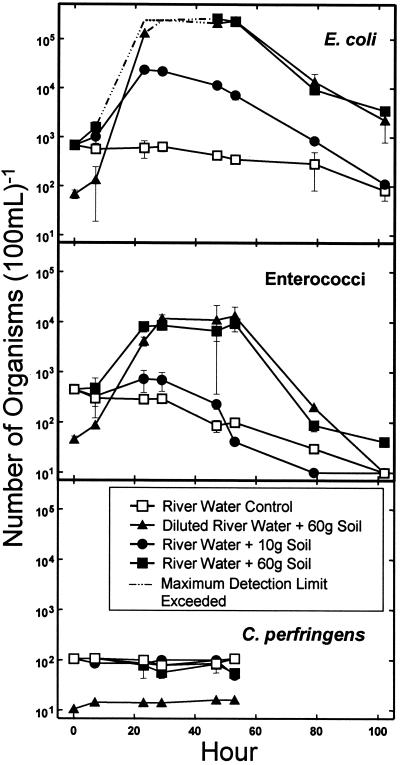
The sterile sediment mixing experiment produced significant increases in the numbers of E. coli and enterococci within the first 24 h (Fig. 3). The river water control showed a gradual decline for E. coli and a more rapid decline for enterococci. During this experiment, the E. coli values exceeded the detection limits for the samples containing 60 g of sediment after 23 and 29 h for the undiluted river water sample and after 29 h for the diluted river water sample. This is represented in the figure by the dotted line segments, which indicate the minimum possible value based on the detection limit of 2.4 × 10⁵ 100 ml−1. The observed increase of both E. coli and enterococcal numbers was related to the amount of sediment added. The rate of increase and the maximum concentration were considerably higher for the samples to which 60 g was added than for the sample to which 10 g was added. The maximum value showed little dependence on the initial number of microbes, given that this value was the same for both the diluted and undiluted river water samples. After roughly 2 days, the values for E. coli and enterococci began to decrease. However, the E. coli concentration in the 60-g sediment samples was approximately 1.5 log units greater than that for the river water control after 4 days. This long-term difference was not as substantial for enterococci. No growth or die-off was observed in C. perfringens for any of the samples.
FIG. 3.
Survival of indicator microbes in river water with the addition of sterile sediment.
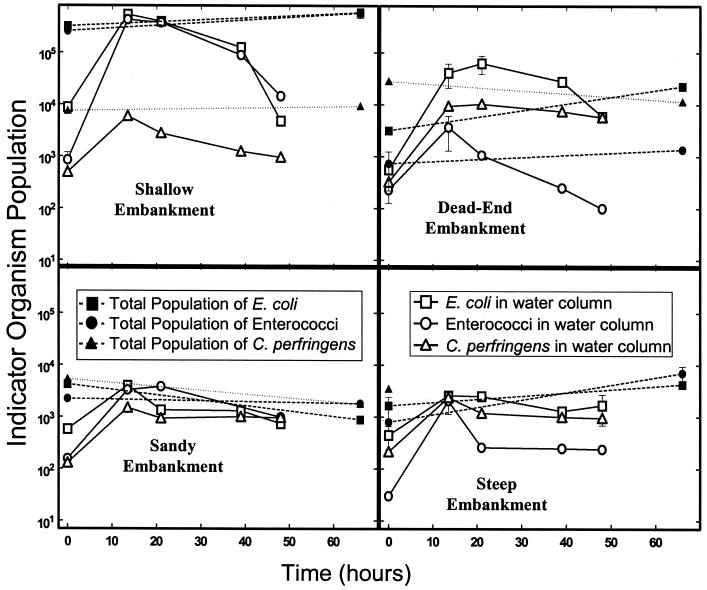
The presence of indicator bacteria in the water and sediment at the initiation of the unsterile sediment mixing experiment made it necessary to view the results on the basis of the total indicator bacterial population in the beaker (bacteria in sediment added plus bacteria in water column). The population of bacteria in the sediment phase was determined from the product of the sediment concentration and the dry weight added to the beaker. The number of microbes in the water phase, similarly, was obtained by finding the product of the concentration in the water and the volume of water remaining in the beaker. The total population in the beaker at the beginning of this experiment was thus obtained by adding the number of bacteria in the sediment and water phases. Results from this experiment varied between sites (Fig. 4) and depended upon the initial number of microbes (Table 2). The initial numbers of bacteria at the sandy, steep, and the dead-end embankments were much lower than that at the shallow embankment. Overall, the population of E. coli and enterococci increased from beginning to end in the samples collected at the steep and dead-end embankments, which corresponds to samples containing relatively low numbers of E. coli and enterococci at the beginning of the experiment (Table 2). Immediately after the addition of the sediment, an increase in all bacterial numbers in all the water samples was noticed, which was attributed to bacteria washing in during mixing. However, for growth to be determined, the amount of bacteria in the water alone had be greater than the initial combined total from the sediment and water. Despite this limitation, which completely neglects the amount of bacteria in the sediment on the bottom of the beaker, the growth of E. coli and enterococci is clearly shown in the sample from the dead-end embankment. The initial combined total population (sediment plus water) for this sample was 3.2 × 10³ and 7.3 × 10² for E. coli and enterococci, respectively. After 14 h, these populations in the water phase only were 4.1 × 10⁴ and 3.7 × 10³, respectively. The lack of consistency in the results is attributed to the different initial numbers of microbes in the sediment and water at each site and possibly the differences in sediment and water characteristics (Table 2). For example, the initial concentration of indicator microbes at I-95 was very high to begin with. In order to show growth, concentrations on the order of 106 100 ml−1 would have to be observed in the water column alone. Maintaining this exceedingly high population is likely beyond the capacity of the sediment-water system used in this experiment. The lack of apparent regrowth for the sample collected at the sandy embankment is likely due to the sandy nature of the sediment at that location and the relatively low organics (Table 2). For C. perfringens, the number of bacteria in the water did not exceed the initial combined total in any of the samples.
FIG. 4.
Survival of indicator microbes in river water with the addition of sediment collected from various river embankments.
TABLE 2.
Summary of initial soil data for unsterile sediment mixing experiment
| Sampling location | Bank description | Amt (g) of soil added | Water content (% [wt]) | Organics (%) | No. of bacteria (MPN/g of soil [dry wt])a (avg ± SD)
|
||
|---|---|---|---|---|---|---|---|
| E. coli | Enterococci | C. perfringens | |||||
| Steep embankment | Muddy and steep | 20.20 | 20.2 | 3.0 | 60 ± 30 | 40 ± 20 | 160 ± 30 |
| Shallow embankment | Muddy and flat | 22.18 | 20.4 | 1.1 | 14,200 ± 1,300 | 11,700 ± 140 | 320 ± 70 |
| Dead-end embankment | Dead end, muddy on 1 side | 22.24 | 25.0 | 1.6 | 120 ± 50 | 20 ± 20 | 1,300 ± 80 |
| Sandy embankmentb | Sandy | 24.25 | 20.3 | 0.5 | 150 | 90 | 220 |
MPN, most probable number.
No standard deviations available for the samples taken from the sandy embankment.
Tide simulation.
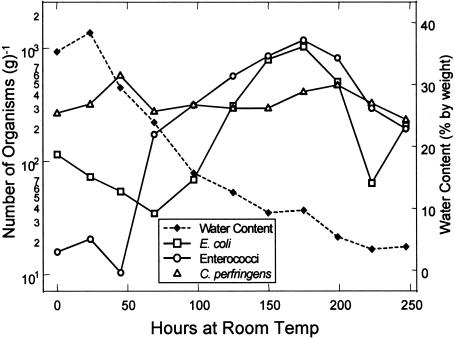
During the drying portion of this experiment, the number of E. coli steadily decreased for the first 70 h and then increased by 1.5 log units within the next 4 days when the water content was between 10 to 25% (Fig. 5). Results for enterococci were similar to those of E. coli, as the number increased by 2 log units between hours 50 and 170, corresponding to a water content range of 10 to 30%. The amount of C. perfringens remained fairly constant during drying at roughly 2.5 × 10² to 5.5 × 10² g of dry soil −1.
FIG. 5.
Survival of indicator microbes in air-dried sediment.
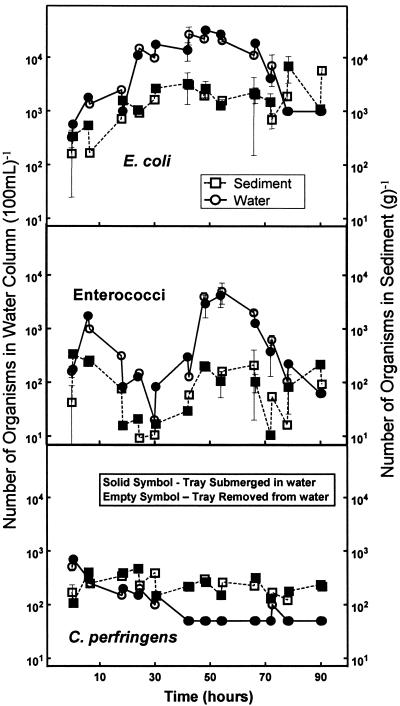
During the wetting and drying portion of the experiment, the number of E. coli increased by a factor of 10 and 50 in the sediment and water, respectively, within the first 30 h (Fig. 6). These elevated numbers were maintained for nearly a day after this first increase, followed by a steady decline. Enterococci behaved erratically, with an initial decrease for the first day followed by a sharp increase to a maximum concentration of 5.0 × 10³ 100 ml−1. After 2.5 days, the number of enterococci sharply decreased. C. perfringens numbers did not increase, and towards the end of the experiment, the majority of these bacteria were found in the sediment.
FIG. 6.
Survival of indicator microbes in a simulated tidal environment.
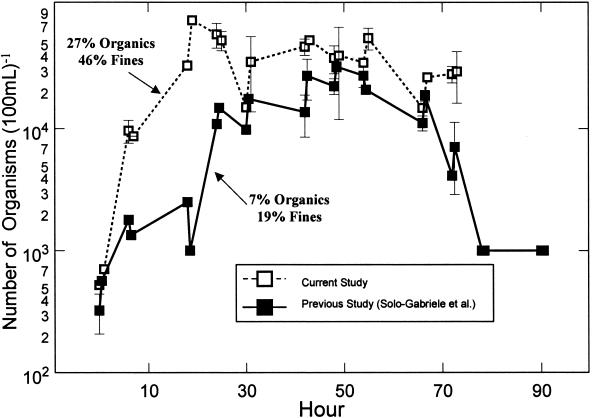
When the results for E. coli were compared to those obtained from the earlier tide simulation experiment of Solo-Gabriele et al. (33), the rate of increase was considerably less than what was previously obtained, though the numbers after the first 30 h were almost identical (Fig. 7). Given the difference in these results, the sediment characteristics were evaluated. It was found that the higher rate of growth corresponded to the sample with a greater amount of organics (27 versus 7%) and larger fraction of fines, which are defined as particles with a diameter less than 0.075 mm (46 versus 19%).
FIG. 7.
Comparison of E. coli survival values in a simulated tidal environment from this study and a previous study by Solo-Gabriele et al. (33).
DISCUSSION
The number of each indicator bacteria varied considerably in the soil and sediment samples collected from the field. In the subsurface sediments, E. coli and enterococci were found in low numbers, as opposed to the very high numbers of C. perfringens. These results support previous studies that claimed that C. perfringens is extremely resistant to environmental stresses (5, 23, 28). Given that C. perfringens numbers were observed deep in soil and in remote soils, it is possible that this microbe is part of the natural microflora or is present as a result of long-term deposition. In the vicinity of the river bank, the highest numbers of E. coli and C. perfringens were observed within 50 cm from the edge of the water, where the water content was highest. In the sediments further from the edge of the water, where the moisture content is less, the number declined, suggesting that the water content plays a critical role in the ability of these indicator microbes to sustain their population in the environment. With changes in tidal stage and wind-induced waves, these indicator microbes in the river bank can then be washed into the river water, thereby artificially elevating the numbers of these bacteria beyond that from fecal impacts alone.
The results from the sterile sediment mixing experiment showed that E. coli and enterococci are capable of multiplying under simulated environmental conditions, whereas C. perfringens was not shown to multiply. Such results are consistent with earlier studies (8, 20, 39). For E. coli and enterococci, the addition of more sediment corresponded to a more rapid rate of regrowth, and the number of bacteria showed little dependence on the initial population of microbes. This finding leads to the conclusion that inactivating the indigenous microbes in the sediment provides a favorable environment for E. coli and enterococci to grow, whether by increased nutrient availability or decreased predation. Predation (9, 29) and nutrients (25) have been shown to play an important role in fecal indicator survival in natural systems. The results from the sediment drying and tide simulation experiment showed that changing the moisture content also encourages growth.
Additional factors that influence the ability of E. coli and enterococci to multiply in the environment are soil characteristics (22, 24, 26, 31). Comparison of E. coli growth rates in two different sediments indicates that the higher organic content and a greater fraction of fines are more conducive for regrowth. These findings are supported indirectly by the results of the unsterile sediment experiment which showed that no regrowth was observed for the one site characterized by a low organic content (0.5% for the sandy embankment). The remaining three sites were characterized by higher organics (>1%) and overall increases in microbe populations from the beginning to the end of the experiment. It is hypothesized that the elevated organics is a result of the deposition of suspended organic material, originating from the dense vegetation on the riverbanks.
The task of designating an appropriate recreational water quality indicator for the NFNR remains an enigma. Concurrent research on this river system has shown that storm water inflows are responsible for a substantial influx of all three indicator bacteria, which serve as one of many possible origins for these bacteria in the river system. The extended proliferation and regrowth of E. coli and enterococci in this system due to the sediment environment are likely the cause of concentrations above recreational standards during dry weather. This finding leads to the question of whether pathogenic bacteria are capable of extended persistence or multiplication in this environment as well. Further research is necessary to determine if this is indeed occurring. C. perfringens, on the other hand, remains in the river for long periods due to its long-term persistence but is not capable of growth in this system. This bacterium would be especially useful for determining the ultimate fate of sewage or storm water impacts once released into a water body. However, the extended viability and possible resuspension of the spores into the water column hinder its relevance as an indicator of recent fecal contamination, especially in areas where long-term accumulation is possible, such as the NFNR.
Acknowledgments
Funding for this project was received from the city of Fort Lauderdale.
We thank the committee members and participants in Fort Lauderdale's Blue Ribbon Committee and Public Works Department for invaluable feedback and expertise throughout the course of this research.
REFERENCES
- 1.Abbot, S., B. Caughley, and G. Scott. 1998. Evaluation of Enterolert for the enumeration of enterococci in the marine environment. N. Z. J. Mar. Freshw. Res. 32:505-513. [Google Scholar]
- 2.American Public Health Association. 1995. Standard methods for the examination of water and wastewater, 19th ed. American Public Health Association, Inc., Washington, D.C.
- 3.American Society for Testing and Materials. 1996. Standard test method for detection and enumeration of C. perfringens from water and extracted sediments by membrane filtration. American Society for Testing and Materials (ASTM) publication no. D 5916-96. American Society for Testing and Materials, West Conshohocken, Pa.
- 4.Ashbolt, N. J., M. R. Dorsch, P. T. Cox, and B. Banens. 1997. Blooming E. coli, what do they mean?, p. 78-85. In D. Kay and C. Fricker (ed.), Coliforms and E. coli, problem or solution? The Royal Society of Chemistry, Cambridge, England.
- 5.Bisson, J., and V. Cabelli. 1980. Clostridium perfringens as a water pollution indicator. J. Water Pollut. Control Fed. 52:241-248. [PubMed] [Google Scholar]
- 6.Brettar, I., and M. Holfe. 1992. Influence of ecosystematic factors on survival of Escherichia coli after large-scale release into lake water mesocosms. Appl. Environ. Microbiol. 58:2201-2210. [DOI] [PMC free article] [PubMed] [Google Scholar]
- 7.Byappanahalli, M., and R. Fujioka. 1998. Evidence that tropical soil can support the growth of Escherichia coli. Water Sci. Technol. 38:171-174. [Google Scholar]
- 8.Carillo, M., E. Estrada, and T. C. Hazen. 1985. Survival and enumeration of the fecal indicators Bifidobacterium adolescentis and Escherichia coli in a tropical rain forest watershed. Appl. Environ. Microbiol. 50:468-476. [DOI] [PMC free article] [PubMed] [Google Scholar]
- 9.Chao, W., and R. Feng. 1990. Survival of genetically engineered Escherichia coli in natural soil and river water. J. Appl. Bacteriol. 68:319-325. [DOI] [PubMed] [Google Scholar]
- 10.Clark, D. L., B. B. Milner, M. H. Stewart, R. L. Wolfe, and B. H. Olson. 1991. Comparative study of commercial 4-methylumbelliferyl-β-d-glucuronide preparations with the Standard Methods membrane filtration fecal coliform test for the detection of Escherichia coli in water samples. Appl. Environ. Microbiol. 57:1528-1534. [DOI] [PMC free article] [PubMed] [Google Scholar]
- 11.Davies, C., J. Long, M. Donald, and N. Ashbolt. 1995. Survival of fecal microorganisms in marine and freshwater sediments. Appl. Environ. Microbiol. 61:1888-1896. [DOI] [PMC free article] [PubMed] [Google Scholar]
- 12.Desmarais, T. 2001. Factors influencing fecal indicator organism number in an urban, subtropical river system. M.S. thesis. University of Miami, Coral Gables, Fla.
- 13.Doyle, J., B. Tunnicliff, R. Kramer, R. Kuehl, and S. Brickler. 1992. Instability of fecal coliform populations in waters and bottom sediments at recreational beaches in Arizona. Water Res. 26:979-988. [Google Scholar]
- 14.Eckner, K. F. 1998. Comparison of membrane filtration and multiple-tube fermentation by the Colilert and Enterolert methods for detection of waterborne coliform bacteria, Escherichia coli, and enterococci used in drinking water and bathing water quality monitoring in southern Sweden. Appl. Environ. Microbiol. 64:3079-3083. [DOI] [PMC free article] [PubMed] [Google Scholar]
- 15.Edberg, S. C., M. J. Allen, D. B. Smith, and The National Collaborative Study. 1988. National field evaluation of a defined substrate method for the simultaneous enumeration of total coliforms and Escherichia coli from drinking water: comparison with presence-absence techniques. Appl. Environ. Microbiol. 55:1003-1008. [DOI] [PMC free article] [PubMed] [Google Scholar]
- 16.Edberg, S. C., M. J. Allen, D. B. Smith, and N. J. Kriz. 1990. Enumeration of total coliforms and Escherichia coli from source water by the defined substrate technology. Appl. Environ. Microbiol. 56:366-369. [DOI] [PMC free article] [PubMed] [Google Scholar]
- 17.Edberg, S. C., M. J. Allen, and D. B. Smith. 1991. Defined substrate technology method for rapid and specific simultaneous enumeration of total coliforms and Escherichia coli from water: collaborative study. J. Assoc. Off. Anal. Chem. 74:526-529. [PubMed] [Google Scholar]
- 18.Florida Department of Environmental Protection. 1996. Florida administrative code, surface water quality standards. 62-302. Florida Department of Environmental Protection, Tallahassee.
- 19.Fujioka, R., B. Roll, and M. Byappanahalli. 1997. Appropriate recreational water quality standards for Hawaii and other tropical regions based on concentrations of Clostridium perfringens, p. 405-411. In Proceedings of the Water Environment Federation's 70th Annual Conference and Exposition, vol. 4. Water Environment Federation, Alexandria, Va.
- 20.Fujioka, R., and C. Hardina. 1995. Soil: the environmental source of Escherichia coli and enterococci in Hawaii's streams. Environ. Toxicol. Water Qual. 6:185-195. [Google Scholar]
- 21.Fujioka, R., and L. K. Shizumura. 1985. Clostridium perfringens, a reliable indicator of stream water quality. J. Water Pollut. Control Fed. 57:986-992. [Google Scholar]
- 22.Gerba, C., C. Wallis, and J. Mellnick. 1975. Fate of wastewater bacteria and viruses in soil. J. Irrig. Drain. 101:157-174. [Google Scholar]
- 23.Hill, R., W. Straube, A. Palmisano, S. Gibson, and R. Colwell. 1996. Distribution of sewage indicated by Clostridium perfringens at a deep-water disposal site after cessation of sewage disposal. Appl. Environ. Microbiol. 62:1741-1746. [DOI] [PMC free article] [PubMed] [Google Scholar]
- 24.Howell, J. M., M. S. Coyne, and P. L. Cornelius. 1996. Effect of sediment particle size and temperature on fecal bacteria mortality rates and the fecal coliform/fecal streptococci ratio. J. Environ. Qual. 25:1216-1220. [Google Scholar]
- 25.Korhonen, L. K., and P. J. Martikainen. 1991. Survival of Escherichia coli and Campylobacter jejuni in untreated and filtered lake water. J. Appl. Bacteriol. 71:379-382. [DOI] [PubMed] [Google Scholar]
- 26.LaLiberte, P., and D. Grimes. 1982. Survival of Escherichia coli in lake bottom sediment. Appl. Environ. Microbiol. 43:623-628. [DOI] [PMC free article] [PubMed] [Google Scholar]
- 27.Lopez-Torres, A. J., T. C. Hazen, and G. A. Toranzos. 1987. Distribution and in situ survival and activity of Klebsiella pneumoniae and Escherichia coli in a tropical rain forest watershed. Curr. Microbiol. 15:213-218. [Google Scholar]
- 28.Medema, G., M. Bahar, and F. Schets. 1997. Survival of Cryptosporidium parvum, Escherichia coli, faecal enterococci, and Clostridium perfringens in river water: influence of temperature and autochthonous microorganisms. Water Sci. Technol. 35:249-252. [Google Scholar]
- 29.Mezrioui, N., B. Baleux, and M. Troussellier. 1995. A microcosm study of the survival of Escherichia coli and Salmonella typhimurium in brackish water. Water Res. 29:459-465. [Google Scholar]
- 30.Palmer, C. J., Y.-L. Tsai, A. L. Lang, and L. R. Sangermano. 1993. Evaluation of Colilert-Marine Water for detection of total coliforms and Escherichia coli in the marine environment. Appl. Environ. Microbiol. 59:786-790. [DOI] [PMC free article] [PubMed] [Google Scholar]
- 31.Sherer, B., J. Miner, J. Moore, and J. Buckhouse. 1992. Indicator bacteria survival in stream sediments. J. Environ. Qual. 21:591-595. [Google Scholar]
- 32.Shiaris, M., A. Rex, G. Pettibone, K. Keay, P. McManus, M. Rex, J. Ebersole, and E. Gallagher. 1987. Distribution of indicator bacteria and Vibrio parahaemolyticus in sewage-polluted intertidal sediments. Appl. Environ. Microbiol. 53:1756-1761. [DOI] [PMC free article] [PubMed] [Google Scholar]
- 33.Solo-Gabriele, H. M., M. A. Wolfert, T. R. Desmarais, and C. J. Palmer. 2000. Sources of Escherichia coli in a coastal subtropical environment. Appl. Environ. Microbiol. 66:230-237. [DOI] [PMC free article] [PubMed] [Google Scholar]
- 34.U.S. Environmental Protection Agency. 1986. Ambient water quality criteria for bacteria. EPA A440/5-84-002. U.S. Environmental Protection Agency, Washington, D.C.
- 35.U.S. Environmental Protection Agency. 1995. Method for detection and enumeration of C. perfringens in water and sediments by membrane filtration. EPA 600/R-95/03O. U.S. Environmental Protection Agency, Washington, D.C.
- 36.U.S. Environmental Protection Agency. 1997. Method 1600: membrane filter test method for enterococci in water. EPA 821/R-97/004. U.S. Environmental Protection Agency, Washington, D.C.
- 37.van Elsas, J. D., and K. Smalla. 1997. Methods for sampling soil microbes, p. 383-390. In C. J. Hurst, G. R. Knudsen, M. J. McInernery, L. D. Stetzenbach, and M. V. Walter (ed.), Manual of environmental microbiology. ASM Press, Washington, D.C.
- 38.Wolfert, M. 1998. Sources of E. coli to a tidally influenced river. M.S. thesis. University of Miami, Coral Gables, Fla.
- 39.Wright, R. C. 1989. The survival patterns of selected faecal bacteria in tropical fresh waters. Epidemiol. Infect. 103:603-611. [DOI] [PMC free article] [PubMed] [Google Scholar]


