

Abstract
It is important to identify factors that police can use to distinguish accurate from inaccurate eyewitnesses (i.e., reflector variables). In this study, we examined three such variables known to reflect eyewitness accuracy: confidence, decision time, and confidence entropy. We examined data from an online study (N = 1,072) and a field study involving real eyewitnesses (N = 75). Confidence was measured in three ways: human-coded verbal statements, AI-classified verbal statements, and numeric ratings. We compared the correspondence between these confidence metrics, how multiple reflector variables relate to accuracy, and whether these patterns differ across two datasets. All confidence metrics predicted identification accuracy to a similar extent, but numeric confidence derived from online participants was the strongest predictor of identification accuracy. In general, including multiple reflector variables better predicted decisions than any reflector variable alone, but there were diminishing returns associated with each additional variable. The results support indirect theoretical models of retrospective confidence and have practical implications for lineup procedures and policy, emphasizing the importance of documenting confidence and other reflector variables to assess the reliability of eyewitness identifications in the field.
Keywords: Reflector variables, Eyewitness, Retrospective confidence, Verbal confidence, Decision time, Confidence entropy
Subject terms: Human behaviour, Social behaviour
Introduction
Eyewitnesses are frequently at the center of criminal investigations. When someone witnesses a crime, police will often rely on that eyewitness to confirm that their suspect is the culprit by presenting witnesses with a photo lineup. Sometimes eyewitnesses recognize and identify the suspect, which can be strong evidence that the suspect is the culprit. However, eyewitnesses are not always accurate. Eyewitnesses often fail to pick the suspect1 and, even if the suspect is identified, that person may not be the true culprit2.
In laboratory experiments examining eyewitness accuracy, researchers know whether the suspect is guilty or innocent. In real cases, investigators do not yet know if the suspect is the culprit. Therefore, it is important to identify factors that help police distinguish accurate from inaccurate lineup decisions, as this may help prevent wrongful convictions. These factors are known as reflector variables3—variables that are present (or stronger) when an eyewitness makes a correct identification rather than an incorrect identification.
Unlike estimator variables (e.g., lighting at the event) and system variables4 (e.g., non-blind administrator), which affect the likelihood that an eyewitness will make an accurate identification, reflector variables (e.g., confidence) are observable behaviors or reports that reflect the accuracy of the eyewitness and tell the observer something about the accuracy of that specific eyewitness’ decision. Note that reflector variables are distinct from other variables that covary with accuracy, but do not change when the eyewitness is accurate versus inaccurate (e.g., individual differences like face memory ability). Reflector variables are also most useful when other evidence-based recommendations are followed because pristine procedures help preserve both the eyewitness’s memory and their metacognitive sense of their own accuracy as much as possible1,5. Reflector variables also have considerable applied value. A toolbox of reflector variables that can be easily measured and documented, alongside clear guidance for interpreting these indicators, would facilitate efficient and effective investigations.
There are several well-researched reflector variables in eyewitness science including confidence5decision time6and witness decision-making processes7,8. There is, however, a limited amount of research9–12 addressing whether using multiple measures of the same reflector variable (e.g., both verbal and numeric confidence) or multiple types of reflector variables (i.e., a combination of decision time and confidence) improves an observer’s ability to distinguish between accurate and inaccurate eyewitnesses compared to relying on one variable alone.
Reflector variables all provide information about the likelihood that a particular eyewitness decision is accurate, but some reflector variables or ways of measuring those variables will have a stronger association with accuracy. Verbal confidence, for instance, is obtained directly from the eyewitness in their own words but relies on a person to observe and interpret the eyewitness’s statement. Those interpretations can differ between observers for reasons that are not related to eyewitness accuracy—different people will interpret the same words and tone in different ways13. Other times, reflector variables are measured in a way that does not rely on human judgment or perception (e.g., decision time measured with a clock or computer). The current study explores several distinct operationalizations of eyewitness confidence, as well as objective measures of decision time and confidence entropy, and their association with eyewitness accuracy. Each variable is assessed alone and alongside other reflector variables in both an online population and a sample of real witnesses.
Individual reflector variables
Findings from both lab6 and field14 studies show that eyewitnesses who make fast identification decisions tend to be more accurate than those who make slow identification decisions. Similarly, eyewitnesses who are highly confident in their decision also tend to be more accurate than eyewitnesses reporting moderate or low confidence5. This may be because fast, high-confidence responses are signs of true, correct recognition processes15. When a witness has formed a sufficiently strong memory of another person’s face and they encounter that face again, they will experience a feeling of familiarity almost immediately16,17. Slower decisions tend to be associated with more deliberative processes involving effortful comparisons between the faces in the lineup15suggesting that the eyewitness’s memory is weak or the person they remember is not in the lineup16,17. Strong, immediate feelings of familiarity and recognition also tend to lead to reports of high confidence in any decision associated with that recognition experience, whereas a decision that a person has to reason through or that lacks a strong sense of familiarity will be associated with lower confidence5.
Decision time
Decision time can be recorded either objectively (using a timer) or subjectively (i.e., an officer retrospectively estimates decision time). Witnesses’ and observers’ subjective reports of decision time, as well as objective timing, tend to be strongly correlated10. This means that asking eyewitnesses to provide subjective reports of decision speed will provide useful information about the accuracy of that decision. That said, as would be expected, the effect sizes associated with subjective decision time and accuracy are generally smaller than when using objective decision time. The link between decision time and accuracy has been consistently supported by laboratory studies and studies involving real eyewitnesses14,18.
Eyewitness confidence
If a lineup follows best practices, very confident eyewitnesses tend to be more accurate than less confident eyewitnesses5. An eyewitness’s report of their confidence is inherently subjective—it is a metacognitive judgment about how strongly they believe the identification materials matched their internal memory trace. However, confidence can be measured in ways that are more objective or subjective.
Numeric and verbal confidence tend to similarly predict eyewitness accuracy19although verbal confidence statements may contain diagnostic cues about accuracy above and beyond the information communicated when using numeric confidence20. Verbal eyewitness confidence tends to be a more subjective confidence metric than numeric confidence (in that different observers interpret the same verbal confidence statement in different ways13. To make verbal confidence more objective, one would need to lessen the variation between observers in the way verbal confidence is interpreted. One way to do this is to use automated or algorithmic approaches to categorize verbal confidence rather than relying on human interpretations20,21. A computerized, artificial intelligence (AI) model may be more objective because it is trained to classify verbal confidence consistently, without the variation seen among human decision-makers who will make different decisions depending on their mood or available contextual information.
Confidence entropy
Confidence entropy is a new reflector variable that measures the vagueness of a witness’ confidence statement. Witnesses who express their confidence level clearly have low confidence entropy and those who express their confidence statement with more ambiguous language have high confidence entropy. This metric is calculated based on a natural language processing model that classifies witness confidence statements into low, medium, and high bins21. Confidence entropy reflects the degree to which a statement clearly belongs to one bin (low entropy) or has a more diffuse probability in multiple bins (high entropy). Confidence entropy predicts accuracy above and beyond confidence level21.
Multiple reflector variables
Most studies have found that confidence and decision time provide independent information that can be used to predict whether an eyewitness picked a suspect or a filler9,10,16,18,20. Some other studies have found no additive effect of confidence and decision time11,14. There are many explanations for these discrepant findings including that these studies use a mix of lab and field data, as well as objective and subjective measures of decision time and a variety of analyses to measure these effects22–24. Thus, an open question exists about the extent to which it could be helpful to consider multiple reflector variables when evaluating eyewitnesses’ decisions, and whether multiple reflector variables could be used to create a useful indirect model of eyewitness accuracy that could be used in investigations.
Method
Data sources
Online dataset
This study includes two independent sources of secondary data. The first sample, which we call the “online dataset”, was originally collected and reported in Experiment 1 of Dobolyi and Dodson (2018)25. For transparency, some responses from this dataset were used in the training process of the AI model used in this study. Because some of the same data were used for both training and for our analyses, there is some data leakage. This results in an increased risk of model overfitting, as the model may perform particularly well on this dataset. In this study, participants (all of whom identified as white) were recruited from Amazon Mechanical Turk. During an encoding phase, participants studied a series of 12 faces, half Black and half white. After a short retention interval, participants completed 12 separate six-person, simultaneous lineups with unbiased instructions. Half of the lineups were target-present and half were target-absent. After each lineup, participants were asked to explain their confidence in their own words, explain their reasoning for their confidence judgment, and rate their numeric confidence.
We chose this dataset as it is one of the few in the eyewitness literature that includes verbal confidence, numeric confidence, and objective decision time from a large sample of witnesses. The sample contains 347 individual eyewitnesses and 1072 unique identifications.
In this study, we include only lineup identifications. That is, we excluded data associated with lineup rejections. There are several different reasons that an eyewitness might reject a lineup, and they are each the result of a different kind of decision process (e.g., each photo was carefully examined, and none satisfied their internal criteria for a match to their memory; they did not immediately recognize anyone and that was enough for that person to reject the lineup). There is limited research on reflector variables for correct lineup rejections12. Thus, consistent with other work in this area14we chose to exclude lineup rejection data.
Real dataset
The second sample, which we refer to as the “real dataset”, comes from a prior field experiment about the impact of different lineup procedures on lineup outcomes26. In this study, real witnesses to crimes recruited from four jurisdictions were randomly assigned to make an identification from a computerized delivery of either a simultaneous or sequential lineup. These witnesses were audio recorded while completing the lineup task, administered by a police officer as part of their investigation. The audio recordings captured the eyewitnesses’ confidence statements immediately after their lineup decision. We included only identifications from this field study where the lineup used pristine conditions and in which there was a clear audio recording of the witness’ confidence statement. We again excluded lineup rejections for the same reason as in the online dataset (N = 75; the same sample used in Quigley-McBride & Wells, 202314). We chose this dataset because, to our knowledge, this is one of the only field studies to collect verbatim confidence statements and objective decision time after real lineups that follow best practice recommendations (pristine lineup conditions are required to examine how eyewitness confidence and decision time is related to identification accuracy5.
It is important to note that, because this is field data, we do not know ground truth about suspect guilt27. While some suspects in real lineups are likely to be culprits, we do not—and cannot—know how many. Results from the real dataset can speak to whether the patterns found in lab studies replicate in the real world. Including both samples in this study enabled us to investigate whether the pattern of findings in a lab study replicated in a real-world sample. We use the label “full dataset” when discussing results collapsed across the online and real datasets.
Variables
Verbal confidence
In the online dataset, participants were first asked “in your own words, please explain how certain you are in your response” and then asked, “please provide specific details about why you made your written response above”. The responses from these two questions were combined to form the verbal confidence statement. In the real dataset, witnesses explained their confidence orally in response to the officer’s query about their confidence. The prompt that officers were trained to use was “using words and not numbers, how certain are you that this is the person you saw commit the crime”. That said, this statement was not always delivered using this precise language in practice by the officers, but it was generally similar to this statement. Two research assistants transcribed the audio recordings from the real dataset and then compared their transcriptions to check for errors. Any discrepancies were resolved by discussion and listening to the recording again.
Verbal confidence was interpreted in two main ways. First, a large language model trained to evaluate verbal confidence statements21 was used to bin these confidence statements into low (0–24%), medium (25%−74%), and high (75%−100%) categories. Secondly, two research assistants were trained in interpreting verbal confidence statements using an unrelated sample of witnesses who provided both verbal and numeric statements of their confidence. During training, coders read verbal confidence statements and then evaluated whether the witness was trying to express low (0–24%), medium (25%−74%), or high (75%−100%) confidence. The coders were then given feedback about the numeric confidence values the witness actually selected to help them calibrate their coding. Coders completed batches of 30 confidence statements in this manner until they reached sufficient reliability (at least 85%). Each coder then independently evaluated all verbal confidence statements from the full dataset. In the field, officers primarily document witness confidence verbally, in the witness’ own words28. Thus, we aimed to have multiple metrics of how to evaluate this ecologically valid measure of confidence and explore the extent to which these different metrics relate to lineup outcomes.
Numeric confidence
In the online dataset, participants were asked to “please translate your written expressions of certainty onto the following numeric scale” with anchors of “not at all certain” and “completely certain”. Participants could select from: 0%, 20%, 40%, 60%, 80%, or 100%. In the real dataset, participants were only asked to report their confidence in their own words (though some still did use numbers to describe their confidence). To provide some proxy of the numeric confidence of participants in the real dataset, we used data from Quigley-McBride and Wells (2023)14. In this study, a group of 72 participants listened to all 75 confidence statements in the real dataset and reported how confident they thought the witness was on a scale from 0% to 100% in 10% increments. We categorized these numeric confidence reports into low (less than 50%), medium (between 50% and 80%), or high (80% or more) bins.
We note that numeric confidence in the online dataset is not the same as numeric confidence in the real dataset. Numeric confidence in the online dataset is the witness’s self-reported numeric confidence whereas numeric confidence in the real dataset is the perceived average numeric confidence assessed by outside evaluators—the value is an average crowdsourced from lay individuals. We use this as our best available proxy as we know of no existing field dataset that includes witness reports of both verbal and numeric confidence.
Decision time
In the online dataset, an objective, automated metric of decision time was used. Decision time began when the lineup was loaded on the page and ended when participants made their lineup selection. For the online dataset, we standardized decision time using the mean and standard deviation of decision time across all participants in only the online dataset.
Because of the differences between the procedures of simultaneous and sequential lineups, we created a separate standardized measure of decision time for each of these lineup types in the real dataset. For the real dataset, we standardized decision time separately for sequential lineups (the time from the onset of each photo to the eyewitnesses’ verbal or keystroke decision about that photo) and simultaneous lineups (the time from the onset of each lineup to the eyewitnesses’ verbal or keystroke decision about that lineup) using the means and standard deviations of decision times for each of those lineup types14. Once decision time was standardized, the cutoffs for each quartile were calculated so that a categorical variable could be created for data visualization—“Very Quick” for the 1st quartile, “Quicker” for the 2nd quartile, “Slower” for the 3rd quartile, and “Very Slow” for the 4th quartile.
Lineup outcomes
As discussed above, we do not have ground truth for the real dataset. In the real dataset, eyewitnesses either made a suspect identification (which may or may not be the actual culprit) or a filler identification (which is definitely inaccurate). For the online dataset, we do have ground truth, so we know whether participants made an accurate identification or not (selected the innocent suspect or a filler). In the online dataset, we refer to correct identifications as guilty suspect identifications. In contrast, for the real dataset, we refer to them as police suspect identifications to reflect this difference. We use the term filler identifications to refer to inaccurate identifications of fillers from either dataset.
Analytic plan
We pre-registered our key research questions. We also preregistered our intention to use a different online dataset but switched to using Experiment 1 from Dobolyi & Dodson (2018) as this dataset contained a larger sample and a more precise decision time measure. Briefly, these questions focused on the correspondence between different methods of assessing confidence, the relationship between reflector variables, and whether these patterns differed between the online and real datasets. Correspondence between measures of verbal confidence was measured using a weighted Cohen’s kappa (k), percent agreement, and correlation (r), with higher numbers indicating greater correspondence. We calculated a weighted kappa for each pair of confidence classification methods so that when different approaches resulted in classifications that were more disparate (i.e., one classification method indicated the confidence level was high while another indicated the same confidence judgment was low), this was weighted more heavily than smaller differences (e.g., high versus medium, or medium versus low).
Typically, when evaluating the link between a reflector variable and accuracy, eyewitness identification researchers will calculate positive predictive value (PPV)—the probability that an eyewitness chose the guilty suspect given that they identified a suspect. This is typically calculated by dividing the number of hits (guilty suspect identifications) by the total number of guilty and innocent suspect identifications. However, because we do not know if the suspects in the real dataset are the true culprit, we cannot calculate PPV for those data. In order to compare performance in the online dataset to performance in the real dataset, we instead calculated the probability the eyewitness selected the suspect given that they chose from the lineup29. For the online dataset, this was done by dividing the number of guilty suspect identifications by the total number of identifications (guilty suspect, innocent suspect, and filler identification). For the real dataset, this is calculated by dividing the number of suspect identifications (which may or may not be correct) by the total number of choosers (suspect identifications and filler identifications). When this value is presented in text or a Figure, it is denoted by P (Suspect ID | Chooser) and can be interpreted as the probability of a suspect identification given that the eyewitness made a choice from the lineup.
For inferential statistics, when the outcome variable was binary (e.g., eyewitness decision: suspect identification = 1 and filler identification = 0), logistic regressions were run. When the outcome variable was continuous (e.g., numeric confidence), a multiple regression was run. Significant results (p <.05) and nonsignificant results are reported with Standardized Betas (β). Effect sizes are reported as Odds Ratios (ORs) for binary outcome variables or Cohen’s d (d) for continuous outcome variables.
When comparing nested models, Chi-Squared Goodness-of-Fit comparisons on the change in deviance between models were calculated, where significant results and a larger Chi-Square value indicate a better-fitting model. To determine whether non-nested variables or classification methods were better predictors of suspect identifications, we compared the model fit for the analyses run using the Vuong test for comparing the fit of non-nested models (Vuong, 1989; R package “nonnest2”). Models were also compared by assessing the amount of variance explained by the models using McFadden’s R2 (for logistic regression and binary outcomes) and change in (ΔR2) to estimate the variance in any particular outcome variable that is explained by the predictors in a model. We calculated 95% confidence intervals for proportions using the normal approximation of the binomial distribution: M
 *
*  .
.
Transparency and openness
This study was pre-registered: https://aspredicted.org/55L_M47. The data from the online dataset is used here with permission from the corresponding author. The data from the real dataset is not publicly available due to privacy restrictions. The analytic code is publicly available on the project’s Open Science Foundation page: https://osf.io/quwr5. The experimental protocol was reviewed and approved by the University of Mississippi Institutional Review Board (IRB). All methods were carried out in accordance with IRB guidelines and regulations. All participants provided informed consent.
Results
How do different confidence metrics compare?
We examined the extent to which each confidence classification method resulted in the same outcome (low, medium, or high) for each confidence statement. For the real dataset (Table 1), the classifications of verbal confidence completed by the two human coders had the highest agreement, followed by Trichotomized Numeric Confidence and Human Coder 1 or 2. The classifications made by the AI model for the real dataset did not correspond very well with any other metrics.
Table 1.
Correspondence between confidence classification methods in the real dataset.
| Classification Method #1 | Measure | Classification Method #2 | |||
|---|---|---|---|---|---|
| Human Coder 1 | Human Coder 2 | AI Model | Trichotomized | ||
| Human Coder 1 | Correlation (r) | - | |||
| % agreement | - | ||||
| Cohen’s k | - | ||||
| Human Coder 2 | Correlation (r) | 0.748 | - | ||
| % agreement | 81.3% | - | |||
| Cohen’s k | 0.648 | - | |||
| AI Model | Correlation (r) | 0.381 | 0.504 | - | |
| % agreement | 34.7% | 26.7% | - | ||
| Cohen’s k | 0.207 | 0.250 | - | ||
| Trichotomized Numeric Confidence | Correlation (r) | 0.689 | 0.708 | 0.337 | - |
| % agreement | 46.7% | 42.7% | 28.0% | - | |
| Cohen’s k | 0.515 | 0.506 | 0.164 | - | |
Note. N = 75.
For the online dataset (Table 2), correspondence between all confidence classification methods was improved, except when assessing human coders—their judgments aligned about as often as in the real dataset. The online dataset also showed very high correspondence between the AI model classifications and the human coders. Trichotomized Numeric Confidence resulted in similar classifications much of the time when compared to the AI model and the human coders. For an analysis of the types of confidence statements that resulted in the more extreme disagreements in classifications (e.g., one method indicated high confidence and another low confidence), see Appendix A of Supplementary Materials.
Table 2.
Correspondence between confidence classification methods in the online dataset.
| Classification Method #1 | Measure | Confidence Classification Method #2 | |||
|---|---|---|---|---|---|
| Human Coder 1 | Human Coder 2 | AI Model | Trichotomized | ||
| Human Coder 1 | Correlation (r) | - | |||
| % agreement | - | ||||
| Cohen’s k | - | ||||
| Human Coder 2 | Correlation (r) | 0.695 | - | ||
| % agreement | 72.4% | - | |||
| Cohen’s k | 0.577 | - | |||
| AI Model | Correlation (r) | 0.876 | 0.720 | - | |
| % agreement | 87.9% | 72.8% | - | ||
| Cohen’s k | 0.790 | 0.588 | - | ||
| Trichotomized Numeric Confidence | Correlation (r) | 0.710 | 0.614 | 0.732 | - |
| % agreement | 58.0% | 43.0% | 58.0% | - | |
| Cohen’s k | 0.620 | 0.438 | 0.641 | - | |
Note. N = 1072.
How do different confidence metrics predict eyewitness decisions?
We tested how well each confidence classification measure reflected the rate of police suspect identifications in the real dataset (Fig. 1) and guilty suspect identifications in the online dataset (Fig. 2) among choosers. We also present logistic regression results with hits (versus not hits) as the outcome with continuous numeric confidence or confidence categories treated as continuous (high = 3, medium = 2, low = 1) as the predictor. A full summary of the model output appears in Supplementary Materials (Appendix B, Table 4A).
Fig. 1.
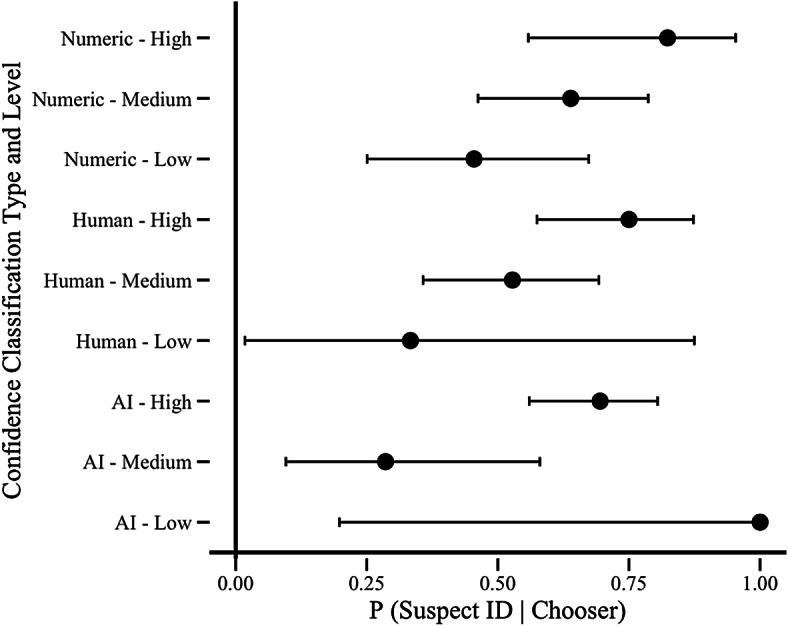
Police suspecti identification rate by confidence classification method for the real dataset. Note. Error bars are 95% Confidence Intervals. Very few cases were classified as low confidence by AI (n = 2) and humans (n = 3), so these Confidence Intervals are very large. Guilty suspect identification rate by numeric confidence for the online dataset Note. Error bars are 95% Confidence Intervals.
Fig. 2.

Guilty suspect identification rate by numeric confidence for the onlinedataset. Note. Error bars are 95% Confidence Intervals.
Numeric confidence
Higher levels of numeric confidence were consistently associated with higher (guilty) suspect identification rates than lower levels of numeric confidence. For the real dataset (Fig. 1), eyewitnesses who made high confidence identifications selected the police suspect 82% of the time. Identifications made with medium confidence were police suspect identifications 64% of the time. Low confidence was associated with police suspect identifications in the real dataset 45% of the time. For the online dataset (Fig. 2), participants who made an identification with high numeric confidence identified the guilty suspect 84% of the time, whereas identifications made with medium numeric confidence were correct 55% of the time. Participants who made an identification with low numeric confidence chose the guilty suspect only 21% of the time. Thus, there was a strong association between self-reported numeric confidence and police suspect identifications from the real dataset (β = 1.18, p =.020, R2 = 6.0%) and guilty suspect identifications in the online dataset (β = 2.04, p <.001, R2 = 18.7%).
Verbal confidence: human coders
When human coders classified a statement as high confidence, this was associated with significantly higher rates of police suspect identifications in the real dataset (Human Coder 1: β = 1.10, p =.031, R2 = 5.0%; Human Coder 2: β = 1.24, p =.015, R2 = 6.4%) and guilty suspect identifications in the online dataset (Human Coder 1: β = 1.71, p <.001, R2 = 13.2%; Human Coder 2: β = 1.38, p <.001, R2 = 8.9%). In the real dataset (Fig. 1), verbal confidence statements classified as high confidence by the human coder were associated with a 75% police suspect identification rate. Statements judged to be medium confidence had a 53% police suspect identification rate. Statements that appeared to be low confidence to the human coders were associated with police suspect identifications 33% of the time. In the online dataset (Fig. 2), high confidence in the online dataset was associated with a 73% guilty suspect identification rate in the online dataset. Medium confidence statements had a 38% guilty suspect identification rate and low confidence resulted in a correct identification 19% of the time. Thus, when an eyewitness appeared to be more confident to our human coders, those statements were more likely to be associated with a police or guilty suspect identification in both datasets.
Verbal confidence: AI model
For the real dataset, confidence statements classified as high confidence by AI were associated with a 69% rate of police suspect identifications which was higher than the rate associated with medium confidence (29%). There were only two confidence statements classified by the AI model as low confidence in the real dataset, and both were police suspect identifications. For online participants, confidence statements classified as high confidence by AI were associated with a higher rate of guilty suspect identifications (73%) when compared with those classified as medium confidence (37%) and low confidence (17%). The AI model’s confidence classifications for confidence statements in the real dataset were not significantly associated with police suspect identifications (β = 0.78, p =.118, R2 = 2.6%) but, in the online dataset, the classifications made by the AI model significantly predicted whether participants picked the guilty suspect (β = 1.82, p <.001, R2 = 15.0%).
Comparing confidence classification methods
We compared how well confidence classification methods predicted whether eyewitnesses identified the police/guilty suspect (“hits”). We compared model fit for models with Numeric Confidence (Continuous) or Trichotomized Numeric Confidence to models with classifications made by AI or a human coder as the predictor. If any of these models were a better fit, this would suggest that this confidence metric more closely reflected eyewitness accuracy than eyewitness’s self-reported numeric confidence judgments. A full summary of these results and model fit statistics appear in Tables S4A and S4B in Supplementary Materials.
For the real dataset, there were no significant differences in how well the models fit regardless of which confidence metric was used to predict suspect identifications (all p >.05; see Table S4A). The primary difference observed in these models was that the AI classifications explained less of the variation in hits than other confidence metrics (3.4% and 3.3% less variation explained than numeric confidence and trichotomized confidence, respectively).
In the online dataset, the models with Continuous Numeric Confidence and Trichotomized Numeric Confidence as predictors resulted in similar model fit (Continuous vs. Trichotomized: z = 1.60, p =.055). In addition, trichotomized confidence did not result in a significantly better fitting model than the AI classification model (z = 1.59, p =.056), but continuous numeric confidence did (z = 2.80, p =.003). However, the human coder’s judgments resulted in worse fitting models (Continuous vs. Human Coder 1: z = 3.67, p <.001; Trichotomized vs. Human Coder 1: z = 2.65, p =.004). The changes in variation explained (ΔR2)mirrored these patterns, with numeric confidence and trichotomized confidence explaining more variation in hit rates than other confidence metrics (between 2.4% and 5.5% more variation explained).
Thus, confidence metrics derived from the online participants themselves (Continuous and Trichotomized Numeric Confidence), and the AI model classifications were more closely linked with guilty suspect identifications than the human coders’ judgments.
Combining confidence classification methods
Some prior work has suggested that verbal and numeric measures of confidence might provide different cues to accuracy20. We tested whether multiple confidence classification metrics might better predict suspect identifications than one confidence classification method alone by running models with predictors added in a stepwise manner. For a full list of these model fit comparisons and ΔR2 refer to Table S4C in Supplementary Materials.
For the real dataset, adding the trichotomized confidence alongside the AI model classifications significantly improved the fit of the model compared with just the AI classifications alone (χ2 [1, N = 75] = 3.96, p =.047, ΔR2 = 4.0%). All other comparisons between models with two or three confidence metrics and simpler models did not result in a significantly better fit. For the online dataset, all models with two confidence metrics included as predictors were a significantly better fit to the data than any model with a single confidence metric as a predictor (see Table S4C). In particular, combining Trichotomized Numeric Confidence alongside any other metric to predict suspect identification rates resulted in the largest increases in variation explained (Human Coder 1 vs. Human Coder 1 + Trichotomized: χ2 [1, N = 1072] = 77.56, p <.001, ΔR2 = 5.2%; AI Model vs. AI model + Trichotomized: χ 2 [1, N = 1072] = 59.13, p <.001, ΔR2 = 4.0%). The AI classifications and human coders’ judgments also added to the variation explained by the models, but to a lesser degree (ΔR2 = 1.1–2.1%).
When comparing three confidence metrics to the models with combinations of two, there was no significant improvement in model fit when the human coders’ classifications were added to the model with the trichotomized and AI confidence (χ2[1, N = 1072] = 0.08, p =.779, ΔR2 = 0.0%). However, model fit improved when the AI classifications were added to the model with trichotomized and human coded confidence (χ2 [1, N = 1072] = 7.68, p =.006, ΔR2 = 0.5%). The largest improvement occurred when trichotomized confidence was included alongside AI and human coder classifications,though (χ2 [1, N = 1072] = 54.38, p <.001, ΔR2 = 3.6%).
Thus, in the online dataset, there were diminishing returns associated with using additional confidence classification methods when predicting the rate of guilty suspect identifications unless that additional confidence metric is based on the eyewitness’s own self-reported numeric confidence. This is perhaps not surprising given that a numeric representation of the participants’ own feelings about their identification decision should be more closely linked to hits than a determination made by another person or a language algorithm. In the real dataset, more variation was also explained when AI classifications and human judgments were incorporated alongside participants’ self-reported numeric confidence. Though there were no significant differences in model fit, the changes in variation explained showed a similar pattern of consistent but diminishing benefits as more confidence metrics were added to the models. Note that, because the numeric confidence levels were not directly obtained from the eyewitness, this may explain why trichotomized confidence lowered predictive value in the real dataset.
Are models improved by adding reflector variables to predict eyewitness decisions?
We examined whether decision time and confidence entropy were also associated with accuracy in these datasets. Figure 3 A-C plots the relationship between confidence (A), decision time (B), or confidence entropy (C) and the probability that an identification decision was an identification of the guilty suspect (online dataset) or the police suspect (real dataset).
Fig. 3.

Graphs showing the association between numeric confidence (A), confidence entropy (B), and decision time (C) and the rate of police and guilty suspect identifications.
Though standardized decision time was used for analyses, we report raw values when presenting descriptive statistics. The link between decision time and the rate of suspect identifications in the real dataset was not statistically significant (Mfiller = 59.46s; Msuspect: 25.13s; β = 1.00, p =.064, OR = 0.40, R2 = 7%), but was significant in the online dataset (Mfiller = 16.64s; Msuspect: 11.13s; β = −0.93, p <.001, OR = 0.51, R2 = 5%). For the real dataset, police suspect identifications were also associated with statements that were clearer and less vague significantly more often than filler identifications (M filler = 0.98; Msuspect: 0.73; β = −1.25, p =.014, OR = 0.23, R2 = 7%). For the online dataset, there was a significant negative relationship between confidence entropy and accuracy such that identifications associated with clear statements were more likely to be guilty suspect identifications (M filler = 0.72; Msuspect: 0.44, β = −1.59, p <.001, OR = 0.10, R2 = 0.11).
What combination of reflector variables most strongly predicts suspect identifications??
We explored whether combinations of confidence, decision time, and confidence entropy would better predict eyewitness decisions than any one reflector variable alone—once with human coded classifications and another time with the AI Model’s classifications as the confidence predictor. The model output can be found in Appendix D of the Supplementary Materials, Table S5A (human coder 1) and Table S5B (AI Model), as well as model fit statistics in Table S6A (human coder 1) and Table S6B (AI Model).
In the real dataset, decision time (β = -0.91, p =.103, OR = 0.47) and confidence entropy (β = −1.21, p =.029, OR = 0.25) together explained 13% of the variation in police suspect identification rates, which is 6% more variation explained compared with either reflector variable alone and was a significantly better fit to these data (vs. decision time:χ 2[1, N = 75] = 5.10, p =.024; vs. confidence entropy: χ2 [1, N = 75] = 4.80, p =.028). The model with confidence (β = 1.07, p =.053, OR = 2.49) and decision time (β = −0.95, p =.085, OR = 0.48) together explained 12% of the variation in police suspect identification rates (8% and 5% more, respectively) and fit these data better than a model with just human-coded confidence (χ2 [1, N = 75] = 5.43, p =.020) or decision time (χ2 [1, N = 75] = 4.80, p =.028). Human-coded confidence (β = 0.61, p =.302, OR = 1.72) and confidence entropy (β = −0.94, p =.093, OR = 0.30) explained 8% of the variation in police suspect identification rates, a 3% and 1% increase from models with each predictor alone. The model with both human-coded confidence, χ2 (1, N = 75) = 2.90, p =.089, and confidence entropy, χ2 (1, N = 75) = 1.08, p =.298, was not a significantly better fit to these data than the models with these predictors alone.
All three reflector variables were examined in a model together and compared with the models with only two predictors. In the real dataset, the full model was not a significantly better fit to these data than any of the models with only two reflector variables. When this series of analyses was run with the online data set, similar effects emerged with one exception—the model fit significantly improved for all models that included additional reflector variables (Table S5A). This includes the model fit for the full model with all three reflector variables as compared to all simpler models. In addition, the full model in the online dataset explained 17% of the variation in guilty suspect identification rates, which was at least 2% more variation explained than any simpler models.
Similar patterns of results were observed when comparing the models with two reflector variables and three reflector variables to simpler models were found when the AI model was used for the confidence measure (Table S5B, Table S6B) in both datasets. The only substantive difference between these results for the real dataset and the online dataset can be explained by statistical power. Because the online dataset had significantly more data than the real dataset, the model fit comparisons showed larger differences for the online data than in the real dataset, though the size of the effects observed were not substantially different across datasets.
Overall, there was some improvement in model fit when more reflector variables were added to the model. As for using multiple confidence metrics, though, there were diminishing returns seen as more predictors were added to the models—the increases in R2 were smaller. In addition, some reflector variables had stronger effects—confidence entropy and decision time tended to improve models more than either human-coded or AI-classified confidence.
Discussion
The current study had three main goals: to compare the utility of three different confidence metrics, to explore how confidence, decision time, and confidence entropy relate to eyewitness decisions alone and together, and to evaluate how these patterns compare between online and real-world eyewitnesses. Our results showed that all confidence measures performed similarly in predicting police and guilty suspect identifications, but measures obtained directly from the participant or eyewitness were more strongly associated with accuracy. This suggests that police lineup policies should prioritize the documentation of verbatim confidence immediately after the eyewitness makes a lineup decision, rather than focusing on the specific format of the eyewitness’s confidence.
Our results inform theoretical models of retrospective confidence judgments within and beyond the eyewitness domain. Figure 4 illustrates how the different reflector variables examined in this study may relate to two latent variables: an eyewitness’ metacognition about their recognition experience, and the actual extent to which the identified person matches their memory. In other words, reflector variables provide insights into an eyewitness’ subjective experience of the identification and whether the person they identified matches their memory of someone they witnessed in connection with a crime. Some reflector variables—such as human- or AI-classified verbal confidence—are further removed from these latent variables, serving as indirect measures of a variable that is associated with the latent variables depicted in Fig. 4. These measures also vary in how consistently they can be applied. For example, human-coded confidence might differ between and within raters, whereas AI-coded confidence does not.
Fig. 4.

Theoretical processes underlying reflector variables in eyewitness identification procedures.
Therefore, our results align with inferential or indirect access models of retrospective confidence30,31. These models propose that people cannot directly access the relevant memory trace30 making it difficult to fully report what has or has not been retrieved. Instead, people must rely on their recognition experience and apply heuristics to make a subjective judgment about the strength of their own memory (e.g., believing they should feel more confident in a quick response32,33.
Our results suggest that different reflector variables might offer different ways to assess the same underlying constructs. Using multiple reflector variables together better predicted police and guilty suspect identifications than only one reflector variable alone. However, each additional variable contributed unique but overlapping predictive power, consistent with the idea that different confidence metrics, decision time, and confidence entropy all capture indirect signals of metacognition and the strength of the recognition experience30. It is worth noting that the newest reflector variable we tested—confidence entropy—was strongly associated with police and guilty suspect identification rates. In fact, confidence entropy explained as much or more variation in suspect identification rates than more traditional reflector variables (i.e., confidence and decision time). This highlights the importance of theorizing about and testing novel reflector variables that might improve our ability to estimate these underlying constructs.
Importantly, we found similar patterns in both the online and real datasets. Results with both datasets mirrored existing patterns in the empirical literature, suggesting that patterns seen in lab-based research on reflector variables can be generalized to real eyewitness identification procedures and investigations. This also highlights the importance of gathering field data to determine whether empirical findings replicate in the real world and to clarify the true size of those effects.
One limitation of this study is that observed differences between the real and online datasets might be due to the low sample size in the real dataset. In particular, there were a lack of low-confidence data from real-world eyewitnesses. Additionally, confidence statements in the real dataset were given orally to police and then transcribed, whereas online participants typed their own statements. These differences in data collection might have influenced the results in this study, especially confidence classifications from the AI model, which is trained to interpret all of the information in typed statements (e.g., punctuation, capital letters).
Reflector variables can provide police with immediate cues about the likely accuracy of an eyewitness identification, which may improve investigative efficiency and accuracy. This study supports the use of confidence as a reliable cue—regardless of how it is measured—and shows that online studies may underestimate the predictive power of reflector variables in real cases. In addition, these results suggest that the effects observed in online studies can be generalized to the use of reflector variables in real cases. The current research also demonstrates the importance of considering multiple reflector variables when assessing the likelihood that an eyewitness made an accurate identification, as each additional reflector variable improved our ability to predict both police and guilty suspect identifications. These findings provide new insights into the relationship between and impact of reflector variables and suggest ways to focus policy efforts to ensure investigators measure and document factors that can be used to evaluate the reliability of eyewitness identifications in real cases.
Acknowledgements
We thank Chad Dodson and David Dobolyi for sharing their dataset with us for this study.
Author contributions
R.G. and A.Q. conceptualized the project. R.G. and A.Q. designed the research questions and obtained the data. A.Q. conducted the analyses. R.G. and A.Q. wrote the manuscript and reviewed and approved it for submission.
Data availability
This study was pre-registered: https://aspredicted.org/55L_M47. The data from the online dataset is used here with permission from the corresponding author for Dobolyi & Dodson (2018; corresponding author is Dodson). The data from the real dataset is not publicly available due to privacy restrictions, but the first author (Quigley-McBride) can be contacted if there are any questions about these data. The analytic code is publicly available on the project’s Open Science Foundation page: https://osf.io/quwr5.
Declaration
Competing interests
The authors declare no competing interests.
Footnotes
Publisher’s note
Springer Nature remains neutral with regard to jurisdictional claims in published maps and institutional affiliations.
References
- 1.Wells, G. L. et al. Policy and procedure recommendations for the collection and preservation of eyewitness identification evidence. Law Hum. Behav.44, 3–36 (2020). [DOI] [PubMed] [Google Scholar]
- 2.The National Registry of Exonerations. Interactive data display. https://www.law.umich.edu/special/exoneration/Pages/Exonerations-in-the-United-States-Map.aspx
- 3.Wells, G. L. Psychological science on eyewitness identification and its impact on Police practices and policies. Am. Psychol.75, 1316–1329 (2020). [DOI] [PubMed] [Google Scholar]
- 4.Wells, G. L. Applied eyewitness-testimony research: system variables and estimator variables. J. Personal. Soc. Psychol.36, 1546–1557 (1978). [Google Scholar]
- 5.Wixted, J. T. & Wells, G. L. The relationship between eyewitness confidence and identification accuracy: A new synthesis. Psychol. Sci. Public. Interest.18, 10–65 (2017). [DOI] [PubMed] [Google Scholar]
- 6.Dunning, D. & Perretta, S. Automaticity and eyewitness accuracy: A 10- to 12-second rule for distinguishing accurate from inaccurate positive identifications. J. Appl. Psychol.87, 951–962 (2002). [DOI] [PubMed] [Google Scholar]
- 7.Dunning, D. & Stern, L. B. Distinguishing accurate from inaccurate eyewitness identifications via inquiries about decision processes. J. Personal. Soc. Psychol.67, 818–835 (1994). [Google Scholar]
- 8.Steblay, N. K. & Wells, G. L. In their own words: verbalizations of real eyewitnesses during identification lineups. Psychol. Public. Policy Law. 29, 272–287 (2023). [Google Scholar]
- 9.Grabman, J. H., Dobolyi, D. G., Berelovich, N. L. & Dodson, C. S. Predicting high confidence errors in eyewitness memory: the role of face recognition ability, decision-time, and justifications. J. Appl. Res. Memory Cognition. 8, 233–243 (2019). [Google Scholar]
- 10.Sauerland, M. & Sporer, S. L. Fast and confident: postdicting eyewitness identification accuracy in a field study. J. Experimental Psychology: Appl.15, 46–62 (2009). [DOI] [PubMed] [Google Scholar]
- 11.Smith, S. M., Lindsay, R. C. L. & Pryke, S. Postdictors of eyewitness errors: can false identifications be diagnosed? J. Appl. Psychol.85, 542–550 (2000). [DOI] [PubMed] [Google Scholar]
- 12.Ayala, N. T., Smith, A. M. & Wells, G. L. Beyond the confidence-accuracy relation: A multiple-reflector-variable approach to postdicting accuracy on eyewitness lineups. J. Experimental Psychology: Appl.10.1037/xap0000527 (2025). [DOI] [PubMed] [Google Scholar]
- 13.Greenspan, R. L. & Loftus, E. F. Interpreting eyewitness confidence: numeric, verbal, and graded verbal scales. Appl. Cogn. Psychol.38, e4151 (2024). [Google Scholar]
- 14.Quigley-McBride, A. & Wells, G. L. Eyewitness confidence and decision time reflect identification accuracy in actual Police lineups. Law Hum. Behav.47, 333–347 (2023). [DOI] [PubMed] [Google Scholar]
- 15.Ratcliff, R. A theory of memory retrieval. Psychol. Rev.85, 59–108 (1978). [Google Scholar]
- 16.Brewer, N. & Wells, G. L. The confidence-accuracy relationship in eyewitness identification: effects of lineup instructions, foil similarity, and target-absent base rates. J. Exp. Psychol.12, 11–30 (2006). [DOI] [PubMed] [Google Scholar]
- 17.Brewer, N. & Weber, N. Eyewitness confidence and latency: indices of memory processes not just markers of accuracy. Appl. Cogn. Psychol.22, 827–840 (2008). [Google Scholar]
- 18.Seale-Carlisle, T. M. et al. Confidence and response time as indicators of eyewitness identification accuracy in the lab and in the real world. J. Appl. Res. Memory Cognition. 8, 420–428 (2019). [Google Scholar]
- 19.Arndorfer, A. & Charman, S. D. Assessing the effect of eyewitness identification confidence assessment method on the confidence-accuracy relationship. Psychol. Public. Policy Law. 28, 414–432 (2022). [Google Scholar]
- 20.Seale-Carlisle, T. M., Grabman, J. H. & Dodson, C. S. The Language of accurate and inaccurate eyewitnesses. J. Exp. Psychol. Gen.151, 1283–1305 (2022). [DOI] [PubMed] [Google Scholar]
- 21.Greenspan, R. L., Lyman, A. & Heaton, P. Assessing verbal eyewitness confidence statements using natural Language processing. Psychol. Sci.35, 277–287 (2024). [DOI] [PubMed] [Google Scholar]
- 22.Ratcliff, R. & Starns, J. J. Modeling confidence and response time in recognition memory. Psychol. Rev.116, 59–83 (2009). [DOI] [PMC free article] [PubMed] [Google Scholar]
- 23.Ratcliff, R. & Starns, J. J. Modeling confidence judgments, response times, and multiple choices in decision making: recognition memory and motion discrimination. Psychol. Rev.120, 697–719 (2013). [DOI] [PMC free article] [PubMed] [Google Scholar]
- 24.Pleskac, T. J. & Busemeyer, J. R. Two-stage dynamic signal detection: A theory of choice, decision time, and confidence. Psychol. Rev.117, 864–901 (2010). [DOI] [PubMed] [Google Scholar]
- 25.Dobolyi, D. G. & Dodson, C. S. Actual vs. perceived eyewitness accuracy and confidence and the featural justification effect. J. Experimental Psychology: Appl.24, 543–563 (2018). [DOI] [PubMed] [Google Scholar]
- 26.Wells, G. L., Steblay, N. K. & Dysart, J. E. Double-blind photo lineups using actual eyewitnesses: an experimental test of a sequential versus simultaneous lineup procedure. Law Hum. Behav.39, 1–14 (2015). [DOI] [PubMed] [Google Scholar]
- 27.Horry, R. & Wright, D. B. Dealing With Data From Real Witnesses. in Methods, Measures, and Theories in Eyewitness Identification Tasks (eds Smith, A. M., Toglia, M. P. & Lampinen, J. M.) 211–233Routledge, (2021). 10.4324/9781003138105-13
- 28.Greenspan, R. L., Quigley-McBride, A., Bluestine, M. & Garrett, B. L. Psychological science from research to policy: eyewitness identifications in Pennsylvania Police agencies. Psychol. Public. Policy Law. 30, 462–478 (2024). [Google Scholar]
- 29.Wixted, J. T., Mickes, L., Dunn, J. C., Clark, S. E. & Wells, W. Estimating the reliability of eyewitness identifications from Police lineups. Proc. Natl. Acad. Sci.113, 304–309 (2016). [DOI] [PMC free article] [PubMed] [Google Scholar]
- 30.Schwartz, B. L. Inferential theories of retrospective confidence. Metacognition Learn.19, 907–938 (2024). [Google Scholar]
- 31.Fiacconi, C. M. On the confidence-accuracy relationship in memory: inferential, direct access, or indirect access? Metacognition Learn.19, 1029–1034 (2024). [Google Scholar]
- 32.Zakay, D. & Tuvia, R. Choice latency times as determinants of post-decisional confidence. Acta. Psychol.98, 103–115 (1998). [Google Scholar]
- 33.Robinson, M. D., Johnson, J. T. & Herndon, F. Reaction time and assessments of cognitive effort as predictors of eyewitness memory accuracy and confidence. J. Appl. Psychol.82, 416–425 (1997). [DOI] [PubMed] [Google Scholar]
Associated Data
This section collects any data citations, data availability statements, or supplementary materials included in this article.
Data Availability Statement
This study was pre-registered: https://aspredicted.org/55L_M47. The data from the online dataset is used here with permission from the corresponding author for Dobolyi & Dodson (2018; corresponding author is Dodson). The data from the real dataset is not publicly available due to privacy restrictions, but the first author (Quigley-McBride) can be contacted if there are any questions about these data. The analytic code is publicly available on the project’s Open Science Foundation page: https://osf.io/quwr5.