

Abstract
Restricting dietary protein intake has metabolic and physiological benefits for animals. Rodent studies have identified the involvement of a hormone, fibroblast growth factor 21 (FGF21), which is upregulated by sensing amino acid scarcity. However, to what extent this mechanism is conserved in primates remains elusive. Using common marmosets, Callithrix jacchus, as a non-human primate model, we develop a protocol for protein restriction and dietary amino acid manipulation. Low protein diet induces a decrease in blood urea nitrogen, altered plasma amino acid profiles, and an increase in plasma FGF21. Supplementation of purified amino acids to the diet suppresses plasma features of protein restriction. Our study provides a dietary intervention technique in marmosets and an insight into the evolutionarily conserved mechanism of FGF21 induction during protein restriction.
Supplementary Information
The online version contains supplementary material available at 10.1038/s41598-025-16749-0.
Keywords: Protein restriction, Marmoset, Amino acids, FGF21
Subject terms: Metabolism, Homeostasis, Endocrinology
Introduction
Dietary restriction is one of the most practical interventions for improving health. In addition to its benefits for patients with metabolic diseases1 there is mounting evidence that dietary restriction can enhance metabolic homeostasis and improve markers of longevity in healthy humans, such as DNA methylation profiles2, anti-inflammatory responses in adipose tissue3, or cardio-metabolic parameters4. The composition of macronutrients plays a major role in the metabolic benefits of dietary restriction. For example, a correlation between mild restriction of dietary protein and metabolic benefits is reported5,6. Although limited in number, clinical trials have demonstrated the potential physiological benefits of protein restriction on glucose homeostasis and lipid metabolism in healthy subjects7–9. However, these studies require careful monitoring of the subjects, since severe protein restriction can result in malnutrition and impair essential physiological functions, such as maintenance of muscle mass and immune functions10. The boundary between beneficial and pathological is hard to define, especially since it varies with factors such as life stage, sex, and genetic background. Thus, despite the promising effects of moderate protein restriction, the application to humans remains challenging.
Molecular mechanisms of protein restriction have been extensively studied in rodents. In mice, dietary protein restriction has been reported to not only improve metabolic homeostasis, but also extend lifespan, independent of caloric intake10–12. With the use of genetics, fibroblast growth factor 21 (FGF21) has been highlighted as playing a major role in the improvement of glucose homeostasis and promotion of longevity associated with protein restriction9,13–15. FGF21 is a hormone synthesized and secreted from the liver, regulating the whole-body metabolism via its receptor expressed in various organs including liver, adipose tissue, and brain16. While FGF21 originally drew interests for its metabolic benefits17, its broader biological significance lies in its role as a key regulator that promotes adaptive metabolic stress response under imbalanced diet, characterized by increased food intake and energy expenditure, alongside suppressed growth and adiposity18. FGF21 is induced predominantly via activation of transcription factor 4 (ATF4) which is regulated by amino acid availability. Interestingly, numerous studies have demonstrated that the deficiency of select few, in some cases single, amino acids can induce FGF21 in rodents18–22. While many amino acids are decreased in the liver and plasma during protein restriction, it has been reported that addition of just threonine and tryptophan to the low protein diet repressed the FGF21 induction19. The deficiency in dietary threonine or tryptophan was also reported to be sufficient for the induction of FGF21. These studies suggest that not all amino acids contribute equally to the induction of FGF21 in protein restriction, with threonine and tryptophan playing particularly critical roles. In humans, FGF21 induction in response to protein restriction has also been observed7–9but the molecular mechanisms and the amino acid profiles underlying this induction remain elusive.
To promote translational studies, primate models has been employed in dietary intervention studies23–25. Oral administration of FGF21 analogue is effective for weight loss and improvement of glucose homeostasis in various primate metabolic disease models26–28. However, whether and how protein restriction induces endogenous FGF21 in non-human primate models has not been studied. Identifying the precise role of individual amino acids in FGF21 induction in primates requires the use of a well-defined diet with an easily adjustable amino acid composition. The high cost of purified amino acids required for dietary manipulation presents a challenge, particularly in primates that are generally much larger in size than rodents. To address this, we employed a smaller primate, common marmoset Callithrix jacchus. Common marmosets are new world monkeys endemic to South America, and are increasingly being used as a primate model for various biochemical research due to their small size (approximately 250–500 g for adults29) and the relative ease of breeding30. They are omnivores, with natural diet consisting of insects, fruits, and tree exudates such as sap and gum29. In captivity, marmosets are fed varying commercially available diets enriched with different snacks. While challenges remain in optimizing captive diets to minimize individual variations in digestion31, marmosets can be an optimal model to translate the findings from rodent studies to humans in the field of nutritional research. In this study, we established dietary manipulation of protein and amino acids in marmosets, and investigated the plasma profiles of BUN, amino acids, and FGF21.
Results
Determination of standard diet for dietary manipulation
To manipulate dietary composition, we decided to define the standard diet for common marmosets. First, we surveyed the current state of marmoset diet in captivity to determine the macronutrient composition. Commercially available diets for primates include Oriental SPS and CMS-1M from two leading manufacturers for animal diets in Japan. We also investigated the marmoset diets used in a Japanese zoo to estimate weekly averaged intake of nutrient. In all the cases, the macronutrient in the diet was made up of 20–30% protein (Supplementary Fig. 1a). Based on this diet, we determined a control diet named P30, consisting of 30% protein in calories (Table 1).
Table 1.
Dietary composition of the experimental diet.
| P30 diet (D24021601M) | P5 diet (D24021602M) | |||
|---|---|---|---|---|
| gm | kcal | gm | kcal | |
| Protein (%) | 30.5 | 30 | 5.1 | 5 |
| Carbohydrate (%) | 48.8 | 48 | 74.3 | 73 |
| Fat (%) | 10 | 22 | 10 | 22 |
| Total | 100 | 100 | ||
| kcal/gm | 4.08 | 4.08 | ||
| Ingredient | gm | kcal | gm | kcal |
| Casein | 300 | 1200 | 50 | 200 |
| L-Cystine | 4 | 16 | 0.7 | 3 |
| Corn Starch | 320 | 1280 | 573.3 | 2293 |
| Maltodextrin 10 | 100 | 400 | 100 | 400 |
| Sucrose | 65 | 260 | 65 | 260 |
| Cellulose, BW200 | 50 | 0 | 50 | 0 |
| Soybean | 100 | 900 | 100 | 900 |
| Mineral Mix, S40001 | 50 | 0 | 50 | 0 |
| Vitamin Mix, V40001C | 1 | 4 | 1 | 4 |
| Choline Bitartrate | 2 | 0 | 2 | 0 |
| L-Ascorbic Acid, Phosphate (33% Ascorbic acid) | 3 | 0 | 3 | 0 |
| Vitamin D3, 100,000 IU/gm | 3.283 | 0 | 3.283 | 0 |
| Total | 995.279 | 4060 | 995.279 | 4060 |
Many biomarkers have been proposed to reflect the adequate protein intake in humans32. Nitrogen, especially blood urea nitrogen (BUN) is used to monitor internal amino acid availability33,34. Plasma BUN levels from marmosets fed the P30 diet for two weeks showed no significant alteration than the conventional CMS-1M-based diet, indicating that the P30 diet contains sufficient protein content (Supplementary Fig. 1b).
Protein restricted diet decreases BUN and induces FGF21 in plasma
For protein restriction, we designed an isocaloric low protein diet, P5, which contains 5% protein (Supplementary Fig. 1A, Table 1) and characterized the metabolic responses of male marmosets to this diet (Fig. 1A). Marmosets on the low protein diet did not show significant changes in body weight (Fig. 1B), or plasma albumin levels (Fig. 1C). Plasma creatinine levels appeared unchanged as well, suggesting no pathological signs in kidney function (Fig. 1D). In contrast, BUN levels strongly decreased during protein restriction (Fig. 1E). Since the transition from the baseline laboratory diet (CMS-1M) to the P30 diet did not result in a significant change in BUN levels (Supplementary Fig. 1b), the observed decrease in BUN under the P5 diet is not owing to the increase of BUN by P30 diet. Induction of FGF21 occurred at as early as one week on the low protein diet (Fig. 1F). These data suggest that one week on a 5% protein diet was sufficient to decrease BUN and induce FGF21, demonstrating typical responses to protein restriction found in rodents.
Fig. 1.
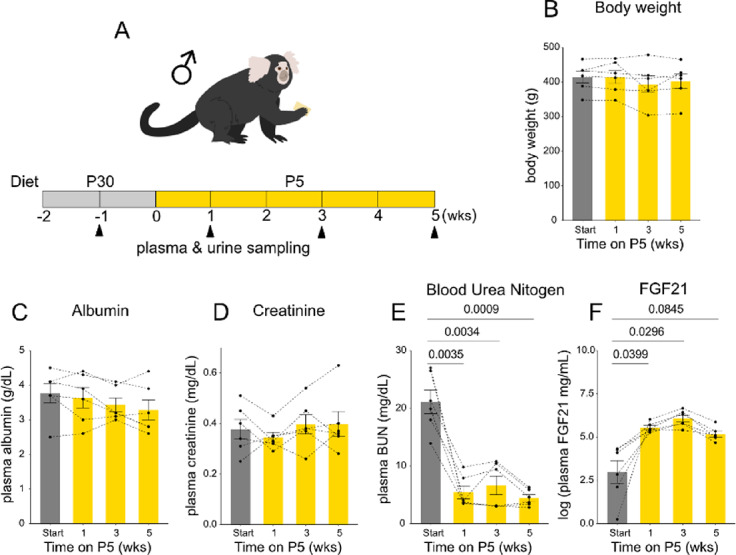
Plasma markers of low protein is observed by P5 diet. (A) Experimental timeline. Six male marmosets were fed P30 diet for two weeks and P5 diet for 5 weeks. Blood and urine samples were obtained every two weeks. (B-E) Bodyweight (B), plasma albumin (C), plasma creatinine (D), and plasma blood urea nitrogen (BUN) (E), and plasma FGF21 (F) levels. For (B-F), statistical analysis was performed by repeated measures one-way analysis of variance (ANOVA). The p values determined by post hoc analysis with Dunnet’s multiple comparison test are shown in the figure. All data are presented as mean ± s.e.m.
Plasma metabolic profile of marmosets is altered on low protein diet
To understand how the low protein diet affected levels of internal amino acids and the related metabolites, we quantified amino acids and taurine in the plasma using LC-MS/MS. Cysteine was excluded from the analysis due to technical issues in reliable measurement. Taurine was quantified since it is an amino acid metabolite which is known to be highly influenced by dietary amino acids35–37. Principle component analysis (PCA) of the quantified 20 metabolites showed that protein restriction separates the plasma metabolite profile (Fig. 2A). We found that essential amino acid levels especially responded to the P5 diet (Fig. 2B-D, Supplementary Fig. 2). Among essential amino acids, threonine (Fig. 2C) and tryptophan (Fig. 2D) showed significant drops in plasma concentration after 1 week of protein restriction. Plasma concentration of several non-essential amino acids were rather increased on the P5 diet (Fig. 2E-F, Supplementary Fig. 2). Although p = 0.0502 in repeated measures one way ANOVA, we observed a trend of increase in alanine concentration, suggesting potential differences. Dunnet’s post hoc analysis demonstrated that alanine indeed tended to increase under protein restriction (Fig. 2F). Surprisingly, methionine, despite being an essential amino acid, increased after two weeks of protein restriction (Fig. 2G). Upon closer inspection, we instead found that taurine, which is synthesized from methionine, was significantly decreased under protein restriction (Fig. 2H-I). Consistent with plasma, we found that urinary taurine was also decreased by the low protein diet (Fig. 2J). Taken together, our data showed that while one week of P5 diet is sufficient to induce the adaptative mechanism towards protein restriction, only selected amino acids decrease in the plasma.
Fig. 2.

Plasma metabolite profiles are altered under P5 diet. (A) Principal component analysis of plasma metabolites in male marmosets quantified using LC-MS/MS. (B) Heatmap of z score normalized concentration of plasma essential amino acids. (C-D) Quantification of plasma threonine (C) and tryptophan (D). (E) Heatmap of z score normalized concentration of plasma non-essential amino acids. (F-G) Quantification of plasma alanine (F) and methionine (G). (H) Schematics of taurine biosynthesis pathway. (I-J) Quantification of taurine in plasma (I) and urine (J). For (C-D, F-G, I-J), statistical analysis was performed by repeated measures one-way analysis of variance (ANOVA). The p values determined by post hoc analysis with Dunnet’s multiple comparison test are shown in the figure. All data are presented as mean ± s.e.m.
Decreased BUN and FGF21 during protein restriction is ameliorated upon free amino acid supplementation
To test whether these responses to the low protein diet is owing to a decrease in amino acid levels and, if so, to determine its threshold, we fed the animals with diets containing different levels of free amino acids. The composition of amino acids was matched to casein (Fig. 3A, See Methods, Tables 2, 3 and 4). P30, P5, and P5 diet supplemented with free amino acids, were administered sequentially for one week each (Fig. 3B). Since the diets were provided ad libtum, we deemed their isocaloric status less relevant, and thus we additionally supplemented free amino acids to a set amount of P5 food (Fig. 3A). The tested diets included P30 diet, P5 diet, and P5 diet supplemented with free amino acid cocktail corresponding to 5%, 15%, or 25% of casein (Fig. 3A). More specifically, amino acids were supplemented at an amount identical to (P5 + 5%), three times (P5 + 15%), or five times (P5 + 25%) the predicted content in the P5 diet. P5 + 25% diet is supposed to contain the same amount of amino acids as P30.
Fig. 3.

Decrease in BUN and increase in FGF21 levels upon protein restriction is repressed by amino acid supplementation. (A) Amount of amino acid derived from casein or reagent supplementation contained in each diet by weight per day per marmoset. 30 g of food was supplied daily per subject. (B) Experimental timeline. Six male marmosets were fed P30, P5, and P5 diet supplemented with free amino acids for 1 week each. Blood and urine samples were obtained weekly. The diet was fed ad libtum. (C-F) Body weight (C), plasma albumin (D), and plasma blood urea nitrogen (BUN) (E), and plasma FGF21 levels (F). For (C-F), statistical analysis was performed by repeated measures one-way analysis of variance (ANOVA). The p values determined by post hoc analysis with Šídák’s multiple comparison test are shown in the figure. All data are presented as mean ± s.e.m.
Table 2.
Amino acid composition of casein.
| Amino Acid Profile | (g/100 g of casein protein) |
|---|---|
| Isoleucine | 5.3 |
| Leucine | 9.4 |
| Lysine | 8.2 |
| Methionine | 3.1 |
| Phenylalanine | 5.2 |
| Threonine | 4.3 |
| Tryptophan | 1.3 |
| Valine | 6.6 |
| Histidine | 2.8 |
| Alanine | 3 |
| Arginine | 3.9 |
| Aspartic acid | 7.3 |
| Cysteine/Cystine | 0.6 |
| Glutamic acid | 22.6 |
| Glycine | 1.9 |
| Proline | 10.9 |
| Serine | 5.9 |
| Tyrosine | 5.9 |
Table 3.
Free amino acids supplemented to 30 g of P5 diet.
| P5 + 5%AA | P5 + 15%AA | P5 + 25%AA | |
|---|---|---|---|
| Essential Amino Acids | (g) | (g) | (g) |
| Isoleucine | 0.080 | 0.240 | 0.399 |
| Leucine | 0.142 | 0.425 | 0.708 |
| Lysine | 0.124 | 0.371 | 0.618 |
| Methionine | 0.047 | 0.140 | 0.234 |
| Phenylalanine | 0.078 | 0.235 | 0.392 |
| Threonine | 0.065 | 0.194 | 0.324 |
| Tryptophan | 0.020 | 0.059 | 0.098 |
| Valine | 0.099 | 0.298 | 0.497 |
| Histidine | 0.042 | 0.127 | 0.211 |
| Non-essential amino acids | |||
| Alanine | 0.045 | 0.136 | 0.226 |
| Arginine | 0.059 | 0.176 | 0.294 |
| Asparagine | 0.055 | 0.165 | 0.275 |
| Aspartic acid | 0.055 | 0.165 | 0.275 |
| Cystine | 0.009 | 0.027 | 0.045 |
| Glutamine | 0.170 | 0.511 | 0.852 |
| Glutamic acid | 0.170 | 0.511 | 0.852 |
| Glycine | 0.029 | 0.086 | 0.143 |
| Proline | 0.164 | 0.493 | 0.821 |
| Serine | 0.089 | 0.267 | 0.445 |
| Tyrosine | 0.089 | 0.267 | 0.445 |
Table 4.
Amino acid reagents used in this study.
| Compound | Company | Reagent grade | Product code |
|---|---|---|---|
| L(+)-Isoleucine | FUJIFILM | Wako special reagent | 125–00865 |
| L-Leucine | FUJIFILM | Guranteed reagent | 128–00855 |
| L(+)-Lysine Monohydrochloride | FUJIFILM | Wako special reagent | 125–01465 |
| L-Methionine | FUJIFILM | Wako special reagent | 137–01605 |
| L(-)-Phenylalanine | FUJIFILM | Wako special reagent | 165–01305 |
| L(-)-Threonine | FUJIFILM | Wako special reagent | 208–01325 |
| L-Tryptophan | FUJIFILM | Wako special reagent | 204–03382 |
| L-Valine | FUJIFILM | special reagent | 222 − 00085 |
| L-Histidine | FUJIFILM | Wako special reagent | 082–00683 |
| L-Alanine | FUJIFILM | Guranteed reagent | 016-01044 |
| L(+)-Arginine | FUJIFILM | Wako special reagent | 015-04613 |
| L-Asparagine | FUJIFILM | Guranteed reagent | 011-04811 |
| L-Aspartic acid | FUJIFILM | Guranteed reagent | 015-04831 |
| L(-)-Cystine | FUJIFILM | Guranteed reagent | 035-05293 |
| L(+)-Glutamine | FUJIFILM | Guranteed reagent | 078–00525 |
| L-Glutamic acid | FUJIFILM | Guranteed reagent | 074–00505 |
| Glycine | FUJIFILM | Guranteed reagent | 075–00731 |
| L(-)Proline | FUJIFILM | Guranteed reagent | 165–04605 |
| L-Serine | FUJIFILM | Guranteed reagent | 195–00404 |
| L-Tyrosine | FUJIFILM | Wako special reagent | 206–03565 |
Throughout the serial dietary manipulation, health parameters such as body weight, or plasma albumin levels did not vary significantly (Fig. 3C, D). However, the decreased BUN levels under P5 diet gradually increased with amino acid supplementation (Fig. 3E). Importantly, the same pattern was also observed in the plasma concentration of FGF21 (Fig. 3F). The induction upon protein restriction by P5 was not changed with P5 + 5% diet but was repressed at P5 + 15%. Considering that P5 + 15% almost seemed to completely abrogate the decrease of BUN and induction of FGF21, and that further increase of supplemented free amino acids could not influence them, P5 + 15% seemed to be sufficient for the observed responses (Fig. 3E-F). However, it was possible that the rescue by the 15%AA supplementation was due to the cumulative effect of consecutive feeding with P5 + 5%AA followed by P5 + 15%AA.
To validate the result of dietary manipulations, we used additional marmosets (Supplementary Fig. 4A). This time, four relatively young male marmosets (aged 2.25 ± 0.5) was sequentially provided with P30 diet, P5 diet, then P5 + 15% AA diet for one, three, and one week, respectively (See supplementary information). No marked changes in body weight, plasma albumin, or plasma creatinine levels were observed during the experiment (Supplementary Fig. 4B-D), consistent with findings from previous experiments (Figs. 1 and 3) The data suggested that BUN was decreased and FGF21 was induced under the low-protein P5 diet, although it did not reach statistical significance possibly due to the small sample size (Supplementary Fig. 4E-F). However, upon switching to the P5 + 15%AA diet after three weeks on the P5 diet, BUN levels significantly increased and FGF21 levels significantly decreased, mirroring results from the previous experiment. These findings support the conclusion that the P5 + 15%AA diet is sufficient to reverse the plasma markers associated with three weeks of low-protein feeding.
Plasma metabolite levels upon free amino acid supplementation
Plasma samples were analyzed using LC-MS/MS to assess metabolite profiles under amino acid supplementation. PCA showed that amino acid supplementation progressively restored the plasma metabolomic profile in accordance with increasing amino acid content of protein restriction, mainly along PC3 (Fig. 4A).
Fig. 4.
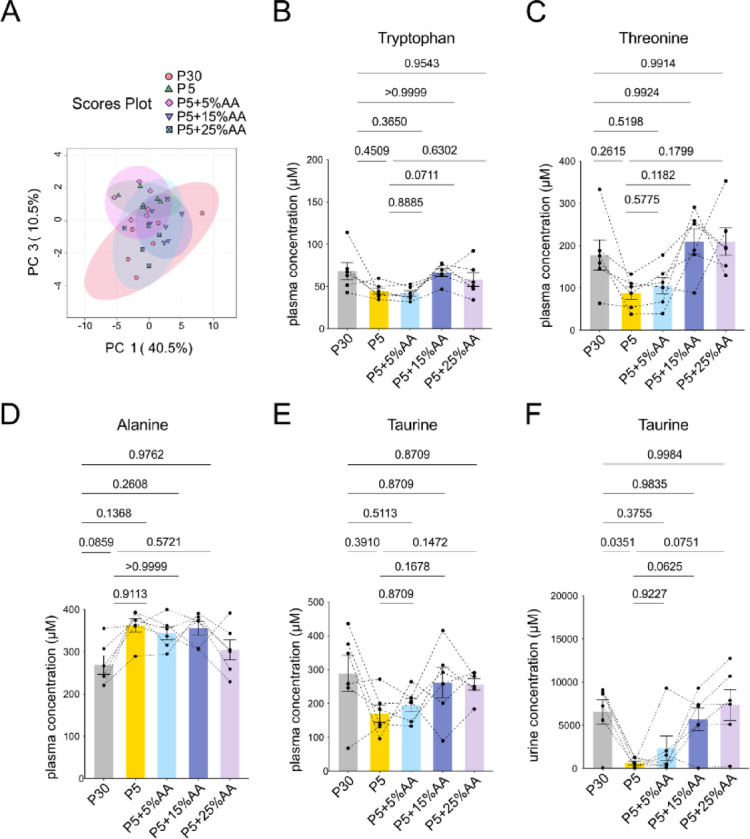
Amino acid supplementation can ameliorate the metabolite profile of low protein diet. (A) Principal component analysis of plasma metabolites in male marmosets quantified using LC-MS/MS. (B-D) Quantification of plasma tryptophan (B), threonine (C), alanine (D). (E-F) Quantification of taurine concentration in plasma (E) and urine (F). For (B-F), statistical analysis was performed by repeated measures one-way analysis of variance (ANOVA). The p values determined by post hoc analysis with Šídák’s multiple comparison test are shown in the figure. All data are presented as mean ± s.e.m.
Tryptophan, threonine and alanine were the only amino acids with variable change (Fig. 4B-D, Supplementary Fig. 3). As observed in Fig. 2, threonine and tryptophan tended to decrease, and alanine tended to increase on the P5 diet, although the change was not statistically significant (Fig. 4B-D). For tryptophan and threonine, plasma concentrations during P5 + 15%AA diet tended to increase the most compared to the level observed in P5 (Fig. 4B-C). In contrast, alanine showed significant increase by the P5 diet and its levels were at least partially restored by P5 + 25%AA diet (Fig. 4D). In this experiment, methionine levels were unchanged after one week on the P5 diet (Supplementary Fig. 3). Mean plasma taurine levels showed a decreasing trend following one week on P5 diet (Fig. 4E). Consistent with previous results (Fig. 2J), urinary taurine also decreased on P5, and this reduction tended to be suppressed by amino acid supplementation (Fig. 4F).
Discussion
In this study, we established an experimental set up for dietary protein and amino acid manipulation in common marmosets. Here, we report that the nutritional responses of marmosets to a low protein diet — including decrease in BUN, an induction of FGF21, and altered plasma amino acid levels — all occur within one week, and are reversible with amino acid supplementation. Our findings also suggest that a reduction in plasma threonine and tryptophan levels may be sufficient to induce FGF21 secretion in non-human primates, paralleling observations in rodent models19. However, to establish causality, it will be necessary to directly manipulate dietary threonine and tryptophan levels and to assess amino acid concentrations in the liver, where FGF21 is produced.
The reasons that threonine and tryptophan seem to be the most sensitive to low protein diet is unknown, but the two amino acids have distinct characteristics that may contribute to the sensitivity to low protein diet. For example, threonine is known to be especially utilized in the gut and thus is reported to have high irreversible ileal loss in humans38,39. One major factor is secretion of glycoprotein, such as mucin, to the lumen of the gut. Mucin is extensively O-glycosylated, requiring an extremely high proportion of amino acids with hydroxylated side chains, mainly threonine and serine40. Since mucin is secreted into the intestinal lumen and cannot be reutilized due to its low digestibility and low absorptive abilities in the colon, a significant portion of threonine is predicted to be lost. Total loss of threonine at the terminal ileum of healthy humans has been calculated to account for 103–127% of total daily maintenance requirement39. This is significantly higher compared to the ileal losses of other amino acids estimated to be 26% (Histidine)-75%(Valine). Previous studies in mice have also discussed that threonine may be the limiting amino acid in casein, which is a basal protein source for defined diets19,41.
On the other hand, tryptophan is structurally distinct, being the only amino acid with an indole ring. It has diverse metabolites from the kynurenine pathway to serotonin production. It is also highly metabolized by the gut bacteria, received mainly by the aryl hydrocarbon receptor in the host42. In addition, tryptophan, along with cystine is predicted to be the least abundant amino acid in human foods43. Amino acid with the lowest content in casein used in this study was tryptophan, at 1.3% (w/w) (Table 2). These characteristics may have led to the high likelihood of threonine and tryptophan acting as a rate limiting amino acid under low protein diet. However, whether this is the case still needs to be investigated by manipulation of the two amino acids and tracking of the dynamics and distribution of amino acids from both endogenous and dietary sources.
Taurine levels changed drastically, especially in urine, in response to a low protein diet. Taurine is regulated by both biosynthesis from methionine or cysteine and renal reabsorption35. Additionally, taurine is known to be abundantly contained in the skeletal muscle which functions as an amino acid reservoir44. Restriction of dietary protein, or even just methionine has been reported to decrease plasma and hepatic taurine levels and alter its metabolism in rodents35–37. Interestingly, our results demonstrated that plasma methionine levels did not decrease under protein restriction, perhaps at the expense of taurine. Similarly, upon protein restriction, the levels of non-essential amino acids are well maintained, or can even increase, instead. In a previous study, plasma of male rats on protein restricted diet for four days showed an increase in serine, glycine, glutamine, glutamate, and alanine levels in the plasma45. In another study, maintaining female rats on low protein diet for 7–10 days induced an increase in hepatic serine and glycine46. The exact mechanism behind the upregulation is not fully understood. One possibility is the shift in metabolism, such as the induction of amino acid biosynthesis. A prior study using mouse demonstrated that transcriptional upregulation of asparagine synthetase (ASNS) and phosphoglycerate dehydrogenase (PHGDH), which are involved in asparagine and serine synthesis respectively, occurs under protein restriction via ATF414,47. Decreased global translation and selective upregulation of the translation of proteins involved in adaptive responses under protein limitation has also been elucidated48. Taken together, a robust adaptive system is likely preventing a decrease in circulating amino acid levels by regulating absorption, excretion, and metabolism under dietary amino acid deficiency.
In our study, we set the control diet to 30% protein. In primate studies, the standard diet varies greatly among institutions49. The lack of consensus in defining a standard diet have made it difficult to interpret the results of dietary manipulation among studies. For example, three well-known primate studies from different institutes which looked at the effect of calorie restriction reported varying degrees of positive effects on health and age-related morbidity, and inconsistent outcomes for all cause mortality23–25,50. The discrepancy in the efficacy of caloric restriction has been attributed to the diversity not only in animals’ age or genetic and metabolic background, but experimental design, such as dietary composition or feeding practices50,51. For the promotion of nutritional study, it is necessary to define the macronutrient composition of a standardized diet carefully.
In addition to macronutrient composition, the effects of individual nutrients should be considered when interpreting experimental results. Our study implied that individual amino acids may affect nutrient sensing pathways in marmosets, similarly to rodents. Experimental animals in captivity are fed different sources of protein, mainly casein, whey, and soy which all have varied amino acid compositions that can influence experimental interpretation. For example, a previous study. has reported that 15 or 25% protein diet did not alter growth and food intake behavior of infants52 nor milk macronutrient compositions collected from marmoset mothers53. Consistently, we observed that 5% protein diet supplemented with free amino acids equivalent to 15%, but not 5% protein was sufficient to diminish the responses of protein restriction under the conditions tested. These results imply the possibility that approximately 15% protein is sufficient to not induce phenotypes of low protein. However, such conclusion must be made cautiously, since the protein source for the previously reported experiments was lactalbumin which notably contains higher amount of essential amino acids including isoleucine, leucine, and tryptophan compared to casein54. Definitive conclusions require further investigation with matched amino acid compositions and endocrine profiling. These comparisons shed light on the importance of manipulating specific dietary components at the amino acid levels, by using approaches like the one we proposed in this study.
In conclusion, our dietary intervention protocol opens up new opportunities to study, in detail, the physiological responses to dietary protein and amino acids—such as FGF21-mediated endocrine signaling—in primate tissues and organs. This approach also offers the potential to integrate multi-omics and genetic tools. Furthermore, it enables targeted manipulation of individual amino acids to assess their effects on non human primates, including impacts on healthspan, building upon extensive findings from studies utilizing non primate animal models55. For example, it is known that methionine-specific restriction can extend lifespan in flies and in rodents56. Our dietary manipulation can be helpful to understand whether this is applicable to primates, and if so, to reveal the mechanistic detail.
Limitations
It was challenging to enforce or monitor dietary compliance due to multiple factors, such as high moisture content of marmoset food and the behavioural tendency to toss left over food outside the cage. In this study, the animals were fed ad libtum, meaning that the intake was completely dependent on the animals themselves. Nevertheless, given that there were no clear difference in appetite between the diets, and the absence of signs of starvation such as weight loss, we concluded that the marmosets consumed the diets provided and it met the calorie requirement. Thus, the effects observed were most likely of quality of the food rather than the difference in quantity. However, dietary compliance is a crucial factor in nutrition studies, so a system to quantify food intake will be essential in future studies.
It has been shown that responses to low protein diets are highly variable. In rodents, males typically exhibit stronger responses to protein restriction than females57,58. Additionally, certain life stages, such as growth, pregnancy, and ageing, are especially known to benefit from adequate dietary protein10. This study primarily focused on matured male marmosets due to animal availability. While we observed that the younger males show similar responses, the effects of sex and life stage on dietary protein response warrant further investigation in future studies.
Material and methods
Animals
All experiments were performed in strict accordance with the institutional guidelines for animal experiments, basic policies for the conduct of animals experiments in research institution (MEXT, Japan), and guidelines for the care and use of laboratory animals (National Institute of Health, Bethesda, MD). All animal experiments were approved by the Animal Care and Use committee of the RIKEN Center for Biosystems Dynamics Research (Kobe, Japan) (approved number: A2023-27-2). This study is reported in accordance with the ARRIVE guidelines59. There were no humane endpoints during this experiment.
Subjects were male marmosets (Callithrix jacchus) housed in RIKEN BDR. The monkeys were born at the center and maintained in an individual or family style cage before the experiment. The subjects were the same six mature male marmosets (aged 6.7 ± 0.94 years), except for the experiment shown in Supplementary Fig. 4 where younger males were used (aged 2.3 ± 0.5 years). During the experiments, the monkeys were individually housed in a cage (450 × 660 × 600 mm) with a wooden perch for enrichment. The cages were placed facing each other, so subjects were exposed to visual, auditory and olfactory cues from each other. The room was maintained at 28 degrees and 50% humidity, with 12 h light-dark cycle (Light: 8:45 − 20:45).
Experimental diet and feeding
Two types of experimental diets, P30 (D24021601M) and P5 (D24021602M), were purchased from Research Diets (NJ, USA) in powder form. The composition of each diet can be found in Table 1. Briefly, P30 diet contained 30% protein in calories, and P5 diet contained 5% protein. 5% protein was set as low protein diet, since Flurer and Zucker reported that 5%, but not 7% protein diet is sufficient to induce behaviours reminiscent of dietary stress in marmosets, although the plasma markers were not tested60. Additionally, rodent and human studies have reported that similar levels (3–9%) of protein restriction as moderate, and not severe protein restriction7,11,61.
The amount of individual amino acids predicted to be in the diet containing 5% protein, termed P5 diet was calculated based on the composition of casein provided by Research Diets (Table 2). P5 + 5%AA, P5 + 15%AA, and P5 + 25%AA diet were prepared by mixing a set amount of P5 diet with 100%, 300%, or 500% of amino acids predicted to be in the set amount of P5 diet (Tables 1, 2 and 3). Amino acid reagents used in this study can be found in Table 4. The powder diet was mixed with 7.2 mL of honey diluted with 70 mL (80 mL for P5 diet) of water, 1 g of probiotics (BIO-THREE, TOA) and left to set in a metal tray. The diet was then cut into bite sized pieces before feeding. The diet was prepared up to 3 days in advance and kept in a fridge at roughly 4 degrees.
Diets were given twice a day and food supplements were given three times a week, approximately 5 g of banana or 3 g of boiled eggs, twice and once a week respectively throughout the experiment. Prior to the start of the experiment, the diet consisted of commercial New World primate diet (CMS-1M, CLEA Japan) supplemented with honey (Kato brothers honey), ascorbic acid (Kenei), vitamin mix (Vitalong, Kyoritsu Seiyaku) and probiotics (BIO-THREE, TOA). A week to three days before the start of the experiment, marmosets were able to choose between the experimental control food, P30 and commercial New World primate diet (CMS-1M, CLEA Japan). The animals were completely switched to the experimental diet on day1. Subject were fed ad libtum with access to approximately 30 g (dry matter) of food per day. In some cases, not all the diet was consumed. For example, some marmosets experienced periods without access to food, especially from nighttime to early morning, after dropping a portion out of their cage.
To test the effects of low protein diet, marmosets were given the P30 diet for a week, followed by P5 diet for 5 weeks (Fig. 1A). For the amino acid supplementation experiment, the animals were sequentially provided with P30, P5, P5 + 5%AA, P5 + 15%AA, P5 + 25%AA diet, each for one week (Fig. 3A), or alternatively with a P30 diet for two weeks, P5 diet for three weeks, then P5 + 15%AA diet for a week (Supplementary Fig. 4A).
Sample collection
The marmosets were fasted from 17:00 the day before. Sampling was performed the next morning. Urine samples were collected by manually expressing the bladder directly on to a clean dry tray. The blood samples were collected with heparin sodium 5,000 units/5 mL (224122458, Mochida Pharmaceutical Co. Ltd) using 26G or 0.45 × 13 mm needle (NN-2613 S, TERUMO) from the femoral veins. Restraints were used to hold the marmosets still during sampling. To adjust for the frequency of collection, approximately 500 µL of blood was collected for the first experiment (two weeks interval) and 250 µL for the second (a week interval). Plasma samples was obtained by quickly centrifuging the blood samples at 1,500 g for 10 min. Plasma and urine samples were stored in -80 degrees. Body weight was also measured right after sampling.
Plasma and urine analysis
Plasma FGF21 levels were quantified using quantitative sandwich enzyme immunoassay (DF2100, FGF21 Human ELISA kit Quantikine, RSD) according to the manufacturers recommended protocol. Briefly, plasma samples were pipetted into the microplate pre-coated with human FGF21 antibody. Horse radish peroxidase was used as the detection enzyme.
Plasma albumin (ALB), creatinine, and blood urea nitrogen (BUN) levels were measured using FUJI DRYCHEM NX500 according to the manufacturers recommended protocol.
For quantification of amino acids, Ultra-performance LC–MS-8060 NX (Shimadzu) based on the Primary metabolites package v.2 (Shimadzu) was used to quantify plasma and urine metabolites. Ten microliter of urine or plasma samples were mixed with 150 µl of 80% methanol containing 10 µM of internal standards (methionine sulfone and 2-morpholinoethanesulfonic acid) then deproteinized by mixing 75 µl of acetonitrile. The samples were further filtered using a 10-kDa centrifugal device (Pall, OD010C35). The samples were then completely evaporated using a centrifugal concentrator (TOMY, CC-105) and resolubilized in ultrapure water. The samples were then injected to the LC–MS/MS with a PFPP column (Discovery HS F5 (2.1 mm × 150 mm, 3 μm), Sigma-Aldrich) in the column oven at 40 °C. A gradient from solvent A (0.1% formic acid, water) to solvent B (0.1% formic acid, acetonitrile) for 20 min was used to separate the samples. Multiple reaction monitoring (MRM) parameter were optimized by injecting the standard solution, then peak integration and parameter optimization were performed by a software (LabSolutions, Shimadzu). To quantify the metabolites, a standard curve drawn from serial dilutions (0.01–10 µM) were used.
Statistics
Statistical analysis for metabolomics was performed using Metaboanalyst 6.062. For normalization, the values were log transformed, and Z scores were calculated using the auto scale option. Principal component analysis (PCA) was performed and plotted.
All other statistical analysis was performed using GraphPad Prism 10. The detailed statistical tests utilized for each figure are stated in the figure legend. Briefly, repeated measures one way ANOVA was performed to assess the effects of dietary intervention. When the ANOVA testing showed significant interactions, Dunnet or Šídák post hoc testing was applied. For all statistical tests, p < 0.05 was considered statistically significant. The p-values determined by post hoc testing is shown in the figures. Results of all the statistical analysis is stated with the raw data. Bar graph with overlaid lines indicating individual trajectories were generated by R, and all other plots were created by GraphPad Prism 10.
Supplementary Information
Below is the link to the electronic supplementary material.
Acknowledgements
We would like to acknowledge all the caretakers (especially M.I.) of the marmoset facility in RIKEN BDR for their assistance in daily care of the animals. We also thank all the members of Obata lab, especially Chisako Sakuma and Ayano Oi for critical reading of the manuscript.
Author contributions
F.O. conceived the project. A.U. and T.H. provided animal resources and technically assisted the animal experiment. T.I. and Y.F. performed the experiments and collected research samples. Y.F. primarily performed the analysis. Y.F. and F.O. wrote the initial manuscript. A.U., T.H., and F.O. supervised the study. All authors contributed to the design of the study and reviewed the manuscript.
Data availability
All data analyzed during this study are included in this published article (and its supplementary information files). The remaining raw data are available upon request to the corresponding author.
Declarations
Competing interests
The authors declare no competing interests.
Footnotes
Publisher’s note
Springer Nature remains neutral with regard to jurisdictional claims in published maps and institutional affiliations.
References
- 1.Jensen, M. D. et al. 2013 AHA/ACC/TOS guideline for the management of overweight and obesity in adults: a report of the American college of cardiology/american heart association task force on practice guidelines and the obesity society. J. Am. Coll. Cardiol.63, 2985–3023 (2014). [DOI] [PubMed] [Google Scholar]
- 2.Waziry, R. et al. Effect of long-term caloric restriction on DNA methylation measures of biological aging in healthy adults from the CALERIE trial. Nat. Aging. 3, 248–257 (2023). [DOI] [PMC free article] [PubMed] [Google Scholar]
- 3.Spadaro, O. et al. Caloric restriction in humans reveals immunometabolic regulators of health span. Science375, 671–677 (2022). [DOI] [PMC free article] [PubMed] [Google Scholar]
- 4.Kraus, W. E. et al. 2 years of calorie restriction and cardiometabolic risk (CALERIE): exploratory outcomes of a multicentre, phase 2, randomised controlled trial. Lancet Diabetes Endocrinol.7, 673–683 (2019). [DOI] [PMC free article] [PubMed] [Google Scholar]
- 5.Levine, M. E. et al. Low protein intake is associated with a major reduction in IGF-1, cancer, and overall mortality in the 65 and younger but not older population. Cell. Metab.19, 407–417 (2014). [DOI] [PMC free article] [PubMed] [Google Scholar]
- 6.Lagiou, P. et al. Low carbohydrate-high protein diet and mortality in a cohort of Swedish women. J. Intern. Med.261, 366–374 (2007). [DOI] [PubMed] [Google Scholar]
- 7.Nicolaisen, T. S. et al. Dietary protein restriction elevates FGF21 levels and energy requirements to maintain body weight in lean men. Nat. Metab.1, 15 (2025). [DOI] [PMC free article] [PubMed] [Google Scholar]
- 8.Fontana, L. et al. Decreased consumption of branched-chain amino acids improves metabolic health. Cell. Rep.16, 520–530 (2016). [DOI] [PMC free article] [PubMed] [Google Scholar]
- 9.Maida, A. et al. A liver stress-endocrine nexus promotes metabolic integrity during dietary protein Dilution. J. Clin. Invest.126, 3263–3278 (2016). [DOI] [PMC free article] [PubMed] [Google Scholar]
- 10.Kim, S. Q. et al. Protein-restricted diets and their impact on metabolic health and aging. Annu. Rev. Nutr. 45, 13.1-13.29. (2025). [DOI] [PubMed]
- 11.Solon-Biet, S. M. et al. The ratio of macronutrients, not caloric intake, dictates cardiometabolic health, aging, and longevity in ad libitum-fed mice. Cell. Metab.19, 418–430 (2014). [DOI] [PMC free article] [PubMed] [Google Scholar]
- 12.Solon-Biet, S. M. et al. Dietary protein to carbohydrate ratio and caloric restriction: comparing metabolic outcomes in mice. Cell. Rep.11, 1529–1534 (2015). [DOI] [PMC free article] [PubMed] [Google Scholar]
- 13.Zhang, Y. et al. The starvation hormone, fibroblast growth factor-21, extends lifespan in mice. Elife1, e00065 (2012). [DOI] [PMC free article] [PubMed] [Google Scholar]
- 14.Hill, C. M. et al. FGF21 is required for protein restriction to extend lifespan and improve metabolic health in male mice. Nat. Commun.13, 1897 (2022). [DOI] [PMC free article] [PubMed] [Google Scholar]
- 15.Kitada, M., Ogura, Y., Monno, I. & Koya, D. The impact of dietary protein intake on longevity and metabolic health. EBioMedicine 43, 632–640. (2019). [DOI] [PMC free article] [PubMed]
- 16.Fisher, F. M. & Maratos-Flier, E. Understanding the physiology of FGF21. Annu. Rev. Physiol.78, 223–241 (2016). [DOI] [PubMed] [Google Scholar]
- 17.Kharitonenkov, A. et al. FGF-21 as a novel metabolic regulator. J. Clin. Invest.115, 1627–1635 (2005). [DOI] [PMC free article] [PubMed] [Google Scholar]
- 18.Hill, C. M., Berthoud, H. R., Münzberg, H. & Morrison, C. D. Homeostatic sensing of dietary protein restriction: A case for FGF21. Front. Neuroendocrinol.51, 125–131 (2018). [DOI] [PMC free article] [PubMed] [Google Scholar]
- 19.Yap, Y. W. et al. Restriction of essential amino acids dictates the systemic metabolic response to dietary protein Dilution. Nat. Commun.11, 2894 (2020). [DOI] [PMC free article] [PubMed] [Google Scholar]
- 20.Cornu, M. et al. Hepatic mTORC1 controls locomotor activity, body temperature, and lipid metabolism through FGF21. Proc. Natl. Acad. Sci. U. S. A. 111, 11592–11599. (2014). [DOI] [PMC free article] [PubMed]
- 21.Shimizu, N. et al. A muscle-liver-fat signalling axis is essential for central control of adaptive adipose remodelling. Nat. Commun.6, 6693 (2015). [DOI] [PMC free article] [PubMed] [Google Scholar]
- 22.Wilson, G. J. et al. GCN2 is required to increase fibroblast growth factor 21 and maintain hepatic triglyceride homeostasis during asparaginase treatment. Am. J. Physiol. Endocrinol. Metab.308, E283–E293 (2015). [DOI] [PMC free article] [PubMed] [Google Scholar]
- 23.Bodkin, N. L., Alexander, T. M., Ortmeyer, H. K., Johnson, E. & Hansen, B. C. Mortality and morbidity in laboratory-maintained rhesus monkeys and effects of long-term dietary restriction. J. Gerontol. Biol. Sci. Med. Sci.58, 212–219 (2003). [DOI] [PubMed] [Google Scholar]
- 24.Mattison, J. A. et al. Impact of caloric restriction on health and survival in rhesus monkeys from the NIA study. Nature489, 318–321 (2012). [DOI] [PMC free article] [PubMed] [Google Scholar]
- 25.Colman, R. J. et al. Caloric restriction delays disease onset and mortality in rhesus monkeys. Science325, 201–204 (2009). [DOI] [PMC free article] [PubMed] [Google Scholar]
- 26.Murray, S. A. et al. Whole transcriptome analysis and validation of metabolic pathways in subcutaneous adipose tissues during FGF21-induced weight loss in non-human primates. Sci. Rep.10, 7287 (2020). [DOI] [PMC free article] [PubMed] [Google Scholar]
- 27.Andersen, B. et al. FGF21 decreases body weight without reducing food intake or bone mineral density in high-fat fed obese rhesus macaque monkeys. Int. J. Obes. (Lond). 42, 1151–1160 (2018). [DOI] [PMC free article] [PubMed] [Google Scholar]
- 28.Talukdar, S. et al. A long-acting FGF21 molecule, PF-05231023, decreases body weight and improves lipid profile in non-human primates and type 2 diabetic subjects. Cell. Metab.23, 427–440 (2016). [DOI] [PubMed] [Google Scholar]
- 29.Ross, C. N., Colman, R., Power, M. & Tardif, S. Marmoset metabolism, nutrition, and obesity. ILAR J.61, 179–187 (2020). [DOI] [PMC free article] [PubMed] [Google Scholar]
- 30.Marini, R. P., Wachtman, L. M., Tardif, S. D., Mansfield, K. & Fox, J. G. The Common Marmoset in Captivity and Biomedical Research (Academic), 2018).
- 31.Power, M. L. et al. Diet, digestion and energy intake in captive common marmosets (Callithrix jacchus): research and management implications. Sci. Rep.9, 12134 (2019). [DOI] [PMC free article] [PubMed] [Google Scholar]
- 32.Wolfe, R. R., Kim, I. Y., Park, S. & Ferrando, A. Tracing metabolic flux to assess optimal dietary protein and amino acid consumption. Exp. Mol. Med.54, 1323–1331 (2022). [DOI] [PMC free article] [PubMed] [Google Scholar]
- 33.Garibotto, G. et al. Effects of low-protein, and supplemented very low-protein diets, on muscle protein turnover in patients with CKD. Kidney Int. Rep.3, 701–710 (2018). [DOI] [PMC free article] [PubMed] [Google Scholar]
- 34.Frank, H. et al. Effect of short-term high-protein compared with normal-protein diets on renal hemodynamics and associated variables in healthy young men. Am. J. Clin. Nutr.90, 1509–1516 (2009). [DOI] [PubMed] [Google Scholar]
- 35.Rozen, R. & Scriver, C. R. Renal transport of taurine adapts to perturbed taurine homeostasis. Proc. Natl. Acad. Sci. U. S. A.79, 2101–2105. (1982). [DOI] [PMC free article] [PubMed]
- 36.Liao, Y. et al. Amino acid is a major carbon source for hepatic lipogenesis. Cell. Metab.36, 2437–2448e8 (2024). [DOI] [PubMed] [Google Scholar]
- 37.Stone, K. P. et al. The acute transcriptional responses to dietary methionine restriction are triggered by Inhibition of ternary complex formation and linked to Erk1/2, mTOR, and ATF4. Sci. Rep.11, 3765 (2021). [DOI] [PMC free article] [PubMed] [Google Scholar]
- 38.Fuller, M. F., Milne, A., Harris, C. I., Reid, T. M. & Keenan, R. Amino acid losses in ileostomy fluid on a protein-free diet. Am. J. Clin. Nutr.59, 70–73 (1994). [DOI] [PubMed] [Google Scholar]
- 39.Gaudichon, C. et al. Ileal losses of nitrogen and amino acids in humans and their importance to the assessment of amino acid requirements. Gastroenterology123, 50–59 (2002). [DOI] [PubMed] [Google Scholar]
- 40.Gendler, S. J. & Spicer, A. P. Epithelial mucin genes. Annu. Rev. Physiol.57, 607–634 (1995). [DOI] [PubMed] [Google Scholar]
- 41.Piper, M. D. W. et al. Matching dietary amino acid balance to the in Silico-Translated exome optimizes growth and reproduction without cost to lifespan. Cell. Metab.25, 610–621 (2017). [DOI] [PMC free article] [PubMed] [Google Scholar]
- 42.McCann, J. R. & Rawls, J. F. Essential amino acid metabolites as chemical mediators of host-microbe interaction in the gut. Annu. Rev. Microbiol.77, 479–497 (2023). [DOI] [PMC free article] [PubMed] [Google Scholar]
- 43.Dai, Z., Zheng, W. & Locasale, J. W. Amino acid variability, tradeoffs and optimality in human diet. Nat. Commun.13, 6683 (2022). [DOI] [PMC free article] [PubMed] [Google Scholar]
- 44.Poortmans, J. R., Carpentier, A., Pereira-Lancha, L. O. & Lancha, A. Jr Protein turnover, amino acid requirements and recommendations for athletes and active populations. Braz J. Med. Biol. Res.45, 875–890 (2012). [DOI] [PMC free article] [PubMed] [Google Scholar]
- 45.Laeger, T. et al. Leucine acts in the brain to suppress food intake but does not function as a physiological signal of low dietary protein. Am. J. Physiol. Regul. Integr. Comp. Physiol.307, R310–R320 (2014). [DOI] [PMC free article] [PubMed] [Google Scholar]
- 46.Kalhan, S. C. et al. Metabolic and genomic response to dietary isocaloric protein restriction in the rat. J. Biol. Chem.286, 5266–5277 (2011). [DOI] [PMC free article] [PubMed] [Google Scholar]
- 47.Balasubramanian, M. N., Butterworth, E. A. & Kilberg, M. S. Asparagine synthetase: regulation by cell stress and involvement in tumor biology. Am. J. Physiol. Endocrinol. Metab.304, E789–E799 (2013). [DOI] [PMC free article] [PubMed] [Google Scholar]
- 48.Kilberg, M. S., Shan, J. & Su, N. ATF4-dependent transcription mediates signaling of amino acid limitation. Trends Endocrinol. Metab.20, 436–443 (2009). [DOI] [PMC free article] [PubMed] [Google Scholar]
- 49.Goodroe, A. et al. Current practices in nutrition management and disease incidence of common marmosets (Callithrix jacchus). J. Med. Primatol.50, 164–175 (2021). [DOI] [PMC free article] [PubMed] [Google Scholar]
- 50.Colman, R. J. et al. Caloric restriction reduces age-related and all-cause mortality in rhesus monkeys. Nat. Commun.5, 3557 (2014). [DOI] [PMC free article] [PubMed] [Google Scholar]
- 51.Mattison, J. A. et al. Caloric restriction improves health and survival of rhesus monkeys. Nat. Commun.8, 14063 (2017). [DOI] [PMC free article] [PubMed] [Google Scholar]
- 52.Tardif, S. et al. Growth variation in common marmoset monkeys (Callithrix jacchus) fed a purified diet: relation to care-giving and weaning behaviors. Lab. Anim. Sci.48, 264–269 (1998). [PubMed] [Google Scholar]
- 53.Power, M. L., Oftedal, O. T. & Tardif, S. D. Does the milk of callitrichid monkeys differ from that of larger anthropoids? Am. J. Primatol.56, 117–127 (2002). [DOI] [PubMed] [Google Scholar]
- 54.Layman, D. K., Lönnerdal, B. & Fernstrom, J. D. Applications for α-lactalbumin in human nutrition. Nutr. Rev.76, 444–460 (2018). [DOI] [PMC free article] [PubMed] [Google Scholar]
- 55.Austad, S. N., Smith, J. R. & Hoffman, J. M. Amino acid restriction, aging, and longevity: an update. Front. Aging. 5, 1393216 (2024). [DOI] [PMC free article] [PubMed] [Google Scholar]
- 56.Obata, F. & Miura, M. Regulatory mechanisms of aging through the nutritional and metabolic control of amino acid signaling in model organisms. Annu. Rev. Genet.58, 19–41 (2024). [DOI] [PubMed] [Google Scholar]
- 57.Green, C. L. et al. Sex and genetic background define the metabolic, physiologic, and molecular response to protein restriction. Cell. Metab.34, 209–226e5 (2022). [DOI] [PMC free article] [PubMed] [Google Scholar]
- 58.Larson, K. R. et al. Sex differences in the hormonal and metabolic response to dietary protein Dilution. Endocrinology158, 3477–3487 (2017). [DOI] [PubMed] [Google Scholar]
- 59.Percie du Sert, N. et al. The ARRIVE guidelines 2.0: updated guidelines for reporting animal research. PLoS Biol.18, e3000410 (2020). [DOI] [PMC free article] [PubMed] [Google Scholar]
- 60.Flurer, C. I. & Zucker, H. Coprophagy in marmosets due to insufficient protein (amino acid) intake. Lab. Anim.22, 330–331 (1988). [DOI] [PubMed] [Google Scholar]
- 61.Wu, Y. et al. Very-low-protein diets lead to reduced food intake and weight loss, linked to Inhibition of hypothalamic mTOR signaling, in mice. Cell. Metab.33, 888–904e6 (2021). [DOI] [PubMed] [Google Scholar]
- 62.Pang, Z. et al. MetaboAnalyst 6.0: towards a unified platform for metabolomics data processing, analysis and interpretation. Nucleic Acids Res.52, W398–W406 (2024). [DOI] [PMC free article] [PubMed] [Google Scholar]
Associated Data
This section collects any data citations, data availability statements, or supplementary materials included in this article.
Supplementary Materials
Data Availability Statement
All data analyzed during this study are included in this published article (and its supplementary information files). The remaining raw data are available upon request to the corresponding author.