

Abstract
An extensive study on the laser power limiting behavior of para-aminobenzoic acid (PABA) combined with silver nanoparticles (PABA + AgNPs) was done and reported in this article. The XRD spectra for PABA + AgNPs confirm its crystalline structure. The absorption spectra of AgNPs and PABA + AgNPs indicate complete stability of the samples. However, comparison of the absorption details indicated the occurrence of bathochromic shift in the PABA + AgNPs. The band gap of PABA was reduced after the introduction of AgNPs. Further, the Z-Scan experiment indicated the occurrence of reverse saturable absorption in prepared PABA + AgNPs. The linear transmittance of probe PABA (65%) was reduced to 52% after the addition of AgNPs. The overall study supported that the addition of AgNPs was suitably helpful in increasing the optical laser limiting capabilities of PABA. The results reported herein can be helpful in synthesizing an organic-nanoparticle optical laser limiting composite material and can be employed for the safety of optically sensitive devices.
Keywords: Para-aminobenzoic acid, Silver nanoparticles, Nonlinear optics, Optical limiting
Subject terms: Nanoscience and technology, Optics and photonics
Introduction
Organic functional group rich materials have gained considerable interest among the researchers for fulfilment of the challenges of nonlinear optical (NLO) applications. The NLO effect of organic compounds have resulted their extensive usage for NLO effects like second harmonic generation, telecommunication, optical power limiting, data storage, frequency generation and frequency mixing, and many more1,2.
Nanoparticles (NPs) have revolutionized the NLO properties of organic compounds. Integrating NPs as dopants enhances the optical performance of NLO materials, opening new possibilities for advanced optical devices. NPs (size around 10−9 m) have a high surface-to-volume ratio, leading to increased molecular polarizability and chemical reactivity, making them ideal dopants for boosting the NLO responses of organic compounds3,4. In past, several kinds of NPs like silver NPs (Ag NPs), gold NPs (Au NPs), copper oxide NPs (CuO- NPs), etc., have been used as dopants for increasing the efficiency of organic compounds5,6. Specifically, metal NPs such as AgNPs and AuNPs can enhance third-order NLO effects like Kerr effect, four-wave mixing, and two-photon absorption (2PA)7. AgNPs and AuNPs exhibit strong plasmonic resonances, which can significantly enhance the local electromagnetic fields and thus increase the NLO response of the host material8. Literature has evidenced that the NLO activity of the host organic compounds were increased after the addition of NPs.
A study was found in which the NLO activity of the amino acid L-phenylalanine (Phe) was determined after the addition of AgNPs as the capping agent9. The results of NLO absorption measurements show that an aqueous solution of Phe-AgNPs undergo reverse saturable absorption and is a good optical limiter9. Fathima and Mujeeb has reported that laser induced synthesis of AgNPs, AuNPs, and Ag-Au alloy NPs in water has suitable NLO properties10. A significant reduction in the average crystalline size of the AgNPs and AuNPs after the formation of the composite was reported. It was found out that the value of third-order nonlinear susceptibility was increased up to 0.906 × 10⁻¹⁸ m2/V2 after the fusion of AgNPs and AuNPs. The normalized transmittance of the composite was reached up to 0.47 au10. The influence on the nonlinear optical response of 2-[4-(N,N-dimethylamino)-benzylidene]-indane-1,3-dione (DMABI) molecules was observed to get increased after the addition of the AgNPs11. The comparison of the nonlinear refractive index of DMABI with and without AgNPs showed a difference in signals was observed that indicated the occurrence of reverse saturable absorption due to the availability of NPs. Z-scan measurements showed that the reorientation contribution of the Kerr effect changed due to the presence of NPs11. The improved third-order NLO activity of organic compound 4-[(E)-2-(2,4,6-Trinitrophenyl)ethylidene]benzonitrile was reported and proved that the compound has potential optical limiting (OL) characteristics12. The Z-Scan indicated the occurrence of two-photon absorption, normalized transmittance was observed to be decreased with increasing input fluence, and normalized transmittance was obtained as 60% for 4-[(E)-2-(2,4,6-Trinitrophenyl)ethylidene]benzonitrile12. U. R. Felscia has done a lot of works where the AgNPs were used as suitable dopants for the increment of the NLO activity of the organic systems. Studies were reported claiming the enhanced NLO activity of the quinacridone, pyrene, nitropyrene, L-histidine, pyridine-3-carboxylic acid, nitrobenzene, etc., after the doping of the AgNPs13–18.
The theoretical modelling of the NLO activity of the pentacene-2,5-dione and 2,9-dimethyl quinacridone were studied previously and the first-order hyperpolarizability of the AgNPs-doped clusters (2057.26 × 10−30 esu and 1066.85 × 10−30 esu respectively) indicated high potential of these combinations to be used as powerful optical limiters19,20. Similar kind of theoretical and experimental study was performed by us for organic compound 7-diethylamino 4-methyl coumarin and it was found that the first-order hyperpolarizability of 2002.71 × 10–30 esu was obtained. The valley-like shape observed in the Z-Scan spectra justified the NLO responses and OL characteristics of 7DMC + AgNPs21. The experimental demonstration of the NLO and OL characteristics of para-aminobenzoic acid (PABA) and theoretical modelling of the NLO activity of PABA combined with Ag3 trimer has been previously done22,23.
In continuation of our previous work on the computational calculations of the NLO activity of PABA + Ag3 complex, the experimental demonstration of the PABA + AgNPs has been reported in this article22. The UV–Vis absorption spectra was employed for reporting the range of absorption, band gap, and stability of the prepared samples. The availability of the functional groups and their vibrational assignments were reported using the Fourier-Transform Infrared spectroscopy (FT-IR). Various optical nonlinear parameters were also extracted by performing single-beam open-aperture Z-Scan experiment. The optical power limiting threshold of the prepared samples demonstrated their optical power limiting nature. For comparison, the results were further compared to the known OL compounds. Along with the experimental demonstration of the NLO and OL activity of PABA + AgNPs, this study also report the reliability of the followed procedure for the preparation of the PABA + AgNPs other than the existing procedure.
Experimental methods
Material synthesis
Organic compound PABA (C7H7NO2) (product number M0267 with > 97% purity) was purchased from TCI chemicals (https://www.tcichemicals.com/IN/en/). Silver nitrate (AgNO3) and sodium borohydride (NaBH4) was used for the preparation of the silver nanoparticles. Both the chemicals were purchased from Sisco Research Laboratories (https://www.srlchem.com/). All the chemicals used were taken of the spectroscopic grade. Four different samples were prepared in this study namely A, B, C, and D with procedure mentioned below:
-
A:
The liquid sample of PABA (5 × 10⁻³ M) in deionized water.
-
B.
The colloidal AgNPs was prepared using AgNO3 (1 mM) as a precursor and NaBH4 (1 mM) as a reducing agent. The NaBH4 was kept in continuous stirring in ice bath and AgNO3 was added dropwise to it while continuous stirring. The stirring was stopped after the complete addition of AgNO3 to NaBH4. Polyvinyl pyrrolidine (PVP) was added as a stabilizing agent. A gradual change in the color of the solution from colorless to yellow confirmed the formation of AgNPs.
The samples C and D both were of PABA + AgNPs and were prepared as explained further.
-
C:
Sample C was prepared using the Creighton’s method14–16,21,24. 4 ml of Liquid PABA (5 × 10⁻³ M) was added dropwise to AgNO3 solution (1 mM) in an ice bath with continuous stirring. The resultant solution was immediately added to the NaBH4 (1 mM) solution dropwise in an ice bath and stirred till the solution was completely added. The prepared solution was the PABA combined with AgNPs.
-
D:
Sample D was prepared by adding PABA (5 × 10⁻³ M) to prepared AgNPs. Liquid PABA was added dropwise to the prepared sample B keeping in the ice bath. It was done to check whether both the methods yield same results or not. The prepared samples are shown in Fig. 1.
Fig. 1.

Prepared liquid samples of (A) probe PABA (in DI water), (B) AgNPs (in DI water), (C) PABA + AgNPs (Creighton’s method), and (D) PABA + AgNPs (Modified method).
Sample characterizations
The diffraction pattern, phase deposition, and crystallite size were studied for the prepared samples using XRD spectroscopy. The liquids B, C, and D were deposited over glass substrates for recording the XRD pattern. The XRD peaks of samples were recorded using Bruker AXS Model number-D8 Advance-Eco instrument. The average crystallite size (D (nm)) of the AgNPs was calculated using Scherrer’s formula mentioned as:
 |
1 |
where k is the Scherrer constant (k = 0.9), λ is the wavelength of the X-ray source (λ = 0.15406), β is the full width at half maximum, and θ (in radians) is the peak position.
The surface morphological images and elemental concentration of the deposited films were pictured using Apreo S low-vaccum Thermo Fischer FE-SEM system. FE-SEM images were further used for the estimation of the particle size of the samples. ImageJ software package was used for calculating the average particle size of the samples. The UV–Vis absorption spectroscopy of PABA, AgNPs, and PABA + AgNPs was performed using Perkin-Elmer model Lamda-35 absorption spectrophotometer with tungsten iodide and deuterium light source and spectra was traced in a general absorption range of 200–1100 nm and varying slit width of 0.5 and 1.0 nm. The data obtained from the absorption spectra was further used for the calculation of the band gap (ΔE). Mott and Davis’s relationship was used for calculating ΔE25:
| 2 |
The identification of the functional groups after the mixing of two compounds was done using a FT-IR spectrophotometer. A Perkin-Elmer FT-IR spectrophotometer of model Spectrum BX-II with nichrome glower wire light source and a DTGS detector was used to get the vibrational details for each of the samples. The open-aperture Z-scan spectroscope with a nano-pulsed Nd: YAG laser beam of 17 μm waist, 532 nm wavelength, 15 cm focal length, and 10 Hz frequency was used to get the relationship between normalized transmittance (β) and Z. The theoretical data fitting to get the proper curve between β and Z. Sheik-Bahae formalism mentioned below (2) was employed to calculate the nonlinear absorption coefficient (β)26.
 |
3 |
where  is unsaturated linear absorption at the excitation, I is input intensity of the laser, Is is saturation intensity, and Z is the samples propagation distance.
The linear transmittance (LT) was calculated using the input (P0) and output power (P) with the expression mentioned in (4):
 |
4 |
The linear absorption coefficient (α0) was computed using LT and considering the 1 mm sample thickness by equation mentioned in (5):
| 5 |
Results and discussion
XRD analysis
The XRD spectra of samples B, C, and D have been illustrated in Fig. 2. In XRD spectra of B, prominent peaks were observed at 38°, 44°, and 57°. These peaks typically correspond to specific crystallographic planes in the AgNPs27,28. The peak at 38° corresponds to the (111) crystal plane of silver and it indicate the face-centered cubic (FCC) crystals structure. The peak at 44° corresponds to the (200) crystal plane of silver and also indicates the FCC crystal structure. This peak typically appears at a higher 2θ angle than the (111) plane due to its different spacing. The peak at 57° indicates the (220) crystal plane and this peak signify the presence of ordered crystalline structures. The presence of sharp peaks at these specific angles (38°, 44°, and 57°) suggests that sample B of AgNPs are predominantly crystalline in nature28. DeLong et al. has reported XRD peaks of PABA (sample A) at around 23°29. Similar kind of peak was observed in samples C and D. The prominent XRD peaks observed at 2θ values corresponding to approximately 21° and 38° likely indicate the presence of both PABA and AgNPs in C. The peak at 21° in XRD of sample C is likely associated with the crystalline structure of PABA. This specific peak is a function of crystallite size and purity. The peak at around 38° corresponds to the (111) crystal plane of AgNPs, as indicated for sample B. The coexistence of XRD peaks at 21° and 38° suggest the availability of both crystalline PABA and crystalline AgNPs28,29. In sample D, the peaks at (020), (210), and (111) confirm the presence of PABA in a crystalline form and AgNPs. Therefore, the XRD spectra for both C and D perfectly indicates the formation of PABA + AgNPs. The average crystallite size calculated for the samples B, C, and D was calculated as 47 nm, 127 nm, and 63 nm respectively. The average crystallite size was less for pure AgNPs, but after the introduction of PABA to AgNPs, the average crystallite size was increased and this increment might be due to interaction between PABA and AgNPs. PABA possibly act as a stabilizing agent to prevent agglomeration, it might also reduce the overall rate of nanoparticle nucleation and growth.
Fig. 2.

XRD spectra of samples B, C, and D.
Surface morphology analysis
The surface morphological characterization and elemental composition was done using FE-SEM images and EDX spectra. The FE-SEM images of samples B, C, and D at different magnification are shown in Fig. 3. The images produced of the deposited colloidal AgNPs over glass substrates indicated the presence of dense AgNPs in sample B. The FE-SEM images of AgNPs were similar to that reported in the literature30. The calculated average particle size of the AgNPs generated with FE-SEM images of sample B were obtained as approximately 12 nm. However, the settlement of the AgNPs was less in images of samples C and D. The decrement in the densely settled AgNPs in the FE-SEM images of sample C and D indicates the availability of organic compounds in the samples as well. The calculated particle size for sample C and D was 10 nm and 9 nm respectively. The reduction in particle size of AgNPs upon the addition of PABA is likely due to PABA’s role as a stabilizer and capping agent, influencing the nucleation and growth kinetics of the AgNPs. PABA also seems to prevent the aggregation of the AgNPs, leading to smaller particles in samples C and D. The EDX spectra (Fig. 4) of sample B clearly indicates the availability of Ag and is in good agreement with the literature30. For sample C and D, the concentration of the O and N atoms were also traced which supports the availability of -NH2 and -COOH groups in the films. Therefore, the deposited films confirm the formation of the AgNPs and PABA + AgNPs in the films. Additionally, the elemental composition also supports the availability of the AgNPs in the films.
Fig. 3.

FE-SEM images of the thin films deposited over glass of samples B, C, and D.
Fig. 4.

EDX spectra of samples B, C, and D.
Absorption spectra analysis
The absorption spectra was recorded in the UV–Vis wavelength range. Figure 5 illustrates of the absorption spectra of all the prepared samples and the inset of Fig. 5a indicates the absorption spectra of individual PABA23. The inset indicates that absorption peak of PABA was noticed at 271 nm. The sample B (colloidal AgNPs) gave a sharp peak at 394 nm. This peak was shifted towards the higher wavelength of 398 and 400 nm wavelength for C and D (PABA + AgNPs). Along with the bathochromic shift (shift towards the higher wavelength), the absorbance intensity was also decreased for the combination as compared to the individual AgNPs. It was observed that the absorption wavelength of probe PABA was much less than that of the AgNPs. It can be stated that the addition of AgNPs in PABA resulted in the bathochromic shift. The reason might be the enhanced local electromagnetic field interaction with the AgNPs due to their nano-size, potentially increasing their absorption intensity or causing shifts in the absorption maxima. The availability of nano-range AgNPs provide more active surface to the electromagnetic field resulting in the modifications in the absorption properties. Additionally, the absorption properties of all the samples were recorded after 24 h (Fig. 5b) and there was negligible change reported. Thus, the absorption properties support stability of our samples. The absorption band of both C and D samples were quite similar. This reveals that both the methods of preparation of PABA + AgNPs (say samples C and D) showed similar kind of response. From this interpretation, it is clear that the procedure followed for the preparation of sample D was also suitable for making of AgNPs combined organic compound. As the computational calculations of this study has been previously published, it was noted that the theoretical absorption peak of PABA + Ag3 complex was obtained at around 400 nm22. The theoretical findings and the experimental results were in good agreement with each other. The absorption details of the AgNPs reported in the literature showed that the absorption band of the AgNPs were in similar range and the peak wavelength was also at the similar peak21. From the comparison, it can be stated that the AgNPs were suitably synthesized and were stable.
Fig. 5.

Absorption spectra of samples A, B, C, and D of (a) freshly prepared samples, and (b) samples after 24 h.
Further, the calculation of the ΔE was done by using Mott and Davis’s relationship with the help of absorption coefficient and energy (Fig. 6). The calculated value of ΔE for B, C, and D were 2.5, 2.2, and 2.4 eV respectively. The ΔE of samples C and D was reduced from that of the pure AgNPs. The ΔE of the PABA + AgNPs combination was also reduced from the ΔE of the individual PABA (3.6 eV)23. However, the ΔE and other optical properties of the C and D were quite similar. This supported the modified method adopted for the synthesis of PABA + AgNPs was successful in yielding the similar optical characteristics as of PABA + AgNPs synthesized by traditional method. The reduction in the ΔE of PABA after the addition of AgNPs indicated the increased chemical reactivity of the combination. To the contrary, the experimentally obtained ΔE of the combination was quite similar to the computationally obtained ΔE in the reported study (2.64 eV)22. The experimental electronic properties of PABA + AgNPs were in good agreement with the theoretical properties of PABA + Ag3 complex. The shift in the absorption band towards higher wavelength and decrement in the ΔE indicated that the addition of AgNPs increased the chemical reactivity and it can further lead to the increased polarizability of the combinations.
Fig. 6.
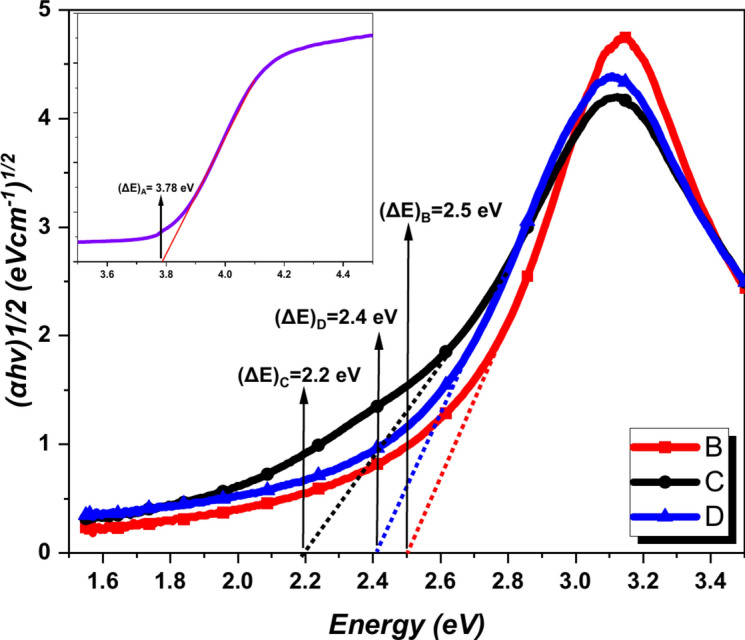
Tauc plot of samples B, C, and D for the prediction of the ΔE. The inset represents the Tauc plot of A.
Fourier transform infrared spectra analysis
The vibrational assignments of the prepared samples have been studied using the FT-IR spectra. The major vibrational modes of PABA (A), AgNPs (B), PABA + AgNPs (C and D) obtained are shown with the help of Fig. 7. The sample B illustrates the FT-IR spectra of AgNPs. The peak at 447 cm−1 in the FT-IR spectra of sample B can be indicative of specific vibrational modes associated with metal–oxygen (Ag–O) stretching vibrations or metal–metal vibrations. A sharp peak at 1631 cm−1 correspond to C=O stretching vibrations, often from carbonyl groups. A broad peak at 3305 cm−1 is attributed to O–H stretching vibrations, indicating the presence of hydroxyl groups.
Fig. 7.

FT-IR spectra of samples A, B, C, and D.
As the FT-IR spectra of both PABA and PABA + Ag3 complex have been already reported in the reference studies22,23, the results obtained for samples A, C, and D were interpreted and were also compared to that from the reference studies. The peak at 414 cm−1 for sample A was observed for rocking of the N–H bond. Same mode for rocking of the N–H bond was found for PABA in previously reported article23. Addition of AgNPs in the PABA resulted in the peak shifting towards higher wavenumber and the peak for the rocking of the N–H bond in samples C and D were obtained at 442 and 445 cm−1 respectively. This was likely due to the effect of the addition of the AgNPs. The peaks for the symmetric stretching of C–N bond and the wagging of O–H group were found to be in good agreement with the theoretical FT-IR responses of PABA + Ag322. In the theoretical FT-IR spectra of PABA + Ag3 trimer, the symmetric stretching of C-N bond favoured a small peak at 1219 cm−1. Corresponding to this peak, a small peak in FT-IR spectra of sample C and D was observed at 1240 and 1238 cm−1 respectively for the C-N symmetric stretching. Similarly, the theoretical vibrational peak for the wagging of the O–H group was observed at 1397 cm−1 and this peak was observed experimentally at 1369 and 1370 cm−1 for samples C and D respectively. The bending of C=O group was observed as a sharp peak at 1634 cm−1 in the present study and the reference article22. For samples C and D, this peak (bending of C=O group) gradually shifted to 1635 and 1626 cm−1 respectively. The bending of the N–H bond gave a prominent broad peak at 3305 cm−1 in sample A. Corresponding to this peak, broad band in samples C and D were observed with a slight shift in the wavenumber at 3308 and 3315 cm−1 respectively. The vibrational assignments of samples C and D were quite similar to each other.
The vibrational assignments discussed so far present following major points:
The matching peaks of FT-IR spectra of prepared AgNPs sample with that reported in the literature indicate the formation of the AgNPs.
The vibrational assignments obtained for PABA in the present study coincide with that reported in the literature. This indicates the purity of the prepared sample.
The vibrational peaks in sample C and D were quite similar. This clearly states that the PABA + AgNPs prepared by both the methods showed similar vibrational assignments. This similarity supports the method of synthesis followed for preparing organic compound and nanoparticle combination (D).
The wavenumber of the samples C and D were observed to be slightly shifted towards higher wavenumber. This effect was observed due to the addition of the AgNPs in the PABA.
Z-scan spectra analysis
The nonlinear absorption coefficient is a power-dependent parameter and it is a significant parameter in getting better understanding the optical nonlinearity of the compounds. The nonlinear absorption coefficient is directly obtained using an open-aperture Z-Scan technique. The nonlinear absorption coefficient of the samples A, B, C, and D are tabulated in Table 1 and the Z-Scan patterns of the samples are illustrated in Fig. 8. The third-order NLO response of the compound is determined by occurrence of saturable absorption (SA) or reverse saturable absorption (RSA)31,32. A lower absorption cross-section in the excited state compared to the ground state signifies SA, whereas the opposite indicates RSA. The SA results in the increment in the transmission with the increase in the input intensity and in Z-Scan plots, a peak is observed. However, when the sample possesses RSA, the transmission is decreased and a valley-like inverted pattern is observed in Z-Scan plots33,34. In our investigation, we have reported that the valley-like inverted peak for the individual PABA showed the occurrence of RSA in PABA. Similar to individual PABA, same valley-like peak was obtained for samples B, C, and D. This shows that the AgNPs, and PABA + AgNPs undergo RSA. The nonlinear absorption coefficient of PABA was obtained as 0.43 × 10⁻¹⁰ m/W (Table 1) and this value was higher for AgNPs (0.58 × 10⁻¹⁰ m/W). When both PABA and AgNPs were combined, the value of nonlinear absorption coefficient was further increased up to 0.6 × 10⁻¹⁰ m/W and 0.64 × 10⁻¹⁰ m/W for samples C and D respectively. However, the value of nonlinear absorption coefficient for C and D samples was similar. This support that the method of preparation of PABA + AgNPs (used for sample D) was successful in yielding same results as for C. The values of nonlinear absorption coefficient clearly indicate the NLO characteristics of PABA + AgNPs.
Table 1.
Saturation intensity, nonlinear absorption coefficient, and OL threshold of samples.
| Samples | Saturation intensity (× 1012 W/m2) | Nonlinear absorption coefficient (× 10–10 m/W) | Optical limiting threshold (× 1012 W/m2) | Linear transmittance (%) |
|---|---|---|---|---|
| A | 82 | 0.43 | 4.74 | 65 |
| B | 20 | 0.58 | 2.33 | 55 |
| C | 20 | 0.60 | 2.22 | 54 |
| D | 20 | 0.64 | 2.26 | 52 |
Fig. 8.

Z-Scan spectra of samples A, B, C, and D obtained from nano-pulsed Nd: YAG laser beam.
Additionally, the molar coefficient and molar absorption coefficient were also calculated for all the samples. These values were in support of the occurrence of the RSA in the composite samples. The UV–Vis absorption was used to calculate the ground-state parameters and the Z-Scan characteristics were employed to determine the excited-state parameters. The values of ground-state molar absorption coefficient (εg), excited-state molar absorption coefficient (εex), ground-state absorption cross-section (σg), and excited-state absorption cross-section (σex) of the samples are tabulated in Table 2. As the UV–Vis data is taken twice for the samples (of freshly prepared and after 24 h) and the samples are found stable, the absorption of samples after 24 h was considered for the calculation of aforementioned parameters. The value of εex for samples C and D were larger than εg, which supports the RSA in both C and D.
Table 2.
Values of ground-state molar absorption coefficient (εg), excited-state molar absorption coefficient (εex), ground-state absorption cross-section (σg), and excited-state absorption cross-section (σex) of the samples.
| Samples | Ground-state molar absorption coefficient (εg) (M−1 cm−1) | Ground-state absorption cross-section (σg) (× 10–26 cm2) | Excited-state molar absorption coefficient (εex) (M−1 cm−1) | Excited-state absorption cross-section (σex) (× 10–26 cm2) |
|---|---|---|---|---|
| A | 144.4 | 2.4 | 37.4 | 6.21 |
| B | 308 | 5.12 | 259 | 4.3 |
| C | 210.16 | 3.49 | 228.81 | 3.8 |
| D | 220.33 | 3.66 | 239.83 | 3.98 |
Optical limiting graph analysis
The OL is the application of NLO materials, particularly in the protection of sensitive optical sensors and human eyes from damage caused by high-intensity light sources such as lasers. In order to justify the OL activity of designed compounds C and D, the OL graph between normalized transmittance and input fluence was plotted (Fig. 9). The deviation in the graph indicates the decrement in the normalized transmittance with increasing input intensity. For all the samples, the graph indicates the decrement in the normalized transmittance. As stated in the previously published article, PABA is already verified as OL material. The addition of AgNPs further enhanced the OL characteristics. The OL threshold of PABA (4.74 × 10¹² W/m2) was reduced to 2.22 × 10¹² W/m2 and 2.26 × 10¹² W/m2 respectively for samples C and D of PABA + AgNPs respectively. The reduction in the OL threshold supports the early attenuation of the OL activity of the PABA after the addition of the AgNPs. The linear transmittance was also reduced for the PABA + AgNPs samples (C and D) as compared to probe PABA (Sample A). The linear transmittance of PABA was obtained as 65% and for pure AgNPs (sample B), this value was 55%. The PABA + AgNPs samples had lower value of linear transmittance of 54% and 52% for C and D respectively. Linear transmittance of both PABA + AgNPs samples has quite similar which supports that both the samples have similar optical attenuating action towards Nd-YAG laser intensity. The decrement in the linear transmittance of the samples suggests that the samples are more effective at limiting the transmission of light of higher intensities or under certain conditions. Additionally, the values of NLO and OL parameters were quite similar for both C and D, indicating the similarity in both the samples. Figure 10 illustrates the comparison of NLO and OL parameters of samples A, B, C, and D. The comparison clearly states that the addition of the AgNPs in PABA via both the introduced methods enhanced the nonlinear absorption coefficient and decrement in the optical limiting threshold and linear transmittance. The nonlinear absorption coefficient of samples reported in the present work were compare with previously reported values under similar laser conditions and the values are tabulated in Table 3. The value of nonlinear absorption coefficient of reported samples were comparable to the studies reported in the literature.
Fig. 9.

OL Spectra of samples A, B, C, and D obtained from nano-pulsed Nd: YAG laser beam.
Fig. 10.

Comparison of optical limiting threshold, and linear transmittance of samples A, B, C, and D.
Table 3.
Comparison of nonlinear absorption coefficient of present work with previously reported values under similar laser condition.
| Samples | Nonlinear absorption coefficient | References |
|---|---|---|
| Para-aminobenzoic acid | 0.76 × 10⁻¹⁰ m/W | 23 |
| 7-Diethylamino, 4-methylcoumarin + AgNP | 0.6 × 10⁻¹⁰ m/W | 21 |
| Quinolinecarboxamide Chalcone (QCC) | 3.85 × 10⁻³ cm/W | 35 |
| Isonicotinohydrazide derivative (ISB) | 2.83 × 10⁻³ cm/W | 36 |
| isoniazid-vanillin hybrid (IVH) | 10–3 cm/W | 37 |
| C60 | 0.33 × 10⁻¹⁰ m/W | 38 |
| Graphene oxide | 0.28 × 10⁻¹⁰ m/W | 39 |
| Nd-YAG + AgNPs | 0.36 × 10⁻¹⁰ m/W | 40 |
| AgNPs (Present study) | 0.58 × 10⁻¹⁰ m/W | – |
| C (Present study) | 0.60 × 10⁻¹⁰ m/W | – |
| D (Present study) | 0.64 × 10⁻¹⁰ m/W | – |
Conclusion
Two different methods were used for the preparation of PABA + AgNPs and samples were C and D. The XRD spectra of the samples indicated the exact peaks for AgNPs as mentioned in the literature. The XRD peaks clearly indicated the crystallinity of the prepared samples B, C, and D. The elemental composition of the samples indicated the availability of Ag and particle size confirms the formation of AgNPs of nano-range. The absorption band for B, C, and D recorded at different time intervals indicate the stability of the prepared samples. The absorption peak of B was constant at 398 nm and for C and D this value was constant at 400 nm. The NLO and OL parameters were also favourable in suggesting the OL activity possessed by the samples. After the addition of the AgNPs in the PABA, the OL threshold was reduced and the nonlinear absorption coefficient was increased. The conclusions drawn by the presented study are as follows:
The prepared AgNPs were stable.
The synthesis of PABA + AgNPs by both the reported methods gave similar results. This supports the reliability of the method reported for the synthesis of PABA + AgNPs in sample D.
The increased nonlinear absorption coefficient for PABA + AgNPs indicated the better nonlinear responses of PABA + AgNPs as compared to PABA.
The decrement in the OL threshold of PABA + AgNPs indicated the early attenuation of the OL responses of PABA + AgNPs as compared to probe PABA. This also supports better OL activity of PABA + AgNPs than PABA.
The addition of AgNPs was successful in decreasing the linear transmittance of PABA from 65% (probe PABA) to 52% (PABA + AgNPs).
PABA + AgNPs is comparatively better NLO and OL material as compared to probe PABA.
From the reported study, we have drawn a conclusion that AgNPs were successful in improving the OL activity of PABA and similar kind of work can be performed with any other organic compound to make an organic-metal composite using the method introduced in this article. Additionally, the reported metal NPs + organic composite have exclusive properties of NLO materials and have potential applications in optoelectronics. Therefore, the reported composite can be employed for the fabrication of laser safety films, wafers, and crystals. The reported composite has great applications in the field of laser power limiting.
Author contributions
S.L.: Data curation, Writing-Original draft preparation, Visualization, Investigation, Experiment Validation. M.R.: Conceptualization, Methodology, Writing-Reviewing and Editing, Supervision. V.D.: Investigation, Software, Visualization, Draft preparation, Experiment. L.P.P.: Instrumentation and Resources, Supervision. A.D.: Instrumentation and Data curation. T.C.S.G.: Instrumentation and Resources, Experiment. S.S.: Experimentation, Investigation. P.C.: Resources, Supervision, Visualization. K.S.: Experiment. S.R.: Instrumentation and Resources. D.K.: Instrumentation and Resources.
Funding
S. Lakhera and M. Rana thank Uttarakhand Science Education and Research Centre (USERC), Department of Information and Science Technology, Government of Uttarakhand, for financial support through an R&D Research Project (Project No: USERC/2023-24/190).
Data availability
All data generated or analyzed during this study, which support the plots within this paper and the other findings of this study, are included in this article. Source data are provided in this paper.
Declarations
Competing interests
The authors declare no competing interests.
Ethical approval
This material is the author’s original work, which has not been previously published elsewhere. All authors have been personally and actively involved in substantial work leading to the paper and will take public responsibility for its content. The paper properly credits the meaningful contributions of all the co-authors.
Footnotes
Publisher’s note
Springer Nature remains neutral with regard to jurisdictional claims in published maps and institutional affiliations.
References
- 1.Rana, M., Singla, N., Chatterjee, A., Shukla, A. & Chowdhury, P. Investigation of nonlinear optical (NLO) properties by charge transfer contributions of amine-functionalized tetraphenylethylene. Opt. Mater.62, 80–89. 10.1016/j.optmat.2016.09.043 (2016). [Google Scholar]
- 2.Jeyaram, S. Spectral, third-order nonlinear optical and optical switching behavior of β-carotenoid extracted from phyllanthus niruri. Indian J. Phys.96, 1655–1661. 10.1007/s12648-021-02122-0 (2022). [Google Scholar]
- 3.Sen, P. et al. Advancements in doping strategies for enhanced photocatalysts and adsorbents in environmental remediation. Technologies11(5), 144. 10.3390/technologies11050144 (2023). [Google Scholar]
- 4.Singla, R., Guliani, A., Kumari, A. & Yadav, S. K. Metallic nanoparticles, toxicity issues and applications in medicine. In Nanoscale Materials in Targeted Drug Delivery. Theragnosis and Tissue Regeneration (ed. Yadav, S.) 41–80 (Springer, 2016). 10.1007/978-981-10-0818-4_3. [Google Scholar]
- 5.Ansari, A. A. & Sillanpää, M. Advancement in upconversion nanoparticles based NIR-driven photocatalysts. Renew. Sustain. Energy Rev.151, 111631. 10.1016/j.rser.2021.111631 (2021). [Google Scholar]
- 6.Ramalingam, A. et al. Synthesis, spectroscopic, topological, hirshfeld surface analysis, and anti-covid-19 molecular docking investigation of isopropyl 1-benzoyl-4-(benzoyloxy)-2,6-diphenyl-1,2,5,6-tetrahydropyridine-3-carboxylate. Heliyon8(10), e10831. 10.1016/j.heliyon.2022.e10831 (2022). [DOI] [PMC free article] [PubMed] [Google Scholar]
- 7.Deng, G. et al. Novel nonlinear optical chromophores based on coumarin: Synthesis and properties studies. Opt. Mater.88, 218–222. 10.1016/j.optmat.2018.11.035 (2019). [Google Scholar]
- 8.Jeyanthi, C. E., Gajendiran, J., Karnan, C., Kanagathara, N. & Siddheswaran, R. A comparative study on physico-chemical, optical, magnetic and ferroelectric properties of undoped BiFeO3 and Ni-doped BiFeO3 nanoparticles. Inorganic Chem. Commun.158(2), 111608. 10.1016/j.inoche.2023.111608 (2023). [Google Scholar]
- 9.Nidya, M., Umadevi, M., Sankar, P., Philip, R. & Rajkumar, B. J. M. l-Phenylalanine functionalized silver nanoparticles: Photocatalytic and nonlinear optical applications. Opt. Mater.42, 152–159. 10.1016/j.optmat.2015.01.002 (2015). [Google Scholar]
- 10.Fathima, R. & Mujeeb, A. Nonlinear optical investigations of laser generated gold, silver and gold-silver alloy nanoparticles and optical limiting applications. J. Alloys Compd.858, 157667. 10.1016/j.jallcom.2020.157667 (2021). [Google Scholar]
- 11.Bundulis, A., Mikelsone, J. & Rutkis, M. Impact of silver nanoparticle two-photon resonance on Kerr effect of organic dye solutions. J. Opt. Soc. Am. B.39, 22–31. 10.1364/JOSAB.440997 (2022). [Google Scholar]
- 12.Ashwini, A., Saravanan, L., Sabari, V., Astalakshmi, M. & Kanagathara, N. Effect of Cu doping with varying pH on photocatalytic activity of ZnO nanoparticles for the removal of organic pollutants. Inorganic Chem. Commun.155, m111137. 10.1016/j.inoche.2023.111137 (2023). [Google Scholar]
- 13.Felscia, U. R. & Rajkumar, B. J. M. Computational study of quinacridone on silver and gold clusters: Applications to organic light emitting diodes and nonlinear optical devices. Mater. Lett.221, 318–321. 10.1016/j.matlet.2018.03.149 (2018). [Google Scholar]
- 14.Felscia, U. R., Rajkumar, B. J. M., Sankar, P., Philip, R. & Mary, M. B. Optical nonlinearity and charge transfer analysis of pyrene adsorbed on silver: Computational and experimental investigations. Spectrochim. Acta A Mol. Biomol. Spectrosc.184, 286–293. 10.1016/j.saa.2017.05.021 (2017). [DOI] [PubMed] [Google Scholar]
- 15.Felscia, U. R., Rajkumar, B. J. M., Sankar, P., Philip, R. & Mary, M. B. Theoretical and experimental investigations of nitropyrene on silver for nonlinear optical and metal ion sensing applications. Mater. Chem. Phys.243, 122466. 10.1016/j.matchemphys.2019.122466 (2020). [Google Scholar]
- 16.Felscia, U. R., Rajkumar, B. J. M., Nidya, M. & Sankar, P. Electronic and nonlinear optical properties of l-histidine on silver: A theoretical and experimental approach. J. Phys. Chem. A.122(4), 1045–1052. 10.1021/acs.jpca.7b07493 (2018). [DOI] [PubMed] [Google Scholar]
- 17.Rani, J. S. et al. Theoretical investigations on structural, optical and vibrational properties of pyridine 3-carboxylic acid adsorbed on a silver cluster. J. Electron. Mater.51, 3970–4397. 10.1007/s11664-022-09638-z (2022). [Google Scholar]
- 18.Felscia, U. R. & Rajkumar, B. J. M. Electronic, optical and vibrational analysis of nitrobenzene adsorbed on silver cluster. IOSR J. Appl. Phys.02(01), 25–29. 10.9790/4861-17002022529 (2017). [Google Scholar]
- 19.Lakhera, S., Rana, M. & Devlal, K. Influence of adsorption of gold and silver nanoclusters on structural, electronic, and nonlinear optical properties of pentacene-5, 12-dione: A DFT study. Opt. Quant. Electron.55, 178. 10.1007/s11082-022-04422-z (2023). [Google Scholar]
- 20.Lakhera, S., Devlal, K., Rana, M., Dhuliya, V. & Pandey, N. Non-linear optical behavior of 2,9-dimethylquinacridone with adsorbed gold and silver nanoclusters. Optik286, 170983. 10.1016/j.ijleo.2023.170983 (2023). [Google Scholar]
- 21.Lakhera, S. et al. Enhanced nonlinear optical and optical limiting responses of 7-diethylamino-4-methyl coumarin functionalized with silver nanoparticles: A combined experimental and DFT study. J. Photochem. Photobiol. A Chem.457, 115910. 10.1016/j.jphotochem.2024.115910 (2024). [Google Scholar]
- 22.Lakhera, S., Rana, M. & Devlal, K. Nonlinear optical response of Silver trimer adsorbed para-aminobenzoic acid: A DFT study. Phys. Scr.98, 11519. 10.1088/1402-4896/ad0084 (2023). [Google Scholar]
- 23.Lakhera, S. et al. Exploring the nonlinear optical limiting activity of para-aminobenzoic acid by experimental and dft approach. J. Photochem. Photobiol. A Chem.444, 114987. 10.1016/j.jphotochem.2023.114987 (2023). [Google Scholar]
- 24.Creighton, J. A., Blatchford, C. G. & Antia, C. J. Formation and growth of silver nanoparticles: A study using X-ray diffraction. J. Chem. Soc. Faraday Trans. 1 Phys. Chem. Condensed Phases75, 373–383 (1979). [Google Scholar]
- 25.Mott, N. F. & Davis, E. A. Electronic Processes in Non-Crystalline Materials 2nd edn. (Oxford University Press, 2012). [Google Scholar]
- 26.Sheik-Bahae, M., Sheikh-Bahae, M. & Steier, W. H. Absolute measurement of the third-order nonlinear optical susceptibility of liquids using a Z-scan technique. Opt. Lett.15(5), 275–277. 10.1364/OL.15.000275 (1990). [Google Scholar]
- 27.Ashwini, A. et al. Visible light photocatalysis enhancement by Ag3PO4 decorated with RuO2 nanoparticles. Physica B Condensed Matter.682, 415890. 10.1016/j.physb.2024.415890 (2024). [Google Scholar]
- 28.Aman, A. W., Omar, M. F., Samavati, A. & Krishnan, G. A simple green synthesis of pure and sterling silver nanoparticles via pulsed laser ablation in deionized water: Characterization and comparison. Phys. Scr.97, 105801. 10.1088/1402-4896/ac8b44 (2022). [Google Scholar]
- 29.DeLong, D. W., Lee, E. S. & Fuller, M. F. Synthesis, X-ray diffraction, and thermal characterization of para-aminobenzoic acid and its derivatives. J. Chem. Crystallogr.38(8), 519–527. 10.1007/s10870-008-9481-0 (2008). [Google Scholar]
- 30.Saadmim, F. et al. Enhancing the performance of dye sensitized solar cells using silver nanoparticles modified photoanode. Molecules25, 4021. 10.3390/molecules25174021 (2020). [DOI] [PMC free article] [PubMed] [Google Scholar]
- 31.Lakhera, S. et al. Two-photon absorption and optical limiting in 7-diethylamino-4-methyl coumarin. J. Photochem. Photobiol. A Chem.447, 115216. 10.1016/j.jphotochem.2023.115216 (2023). [Google Scholar]
- 32.Lakhera, S., Rana, M. & Devlal, K. Comprehensive quantum chemical study of the associative complex of para-aminobenzoic acid and 7-diethylamino 4-methyl coumarin by adsorption and aromatic bridges. J. Mol. Model.30, 37. 10.1007/s00894-023-05816-w (2024). [DOI] [PubMed] [Google Scholar]
- 33.Lakhera, S., Rana, M. & Devlal, K. Utilization of methyclothiazide adsorbed with malonamide for quantum chemical applications: A DFT and DFT-D2/D3 studies. Optik295, 171485. 10.1016/j.ijleo.2023.171485 (2023). [Google Scholar]
- 34.Lakhera, S., Rana, M. & Devlal, K. Investigation of nonlinear optical responses of organic derivative of imidazole: Imidazole-2-carboxaldehyde. IJMR114(7–8), 555–563. 10.1515/ijmr-2021-8649 (2023). [Google Scholar]
- 35.Sudha, N., Surendran, R. & Jeyaram, S. Synthesis, spectral, solvent dependent linear and nonlinear optical characteristics of (E)-N-(3-(3-(4(dimethylamino)phenyl)acryloyl) phenyl)quinolone-2-carboxamide. J. Fluorescence32, 1471–1480. 10.1007/s10895-022-02959-6 (2022). [DOI] [PubMed] [Google Scholar]
- 36.Sudha, N., Surendran, R. & Jeyaram, S. Low power Z–scan studies of Schiff base (E)-N’-(4-(dimethylamino) benzylidene) isonicotinohydrazide for nonlinear optical applications. Indian J. Phys.97(14), 4399–4408. 10.1007/s12648-023-02764-2 (2023). [Google Scholar]
- 37.Sudha, N., Surendran, R. & Jeyaram, S. Vibrational spectroscopic, structural, linear and third-order nonlinear optical properties of isoniazid-vanillin hybrid. Indian J. Phys.98(4), 1453–1462. 10.1007/s12648-023-02869-8 (2024). [Google Scholar]
- 38.Wang, J. & Blau, W. J. Solvent effect on optical limiting properties of single-walled carbon nanotube dispersions. J. Phys. Chem. C.112, 2298–2303. 10.1021/jp709926r (2008). [Google Scholar]
- 39.Zhao, B., Cao, B., Zhou, W., Li, D. & Zhao, W. Nonlinear optical transmission of nanographene and its composites. J. Phys. Chem. C114, 12517–12523. 10.1021/jp104432b (2010). [Google Scholar]
- 40.Li, R. et al. Nd-YAG giant enhancement of nonlinear optical response in Nd:YAG single crystals by embedded silver nanoparticles. ACS Omega2(4), 1279–1286. 10.1021/acsomega.7b00003 (2017). [DOI] [PMC free article] [PubMed] [Google Scholar]
Associated Data
This section collects any data citations, data availability statements, or supplementary materials included in this article.
Data Availability Statement
All data generated or analyzed during this study, which support the plots within this paper and the other findings of this study, are included in this article. Source data are provided in this paper.