



Abstract
Pancreatic ductal adenocarcinoma (PDAC) is a highly lethal malignancy that is often resistant to standard therapy. An immune suppressive tumor microenvironment (TME) and oncogenic mutations in KRAS have both been implicated as drivers of resistance to therapy. Mitogen-activated protein kinases (MAPK) inhibition has not yet shown clinical efficacy, likely due to rapid acquisition of tumor intrinsic resistance. However, the unique PDAC TME also be a key driver in resistance. Herein, we found that long-term FAK inhibitor treatment leads to hyperactivation of the RAS/MAPK pathway in PDAC cells in both mouse models and tissues from treated human PDAC patients. Concomitant inhibition of both FAK (with VS-4718) and RAF-MEK (with avutometinib) induced tumor growth inhibition and increased survival across multiple PDAC mouse models. In the TME, we found that cancer-associated fibroblasts (CAFs) impaired the downregulation of cMyc by RAF-MEK inhibition in PDAC cells, resulting in resistance. By contrast, FAK inhibition reprogramed CAFs to suppress the production of FGF1, which can drive resistance to RAF-MEK inhibition. The addition of chemotherapy to combined FAK and RAF-MEK inhibition led to tumor regression, decrease in liver metastasis and improved long-term survival in KRAS-driven PDAC mouse models. Combination of FAK and RAF-MEK inhibition alone improved anti-tumor immunity and priming of T-cell responses in response to chemotherapy. These findings provided the rationale for the ongoing clinical trial evaluating the efficacy of avutometinib and defactinib in combination with gemcitabine and nab-paclitaxel in PDAC patients (RAMP 205; NCT05669482) and may suggest further paths for combined stromal and tumor targeting therapies.
One-sentence summary:
Stromal reprograming by FAK inhibition overcomes RAS-MAPK resistance and enhance response to therapy in pancreas cancer models.
Introduction
Pancreatic ductal adenocarcinoma (PDAC) is a lethal malignancy with a 5-year survival rate of approximately 13%(1). Over 90% of patients with PDAC harbor oncogenic mutations in the KRAS oncogene(2). Mutation of KRAS induces constitutive activation of the RAS-RAF-MEK-ERK (RAS/MAPK) pathway, which supports tumor cell proliferation and survival(3). Multiple RAS/MAPK pathway inhibitors, as well as recent KRAS inhibitors, can induce tumor regression in many preclinical mouse models(4–6). Even though encouraging preclinical findings were reported for MAPK signaling inhibitors, their clinical application has had limited success because of rapidly acquired resistance(7). Many studies have verified that tumor-intrinsic factors drive resistance, including reactivation of ERK signaling(8–10), induction of autophagy(11) and activation of PI3K/AKT pathway(12). Mounting evidence has shown that activation of receptor tyrosine kinases, including activation of EGFR, HER2, FGFR, and c-MET, are involved in RAS/MAPK inhibitor resistance(13). Despite these tumor-intrinsic factors, the interplay of the tumor stroma with RAS/MAPK signaling likely also plays a role in the resistance (14).
PDAC is characterized by an abundant desmoplastic tumor stroma which includes numerous cancer-associated fibroblasts (CAFs), and abundant myeloid cells embedded in dense extracellular matrix (ECM) (15, 16). Recently, it was reported that MAPK inhibition promotes the reprogramming of CAFs toward a myofibroblastic CAF (MyCAF) phenotype, resulting in drug resistance and tumor progression(17). Stromal cell secretion of hepatocyte growth factor-mediated RAS/MAPK and PI3K signaling pathway activation (18) and increased ECM deposition could also induce resistance (19). Thus, a deeper mechanistic understanding of how the TME impacts the response and resistance to RAS/MAPK inhibition may be important.
Focal adhesion kinases (FAKs) are non-receptor tyrosine kinases, including FAK1 and PYK2/FAK2(20). FAK is a critical integrator for ECM signaling, which is triggered by integrin activation(21). Pharmacologic inhibition of FAK1 and 2 by FAK inhibitors (FAKi) can diminish tumor-induced fibrosis, dampening CAF activation and collagen density in animal models(22). FAKi-induced stromal reprogramming has been reported to increase the response to radiation therapy and improve anti-tumor immunity in animal models(23–26). Recently, co-targeting of the FAK and RAS/MAPK pathways showed synergistic growth inhibition effects in uveal melanoma cells(27) and gastric cancer models(28). As PDAC is a fibrotic cancer and harbors KRAS mutations, it is important to explore the crosstalk between these two signaling pathways.
Results
RAS-MAPK is hyperactivated in FAKi-treated PDAC tumors
Given the potential interplay between FAK and RAS/MAPK signaling pathways, we sought to explore the effects of FAK inhibition on MAPK pathways in PDAC models. KPC (p48-Cre; LSL-KrasG12D; Trp53flox/+) mice were treated with vehicle or the FAKi, VS-4718, starting at 3.5 months of age. As expected, FAKi treatment inhibited the phosphorylation of both FAK1 and PYK2 in PDAC tissue (fig. S1A and B) and led to temporary disease stasis followed by resistance and disease progression (22, 26). At the end stage tumor progression, we performed immunohistochemical (IHC) analysis on PDAC tissues. Tumors that progressed after long-term FAKi exposure had increases in phosphorylated-MEK (pMEK) and -ERK (pERK) PDAC cells compared with end-stage vehicle-treated tumors (Fig. 1A, p<0.05). These data suggested that RAS/MAPK activation may be a marker of FAKi resistance. To explore this finding further, KPPC (p48-Cre; LSL-KrasG12D; Trp53flox/flox) mice were treated with vehicle or a FAKi until end-stage progression (fig. S1C) and harvested pancreatic tumor tissues for multiplex immunohistochemistry (mpIHC) analysis. We serially stained for pERK, αSMA (a CAF marker), and CK19 (a marker of PDAC cells) and found increased pERK expression in CK19+ tumor cells from FAKi-treated mice, compared to Vehicle (Fig. 1B, p=0.0379, fig. S1C). To determine whether FAKi treatment could more acutely activate the MAPK pathway, KP2 PDAC cells were treated with FAKi in vitro, and we observed increased pERK expression (fig. S1D). Similarly, bulk RNA sequencing (RNA-seq) analysis of KP2 organoids showed enrichment of RAS/MAPK signatures following FAKi treatment (fig. S1E). Together, these data suggest that RAS/MAPK pathway activation is associated with FAKi resistance in PDAC.
Figure 1. RAS/MAPK activation in FAKi-treated PDAC tumors.

A. The schematic on the left shows how KPC mice were treated with Vehicle or the FAKi (75 mg/kg) at the age of 3.5 months until the end stage. Representative IHC staining for pERK and pMEK in PDAC tissue is shown in the middle two panels. Scale bar, 100 μm. The percentage of pERK+ and pMEK+ cells are plotted on the right (n=5–7). B. The schematic on the left shows how KPPC mice were treated with Vehicle or the FAKi (75 mg/kg) from tumor diagnosis until the end stage. Representative mpIHC staining for pERK (red), SMA (green), and CK19 (blue) in PDAC tissue is shown in the middle panel, and pERK+ PDAC cells in each group are magnified. Scale bar, 500 μm (left), 100 μm (middle) and 500 μm (right). The percentage of pERK+ CK19+ cells is plotted on the right (n=7). C. Representative mpIHC staining for pERK (red) and CK19 (green) in 10 paired tumor biopsies from patients, scale bar, 50 μm, and 150 μm. The relative fold changes of pERK+ cell proportion in post-groups compared to paired pre-treatment are plotted on the right. Red lines represent increased pERK+ cells in the post-treatment groups. Grey lines represent a decrease. All graphs show the mean, and error bars are SEM; Data were analyzed using two-sided t-tests (A and B) and One sample t and Wilcoxon tests (C); *denotes p < 0.05, **denotes p < 0.01, and n.s denotes not significant.
We next sought to understand whether FAK inhibition could lead to hyperactivation of the RAS/MAPK pathway in PDAC tissues from patients treated with a FAKi. To do this, we studied PDAC tissues from a previously reported clinical trial(29) that evaluated the efficacy of the FAKi defactinib in combination with the anti-PD-1 antibody pembrolizumab and gemcitabine (GEM) in patients with metastatic PDAC (NCT201510157). For a subset of patients, matched pre- and post-treatment tumor tissues were available. Using mpIHC, we observed increased pERK+ cells in the majority of patients post-treatment, compared to pre-treatment (Fig. 1C, p=0.0273, fig. S1F). This finding was consistent with the results observed in our mouse models and suggests that prolonged FAK inhibition may result in the activation of RAS/MAPK pathway in PDAC cells.
Combined MAPK and FAK inhibition block downstream Myc expression
Because activation of RAS/MAPK signaling was increased in long-term FAKi-treated tumors, we hypothesized that inhibition of RAS/MAPK signaling might increase the response to FAK inhibition. To verify this hypothesis, we examined the combination of the FAKi (VS-4718) with the dual RAF-MEK inhibitor avutometinib (RAF-MEKi). Avutometinib is a unique RAF-MEK clamp that potently inhibits MEK kinase activity and induces the formation of dominant negative RAF-MEK complexes, preventing phosphorylation of MEK by ARAF, BRAF, and CRAF(30). Using these agents, we assessed three different mouse PDAC cell lines (KP2, KI, KP1) in short-term (7 day) and longer-term (14 day) growth assays. The FAKi and RAF-MEKi combination prevented macroscopic growth, and the effect was better than that of either FAKi or RAF-MEKi treatment alone (Fig. 2A and B, fig. S2A). The cell proliferation inhibition effect of this combination was also seen in MTT assays of both murine (Fig. 2C) and human PDAC cell lines (fig. S2B), where we observed synergism between the FAKi and RAF-MEKi (Fig. 2D and fig. S2C). Although combined FAK plus RAF-MEK inhibition suppressed PDAC cell proliferation, we observed no obvious effects on apoptosis (fig. S2D).
Figure 2. FAKi increased RAS/MAPK inhibition response by inhibiting downstream Myc expression.

A. Clonogenic growth is shown at 7 or 14 days in KP2 cells treated with Vehicle, FAKi (1 μM), RAF-MEKi (100 nM), or the FAKi and RAF-MEKi combination. Representative images of cell clones in each group are shown on the left, and the percentage of cell area in the above groups on days 7 and 14 is shown on the right (n=3). B. Representative images of cell clones of KI stimulated by treatment in A are shown on the left, and the percentage of cell area is shown on the right (n=3). C. MTT proliferation assay using KP2 (left) and KI cells (right) treated with Vehicle, FAKi (1 μM), RAF-MEKi at different doses, or the FAKi and RAF-MEKi combination. The mean MTT optical density from the above groups at indicated time points is plotted (n=3) D. Median effect analysis measuring synergy between the FAKi and RAF-MEKi in CF-PAC (left) and Capan-1 cells (right) analyzed using Compusyn software is shown. Horizontal dotted lines mark the boundaries that classify each type of interaction—synergism, strong synergism, or very strong synergism —between the FAKi and RAF-MEKi (n=3) E. GSEA identified pathway enrichment in KP2 organoids treated with FAKi (1 μM, left) and FAKi + RAF-MEKi (100 nM, middle) for 24 hours, compared to the Vehicle group. GSEA identified pathway enrichment in FAKi-treated KP2 organoids compared to FAKi + RAF/MEKi-treated samples (right) (n=3). F. qPCR mRNA expression analysis is shown of KP2 organoids with FAKi + RAF-MEKi treatment for 24 hours. Changes in gene expression are depicted as the fold change compared with that in the Vehicle group (n=3). G. KP2 cells were treated with FAKi (1 μM), RAF-MEKi at different doses, and the FAKi and RAF-MEKi combination for 48 hours. Immunoblots for MYC, pMEK, total MEK (tMEK), pERK, total ERK (tERK), pS6, and β-ACTIN (loading control) are shown. The mean expression of pERK, pMEK normalized to tERK or tMEK, Myc, and pS6 normalized to β-ACTIN from replicate experiments is shown on the right (n=3). H. KP2 cells were treated with FAKi (1 μM), RAF-MEKi (100 nM), or the FAKi and RAF-MEKi combination for 48 hours. Immunoblots for BRAF, tERK, tMEK, and β-ACTIN (loading control) from total lysates (left) and for BRAF, tERK, and tMEK from purified tMEK protein (middle) are shown. The mean expression of BRAF and tERK in the IP experiment normalized to tMEK from replicate experiments is shown on the right (n=3). Graphs show the mean ± SEM; Data were analyzed using one-way ANOVA with Tukey’s multiple comparison correction (A-C, G, and H) and two-sided t tests (E and F); *denotes p < 0.05, **denotes p < 0.01, ***denotes p < 0.001, and n.s denotes not significant.
We next sought to explore the mechanism underlying the synergistic efficacy of FAKi plus RAF-MEKi treatment in PDAC cells. We first profiled gene expression by bulk RNA-seq of KP2 organoids treated with the FAKi, RAF-MEKi, or their combination (Fig. 2E, fig. S2E). The FAKi, RAF-MEKi, and their combination all decreased genes related to proliferation, including G2M checkpoint and E2F genes. The FAKi inhibited pathways downstream of RAS/MAPK signaling, including the Myc signaling pathways, which are critical for cell proliferation and survival(31). By adding the RAF-MEKi to FAKi, KRAS/MAPK signaling, Myc signaling, and the downstream E2F and cell cycle checkpoint pathways were all further inhibited (Fig. 2E). Myc and cell cycle checkpoint-related gene expression was markedly downregulated by the FAKi plus RAF-MEKi combination (Fig. 2F, fig. S2F), indicating that the FAKi combined with the RAF-MEKi cooperated to inhibit RAS/MAPK/MYC signaling and further limit proliferation-related pathways. To further examine this regulation, we treated KP2 cells with the FAKi, RAF-MEKi, or their combination. RAF-MEKi treatment alone was able to decrease pERK and MYC amounts in a dose-dependent manner, and the addition of the FAKi further decreased the amounts of pERK and Myc (Fig. 2G). Immunoprecipitation-western blot analysis showed that combined FAK plus RAF-MEK inhibition could disrupt the formation of the RAF/MEK/ERK complex (Fig. 2H, fig. S2G), which is another hallmark of RAS/MAPK pathway activation, further confirming that FAKi plus RAF-MEKi treatment inactivated RAS/MAPK/Myc signaling in PDAC cells. Together, these data demonstrated that combined FAK plus RAF-MEK inhibition partially suppressed tumor cell proliferation and RAS/MAPK/MYC activation through the tumor-intrinsic signaling pathway.
In vivo FAK plus RAF-MEK inhibition blocks RAS/MAPK/Myc signaling and delays PDAC progression
We next sought to determine the anti-tumor effects of combined FAK plus RAF-MEK inhibition in vivo. KPPC mice were treated with either single FAKi or RAF-MEKi agents or their combination (Fig. 3A), and tumor burden changes were recorded using ultrasound. As expected, FAKi and RAF-MEKi monotherapy delayed tumor progression, but the effects of the combination were greater (Fig. 3A). The tumor burden in this group on day 14 was the same or less than that of a parallel cohort sacrificed at diagnosis (Fig. 3B). The histological analysis showed that either FAKi or RAF-MEKi treatment restrained disease progression to PDAC and the development of high-grade PDAC (fig. S3A). However, combination treatment appeared to reverse disease progression, resulting in lower PDAC area than that in a parallel cohort sacrificed at diagnosis (Fig. 3C, fig. S3A). To determine the efficacy of the FAKi and RAF-MEKi combination in more advanced tumors, we delayed the onset of treatment and started FAK plus RAF-MEK inhibition at 7 days after the initial diagnosis in KPPC mice (Fig. 3D). Even in these more advanced tumors, combination treatment still reduced tumor burden, and the tumor weights were less than those in parallel cohorts sacrificed at diagnosis (Fig. 3D). To evaluate the efficacy of FAKi plus RAF-MEKi treatment over a longer period, mice bearing KP2 PDAC tumors were treated with either single FAKi or RAF-MEKi agents or the combination (Fig. 3E). The single FAKi or RAF-MEKi agents both improved survival compared to Vehicle, but the effect of the combination was significantly better, compared with single reagents (Fig. 3E) (p < 0.05 for all comparisons). Moreover, we observed a survival benefit from combined FAK plus RAF-MEK inhibition versus vehicle in additional PDAC cell lines and KPPC GEMMs (Fig. 3F, fig. S3B and C). We next explored the impact of the above treatments on RAS/MAPK/Myc signaling. We performed IHC staining on KPPC tissue from mice treated with the FAKi, RAF-MEKi, or their combination for 14 days (Fig. 3G to I). Combined FAK plus RAF-MEK inhibition decreased PDAC cell proliferation (Fig. 3G) but did not have any statistically significant effect on apoptosis at this time point (fig. S3D), which was consistent with in vitro findings (fig. S2D). In RAF-MEKi-treated mice, we observed decreased pERK activation (Fig. 3H) but no change in Myc expression in PDAC tissues (Fig. 3I). Combined FAK plus RAF-MEK inhibition led to a > 90% reduction in pERK expression (Fig. 3H) and a decrease in Myc expression in CK19+ PDAC cells (Fig. 3I). Reduced pERK in tumor tissue was still observed in the end stage of FAKi plus RAF-MEKi-treated tumors (fig. S3E), suggesting the restored MAPK signaling did not underlie resistance. The impact on Myc by combination treatment, but not by single-agent of FAKi or RAF-MEKi treatment, was different from that in our in vitro observations (Fig. 2E-G), suggesting stromal cell types may play a role in vivo. Taken together, the results demonstrate that combined FAK plus RAF-MEK inhibition exhibits anti-tumor efficacy in PDAC models and has an impact on RAS/MAPK/Myc signaling that is not seen with single-agent FAK inhibition or RAF-MEK inhibition alone.
Figure 3. RAS/MAPK inhibition increased the FAKi response by inhibiting downstream RAS/MAPK signaling.
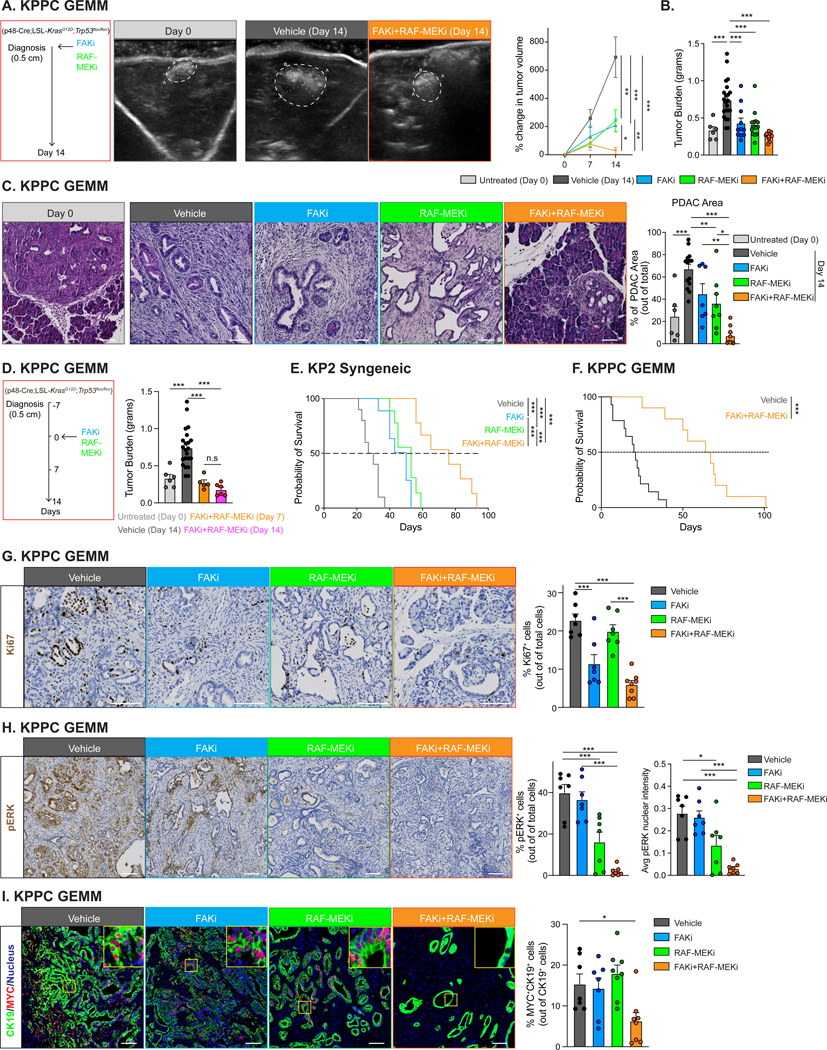
A. KPPC mice were treated with Vehicle, FAKi (75 mg/kg), RAF-MEKi (0.5 mg/kg), or the FAKi and RAF-MEKi combination for 14 days after diagnosis. Representative ultrasound images of tumors on days 0 or 14 from Vehicle and combination groups are shown in the middle panels. The mean percent change in tumor volume on days 7 and 14 from ultrasound measurements is shown on the right (n = 8–13). B. Tumor burden at diagnosis and 14 days after treatment from A is plotted (n=6–22). C. Histological images of KPPC mice from (A) are shown for the indicated treatments. The mean percent of PDAC area in pancreas tissue is plotted on the right (n=6–14). D. KPPC mice were treated with Vehicle for 14 days, or treatment was delayed for 7 days, and then FAKi (75 mg/kg) + RAF-MEKi (0.5 mg/kg) was given for 7 or 14 days until day 14 or 21 after diagnosis. The mean tumor burden is plotted on the right (n=5–22). E. Mice bearing established (approximately 100 mm3) KP2 subcutaneous PDAC tumors were treated with Vehicle, FAKi (75 mg/kg), RAF-MEKi (0.5 mg/kg), or the FAKi plus RAF-MEKi combination. The Kaplan–Meier survival analysis is shown (n = 9–10). F. KPPC mice were treated with the Vehicle or FAKi (75 mg/kg) + RAF-MEKi (0.5 mg/kg) starting at diagnosis, and Kaplan–Meier survival analysis is shown (n = 10–14). G. Representative IHC staining for Ki67 in KPPC mice from (B). The mean percentage of Ki67+ cells is plotted on the right (n=7–8). H. Representative IHC staining for pERK in tissue from (B). The mean percentage of pERK+ cells and mean pERK nuclear intensity are plotted on the right (n=7). I. Representative mpIHC staining for MYC (red) and CK19 (green) in tumors from B is shown. The mean percentage of MYC+ CK19+ cells (among CK19+ cells) is plotted on the right (n=7–8). Graphs show the mean ± SEM; Data were analyzed using one-way ANOVA with Tukey’s multiple comparison correction (A-D and G-I) and Kaplan–Meier (E-F); For A, comparisions among treatment are included; *denotes p < 0.05, **denotes p < 0.01, ***denotes p < 0.001, and n.s denotes not significant. All scale bars are 100 μm.
FAK-activated CAFs drive resistance to RAF-MEK inhibition
The observation that FAKi or RAF-MEKi treatment alone did not impact MYC expression in vivo led us to hypothesize that the tumor stroma might play a role in MYC expression. To understand how the stromal compartment affected RAS/MAPK signaling in PDAC tissue, we first examined the spatial distribution of pERK activation in PDAC cells in KPPC PDAC tissues (Fig. 4A). Even though nearly all PDAC cells in KPPC PDAC tissues harbor the KRASG12D mutation, the amounts of pERK varied widely in CK19+ PDAC cells. When comparing areas of relatively high and low SMA+ CAF density, we observed higher pERK expression where CAFs were more plentiful (Fig. 4A). Consistent with this, we observed phosphorylation of ERK in KP2 PDAC cells when co-cultured with pancreas-derived fibroblasts or incubated with fibroblast-conditioned media (fig. S4A). These data suggest that stromal desmoplasia may regulate the magnitude of RAS/MAPK pathway activation downstream of oncogenic Kras.
Figure 4. FAKi-induced reduction of FGF1 in CAFs improved RAF-MEKi responses to decrease MYC expression in tumor cells.

A. Representative mpIHC staining for pERK (red), SMA (green), and CK19 (light blue) in tumors from KPPC mice treated with Vehicle for 14 days. Scale bars, 50 μm (left and right) and 500 μm (middle). The mean percentage of pERK+CK19+ cells is plotted on the right (n=4) B. Representative IHC staining for SMA of PDAC tissue from KPPC mice treated with Vehicle, FAKi (75 mg/kg), RAF-MEKi (0.5 mg/kg), or the FAKi and RAF-MEKi combination for 14 days. Scale bar, 100 μm. The mean percentage of SMA+ area (out of the whole pancreas tissue) is plotted on the right (n=6–8). C. Trichrome staining of PDAC tissue from treatments in B. Scale bar, 100 μm. The mean percentage of trichrome+ area (out of the whole pancreas tissue) is plotted on the right (n=7–10). D. KP2 cells alone (on the left in the diagram) or co-cultured with fibroblasts (on the right in the diagram) were treated with Vehicle, FAKi (1 μM), RAF-MEKi (100 nM), or the FAKi and RAF-MEKi combination for 48 hours. Immunoblots of MYC, pERK, tERK, pMEK, tMEK, and β-ACTIN (loading control) in KP2 cell lysis from the above groups are shown on the right (n=3). E. KPPC mice were treated with Vehicle for 14 days, or treatment was delayed for 7 days, and then the FAKi (75 mg/kg), RAF-MEKi (0.5 mg/kg) or the FAKi plus RAF-MEKi was given for 14 days until day 21 after diagnosis. CAFs (CD45− CD31− EPCAM− PDPN+) were sorted from each group. UMAP scRNA-seq plots (middle) of the whole CAF population and the distribution of CAF subtypes in Vehicle and the FAKi/RAF-MEKi combination-treated groups are shown on the right. F. Dot plots depicting the relative expressions of Fgf1, Hbegf, and Tgfb 1, 2, and 3 in the whole CAF population across the Vehicle, FAKi, and the combined FAKi and RAF-MEKi treatment groups are shown. The color of each dot indicates the expression amount; the size of the dot indicates the proportion of expressed cells. G. Dot plots depicting the relative Fgf1 expression from the whole CAF, iCAF, and MyCAF populations in Vehicle and the combined FAKi and RAF-MEKi treatment groups are shown. The color of each dot indicates the expression amount; the size of the dot indicates the proportion of expressed cells. H. Fibroblasts alone, incubated with tumor-conditioned media (TCM), or co-cultured with KP2 cells were treated with Vehicle, FAKi (1 μM), RAF-MEKi (100nM), or the FAKi and RAF-MEKi combination for 48 hours. qPCR mRNA expression analysis in fibroblasts from the above groups is shown on the right. Changes in gene expression are depicted as the fold change from the Vehicle baseline (n=3). I. KP2 cells were starved in media without FBS for 12 hours and then treated with Vehicle or murine FGF1 (5 ng) for 3 hours. Immunoblots of pFGFR1, pGSK3β, GSK3β, pAKT, AKT, MYC, pERK, tERK, and β-ACTIN (loading control) are shown on the left. The mean expression of pFGFR1, pGSK3β, pAKT, and MYC normalized to β-ACTIN from replicate experiments is shown on the right (n=3). J. Immunoblots of MYC, pERK, tERK, pMEK, tMEK, and β-ACTIN (loading control) from KP2 cells treated with Vehicle or RAF-MEKi (100 nM) in the presence or absence of murine FGF1 (1 ng) for 24 hours are shown on the left. The mean expression of Myc and pERK normalized to β-ACTIN is shown on the right (n=3). K. KP2 cells were cocultured with fibroblasts and then treated with Vehicle or RAF-MEKi (100 nM) in the presence or absence of FGFR1 inhibitor (1 μM) for 48 hours. Immunoblots of MYC, pERK, tERK, and β-ACTIN (loading control) from KP2 cells are shown on the left. The mean expression of Myc and pERK normalized to β-ACTIN is shown on the right (n=3). L. MTT proliferation assay is shown using KP2 cells treated with Vehicle or RAF-MEKi (100 nM) ± murine FGF1 at indicated doses for 4 days. The mean growth inhibitory rate is plotted (n=3). Graphs show the mean ± SEM; Data were analyzed using one-way ANOVA with Tukey’s multiple comparison correction (B, C, H, and J-L) and two-sided t tests (A, F, G, and I); *denotes p < 0.05, **denotes p < 0.01, ***denotes p < 0.001, and n.s denotes not significant.
Prior studies have shown that FAKi treatment can decrease stroma density in PDAC mouse models(22, 26, 32, 33). These data suggest that FAKi regulation of the stroma could be a factor in improving the response to RAF-MEKi. To investigate this hypothesis, we analyzed the stroma of KPPC PDAC tissue during treatment with either single FAKi or RAF-MEKi agents or the combination (Fig. 4B and C). When analyzing the PDAC tissue areas present in treated mice, we observed that FAKi treatment, both alone or in combination with RAF-MEKi, decreased the number of SMA+ CAFs (Fig. 4B) and collagen density (Fig. 4C). By contrast, RAF-MEKi treatment did not show similar effects. To determine the role of fibroblasts in PDAC cell RAS/MAPK/Myc signaling, we co-cultured KP2 PDAC cells with pancreas-derived fibroblasts with or without treatment with FAKi, RAF-MEKi, or their combination. Co-culture with fibroblasts impaired the ability of the RAF-MEKi to decrease Myc expression in PDAC cells (Fig. 4D, fig. S4B). However, when FAKi treatment was combined with RAF-MEKi treatment, we observed reduced MYC expression in PDAC cells even in the presence of fibroblasts (Fig. 4D, fig. S4B). These data suggest that FAKi could impair the ability of fibroblasts to sustain MYC expression in PDAC cells during RAF-MEKi treatment and that specific fibroblast-secreted factors could be important.
To identify these factors, we next determined how the CAF phenotype was changed by FAKi treatment by performing single-cell RNA sequencing (scRNA-seq). To avoid the impact of changes in the disease stage, we either treated KPPC mice bearing established PDAC tumors (greater than 0.5 cm) with the vehicle for 14 days (typical end-stage timepoint) or waited for 7 days for the tumors to progress further and then started the treatment with FAKi, RAF-MEKi, or their combination (Fig. 4E). Uniform Manifold Approximation and Projection (UMAP) analysis distinguished four major clusters of CAFs (Fig. 4E, fig. S4C). Combined FAK plus RAF-MEK inhibition shifted the CAF phenotype from MyCAF (SMA+) to iCAF (Ly6c+), which agrees with our prior studies of FAKi single-agent treatment(23).
To better understand the phenotype changes in CAFs that might impact RAF-MEKi sensitivity, we identified differentially expressed genes (DEGs) (Table. S1). We observed that FAKi treatment resulted in the downregulation of several growth factors in CAFs, including fibroblast growth factor 1 (Fgf1), Hbegf, and Tgfb1–3 (Fig. 4F). These decreases were also seen in CAFs from mice treated with combined FAK plus RAF-MEK inhibition (Fig. 4F). Gene set enrichment analysis (GSEA) also verified downregulation of growth-related signaling pathways in CAFs from FAKi plus RAF-MEKi treated mice, including PI3K/AKT and MYC (Fig. S4D). Among the observed growth factors decreased in CAFs, FGF1 has been reported to support MYC stability in PDAC tumor cells(34) and was significantly reduced across both MyCAF and iCAF subtypes by treatment (Fig. 4G, fig. S4E). To determine if FAKi treatment could directly decrease FGF1 in CAFs, pancreas fibroblasts were treated with the FAKi or RAF-MEKi or their combination in the presence or absence of tumor-conditioned media (TCM) or in transwell coculture with PDAC cells (Fig. 4H). In all of the conditions, FAKi treatment significantly downregulated Fgf1 expression in fibroblasts (Fig. 4H, p < 0.05 for all comparisons).
To confirm the impact of FGF1 on MYC expression in PDAC cells, we treated PDAC cells with FGF1. We observed the FGF1 increased MYC protein amounts in both murine and human PDAC cells (Fig. 4I, fig. S4F). These changes in MYC protein were accompanied by FGF1-driven activation of the AKT/GSK3β signaling pathway (Fig. 4I, fig. S4F), which has previously been shown to support MYC stability (34). To further determine whether FGF1/FGFR1 was important in RAF-MEKi-induced regulation of MYC expression and resistance, we exposed PDAC cells with both RAF-MEKi and FGF1 and observed adding FGF1 reversed RAF-MEKi-induced MYC suppression (Fig. 4J). Next, we co-cultured KP2 cells with fibroblasts in transwells and treated them with RAF-MEKi. As before, RAF-MEKi did not decrease Myc expression when PDAC cells were cocultured with fibroblasts; however, the addition of FGFR inhibitors overcame this effect and, thus, allowed the RAF-MEKi to suppress MYC in PDAC cells (Fig. 4K). We next sought to determine the impact of FGF1/FGFR on PDAC cell resistance to RAF-MEKi treatment. We found that RAF-MEKi-mediated cell growth inhibition was impaired by adding FGF1 (Fig. 4L, fig. S4G, H). Together, these data suggest that FAKi reprogramming of CAF phenotypes results in loss of FGF1 production and thus overcomes stromal FGF1/FGFR1-mediated RAF-MEKi resistance in PDAC cells.
FAKi and RAF-MEKi cooperate to support anti-tumor immunity
Previous studies have implicated the immune-modulating activity of FAKi and RAF-MEKi as single agents(22, 23, 35, 36). Thus, we sought to understand the impact of combined FAK plus RAF-MEK inhibition on immune cells. To determine the role of T cells in FAKi plus RAF-MEKi-induced tumor control, PDAC-bearing mice depleted of CD4/CD8 IgGs were treated with FAKi plus RAF-MEKi. As expected, combined FAK plus RAF-MEK inhibition led to tumor progression control, but in the absence of CD4+ and CD8+ T cells, the extent of tumor control was much more limited (Fig. 5A), suggesting that T cell activity may be important for the durability of tumor control. To test this speculation, we stopped the FAKi and RAF-MEKi combination on day 14 and conducted a survival analysis. We observed that in the absence of T cells, long-term disease control by combined FAK plus RAF-MEK inhibition was not durable (Fig. 5A). To further confirm the functional contribution of tumor antigen-specific CD8+ T cells, either KP2 cells or KP2-OVA cells were implanted and then treated with the FAKi and RAF-MEKi combination. In KP2-tumor-bearing mice, we observed a delay of tumor growth but without tumor regression. In contrast, FAKi plus RAF-MEKi treatment uniformly induced tumor regression by day 14 in KP2-OVA-bearing mice (Fig. 5B), suggesting an important role of tumor-specific T cells.
Figure 5. CD8+ T cells contribute to the anti-tumor efficacy of FAKi plus RAF-MEKi treatment.

A. Mice bearing established (approximately 150 mm3) KP2-OVA subcutaneous PDAC tumors were treated with Vehicle, the FAKi (75 mg/kg) and RAF-MEKi (0.5 mg/kg) combination ± αCD4/CD8. The last doses of FAKi and RAF-MEKi were administrated on day 14. αCD4/CD8 was given for 7 doses in total. The tumor growth curve for 16 days is shown on the left. Kaplan–Meier survival analyses are depicted (n = 10). B. The percent change of tumor volume of KP2 (left) or KP2-OVA (right) subcutaneous PDAC mouse models treated with Vehicle or the FAKi (75 mg/kg) and RAF-MEKi (0.5 mg/kg) combination on day 14 (n=8–10). C. KPPC mice were treated with Vehicle for 14 days, or treatment was delayed for 7 days, and then the FAKi (75 mg/kg) and RAF-MEKi (0.5 mg/kg) combination was given for 14 days until day 21 after diagnosis. Immune cells (CD45+CD31−EPCAM− PDPN-) were sorted from each group. UMAP scRNA-seq plots (middle) of the immune cell population and the distribution of immune cell subtypes are shown on the right. D. Representative IHC staining for F4/80 of PDAC tissue from KPPC mice treated with Vehicle or the FAKi (75 mg/kg) and RAF-MEKi (0.5 mg/kg) combination for 14 days. Scale bar, 100 μm. The mean percentage of F4/80+ cells is plotted on the right (n=6–8). E. UMAP scRNA-seq plot (left) of the TAM/Mo population and GSEA-identified pathway enrichment (right) in the TAM/Mo population after FAKi plus RAF-MEKi combination treatment, compared to the Vehicle group are depicted. F. UMAP scRNA-seq plot (left) of the cDC population and GSEA-identified pathway enrichment (right) in the cDC population after FAKi plus RAF-MEKi combination treatment, compared to the Vehicle group are shown. G. UMAP scRNA-seq plot (left) of T, B, and NK cell populations and GSEA-identified pathway enrichment (middle) in the CD8+ T cell after FAKi plus RAF-MEKi combination treatment, compared to the Vehicle group are depicted. A dot plot analysis (right) of relative Tox expression in CD8+ T cells from Vehicle and the FAKi plus RAF-MEKi combination groups is shown on the right. The color of each dot indicates the expression amount; the size of the dot indicates the proportion of expressed cells. H. Syngeneic KP2-OVA orthotopic model treated with Vehicle or the FAKi (75 mg/kg) and RAF-MEKi (0.5 mg/kg) combination for 10 days. The tumor burden from the above groups is shown. I. The mean frequencies of Dex+CD8+ T cells, proliferative CD8+ T cells, and GZMB+Ki67+CD8+ T cells in tumor-dLNs are plotted (n=6–7). J. The mean frequencies of Dex+CD8+ T cells, proliferative Dex+CD8+ T cells, CD44+Ki67+CD8+T cells, TOX+PD1+CD8+ T cells, and the ratio of Th cells to Tregs in tumor tissue are shown (n=6–8). Graphs show the mean ± SEM; Data were analyzed using one-way ANOVA with Tukey’s multiple comparison correction (A, left), Two-sided t tests (B, D-J), and Kaplan–Meier (A, right); *denotes p < 0.05, **denotes p < 0.01, and ***denotes p < 0.001, and n.s denotes not significant.
We next sought to further understand changes in tumor immunity triggered by FAKi plus RAF-MEKi combination therapy. Analysis of the T cell number in KPPC tumor tissue after FAKi plus RAF-MEKi treatment showed no increase in CD4+ and CD8+ T cells (fig. S5A and B), suggesting that T cell function might be impacted by the dual inhibition. To study this, we performed scRNA-seq on CD45+ cells isolated from KPPC PDAC tissue from mice with FAKi plus RAF-MEKi treatment, for which we analyzed the CAF phenotype (Fig. 4E). UMAP analysis distinguished 19 clusters in CD45+ cells (Fig. 5C, fig. S5C). Among the immune cells, the myeloid cell proportion, including tumor-associated macrophages (TAMs), monocytes, and granulocytes, was reduced by combined FAK plus RAF-MEK inhibition (Fig. 5C). In contrast, the adaptive cell proportion, including B cells and T cells, was enhanced in the combination-treated group (Fig. 5C). IHC staining of F4/80 in KPPC tumor tissue exhibited a decreased number of TAMs after FAKi plus RAF-MEKi treatment (Fig. 5D), confirming the inhibition of TAM infiltration by FAKi plus RAF-MEKi treatment. When examining the phenotype of TAMs (Fig. 5E), after reclustering of the TAM and monocyte (TAM/Mo) cluster from scRNA-seq, GSEA of the total TAM/Mo population showed either single-agent FAKi or RAF-MEKi or combination treatment uniformly downregulated inflammatory signatures, such as NFκb/TNFα, but increased the anti-tumor signature, including interferon (IFN)α/γ responses were found in all treatment groups (Fig. 5E, fig. S5D). In classic dendritic cells (cDCs), both increased interferon (IFN)α/γ responses and MHC pathway were found in PDAC tissues treated with combined FAK plus RAF-MEK inhibition (Fig. 5F, fig. S5E, and F). As cDCs produced the most MHC-I signals (fig. S5G), which could be received by T cells, we next determined MHC-1/TCR engagement between cDCs and T cells and found that MHC-1/TCR interaction between cDCs and CD8+T cells was improved in FAKi plus RAF-MEKi- treated group (fig. S5H). These data suggested that combined FAK plus RAF-MEK inhibition induced the anti-tumor phenotype of myeloid cells. Next, we analyzed the CD8+ T cell phenotype by GSEA after FAKi plus RAF-MEKi treatment (Fig. 5G) and observed the enrichment of genes in the IFNα, IFNγ, and MYC signaling pathways, which have been reported to support T cell survival and function(37, 38). Expression of the exhausted T cell phenotype marker, TOX, on CD8+ T cells was downregulated by combination treatment (Fig. 5G), indicating that combined FAK plus RAF-MEK inhibition could improve the anti-tumor function of CD8+ T cells.
We then examined how the combination improved CD8+ T cell function in detail. RAF-MEKi treatment alone was able to upregulate IFNα/γ responses in CD8+ T cells but decreased the MYC signature (fig. S5I), indicating that RAF-MEKi targeting of CD8+ T cells could induce anti-tumor immune responses but may also negatively regulate CD8+ T cell survival. When combined with FAKi treatment, FAKi overcame RAF-MEKi-mediated Myc signature reduction and maintained the upregulated IFN responses (fig. S5J), suggesting that the FAKi and RAF-MEKi combination could restrain anti-tumor immunity and rescue T cell survival (fig. S5J and K). Next, to understand how combined FAK plus RAF-MEK inhibition might impact T cell priming and function, we analyzed tumor antigen-specific CD8+ T cells in orthotopic KP2-OVA-bearing mice. As expected, the combination of FAKi and RAF-MEKi treatment suppressed tumor burden (Fig. 5H), which was verified in multiple PDAC models (Fig. 3). We found an increased proportion of OVA-dextramer+ cytotoxic T cells (CTLs) in tumor-draining lymph nodes (dLNs) and PDAC tissues (Fig. 5I and J). In agreement with the scRNA-seq analysis, more proliferative and functional CD8+ T cells, but fewer exhausted CD8+ T cells expressing TOX, higher ratio of T helper (Th) cells to T regulatory cells (Tregs), and decreased Tregs proportion were found in the combination-treated tissue (Fig. 5I, J and fig. S5L). Together, these data suggest that FAKi plus RAF-MEKi treatment induces anti-tumor immunity in PDAC.
FAKi combined with RAF-MEKi treatment improves the chemotherapy response in PDAC
Chemotherapy is the standard therapy for PDAC, but many factors drive chemotherapy resistance. To assess this issue, KP2 PDAC cells were treated with gemcitabine (GEM) in vitro, and RNA-seq analysis was performed. As expected, we found upregulated cell cycle checkpoint signatures, but we also observed increases in KRAS and MYC signatures, which may contribute to resistance (Fig. 6A). Given that the FAKi and RAF-MEKi combination was able to downregulate the RAS/MAPK/Myc signaling pathway, we hypothesized that FAK plus RAF-MEK inhibition might synergize with chemotherapy.
Figure 6. DNA damaging therapies cooperate with FAKi and RAF-MEKi treatment to increase anti-tumor regulation.

A. GSEA identified pathway enrichment in KP2 organoids treated with GEM (0.1 μM) for 24 hours, compared with that in the Vehicle group (n=3). B. An MTT proliferation assay quantification is shown using KP2 cells treated with Vehicle or the FAKi (1 μM) and RAF-MEKi (100 nM) combination ± different doses of GEM. The mean MTT optical density (left) and the mean values of Annexin V luminescence from the above groups at indicated time points are plotted (right) (n=3). C. GSEA identified pathway enrichment in GEM (0.1 μM) + FAKi (1 μM) + RAF-MEKi (100 nM)-treated KP2 organoids, compared with those treated with GEM (0.1 μM) (p < 0.05) (n=3). D. qPCR mRNA expression analysis is shown of KP2 organoids treated with stimulation from panel (B) for 24 hours. Changes in gene expression are plotted as the fold change compared with that in the Vehicle group (n=3). E. Mice bearing established (approximately200 mm3) KP2-OVA subcutaneous PDAC tumors were treated with Vehicle or FAKi (50 mg/kg)+RAF-MEKi (0.3 mg/kg) combination, GEM (75 mg/kg) + PTX (5 mg/kg) ± FAKi/RAF-MEKi combination. The last doses of FAKi and RAF-MEKi were administrated on day 44. GEM + PTX was given for 4 doses in total. The percentage of tumor volume from each mouse on day 14 (middle) and Kaplan–Meier survival analyses (right, n = 8–12) are depicted. F. Tumor burden in KPPC mice treated with Vehicle, FAKi (75 mg/kg) + RAF-MEKi (0.5 mg/kg) or GEM (75 mg/kg) + PTX (5 mg/kg) ± FAKi + RAF-MEKi combination for 14 days is plotted (n=6–22). G. Mice bearing established KP2-mCherry liver metastasis using the hemispleen model were treated with Vehicle, GEM (75 mg/kg) + PTX (5 mg/kg) ± FAKi, MEKi, or FAKi plus RAF-MEKi combination for 14 days. Histological images of liver metastasis (outlined in green) in the liver (outlined in yellow) from the above groups, Scale bar, 1 cm. The mean percentage of liver metastasis area in liver tissue is plotted on the right (n=8–9). H. Syngeneic KP2-OVA orthotopic model treated with Vehicle, FAKi (75 mg/kg) + RAF-MEKi (0.5 mg/kg), or GEM (75 mg/kg) + PTX (5 mg/kg) ± FAKi plus RAF-MEKi combination for 10 days. The mean frequencies of Ki67+CD8+ T cells, proliferative Dex+ CD8+ T cells, and GZMB+CD8+ T cells in tumor tissue are shown (n=6–8). I. The mean frequencies of Dex+CD8+ T cells, proliferative CD8+T cells, Ki67+ Dex+CD8+ T cells, and GZMB+Ki67+CD8+ T cells in tumor-dLNs are depicted (n=6–7). (J). Mice bearing established (approximately 200 mm3) KP2-OVA subcutaneous PDAC tumors were treated with Vehicle, GEM (75 mg/kg) + PTX(5 mg/kg) ± FAKi (50 mg/kg) + RAF-MEKi (0.3 mg/kg), or GEM + PTX + αPD-1 + αCTLA-4 ± FAKi + RAF-MEKi. The last dose of RAF-MEKi was administrated on day 14. The last FAKi and αPD-1 doses were administrated on day 40. GEM/PTX and αCTLA4 were given 4 doses in total. The percentage of tumor volume in each mouse (middle) in the above mice on day 16 (n=6–13). (K) Kaplan–Meier survival analyses is shown(n = 5–10). Graphs show the mean ± SEM; Data were analyzed using one-way ANOVA with Tukey’s multiple comparison correction (B, D, E, middle, F-J, middle), Two-sided t tests (A and C), and Kaplan–Meier (E, right and J, right) *denotes p < 0.05, **denotes p < 0.01, and ***denotes p < 0.001, and n.s denotes not significant.
Next, we sought to test the combination of chemotherapy with FAK plus RAF-MEK inhibition. In KP2 PDAC cells in vitro, we noted that whereas FAK plus RAF-MEK inhibition or chemotherapy led to modest cell death, combination treatment led to significant PDAC cell death and enhanced apoptosis (Fig. 6B, fig. S6A, p<0.05). PDAC cell apoptosis was also observed with FAK plus RAF-MEK inhibition combined with other chemotherapies, such as 5FU, SN38, and oxaliplatin (fig. S6B). We also observed that FAKi combined with RAF-MEKi treatment reversed the upregulation of RAS/MAPK/Myc signatures (Fig. 6C) and Myc gene expression (Fig. 6D) observed following GEM treatment. Pharmacologic inhibition of Myc by APTO-253 or 10058-F4 enhanced the growth-restraining effects of chemotherapy on in vitro cultured KP2 cells but did not improve cell killing by FAKi plus RAF-MEKi in combination with chemotherapy (fig. S6C). These data demonstrated that FAKi plus RAF-MEKi regulation of MYC is critical in part to improving chemotherapy response in vitro. To determine the efficacy of this combination in vivo, we treated PDAC-bearing mice (KP2-OVA and KP2) with GEM plus paclitaxel as a surrogate for nab-paclitaxel (GEM/PTX, Fig. 6E, fig. S6D). GEM/PTX only modestly delayed tumor progression. As before, FAKi and RAF-MEKi combined treatment decreased tumor growth (Fig. 6E); however, when GEM/PTX was combined with FAKi and RAF-MEKi treatment, we observed tumor regression, comparing to vehicle (Fig. 6E, fig. S6D, p<0.05 for all the comparisons), which led to enhanced overall survival (Fig. 6E). We also observed better tumor burden control by FAK plus RAF-MEK inhibition plus chemotherapy in additional PDAC cell lines (fig. S6E) and KPPC mice (Fig. 6F) compared to that obtained with single therapies. Greater than half of patients with PDAC have metastatic disease at the time of diagnosis, and the liver is the most frequent site of metastatic spread. Consequently, we explored the effects of combining FAK plus RAF-MEK inhibition with chemotherapy in liver metastasis models. We first established metastatic tumors using hemispleen injection of KP2 PDAC cells and analyzed the effects of treatment. We observed greater than 90% reduction in metastatic tumor burden when chemotherapy was combined with FAK plus RAF-MEK inhibition, compared to vehicle group (Fig. 6G).
Next, we sought to determine how this combination might impact T cell priming by analyzing tumor antigen-specific CD8+ T cells in orthotopic KP2-OVA-bearing mice. We observed that combining FAK plus RAF-MEK inhibition with chemotherapy increased tumor-specific OVA-dextramer+ CD8+ T cells in PDAC-dLNs and tumor tissue (Fig. 6H and I). Additionally, the combination increased proliferation and granzyme+ CD8+ effectors in lymph nodes (dLNs) and tumor tissue (Fig. 6H and I).
We next sought to determine whether FAK plus RAF-MEK inhibition combined with chemotherapy could increase the immunotherapeutic response in our models. To this end, we treated PDAC-bearing mice with FAK and RAF-MEK inhibitors plus chemotherapy with or without αPD1 and αCTLA4 IgGs (Fig. 6J and K). To ensure tolerability of the combination, chemo- and immunotherapy were not administered concurrently with FAKi and RAF-MEKi throughout the study, and the treatment scheme is shown in Figure 6J. As before, FAK plus RAF-MEK inhibition with GEM/PTX led to tumor regression and improved survival (Fig. 6J and K). The addition of immune checkpoint blockade deepened short-term tumor regression and, more importantly, led to prolonged long-term survival (Fig. 6J and K). Taken together, these data suggest that FAK plus RAF-MEK inhibition improved the response to chemotherapy in our models.
Discussion
Many studies focused on tumor-intrinsic resistance factors driven RAS/MAPK inhibition resistance(12, 39). Nonetheless, tumor-extrinsic factors from stroma could impair response to RAS/MAPK inhibition (17). CAF-conditioned media could activate the RAS/MAPK pathway and STAT3 in both proliferative and EMT+ PDAC cells(40). Cancer cell-secreted TGFβ1 induced CAF THBS2 expression, which activated the RAS/MAPK pathway in PDAC cells through integrin αvβ3/CD36 (41). Additionally, CAF-secreted FGF1 was reported to increase the stability of Myc in PDAC cells, which is downstream of the RAS/MAPK signaling pathway(34). The tumor stroma is also involved in the resistance to MAPK inhibition(18). It was reported that ERK or BRAF inhibitors increased the production of Type I collagen deposition, blunting these inhibitors’ efficacy(42). Therefore, regulating the PDAC stroma could improve the RAS/MAPKi -mediated anti-tumor response.
The combination of FAKi and RAF-MEKi treatment also impacted the immune compartments, including increased T cell priming and function in tumor tissue. However, IHC staining showed no increase in CD8+ T cell number in tumor tissue. RAF-MEKi treatment alone induced an IFN response, but a previous study showed that MEKi treatment combined with immunotherapy did not show any compelling tumor response rates in patients with biliary tract cancers(43). Compared with PD-L1 inhibition, adding a MEKi decreased the objective response rates in patients with NRAS mutant melanoma(44), suggesting that RAS/MAPK pathway inhibition might impair T cell function. After MEKi treatment, circulating T cells typically have a low frequency of tumor antigen-specific clones(4). In lung cancer, a short period of MEKi treatment increased effector T cell priming. However, compared with continuous MEKi treatment, pulsatile MEKi treatment increased expression of the exhausted phenotype markers CTLA4 and PD-1 in tumor-infiltrated T cells(45), indicating the complicated role of the RAS/MAPK pathway in T cell function. In this study, we observed that RAF-MEK inhibition increased the IFN response across most immune cell subtypes, whereas in CD8+ T cells, the Myc signature was decreased by RAF-MEKi treatment, which supports T cell survival and function(46). Myc is an essential factor that provides proliferative and pro-survival signals upon the engagement of T cell receptors and cytokine IL-2-mediated signaling(47, 48). Myc controls metabolic reprogramming in T lymphocyte activation(49). Combined FAKi with RAF-MEKi was able to overcome the Myc loss in T cells induced by RAF-MEKi treatment and to maintain hyperactivation of IFN response pathways. However, we still found no increase in the T cell number in the combination group. To further enhance T cell immunity, methods such as inducing T cell activation to improve the immune response in the context of FAKi and RAF-MEKi treatment remain worth exploring in future studies.
Compared with adaptive immune cells, myeloid cells expressed a higher RAS/MAPK signature. We found that FAKi plus RAF-MEKi decreased the infiltration of myeloid cells and affected their phenotype. In the TAM/Mo and DC analysis, we did not observe a shift of sub-clusters induced by FAKi and RAF-MEKi treatment, but their phenotype was uniformly regulated toward upregulation of the IFNα/γ response and downregulation of NFκb/TNFα and other inflammatory signaling molecules. Additionally, this regulation was also found in either the FAKi or RAF-MEKi single-agent or the combination group, suggesting amplified myeloid cell function may increase the response to FAKi and RAF-MEKi treatment. A previous study showed that in melanoma when tumors relapse after MAPK inhibition treatment, they are cross-resistant to immunotherapy. MAPK inhibition administration resulted in a lack of functional CD103+ DCs, precluding an effective T cell response(50). Restoring the numbers and functionality of DCs can re-sensitize MAPK inhibition to immunotherapy. Reprogramming innate immune cells to improve FAKi and RAF-MEKi efficiency is needed in future studies.
It was striking that whereas the combination of RAF-MEKi + FAKi induced tumor stasis in most mice, the combination of RAF-MEKi + FAKi with GEM/PTX induced tumor regression in all mice and resulted in a substantial decrease in liver metastasis. Furthermore, the quadruplet of GEM/PTX with FAK and RAF-MEK inhibition was more effective than the triplets of GEM/PTX with FAK or RAF-MEK inhibitor alone. Based on these observations, a clinical trial with the combination of avutometinib (RAF-MEKi) + defactinib (FAKi) + gemcitabine/nab-paclitaxel in patients with previously untreated metastatic pancreatic cancer was initiated and has shown promising early clinical activity (RAMP 205; NCT05669482) (51). We also observed that the preclinical efficacy of chemotherapy with FAKi + RAF-MEKi combination was further enhanced by adding immunotherapy.
Our study has several limitations. Although we confirmed the efficacy of FAK and RAF-MEK inhibition using multiple PDAC mouse models, further validation in human samples or patient-derived organoids is required for clinical translation. While combined chemotherapy with FAK and RAF-MEK inhibitors showed improved tumor control, the underlying mechanisms of this regulation remain to be elucidated. Additionally, it is necessary to investigate further biomarkers from the clinical trial (NCT05669482) involving these patients.
In summary, our data revealed that FAK inhibition reprograms CAFs to overcome RAF-MEK inhibition resistance by further suppressing MAPK/MYC signaling. This combination notably enhanced cytotoxic therapy efficacy in both primary and metastatic PDAC. Thus, treatment strategies targeting the extrinsic factors from tumor stroma could improve responses to PDAC therapies, laying a solid foundation for upcoming clinical trials for PDAC patients.
Materials and Methods
Study design
This study was designed to elucidate the mechanisms through which FAK and RAF-MEK inhibition affect both tumor cells and the TME. We utilized several well-established PDAC models to assess the impact of combined FAK plus RAF-MEK inhibition on tumor progression and metastasis. Techniques such as conventional histology, IHC, flow cytometry, RNA-seq, and scRNA-seq were employed to thoroughly analyze treatment effects. Human tumor biopsy sections were sourced from a Phase 1 first-in-human clinical trial (NCT201510157). All animal experiments were conducted with approval from the Washington University School of Medicine Institutional Animal Studies Committee. The treatment conditions were known to the investigators, and sample sizes, indicated in the respective figure legends, were calculated to ensure a minimum power of 95%. All in vitro experiments were replicated at least three times independently, with no data excluded from the analyses.
Human tumor tissue
Human tumor biopsy sections from the Phase 1 first-in-human clinical trial evaluating defactinib combined with pembrolizumab and GEM in patients with advanced tumors (NCT201510157) were used(29). After acquiring informed consent, core tissue biopsies were obtained pre- and post-therapy from 10 patients.
Genetic mouse PDAC model and other mouse models
KPC (p48-Cre; LSL-KrasG12D/wt; p53Flox/+) and KPPC (p48-Cre; LSL-KrasG12D/wt; p53Flox/Flox) mice were bred in-house, KPC/KPPC mice were backcrossed with C57BL/6 mice over six generations and validated as C57BL/6 congenic through single-nucleotide polymorphism scanning. Mice were maintained in the Washington University Laboratory for Animal Care barrier facility, and all studies involving animals were approved by the Washington University School of Medicine Institutional Animal Studies Committee.
Syngeneic model and preclinical animal cohorts
Age-matched 6 to 8-week-old female C57BL/6 mice were used to generate orthotopic/transplantable mouse models. Syngeneic PDAC tumors were established by surgical implantation, as previously described(22). For the orthotopic model, approximately KP2-OVA (200,000) cells in 50 μL of Cultrex contained 90% Cultrex (Trevigen) and 10% DMEM/F-12 (Thermo Fisher Scientific) were injected into the pancreas of sex-matched C57BL/6 mice as previously described(52). Cohorts of mice were randomized into different treatment groups by gross palpation of tumors in the pancreas. In the subcutaneous PDAC models, KP2 (250,000) or KP2-OVA (250,000) cells in 50 μL of Cultrex (Trevigen) contained 90% Cultrex and 10% DMEM/F-12 (Thermo Fisher Scientific), 7940B.PDA cells or 2838c3 cells (1,000,000) in 150 μL phosphate-buffered saline (PBS) were injected into each mouse’s back flank. Cohorts of mice were randomized into different treatment groups by tumor volume according to external caliper measurements. Mice were maintained within the Washington University Laboratory for Animal Care barrier facility. All studies involving animals were approved by the Washington University School of Medicine Institutional Animal Studies Committee.
Liver metastasis model
Age-matched 6 to 8-week-old female C57BL/6 mice were used to generate Hemispleen mouse models. The hemispleen model was established by surgical implantation, as previously described (53). For hemispleen model, 500,000 KP2-machinery cells in 100 μL of phosphate-buffered saline were injected into the spleen of C57BL/ 6 mice using a Hamilton 30G syringe. Metastatic tumor burden was measured by histological interrogation.
Mouse tissue isolation and flow cytometry
Following tissue digestion, single-cell suspensions were resuspended in flow cytometry buffer (PBS containing 1% bovine serum albumin, BSA), and FcRs were blocked with rat α-mouse CD16/CD32 antibodies (Ebioscience) for 10 min and pelleted by centrifugation. Where applicable, CD8+ T cells specific for the antigen OVA were labeled by incubating cell suspension with H2Kb::SIINFEKL-specific MHC-I dextramer for 10 min at room temperature prior to extracellular staining. Single cells were subsequently labeled with 100 μL of fluorophore-conjugated α-mouse extracellular antibodies at recommended dilutions for 25 min on ice. Staining for intracellular markers was conducted subsequently using the EBioscience Transcription Factor Staining buffer set, according to the manufacturer’s instructions. All antibodies are listed in the Supplementary materials and methods Resources. Data were acquired using a Cytek Aurora and analyzed using FlowJo software (v10).
Statistical analysis
All statistical analyses were performed using Prism software (GraphPad), with input from a Biostatistics Core expert at Washington University. All data are representative of at least two independent experiments unless specifically noted. The sample size was precalculated to satisfy power requirements (with > 85% confidence) in most experiments and is specified in the figure legends where applicable. To accomplish randomization for orthotopic or syngeneic tumor experiments, animals were sorted by a blinded investigator in ascending order according to tumor size, and then the groups were assigned in descending order. Each group was examined post hoc to verify that there was no significant difference in the average starting tumor size. Data are shown as the mean ± SEM unless otherwise noted. Statistical tests such as the unpaired parametric Student’s t-test, One-way ANOVA, one-sample t-test, and Wilcoxon test were used based on the normality of the data. For survival analyses, the log-rank (Mantel-Cox) test was used. A value of p < 0.05 was considered statistically significant for all studies, which is also seen in each figure legend.
Supplementary Material
Sup Fig. 1 RAS/MAPK activation in FAKi-treated PDAC tumors.
A. KPPC mice treated with the Vehicle or FAKi (75 mg/kg) from tumor diagnosis for 14 days. Representative IHC staining for pFAK1 in PDAC tissue is shown (left). Scale bar, 100 μm. The percentage of pFAK1+ cells is plotted on the right (n=8). B. Representative IHC staining for pPYK2 in PDAC tissue with treatment in A is shown (left). Scale bar, 100 μm. The percentage of pPYK2+ cells is plotted on the right (n=8). C. Single pERK, CK19, and SMA staining in KPPC mice from Figure 1B, and merged staining are shown (left). Scale bar, 100 μm. The percentage of pERK+ SMA+ cells is plotted on the right (n=7). Tumor burden from the above two groups is shown (n=14–18) (bottom). D. Immunoblots of pERK, tERK, and β-ACTIN (loading control) from KP2 cells treated with Vehicle or FAKi (1 μM) for 48 hours. The mean expression of pERK normalized to tERK from replicate experiments is shown (n=3). E. GSEA identified pathway enrichment in KP2 organoids treated with FAKi (1 μM) for 24 hours, compared with that in the Vehicle group (n=3). F. Single staining of pERK and CK19 in PDAC biopsies from Figure 1C. Proportion of pERK+ cells in paired pre- and post-treatment tissue. Red lines represent the increase of pERK+ cells in the post-treatment group (n=10). Grey lines represent the decrease. Graphs show the mean ± SEM; Data were analyzed using two-sided t-tests (A-E) and paired t test (F); *denotes p < 0.05, **denotes p < 0.01, ***denotes p < 0.001, and n.s denotes not significant.
Sup Fig. 6. DNA damaging therapies cooperate with FAKi and RAF-MEKi treatment to increase the anti-tumor effects.
A. The mean percentage change in MTT optical density and the mean values of PI fluorescence from KP2 cells exposed to different treatments in Figure 6B at indicated time points are depicted (n=3). B. MTT proliferation assay using KP2 cells treated with DMSO, APTO-253(5 μM), 10058-F4(5 μM), GEM at different doses, GEM + FAKi (1 μM) + RAF-MEKi (100 nM) ± APTO-253 (5 μM) or 10058-F4(5 μM). The mean percentage change in MTT optical density from the above groups on day 3 is depicted (n=3). C. KP2 cells were treated with DMSO, FAKi (1 μM) + RAF-MEKi (100 nM) ± 5Fu (10 μM, Upper), SN38 (10 μM, Middle), or oxaliplatin (10 μM, bottom). The mean values of Annexin V luminescence and PI fluorescence from the above groups at indicated time points are depicted (n=3). D. Mice bearing established (~100mm3) KP2 subcutaneous PDAC tumors were treated with Vehicle, FAKi (75 mg/kg)/RAF-MEKi (0.5 mg/kg) combination, or the FAKi/RAF-MEKi combination ± GEM (75 mg/kg) + PTX (5 mg/kg). The mean percentage of tumor volume on day 14 is depicted (n=6–10). E. The mean percentage of tumor volume from the 1e6 2838c3 cells subcutaneous PDAC model treated with Vehicle or FAKi (75 mg/kg, BID during weekdays; daily on weekends) + RAF-MEKi (0.5 mg/kg) ± GEM (120 mg/kg) + PTX (15 mg/kg) on day 18 (n=9–10). Graphs show the mean ± SEM; Data were analyzed using one-way ANOVA with Tukey’s multiple comparison correction (A-C) and Kaplan–Meier (D, E); *denotes p < 0.05, **denotes p < 0.01, and ***denotes p < 0.001.
Sup Fig. 5. CD8+ T cells contribute to the anti-tumor efficacy of FAKi plus RAF-MEKi treatment.
A. Representative IHC staining for CD4 in KPPC tissue treated with Vehicle, FAKi (75 mg/kg), RAF-MEKi (0.5 mg/kg), or FAKi/RAF-MEKi combination for 14 days. Scale bar, 100 μm. The mean percentages of CD4+ T cells in the tumor nest are shown (n=7–8). B. Representative IHC staining for CD8α in KPPC tissue treated with Vehicle, FAKi (75 mg/kg), RAF-MEKi (0.5 mg/kg), or FAKi/RAF-MEKi combination for 14 days. Scale bar, 100 μm. The mean percentages of CD8+ T cells in the tumor nest are shown (n=6–8). C. Heatmap depicting the top 10 genes in the immune cell population from Figure 5C. D. GSEA identified pathway enrichment in the TAMs/Mo population in FAKi-, RAF-MEKi- and FAKi plus RAF-MEKi combination-treated KPPC tissue, compared to the Vehicle group. E. GSEA identified pathway enrichment in the DC population in FAKi-, RAF-MEKi- and FAKi plus RAF-MEKi combination-treated KPPC tissue, compared to the Vehicle group. F. GSEA identified pathway enrichment in the DC population in FAKi plus RAF-MEKi combination-treated KPPC tissue, compared to the Vehicle group. G. Dot plots depicting the relative MHC-related gene expression from the CAF, cDCs, TAMs, and T cell populations in Vehicle and the combined FAKi and RAF-MEKi treatment groups (The color of each dot indicates the expression amount the size of the dot indicates the proportion of expressed cells). H. Heat maps displaying relative importance of network centrality measures for sender (ligand signals) and receiver (receptors) across cDCs and T cells for MHC-1 signaling pathway networks from cell chat analysis(5). I. GSEA identified pathway enrichment in the CD8+T cell population in RAF-MEKi-treated KPPC tissue, compared to the Vehicle group. J. GSEA identified pathway enrichment in the CD8+T cell population in the FAKi and RAF-MEKi combination-treated KPPC tissue, compared to the RAF-MEKi-treated group. K. GSEA identified pathway enrichment in the CD8+T cell population in FAKi-, RAF-MEKi-, and FAKi plus RAF-MEKi-treated KPPC tissue, compared to the Vehicle group. L. The mean frequency of Tregs in tumor tissue from Figure 5J is depicted (n=6–8). Data were analyzed using one-way ANOVA with Tukey’s multiple comparison correction (A-E). Graphs show the mean ± SEM; Data were analyzed using two-sided t-tests (D-F, I-L) and one-way ANOVA with Tukey’s multiple comparison correction (A, B); *denotes p < 0.05, **denotes p < 0.01, ***denotes p < 0.001, and n.s denotes not significant.
Sup Fig. 3. FAKi combined with RAF-MEKi treatment inhibited tumor progression.
A. Histological images of KPPC mice according to the treatments in Figure 3C. Scale bar, 5 mm. The tumor grading in these groups is shown (n = 6–14). B. Mice bearing established 1e6 7940B.PDA subcutaneous PDAC tumors were treated with Vehicle, RAF-MEKi (0.5mg/kg for 4 weeks) and FAKi (75mg/kg, BID, weekdays; daily on weekends) + RAF-MEKi until mice were euthanized. Overall survival from the above mice (n=10). C. Mice bearing established (~200 mm3) KP2-OVA subcutaneous PDAC tumors were treated with Vehicle, FAKi (50 mg/kg), RAF-MEKi (0.3 mg/kg), or the FAKi/RAF-MEKi combination. The Kaplan–Meier survival analysis is shown (n = 8–10). D. Representative IHC staining for cleaved caspase 3 (CC3) in KPPC mice treated with Vehicle or FAKi (75 mg/kg)/RAF-MEKi (0.5 mg/kg) combination for 14 days. Scale bar, 500 μm. The mean percentage of CC3+ cells is depicted (n=12–14). E. Representative IHC staining for pERK in KPPC mice treated with Vehicle or FAKi (75 mg/kg)/RAF-MEKi (0.5 mg/kg) combination until the end stage. Scale bar, 500 μm. The mean percentage of pERK+ cells is depicted (n=6–8). Graphs show the mean ± SEM; Data were analyzed using Kaplan–Meier (B, C) and two-sided t-tests (D, E); *denotes p < 0.05, **denotes p < 0.01, and ***denotes p < 0.001, and n.s denotes not significant.
Sup Fig. 4. FAKi-induced reduction of FGF1 in CAFs synergized with RAF-MEKi treatment to decrease Myc expression in tumor cells.
A. KP2 cells were co-cultured with fibroblasts or incubated with fibroblasts-conditioned media (CM) for 48 hours. Immunoblots for pERK, tERK, and β-ACTIN (loading control) are shown. The mean expression of pERK normalized to β-ACTIN from replicate experiments is shown (n=3). B. The mean expression of Myc normalized to β-ACTIN and pERK normalized to tERK from replicate experiments in Figure 4D is depicted as the fold change from the Vehicle baseline (n=3). C. Heatmap showing the top 10 genes in the CAF subpopulations from Figure 4E. D. Waterfall plot of the top 25 up-and down-regulated genes induced by the combination of FAKi and RAF-MEKi in CAFs, compared to the Vehicle group (above). GSEA identified pathway enrichment in all CAF populations induced by the FAKi and RAF-MEKi combination, compared to the Vehicle group (bottom). E. Vlnplot depicting the relative Fgf1 expression in CAF subtypes from 4E. F. Panc-1 cells were starved in media without FBS for 12 hours and then treated with Vehicle or human FGF1 (5 ng) for 3 hours. Immunoblots of pFGFR1, pGSK3β, GSK3β, pAKT, AKT, Myc, pERK, tERK, and β-ACTIN (loading control) are shown. The mean expression of pFGFR1, pGSK3β, pAKT, and Myc normalized to β-ACTIN from replicate experiments is shown (n=3). G. MTT proliferation assay using KP2 cells treated with Vehicle and RAF-MEKi (100 nM) ± murine FGF1 at different doses for the indicated time points. The mean MTT optical density from the above groups at indicated time points is depicted (n=3). H. Diagram illustrating the synergism of FAK and RAF-MEK inhibition. FAKi reprogramming of CAF phenotypes results in loss of FGF1 production and thus overcomes stromal FGF1/FGFR1-mediated RAF-MEKi resistance in PDAC cells by MPAK/Myc inhibition. Graphs show the mean ± SEM; Data were analyzed using two-sided t-tests (A, D, F) and one-way ANOVA with Tukey’s multiple comparison correction (B, G) *denotes p < 0.05, **denotes p < 0.01, and ***denotes p < 0.001, and n.s denotes not significant.
Sup Fig. 2. RAS/MAPK inhibition increased FAKi response by inhibiting RAS/MAPK/Myc.
A. Clonogenic growth at 7 or 14 days in KP1 cells treated with Vehicle, FAKi (1 μM), RAF-MEKi (100 nM), or the FAKi and RAF-MEKi combination is depicted. Representative images of cell clones in each group are shown. B. Inhibition curves of CF-PAC, Capan-1, Miapaca, and Panc-1 cells treated with Vehicle, FAKi, RAF-MEKi at different doses, or the FAKi and RAF-MEKi combination for 7 days using MTT proliferation assay (n=3). The doses of FAKi and RAF-MEKi were eight fixed-ratio concentrations [1 μM (FAKi):100 nM (RAF/MEKi)] of FAKi to RAF-MEKi (1:100, 0.5:50, 0.25:25, 0.125:12.5, 0.0625:6.25, 0.03125:3.125, 0.015625:1.5625, 0.0078125:0.78125). C. Median effect analysis measuring synergy between the FAKi and RAF-MEKi in Miapaca and Panc-1 cells analyzed using Compusyn software. Horizontal dotted lines mark the boundaries that classify each type of interaction—synergism, strong synergism, or very strong synergism —between the FAKi and RAF-MEKi (n=3). D. Apoptosis assay using KP2 cells treated with Vehicle or FAKi (1 μM) + RAF-MEKi (100nM) at indicated time points. The mean values of Annexin V luminescence and PI fluorescence from the above groups at indicated time points are depicted (n=3). E. GSEA identified pathway enrichment in KP2 organoids treated with RAF-MEKi (100 nM) for 24 hours, compared with that in the Vehicle group (n=3). F. Heatmap showing relative expression of proliferation-related genes in Vehicle- and FAKi (1 μM) + RAF-MEKi (100 nM)-treated KP2 organoids in Figure 2E (n=3). G. KP2 cells were treated with FAKi (1 μM), RAF-MEKi (100 nM), or FAKi and RAF-MEKi combination for 48 hours. Immunoblots for BRAF, tERK, tMEK, and β-ACTIN (loading control) from the total lysates (left) and BRAF, tERK, and tMEK from purified either BRAF or tERK protein are shown (middle). The mean expression of tERK and tMEK normalized to BRAF in the purified BRAF group (IP: BRAF), BRAF and tMEK normalized to tERK in the purified tERK group (IP: tERK) is shown (n=3). Graphs show the mean ± SEM; Data were analyzed using two-sided t-tests (D-F) and one-way ANOVA with Tukey’s multiple comparison correction (G); *denotes p < 0.05, **denotes p < 0.01, ***denotes p < 0.001, and n.s denotes not significant.
Acknowledgments
The author would like to thank Verastem Oncology for providing reagents. The author would also like to thank the Genome Technology Access Center for scRNA-seq and bulk RNA-seq experiments.
Funding
Funding from PANCAN and NCI P50-CA272213, R01-CA203890, R01-CA26250, R01-CA248917, R01-CA177670, R01-CA244938 and U01-CA284086 to D.G.D. SPORE CEP(GR0032118) to X.L. K12 CA167540 to L-I.K.
Footnotes
Competing interests
D.G.D. is on the scientific advisory board for Adhaere, 149. Bio, and Gossamer Bio. R.E.O., S.C. and J.A.P. are employees from Verastem Oncology.
Data and and materials availability
All data associated with this study are present in the paper or supplementary materials. The scRNA-seq data from PDAC lesions were obtained from the Gene Expression Omnibus Repository (GEO, accession number GSE247547), and bulk RNA-seq data from KP2 organoids were obtained from the GEO (accession number GSE248058). All software packages used are publicly available through commercial vendors.
References
- 1.Siegel RL, Miller KD, Fuchs HE, Jemal A, Cancer statistics, 2022. CA Cancer J Clin 72, 7–33 (2022). [DOI] [PubMed] [Google Scholar]
- 2.Hosein AN, Dougan SK, Aguirre AJ, Maitra A, Translational advances in pancreatic ductal adenocarcinoma therapy. Nat Cancer 3, 272–286 (2022). [DOI] [PubMed] [Google Scholar]
- 3.Santarpia L, Lippman SM, El-Naggar AK, Targeting the MAPK-RAS-RAF signaling pathway in cancer therapy. Expert Opin Ther Targets 16, 103–119 (2012). [DOI] [PMC free article] [PubMed] [Google Scholar]
- 4.Dennison L, Ruggieri A, Mohan A, Leatherman J, Cruz K, Woolman S, Azad N, Lesinski GB, Jaffee EM, Yarchoan M, Context-Dependent Immunomodulatory Effects of MEK Inhibition Are Enhanced with T-cell Agonist Therapy. Cancer Immunol Res 9, 1187–1201 (2021). [DOI] [PMC free article] [PubMed] [Google Scholar]
- 5.Mahadevan KK, McAndrews KM, LeBleu VS, Yang S, Lyu H, Li B, Sockwell AM, Kirtley ML, Morse SJ, Moreno Diaz BA, Kim MP, Feng N, Lopez AM, Guerrero PA, Paradiso F, Sugimoto H, Arian KA, Ying H, Barekatain Y, Sthanam LK, Kelly PJ, Maitra A, Heffernan TP, Kalluri R, KRAS(G12D) inhibition reprograms the microenvironment of early and advanced pancreatic cancer to promote FAS-mediated killing by CD8(+) T cells. Cancer Cell 41, 1606–1620 e1608 (2023). [DOI] [PMC free article] [PubMed] [Google Scholar]
- 6.Ozkan-Dagliyan I, Diehl JN, George SD, Schaefer A, Papke B, Klotz-Noack K, Waters AM, Goodwin CM, Gautam P, Pierobon M, Peng S, Gilbert TSK, Lin KH, Dagliyan O, Wennerberg K, Petricoin EF 3rd, Tran NL, Bhagwat SV, Tiu RV, Peng SB, Herring LE, Graves LM, Sers C, Wood KC, Cox AD, Der CJ, Low-Dose Vertical Inhibition of the RAF-MEK-ERK Cascade Causes Apoptotic Death of KRAS Mutant Cancers. Cell Rep 31, 107764 (2020). [DOI] [PMC free article] [PubMed] [Google Scholar]
- 7.Liu S, Zou Q, Chen JP, Yao X, Guan P, Liang W, Deng P, Lai X, Yin J, Chen J, Chen R, Yu Z, Xiao R, Sun Y, Hong JH, Liu H, Lu H, Chen J, Bei JX, Koh J, Chan JY, Wang B, Kang T, Yu Q, Teh BT, Liu J, Xiong Y, Tan J, Targeting enhancer reprogramming to mitigate MEK inhibitor resistance in preclinical models of advanced ovarian cancer. J Clin Invest 131, (2021). [DOI] [PMC free article] [PubMed] [Google Scholar]
- 8.Luebker SA, Koepsell SA, Diverse Mechanisms of BRAF Inhibitor Resistance in Melanoma Identified in Clinical and Preclinical Studies. Front Oncol 9, 268 (2019). [DOI] [PMC free article] [PubMed] [Google Scholar]
- 9.Sanchez JN, Wang T, Cohen MS, BRAF and MEK Inhibitors: Use and Resistance in BRAF-Mutated Cancers. Drugs 78, 549–566 (2018). [DOI] [PMC free article] [PubMed] [Google Scholar]
- 10.19th International Congress of the Society for Melanoma Research. Pigment Cell & Melanoma Research 36, 86–200 (2023). [DOI] [PubMed] [Google Scholar]
- 11.Kinsey CG, Camolotto SA, Boespflug AM, Guillen KP, Foth M, Truong A, Schuman SS, Shea JE, Seipp MT, Yap JT, Burrell LD, Lum DH, Whisenant JR, Gilcrease GW, Cavalieri CC, Rehbein KM, Cutler SL, Affolter KE, Welm AL, Welm BE, Scaife CL, Snyder EL, McMahon M, Protective autophagy elicited by RAF -> MEK -> ERK inhibition suggests a treatment strategy for RAS-driven cancers. Nature Medicine 25, 620-+ (2019). [DOI] [PMC free article] [PubMed] [Google Scholar]
- 12.Vitiello PP, Cardone C, Martini G, Ciardiello D, Belli V, Matrone N, Barra G, Napolitano S, Della Corte C, Turano M, Furia M, Troiani T, Morgillo F, De Vita F, Ciardiello F, Martinelli E, Receptor tyrosine kinase-dependent PI3K activation is an escape mechanism to vertical suppression of the EGFR/RAS/MAPK pathway in KRAS-mutated human colorectal cancer cell lines. J Exp Clin Canc Res 38, (2019). [DOI] [PMC free article] [PubMed] [Google Scholar]
- 13.Ryan MB, Fece de la Cruz F, Phat S, Myers DT, Wong E, Shahzade HA, Hong CB, Corcoran RB , Vertical Pathway Inhibition Overcomes Adaptive Feedback Resistance to KRAS(G12C) Inhibition. Clin Cancer Res 26, 1633–1643 (2020). [DOI] [PMC free article] [PubMed] [Google Scholar]
- 14.Diazzi S, Tartare-Deckert S, Deckert M, Bad Neighborhood: Fibrotic Stroma as a New Player in Melanoma Resistance to Targeted Therapies. Cancers 12, (2020). [DOI] [PMC free article] [PubMed] [Google Scholar]
- 15.Chu GC, Kimmelman AC, Hezel AF, DePinho RA, Stromal biology of pancreatic cancer. J Cell Biochem 101, 887–907 (2007). [DOI] [PubMed] [Google Scholar]
- 16.Ide T, Kitajima Y, Miyoshi A, Ohtsuka T, Mitsuno M, Ohtaka K, Koga Y, Miyazaki K, Tumor-stromal cell interaction under hypoxia increases the invasiveness of pancreatic cancer cells through the hepatocyte growth factor/c-Met pathway. Cancer Research 66, (2006). [DOI] [PubMed] [Google Scholar]
- 17.Meads MB, Gatenby RA, Dalton WS, Environment-mediated drug resistance: a major contributor to minimal residual disease. Nat Rev Cancer 9, 665–674 (2009). [DOI] [PubMed] [Google Scholar]
- 18.Straussman R, Morikawa T, Shee K, Barzily-Rokni M, Qian ZR, Du JY, Davis A, Mongare MM, Gould J, Frederick DT, Cooper ZA, Chapman PB, Solit DB, Ribas A, Lo RS, Flaherty KT, Ogino S, Wargo JA, Golub TR, Tumour micro-environment elicits innate resistance to RAF inhibitors through HGF secretion. Nature 487, 500–U118 (2012). [DOI] [PMC free article] [PubMed] [Google Scholar]
- 19.Brighton HE, Angus SP, Bo T, Roques J, Tagliatela AC, Darr DB, Karagoz K, Sciaky N, Gatza ML, Sharpless NE, Johnson GL, Bear JE, New Mechanisms of Resistance to MEK Inhibitors in Melanoma Revealed by Intravital Imaging. Cancer Res 78, 542–557 (2018). [DOI] [PMC free article] [PubMed] [Google Scholar]
- 20.Frame MC, Patel H, Serrels B, Lietha D, Eck MJ, The FERM domain: organizing the structure and function of FAK. Nat Rev Mol Cell Biol 11, 802–814 (2010). [DOI] [PubMed] [Google Scholar]
- 21.Sulzmaier FJ, Jean C, Schlaepfer DD, FAK in cancer: mechanistic findings and clinical applications. Nat Rev Cancer 14, 598–610 (2014). [DOI] [PMC free article] [PubMed] [Google Scholar]
- 22.Jiang H, Hegde S, Knolhoff BL, Zhu Y, Herndon JM, Meyer MA, Nywening TM, Hawkins WG, Shapiro IM, Weaver DT, Pachter JA, Wang-Gillam A, DeNardo DG, Targeting focal adhesion kinase renders pancreatic cancers responsive to checkpoint immunotherapy. Nat Med 22, 851–860 (2016). [DOI] [PMC free article] [PubMed] [Google Scholar]
- 23.Lander VE, Belle JI, Kingston NL, Herndon JM, Hogg GD, Liu XT, Kang LI, Knolhoff BL, Bogner SJ, Baer JM, Zuo C, Borcherding NC, Lander DP, Mpoy C, Scott J, Zahner M, Rogers BE, Schwarz JK, Kim H, DeNardo DG, Stromal Reprogramming by FAK Inhibition Overcomes Radiation Resistance to Allow for Immune Priming and Response to Checkpoint Blockade. Cancer Discov 12, 2774–2799 (2022). [DOI] [PMC free article] [PubMed] [Google Scholar]
- 24.Wei Y, Wang Y, Liu N, Qi R, Xu Y, Li K, Feng Y, Shi B, A FAK Inhibitor Boosts Anti-PD1 Immunotherapy in a Hepatocellular Carcinoma Mouse Model. Front Pharmacol 12, 820446 (2021). [DOI] [PMC free article] [PubMed] [Google Scholar]
- 25.Canel M, Taggart D, Sims AH, Lonergan DW, Waizenegger IC, Serrels A, T-cell co-stimulation in combination with targeting FAK drives enhanced anti-tumor immunity. Elife 9, (2020). [DOI] [PMC free article] [PubMed] [Google Scholar]
- 26.Jiang H, Liu XT, Knolhoff BL, Hegde S, Lee KB, Jiang HM, Fields RC, Pachter JA, Lim KH, DeNardo DG, Development of resistance to FAK inhibition in pancreatic cancer is linked to stromal depletion. Gut 69, 122–132 (2020). [DOI] [PMC free article] [PubMed] [Google Scholar]
- 27.Paradis JS, Acosta M, Saddawi-Konefka R, Kishore A, Lubrano S, Gomes F, Arang N, Tiago M, Coma S, Wu X, Ford K, Day CP, Merlino G, Mali P, Pachter JA, Sato T, Aplin AE, Gutkind JS, Synthetic Lethal Screens Reveal Cotargeting FAK and MEK as a Multimodal Precision Therapy for GNAQ-Driven Uveal Melanoma (vol 27, pg 3190, 2021). Clinical Cancer Research 27, 4664–4664 (2021). [DOI] [PMC free article] [PubMed] [Google Scholar]
- 28.Peng K, Zhang F, Wang Y, Sahgal P, Li T, Zhou J, Liang X, Zhang Y, Sethi N, Liu T, Zhang H, Bass AJ, Development of Combination Strategies for Focal Adhesion Kinase Inhibition in Diffuse Gastric Cancer. Clin Cancer Res 29, 197–208 (2023). [DOI] [PMC free article] [PubMed] [Google Scholar]
- 29.Wang-Gillam A, Lim KH, McWilliams R, Suresh R, Lockhart AC, Brown A, Breden M, Belle JI, Herndon J, Bogner SJ, Pedersen K, Tan B, Boice N, Acharya A, Abdiannia M, Gao F, Yoon HH, Zhu M, Trikalinos NA, Ratner L, Aranha O, Hawkins WG, Herzog BH, DeNardo DG, Defactinib, Pembrolizumab, and Gemcitabine in Patients with Advanced Treatment Refractory Pancreatic Cancer: A Phase I Dose Escalation and Expansion Study. Clin Cancer Res 28, 5254–5262 (2022). [DOI] [PMC free article] [PubMed] [Google Scholar]
- 30.Ono H, Horinaka M, Sukeno M, Morita M, Yasuda S, Nishimoto E, Konishi E, Sakai T, Novel RAF/MEK inhibitor CH5126766/VS-6766 has efficacy in combination with eribulin for the treatment of triple-negative breast cancer. Cancer Science 112, 4166–4175 (2021). [DOI] [PMC free article] [PubMed] [Google Scholar]
- 31.Llombart V, Mansour MR, Therapeutic targeting of “undruggable” MYC. Ebiomedicine 75, (2022). [DOI] [PMC free article] [PubMed] [Google Scholar]
- 32.Zaghdoudi S, Decaup E, Belhabib I, Samain R, Cassant-Sourdy S, Rochotte J, Brunel A, Schlaepfer D, Cros J, Neuzillet C, Strehaiano M, Alard A, Tomasini R, Rajeeve V, Perraud A, Mathonnet M, Pearce OMT, Martineau Y, Pyronnet S, Bousquet C, Jean C, FAK activity in cancer-associated fibroblasts is a prognostic marker and a druggable key metastatic player in pancreatic cancer. Embo Molecular Medicine 12, (2020). [DOI] [PMC free article] [PubMed] [Google Scholar]
- 33.Stokes JB, Adair SJ, Slack-Davis JK, Walters DM, Tilghman RW, Hershey ED, Lowrey B, Thomas KS, Bouton AH, Hwang RF, Stelow EB, Parsons JT, Bauer TW, Inhibition of focal adhesion kinase by PF-562,271 inhibits the growth and metastasis of pancreatic cancer concomitant with altering the tumor microenvironment. Mol Cancer Ther 10, 2135–2145 (2011). [DOI] [PMC free article] [PubMed] [Google Scholar]
- 34.Bhattacharyya S, Oon C, Kothari A, Horton W, Link J, Sears RC, Sherman MH, Acidic fibroblast growth factor underlies microenvironmental regulation of MYC in pancreatic cancer. J Exp Med 217, (2020). [DOI] [PMC free article] [PubMed] [Google Scholar]
- 35.Verma V, Jafarzadeh N, Boi S, Kundu S, Jiang ZN, Fan YP, Lopez J, Nandre R, Zeng P, Alolaqi F, Ahmad S, Gaur P, Barry ST, Valge-Archer VE, Smith PD, Banchereau J, Mkrtichyan M, Youngblood B, Rodriguez PC, Gupta S, Khleif SN, MEK inhibition reprograms CD8 T lymphocytes into memory stem cells with potent antitumor effects. Nature Immunology 22, 53–56 (2021). [DOI] [PMC free article] [PubMed] [Google Scholar]
- 36.Erkes DA, Cai W, Sanchez IM, Purwin TJ, Rogers C, Field CO, Berger AC, Hartsough EJ, Rodeck U, Alnemri ES, Aplin AE, Mutant BRAF and MEK Inhibitors Regulate the Tumor Immune Microenvironment via Pyroptosis. Cancer Discov 10, 254–269 (2020). [DOI] [PMC free article] [PubMed] [Google Scholar]
- 37.Marchingo JM, Sinclair LV, Howden AJM, Cantrell DA, Quantitative analysis of how Myc controls T cell proteomes and metabolic pathways during T cell activation. Elife 9, (2020). [DOI] [PMC free article] [PubMed] [Google Scholar]
- 38.Guo A, Huang H, Zhu Z, Chen MJ, Shi H, Yuan S, Sharma P, Connelly JP, Liedmann S, Dhungana Y, Li Z, Haydar D, Yang M, Beere H, Yustein JT, DeRenzo C, Pruett-Miller SM, Crawford JC, Krenciute G, Roberts CWM, Chi H, Green DR, cBAF complex components and MYC cooperate early in CD8(+) T cell fate. Nature 607, 135–141 (2022). [DOI] [PMC free article] [PubMed] [Google Scholar]
- 39.Kinsey CG, Camolotto SA, Boespflug AM, Gullien KP, Foth M, Shea JE, Seipp MT, Yap JT, Burrell LD, Lum DH, Whisenant JR, Gilcrease W, Cavalieri CC, Rehbein KM, Cutler SL, Affolter KE, Welm AL, Welm BE, Scaife CL, Snyder EL, McMahon M, Protective autophagy elicited by RAF→MEK→ERK inhibition suggests a treatment strategy for RAS-driven cancers. Mol Cancer Res 18, 52–53 (2020). [Google Scholar]
- 40.Ligorio M, Sil S, Malagon-Lopez J, Nieman LT, Misale S, Di Pilato M, Ebright RY, Karabacak MN, Kulkarni AS, Liu A, Vincent Jordan N, Franses JW, Philipp J, Kreuzer J, Desai N, Arora KS, Rajurkar M, Horwitz E, Neyaz A, Tai E, Magnus NKC, Vo KD, Yashaswini CN, Marangoni F, Boukhali M, Fatherree JP, Damon LJ, Xega K, Desai R, Choz M, Bersani F, Langenbucher A, Thapar V, Morris R, Wellner UF, Schilling O, Lawrence MS, Liss AS, Rivera MN, Deshpande V, Benes CH, Maheswaran S, Haber DA, Fernandez-Del-Castillo C, Ferrone CR, Haas W, Aryee MJ, Ting DT, Stromal Microenvironment Shapes the Intratumoral Architecture of Pancreatic Cancer. Cell 178, 160–175 e127 (2019). [DOI] [PMC free article] [PubMed] [Google Scholar]
- 41.Nan P, Dong X, Bai X, Lu H, Liu F, Sun Y, Zhao X, Tumor-stroma TGF-beta1-THBS2 feedback circuit drives pancreatic ductal adenocarcinoma progression via integrin alpha(v)beta(3)/CD36-mediated activation of the MAPK pathway. Cancer Lett 528, 59–75 (2022). [DOI] [PubMed] [Google Scholar]
- 42.Girard CA, Lecacheur M, Ben Jouira R, Berestjuk I, Diazzi S, Prod’homme V, Mallavialle A, Larbret F, Gesson M, Schaub S, Pisano S, Audebert S, Mari B, Gaggioli C, Leucci E, Marine JC, Deckert M, Tartare-Deckert S, A Feed-Forward Mechanosignaling Loop Confers Resistance to Therapies Targeting the MAPK Pathway in BRAF-Mutant Melanoma. Cancer Res 80, 1927–1941 (2020). [DOI] [PubMed] [Google Scholar]
- 43.Yarchoan M, Cope L, Anders RA, Noonan A, Goff LW, Goyal L, Lacy J, Li DN, Patel A, He AR, Abou-Alfa G, Spencer K, Kim E, Xavier S, Ruggieri A, Davis SL, McRee A, Kunk P, Zhu QF, Wang-Gillam A, Poklepovic A, Chen HL, Sharon E, Lesinski GB, Azad N, A multicenter randomized phase 2 trial of atezolizumab as monotherapy or in combination with cobimetinib in biliary tract cancers (BTCs): A NCI Experimental Therapeutics Clinical Trials Network (ETCTN) study. Cancer Research 80, (2020). [Google Scholar]
- 44.Dummer R, Schadendorf D, Ascierto PA, Arance A, Dutriaux C, Di Giacomo AM, Rutkowski P, Del Vecchio M, Gutzmer R, Mandala M, Thomas L, Demidov L, Garbe C, Hogg D, Liszkay G, Queirolo P, Wasserman E, Ford J, Weill M, Sirulnik LA, Jehl V, Bozon V, Long GV, Flaherty K, Binimetinib versus dacarbazine in patients with advanced NRAS-mutant melanoma (NEMO): a multicentre, open-label, randomised, phase 3 trial. Lancet Oncol 18, 435–445 (2017). [DOI] [PubMed] [Google Scholar]
- 45.Choi H, Deng J, Li S, Silk T, Dong L, Brea EJ, Houghton S, Redmond D, Zhong H, Boiarsky J, Akbay EA, Smith PD, Merghoub T, Wong KK, Wolchok JD, Pulsatile MEK Inhibition Improves Anti-tumor Immunity and T Cell Function in Murine Kras Mutant Lung Cancer. Cell Rep 27, 806–819 e805 (2019). [DOI] [PMC free article] [PubMed] [Google Scholar]
- 46.Gnanaprakasam JN, Wang R, MYC in Regulating Immunity: Metabolism and Beyond. Genes (Basel) 8, (2017). [DOI] [PMC free article] [PubMed] [Google Scholar]
- 47.Preston GC, Sinclair LV, Kaskar A, Hukelmann JL, Navarro MN, Ferrero I, MacDonald HR, Cowling VH, Cantrell DA, Single cell tuning of Myc expression by antigen receptor signal strength and interleukin-2 in T lymphocytes. EMBO J 34, 2008–2024 (2015). [DOI] [PMC free article] [PubMed] [Google Scholar]
- 48.Lindsten T, June CH, Thompson CB, Multiple mechanisms regulate c-myc gene expression during normal T cell activation. EMBO J 7, 2787–2794 (1988). [DOI] [PMC free article] [PubMed] [Google Scholar]
- 49.Wang RN, Dillon CP, Shi LZ, Milasta S, Carter R, Finkelstein D, McCormick LL, Fitzgerald P, Chi HB, Munger J, Green DR, The Transcription Factor Myc Controls Metabolic Reprogramming upon T Lymphocyte Activation. Immunity 35, 871–882 (2011). [DOI] [PMC free article] [PubMed] [Google Scholar]
- 50.Haas L, Elewaut A, Gerard CL, Umkehrer C, Leiendecker L, Pedersen M, Krecioch I, Hoffmann D, Novatchkova M, Kuttke M, Neumann T, da Silva IP, Witthock H, Cuendet MA, Carotta S, Harrington KJ, Zuber J, Scolyer RA, Long GV, Wilmott JS, Michielin O, Vanharanta S, Wiesner T, Obenauf AC, Acquired resistance to anti-MAPK targeted therapy confers an immune-evasive tumor microenvironment and cross-resistance to immunotherapy in melanoma. Nat Cancer 2, 693–708 (2021). [DOI] [PMC free article] [PubMed] [Google Scholar]
- 51.Lim K-H, Spencer KR, Safyan RA, Picozzi VJ, Varghese AM, Siolas D, Perez K, Clift S, Denis LJ, Bhambhani V, Hill S, Pachter JA, Pultar P, Hidalgo M, Avutometinib/defactinib and gemcitabine/nab-paclitaxel combination in first-line metastatic pancreatic ductal adenocarcinoma: Initial safety and efficacy of phase 1b/2 study (RAMP 205). Journal of Clinical Oncology 42, 4140–4140 (2024). [Google Scholar]
- 52.Kim MP, Evans DB, Wang H, Abbruzzese JL, Fleming JB, Gallick GE, Generation of orthotopic and heterotopic human pancreatic cancer xenografts in immunodeficient mice. Nat Protoc 4, 1670–1680 (2009). [DOI] [PMC free article] [PubMed] [Google Scholar]
- 53.Soares KC, Foley K, Olino K, Leubner A, Mayo SC, Jain A, Jaffee E, Schulick RD, Yoshimura K, Edil B, Zheng L, A preclinical murine model of hepatic metastases. J Vis Exp, 51677 (2014). [DOI] [PMC free article] [PubMed] [Google Scholar]
Associated Data
This section collects any data citations, data availability statements, or supplementary materials included in this article.
Supplementary Materials
Sup Fig. 1 RAS/MAPK activation in FAKi-treated PDAC tumors.
A. KPPC mice treated with the Vehicle or FAKi (75 mg/kg) from tumor diagnosis for 14 days. Representative IHC staining for pFAK1 in PDAC tissue is shown (left). Scale bar, 100 μm. The percentage of pFAK1+ cells is plotted on the right (n=8). B. Representative IHC staining for pPYK2 in PDAC tissue with treatment in A is shown (left). Scale bar, 100 μm. The percentage of pPYK2+ cells is plotted on the right (n=8). C. Single pERK, CK19, and SMA staining in KPPC mice from Figure 1B, and merged staining are shown (left). Scale bar, 100 μm. The percentage of pERK+ SMA+ cells is plotted on the right (n=7). Tumor burden from the above two groups is shown (n=14–18) (bottom). D. Immunoblots of pERK, tERK, and β-ACTIN (loading control) from KP2 cells treated with Vehicle or FAKi (1 μM) for 48 hours. The mean expression of pERK normalized to tERK from replicate experiments is shown (n=3). E. GSEA identified pathway enrichment in KP2 organoids treated with FAKi (1 μM) for 24 hours, compared with that in the Vehicle group (n=3). F. Single staining of pERK and CK19 in PDAC biopsies from Figure 1C. Proportion of pERK+ cells in paired pre- and post-treatment tissue. Red lines represent the increase of pERK+ cells in the post-treatment group (n=10). Grey lines represent the decrease. Graphs show the mean ± SEM; Data were analyzed using two-sided t-tests (A-E) and paired t test (F); *denotes p < 0.05, **denotes p < 0.01, ***denotes p < 0.001, and n.s denotes not significant.
Sup Fig. 6. DNA damaging therapies cooperate with FAKi and RAF-MEKi treatment to increase the anti-tumor effects.
A. The mean percentage change in MTT optical density and the mean values of PI fluorescence from KP2 cells exposed to different treatments in Figure 6B at indicated time points are depicted (n=3). B. MTT proliferation assay using KP2 cells treated with DMSO, APTO-253(5 μM), 10058-F4(5 μM), GEM at different doses, GEM + FAKi (1 μM) + RAF-MEKi (100 nM) ± APTO-253 (5 μM) or 10058-F4(5 μM). The mean percentage change in MTT optical density from the above groups on day 3 is depicted (n=3). C. KP2 cells were treated with DMSO, FAKi (1 μM) + RAF-MEKi (100 nM) ± 5Fu (10 μM, Upper), SN38 (10 μM, Middle), or oxaliplatin (10 μM, bottom). The mean values of Annexin V luminescence and PI fluorescence from the above groups at indicated time points are depicted (n=3). D. Mice bearing established (~100mm3) KP2 subcutaneous PDAC tumors were treated with Vehicle, FAKi (75 mg/kg)/RAF-MEKi (0.5 mg/kg) combination, or the FAKi/RAF-MEKi combination ± GEM (75 mg/kg) + PTX (5 mg/kg). The mean percentage of tumor volume on day 14 is depicted (n=6–10). E. The mean percentage of tumor volume from the 1e6 2838c3 cells subcutaneous PDAC model treated with Vehicle or FAKi (75 mg/kg, BID during weekdays; daily on weekends) + RAF-MEKi (0.5 mg/kg) ± GEM (120 mg/kg) + PTX (15 mg/kg) on day 18 (n=9–10). Graphs show the mean ± SEM; Data were analyzed using one-way ANOVA with Tukey’s multiple comparison correction (A-C) and Kaplan–Meier (D, E); *denotes p < 0.05, **denotes p < 0.01, and ***denotes p < 0.001.
Sup Fig. 5. CD8+ T cells contribute to the anti-tumor efficacy of FAKi plus RAF-MEKi treatment.
A. Representative IHC staining for CD4 in KPPC tissue treated with Vehicle, FAKi (75 mg/kg), RAF-MEKi (0.5 mg/kg), or FAKi/RAF-MEKi combination for 14 days. Scale bar, 100 μm. The mean percentages of CD4+ T cells in the tumor nest are shown (n=7–8). B. Representative IHC staining for CD8α in KPPC tissue treated with Vehicle, FAKi (75 mg/kg), RAF-MEKi (0.5 mg/kg), or FAKi/RAF-MEKi combination for 14 days. Scale bar, 100 μm. The mean percentages of CD8+ T cells in the tumor nest are shown (n=6–8). C. Heatmap depicting the top 10 genes in the immune cell population from Figure 5C. D. GSEA identified pathway enrichment in the TAMs/Mo population in FAKi-, RAF-MEKi- and FAKi plus RAF-MEKi combination-treated KPPC tissue, compared to the Vehicle group. E. GSEA identified pathway enrichment in the DC population in FAKi-, RAF-MEKi- and FAKi plus RAF-MEKi combination-treated KPPC tissue, compared to the Vehicle group. F. GSEA identified pathway enrichment in the DC population in FAKi plus RAF-MEKi combination-treated KPPC tissue, compared to the Vehicle group. G. Dot plots depicting the relative MHC-related gene expression from the CAF, cDCs, TAMs, and T cell populations in Vehicle and the combined FAKi and RAF-MEKi treatment groups (The color of each dot indicates the expression amount the size of the dot indicates the proportion of expressed cells). H. Heat maps displaying relative importance of network centrality measures for sender (ligand signals) and receiver (receptors) across cDCs and T cells for MHC-1 signaling pathway networks from cell chat analysis(5). I. GSEA identified pathway enrichment in the CD8+T cell population in RAF-MEKi-treated KPPC tissue, compared to the Vehicle group. J. GSEA identified pathway enrichment in the CD8+T cell population in the FAKi and RAF-MEKi combination-treated KPPC tissue, compared to the RAF-MEKi-treated group. K. GSEA identified pathway enrichment in the CD8+T cell population in FAKi-, RAF-MEKi-, and FAKi plus RAF-MEKi-treated KPPC tissue, compared to the Vehicle group. L. The mean frequency of Tregs in tumor tissue from Figure 5J is depicted (n=6–8). Data were analyzed using one-way ANOVA with Tukey’s multiple comparison correction (A-E). Graphs show the mean ± SEM; Data were analyzed using two-sided t-tests (D-F, I-L) and one-way ANOVA with Tukey’s multiple comparison correction (A, B); *denotes p < 0.05, **denotes p < 0.01, ***denotes p < 0.001, and n.s denotes not significant.
Sup Fig. 3. FAKi combined with RAF-MEKi treatment inhibited tumor progression.
A. Histological images of KPPC mice according to the treatments in Figure 3C. Scale bar, 5 mm. The tumor grading in these groups is shown (n = 6–14). B. Mice bearing established 1e6 7940B.PDA subcutaneous PDAC tumors were treated with Vehicle, RAF-MEKi (0.5mg/kg for 4 weeks) and FAKi (75mg/kg, BID, weekdays; daily on weekends) + RAF-MEKi until mice were euthanized. Overall survival from the above mice (n=10). C. Mice bearing established (~200 mm3) KP2-OVA subcutaneous PDAC tumors were treated with Vehicle, FAKi (50 mg/kg), RAF-MEKi (0.3 mg/kg), or the FAKi/RAF-MEKi combination. The Kaplan–Meier survival analysis is shown (n = 8–10). D. Representative IHC staining for cleaved caspase 3 (CC3) in KPPC mice treated with Vehicle or FAKi (75 mg/kg)/RAF-MEKi (0.5 mg/kg) combination for 14 days. Scale bar, 500 μm. The mean percentage of CC3+ cells is depicted (n=12–14). E. Representative IHC staining for pERK in KPPC mice treated with Vehicle or FAKi (75 mg/kg)/RAF-MEKi (0.5 mg/kg) combination until the end stage. Scale bar, 500 μm. The mean percentage of pERK+ cells is depicted (n=6–8). Graphs show the mean ± SEM; Data were analyzed using Kaplan–Meier (B, C) and two-sided t-tests (D, E); *denotes p < 0.05, **denotes p < 0.01, and ***denotes p < 0.001, and n.s denotes not significant.
Sup Fig. 4. FAKi-induced reduction of FGF1 in CAFs synergized with RAF-MEKi treatment to decrease Myc expression in tumor cells.
A. KP2 cells were co-cultured with fibroblasts or incubated with fibroblasts-conditioned media (CM) for 48 hours. Immunoblots for pERK, tERK, and β-ACTIN (loading control) are shown. The mean expression of pERK normalized to β-ACTIN from replicate experiments is shown (n=3). B. The mean expression of Myc normalized to β-ACTIN and pERK normalized to tERK from replicate experiments in Figure 4D is depicted as the fold change from the Vehicle baseline (n=3). C. Heatmap showing the top 10 genes in the CAF subpopulations from Figure 4E. D. Waterfall plot of the top 25 up-and down-regulated genes induced by the combination of FAKi and RAF-MEKi in CAFs, compared to the Vehicle group (above). GSEA identified pathway enrichment in all CAF populations induced by the FAKi and RAF-MEKi combination, compared to the Vehicle group (bottom). E. Vlnplot depicting the relative Fgf1 expression in CAF subtypes from 4E. F. Panc-1 cells were starved in media without FBS for 12 hours and then treated with Vehicle or human FGF1 (5 ng) for 3 hours. Immunoblots of pFGFR1, pGSK3β, GSK3β, pAKT, AKT, Myc, pERK, tERK, and β-ACTIN (loading control) are shown. The mean expression of pFGFR1, pGSK3β, pAKT, and Myc normalized to β-ACTIN from replicate experiments is shown (n=3). G. MTT proliferation assay using KP2 cells treated with Vehicle and RAF-MEKi (100 nM) ± murine FGF1 at different doses for the indicated time points. The mean MTT optical density from the above groups at indicated time points is depicted (n=3). H. Diagram illustrating the synergism of FAK and RAF-MEK inhibition. FAKi reprogramming of CAF phenotypes results in loss of FGF1 production and thus overcomes stromal FGF1/FGFR1-mediated RAF-MEKi resistance in PDAC cells by MPAK/Myc inhibition. Graphs show the mean ± SEM; Data were analyzed using two-sided t-tests (A, D, F) and one-way ANOVA with Tukey’s multiple comparison correction (B, G) *denotes p < 0.05, **denotes p < 0.01, and ***denotes p < 0.001, and n.s denotes not significant.
Sup Fig. 2. RAS/MAPK inhibition increased FAKi response by inhibiting RAS/MAPK/Myc.
A. Clonogenic growth at 7 or 14 days in KP1 cells treated with Vehicle, FAKi (1 μM), RAF-MEKi (100 nM), or the FAKi and RAF-MEKi combination is depicted. Representative images of cell clones in each group are shown. B. Inhibition curves of CF-PAC, Capan-1, Miapaca, and Panc-1 cells treated with Vehicle, FAKi, RAF-MEKi at different doses, or the FAKi and RAF-MEKi combination for 7 days using MTT proliferation assay (n=3). The doses of FAKi and RAF-MEKi were eight fixed-ratio concentrations [1 μM (FAKi):100 nM (RAF/MEKi)] of FAKi to RAF-MEKi (1:100, 0.5:50, 0.25:25, 0.125:12.5, 0.0625:6.25, 0.03125:3.125, 0.015625:1.5625, 0.0078125:0.78125). C. Median effect analysis measuring synergy between the FAKi and RAF-MEKi in Miapaca and Panc-1 cells analyzed using Compusyn software. Horizontal dotted lines mark the boundaries that classify each type of interaction—synergism, strong synergism, or very strong synergism —between the FAKi and RAF-MEKi (n=3). D. Apoptosis assay using KP2 cells treated with Vehicle or FAKi (1 μM) + RAF-MEKi (100nM) at indicated time points. The mean values of Annexin V luminescence and PI fluorescence from the above groups at indicated time points are depicted (n=3). E. GSEA identified pathway enrichment in KP2 organoids treated with RAF-MEKi (100 nM) for 24 hours, compared with that in the Vehicle group (n=3). F. Heatmap showing relative expression of proliferation-related genes in Vehicle- and FAKi (1 μM) + RAF-MEKi (100 nM)-treated KP2 organoids in Figure 2E (n=3). G. KP2 cells were treated with FAKi (1 μM), RAF-MEKi (100 nM), or FAKi and RAF-MEKi combination for 48 hours. Immunoblots for BRAF, tERK, tMEK, and β-ACTIN (loading control) from the total lysates (left) and BRAF, tERK, and tMEK from purified either BRAF or tERK protein are shown (middle). The mean expression of tERK and tMEK normalized to BRAF in the purified BRAF group (IP: BRAF), BRAF and tMEK normalized to tERK in the purified tERK group (IP: tERK) is shown (n=3). Graphs show the mean ± SEM; Data were analyzed using two-sided t-tests (D-F) and one-way ANOVA with Tukey’s multiple comparison correction (G); *denotes p < 0.05, **denotes p < 0.01, ***denotes p < 0.001, and n.s denotes not significant.
Data Availability Statement
All data associated with this study are present in the paper or supplementary materials. The scRNA-seq data from PDAC lesions were obtained from the Gene Expression Omnibus Repository (GEO, accession number GSE247547), and bulk RNA-seq data from KP2 organoids were obtained from the GEO (accession number GSE248058). All software packages used are publicly available through commercial vendors.