

Abstract
Medicinal plants are invaluable sources of bioactive compounds and continue to serve as primary medicine for many people worldwide, despite advances in pharmaceuticals. Their recognition has increased with the popularity of herbal products, yet many are vanishing rapidly. Climate change further threatens these resources, making their conservation a pressing concern. This study aimed to evaluate current range and the potential impact of climate change on the future distribution of Zhumeria majdae, an endangered and endemic medicinal species in Iran, and to identify priority areas for its conservation. Using 56 occurrence records and 7 environmental variables, the MaxEnt model was employed to project current and future habitat suitability under two climate scenarios (RCP 4.5 and RCP 8.5) for the 2050s and 2070s. The model performed excellently (AUC = 0.977, TSS = 0.807 ). Among the variables used, solar radiation contributed the most (26%), followed by slope (12%), pH index (2.5%), Bio6 (1.1%), Bio19 (26.3%), Bio10 (0.7%), and Bio18 (31.3%). The results predicted suitable range in Hormozgan, South of Kerman and Fars provinces. Also, modeling projected a notable shift in the geographic distribution of Z. majdae under climate change scenarios. The suitable habitat is projected to expand by 20.12% under RCP 4.5 and by 29.95% under RCP 8.5 in the 2050s. In the 2070s, an increase of 21.63% is expected under RCP 4.5, while a slight contraction of 1.15% is projected under RCP 8.5. Based on these findings, it is recommended to prioritize conservation efforts in areas projected to remain suitable in both current and future climates. Establishing in-situe and ex-situ conservation sites, introduce protected areas in new habitat projected, and initiating habitat restoration in emerging suitable zones could enhance the species’ long-term survival prospects.
Keywords: Global warming, MaxEnt model, Habitat suitability, Conservation, Iran
Introduction
A comprehensive analysis of ecological data collected over the past two centuries reveals that various species have experienced considerable biological transformations as a direct consequence of climate change [1, 2]. Experimental studies indicate that species exhibit diverse responses to these climatic alterations, encompassing modifications in phenology, behavior, morphology, distribution, and migratory patterns [3, 4]. Moreover, climate change represents a significant threat to global biodiversity, with the potential to precipitate the extinction of numerous species [5]. Nonetheless, the responses of species to climate change are markedly heterogeneous, shaped by the diversities among species and their respective ecological contexts [6]. Endemic species, in particular, are seriously vulnerable to environmental threats such as climate change, attributed to their limited geographical distributions, small population sizes, and restricted dispersal capabilities [7, 8]. Grasping the mechanisms by which species respond to climate change scenarios is crucial for the effective management and conservation of biodiversity, especially in relation to their spatial distribution in prospective scenarios [9]. An array of novel methodologies has been employed to investigate the geographical distributions of species under various global warming scenarios. These scenarios display potential climate futures predicated on anticipated greenhouse gas emission levels in the forthcoming years [10]. Representative concentration pathways (RCPs) investigate plausible future trajectories, accounting for uncertainties inherent in prospective developments. RCP 4.5 represents a stabilization scenario where in emissions peak around 2040, subsequently declining, with total radiative forcing anticipated to reach 540 ppm by 2100 before stabilizing [11]. In contrast, RCP 8.5 constitutes a more pessimistic projection wherein emissions persistently escalate throughout the 21st century, attaining 940 ppm by 2100 and continuing to rise for an additional century. Within this framework, species distribution models (SDMs) serve an indispensable function in forecasting and comprehending the prospective distribution of plant species [12, 13]. SDMs have exhibited significant efficacy in conservation and management planning [14].
The maximum entropy (MaxEnt) model is particularly tool in evaluating species’ ecological requirements, responses to environmental variables, habitat suitability, and range modifications across varying climate scenarios. MaxEnt is especially proficient when utilized with presence-only data, rendering it appropriate for instances characterized by limited occurrence records [15, 16]. Species Distribution Modeling (SDM) has proven to be a valuable tool for understanding and predicting the geographical ranges of various plant species, particularly endemic flora. Several studies have successfully applied this approach to model the distribution of endemic plants in Iran, including diverse Allium species [17], the near-endemic medicinal plant Zataria multiflora [18], Ferula ovina [19], and Thymus daenensis subspices [20]. Beyond Iran, SDM has been utilized to forecast the distribution of other endemic species, such as Rosa arabica Crep. in Egypt [21]and various medicinal Asclepiads in Pakistan [22]. This robust modeling approach has also been applied to a broader range of plant species, including Justicia adhatoda. [23], wild Aegilops spp. [24], three traditional medicinal Feulago species [25], and Stipa purpurea [26], highlighting its versatility in ecological research.
Iran is recognized as a key center of vascular endemic plant diversity in Southwest Asia [27]. However, the severe impacts of climate change have caused significant shifts in the spatial patterns of plant species in Iran, particularly among endemic taxa [28, 29]. These changes underscore the urgent need to understand and address the consequences of climate change on this rich and unique biodiversity. Zhumeria majdae Rech.f. & Wendelbo, commonly known as “Mohrekhosh,” is an endemic, monotypic perennial shrub, belonging to the Lamiaceae family. This spesies is a shrubs up to 50 cm high, very fragrant. Flowers purple or bluish-purple, large. This plant is distributed from 520 to 1450 m.a.s.l. in rocky areas with very steep slopes of the mountains of South Iran. According to the IUCN Criteria, this species is classified as endangered due to its restricted area, lack of natural regeneration in its habitats, removal from nature as a medicinal plant, small populations and fragmentation, and poor habitat quality [30]. The mentioned fragrant species represent in the traditional medicine (e.g. diarrhea, cold, acid reflux, and headache) of the region [31, 32]. Z. mjdae has anti-inflammatory [33], antibacterial and antinociceptive and antioxidant [34, 35] and antifungal [36] larvicidal, anticonvulsant, antidiabetic, and anticancer [37] properties. Z. majdae is classified as a critically endangered (CR) plant species due to its limited extent of occurrence (EOO), area of occupancy (AOO), and assessments of population size and habitat condition [30]. In addition, The Z. majdae faces severe threats due to environmental pressures such as overharvesting, habitat destruction, and limited natural reproduction, leading to a significant decline in its population [38]. As a result, urgent and effective management actions are therefore essential for its conservation. This aromatic plant is restricted to rocky slopes at elevations ranging from 520 to 1,450 m in the Sudano-Zambezian region of southern Iran [39–41]. While many studies have focused on modeling the effects of climate change on various endemic plant species—such as Rosa arabica [21], Thymus daenensis Čelak [20]. , Gleditsia caspica Desf [42]. , and others from different regions [12, 28, 43–48]. Little attention has been given to assessing the current and future distribution patterns of Iranian endemic species from the Sudano-Zambezian phytogeographic region. Understanding the present and future spatial distribution of such species is crucial for designing effective conservation strategies.
This study aims to:
Estimate the current distribution of Z. majdae under present climate conditions using the MaxEnt model.
Identify the key variables influencing the distribution of Z. majdae.
Project the future distribution of this taxon for the 2050s and 2070s under semi-optimistic (RCP 4.5) and pessimistic (RCP 8.5) climate change scenarios, providing valuable data for conservation management efforts.
Study area
The studied area is located in the western parts of Hormozgan province in the South Zagros zone in 27.29 to 28.04 North latitude to 56. 33 to 55.91 East altitude. The Zagros mountainous region in Iran is classified as the main segment of the Alpine-Himalayan collision shaped resulted by the closure of the Neo-Tethys Ocean and the collision between the Arabian and Eurasian plates [49]. The geological formations mainly include sedimentary rocks and quaternary deposits (www.ngdir.ir). This area in terms of bioclimatology is classified in Tropical desertic macro-bioclimatic [50]. The average minimum temperature as well the average maximum temperature are recorded at − 1.85 °C and + 45.5 °C respectively. Additionally, the average annual rainfall is recorded at 103.28 to 208.14 mm respectively [51]. The vegetation types of the area mainly cover desert types including Prunus scoparia (Spach) C.K.Schneid., Pistacia atlantica Desf., Artemisia sieberi Besser and Ebenus stellata Boiss [52]. This tropical species is classified in the area of Sudano Zambezi plant geography and is one of its key elements. The main vegetation types of the mentioned area include open woodlands, Savana, and a wide range of grasses [53]. All areas of distribution of the mentioned taxon are geologically limestone and marl of the late Miocene. This formation has a wide dominance in the northern and western heights of the province. By examining the map of resources and land capabilities of the province, the distribution of the Morkhosh species is established on the mountainous land type. This land unit, which includes relatively high mountains consisting of limestone, dolomite and colored mixtures, is often without soil, or with soil. It is very dense, variegated and uneven soil [30].
Methods
Species occurrence data
The species is mainly restricted to southern regions of Iran, particularly in the provinces of Hormozgan and parts of Fars, indicating its preference for specific altitudinal and climatic conditions (Fig. 1).The distribution dataset on Z. majdae was extracted using viewpoints from fieldwork samples, Flora of Iran [39], Flora Iranica [40], some published references on Flora and vegetation of Hormozgan [38], as well as HSBU herbarium (Herbarium abbreviation according to [54]). It is essential to note that 120 points obtained from the literature and herbaria were confirmed through field verification. To eliminate duplicate points, we applied a filtering process to the occurrence data by randomly choosing an occurrence point within a single grid cell measuring 1 × 1 Km [55] selection process was carried out using the ' sf, sp, and rio packages in R (Version 4.3.1). Finally, SDMs were generated using 56 out of 120 data points (Fig. 1).
Fig. 1.

Geographical distribution of Zhumeria majdae occurrence points (blue dots) overlaid on the digital elevation model (DEM) of Iran
Environmental variables
Backward elimination was employed to select the most relevant variables [56]. All selected variables are initially included in the model, and then those with the least impact are gradually removed in successive iterations. This method is effective and can help identify variables that do not significantly influence the outcomes. Particularly in complex models, this can lead to a more optimized model [56]. In this approach, thirty-seven environmental variables was initially selected in ASCII format raster layers, encompassing three distinct categories: bioclimatic (www.worldclim.org), soil (www.soilgrid.org), and topographic (www.worldgrids.org) variables, all possessing a spatial resolution of 30 arc-seconds (approximately 1 km²). The evaluation of collinearity among the variables was conducted utilizing Pearson’s correlation coefficient (r) within the R programming environment, in accordance with the guidelines established by prior research [15, 57–61]. In instances where two variables exhibited a significant correlation (r>|0.70|), one variable was systematically excluded to mitigate concerns regarding collinearity [15]. Ultimately, informed by the outcomes of backward elimination, nineteen variables across the three categories were discerned for the the Pearson’s correlation analysis. Finally, based on, outcomes of the Pearson’s correlation analysis, insights derived from literature [39, 62, 63], ecological considerations of the species, and expert judgment a total of 7 bioclimatic (4), soil (1), and topographic (2) variables were selected for modeling (Table 1). The methodology employed for the preparation of raster layers was executed within the R programming environment (Ver. 4.3.1) as well as ArcMap (10.8) software.
Table 1.
Environmental variables related to the distribution of Z. majdae and percent contribution (PC) and permutation importance (PI) of the selected variables
| Environmental variable | Description | Z. majdae | |
|---|---|---|---|
| PC | PI | ||
| Bio18 (mm) | Precipitation of warmest quarter | 31.3 | 10.2 |
| Bio19 (mm) | Precipitation of coldest quarter | 26.3 | 33.4 |
| Solar (kJ m-2 day-1) | Solar radiation | 26 | 41.5 |
| Slope | Slope percentage | 12 | 11.6 |
| pH | pH index | 2.5 | 1.4 |
| Bio6 (oC) | Min temperature of coldest month | 1.1 | 0.5 |
| Bio10 (oC) | Mean temperature of warmest quarter | 0.7 | 1.4 |
Distribution modeling
The Maximum Entropy (MaxEnt) model [64] was employed for the assessment of both current and upcoming habitat suitability for various species. MaxEnt (Version 1.0–3) was carried out via the “dismo” package (Version 1.3-9) (https://rspatial.org/raster/sdm/; [65]) within the R programming framework (Version 4.3.1) [66]. The evaluation of the models incorporated a 10-fold cross-validation methodology to ascertain error rates and to assess the strength of the models [67, 68]. In the course of this cross-validation methodology, the dataset was randomly partitioned into ten subsets, utilizing nine subsets for model calibration while reserving the final subset for model [68, 69]. When assessing the model’s predictive capabilities, the equal training sensitivity and specificity threshold from the MaxEnt output was considered optimal. Building on this, the changes in suitability based on a threshold of ≥ 0.5 between the present and future projections have been measured in the manuscript [70]. Habitat suitability was classified into four distinct categories based on threshold values applied to the suitability index: High Probability (≥ 0.71), Moderate Probability (0.70 − 0.31), Low Probability (0.30 − 0.11), and Very Low to Unsuitable (≤ 0.10) [71].
To forecast the current and future habitat suitability, a singular MaxEnt model was recalibrated using the comprehensive dataset. To demonstrate the potential future distributions of the species, climate projections for 2050 (average for 2041–2060) and 2070 (average for 2061–2080) were utilized. These climate projections were derived from an average of 16 general circulation models (GCMs) and accounted for two distinct greenhouse gas emission scenarios: a semi-optimistic scenario (RCP4.5) and a more pessimistic scenario (RCP8.5). The environmental variables were standardized to a consistent spatial resolution of 30 s in latitude and longitude. Utilizing ArcGIS software (Version 10.8), habitat suitability maps were produced for each species under both current and anticipated climate scenarios.
Model evaluation
The efficacy of the model was evaluated utilizing the receiver operating characteristic curve (ROC) alongside the area under the ROC curve (AUC) and the true skill statistic (TSS). The AUC value acts as a direct indicator of the precision of the model’s predictions. The AUC metric is considered a significant parameter for assessing model performance as it remains uninfluenced by the selection of thresholds [72, 73]. The AUC illustrates the model’s capability to differentiate between genuine events and coincidental occurrences from the background [74]. Generally ranging from 0 to 1, an elevated AUC value signifies superior model performance [15]. AUC values within the range of 0 to 0.5 denote exceedingly poor model predictions, AUC values from 0.6 to 0.9 indicate moderate predictive capability, while AUC values exceeding 0.9 reflect exellent predictive performance [15]. The TSS metric quantifies a model’s ability to correctly classify presences and absences for a defined threshold, and has been shown to be independent of species’ prevalence [56]. TSS values greater than 0.75 indicate very good model performance, values between 0.40 and 0.75 indicate moderate to good performance, and values below 0.40 reflect poor performance [75]. The comparative significance of each environmental variable in affecting species models was evaluated through the application of the Jackknife test, which is deemed the most appropriate metric for limited sample sizes [16, 64]. This test provide valuable understanding regarding the relevance of various environmental factors in the formation of species habitats [21].
Results
Performance of the model
The findings from the ROC curve validation and AUC-ROC analysis indicate that the MaxEnt model performed exceptionally well, achieving an AUC value of 0.977, and TSS value of 0.807 (threshold ≥ 0.5). Based on these results, we can reasonably conclude that the model used in this study was effective in predicting the habitat suitability for Z. majdae in the examined region.
Environmental drivers and habitat suitability
The environmental predictors used in the model included a combination of bioclimatic, topographic, and edaphic variables: solar radiation, slope percentage, soil pH, precipitation of the warmest quarter (Bio18), precipitation of the coldest quarter (Bio19), minimum temperature of the coldest month (Bio6), and mean temperature of the warmest quarter (Bio10).
According to the percent contribution values, Bio18 (31.3%) had the highest contribution to the model, followed by Bio19 (26.3%), solar radiation (26.0%), slope (12.0%), pH (2.5%), Bio6 (1.1%), and Bio10 (0.7%) (Table 1).
The response curves (Fig. 2) provided insights into the environmental factors influencing the distribution of Z. majdae. According to response curve, the likelihood of suitable habitat distribution for Z. majdae generally increases with higher values of Bio6, Bio18, Bio19 solar radiation, slope percentage, and pH index variables. Conversely, habitat suitability decreases as Bio10 values increase. Regarding climatic factors, Z. majdae showed a positive association with minimum temperatures of the coldest month (Bio6) between − 3 °C and 5 °C (Fig. 2A). Conversely, habitat suitability declined when mean temperature of the warmest quarter (Bio10) exceeded 28 °C (Fig. 2B). The species preferred precipitation of the warmest quarter (Bio18) values between 10 and 40 mm (Fig. 2C), and precipitation of the coldest quarter (Bio19) values more than 100 mm (Fig. 2D) In terms of topographic and edaphic variables, Z. majdae exhibited the highest suitability in areas receiving solar radiation levels between 12,000 and 14,000 kJ/m²/day (Fig. 2E), on slopes greater than 10° (Fig. 2F), and in soils with a pH ranging from 7.4 to 8.5 (Fig. 2G).
Fig. 2.

Predicted habitat suitability response of Z. majdae to environmental variables
The current and future suitable habitats of Z. majdae
The predicted possible habitat of Z.majdae created under the current circumstances is depicted on the map in Fig. 3. Modeling results indicate that Hormozgan and certain southern regions of the provinces of Fars and Kerman are high to moderate suitable habitats under the current conditions.
Fig. 3.
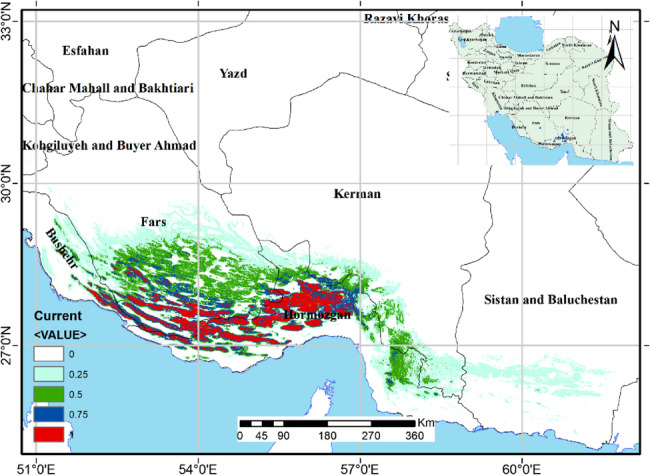
Current potential habitat suitability map of Z. majdae in southern Iran. The map shows the spatial distribution of suitable habitats based on current climatic and environmental conditions. Habitat suitability is classified into four categories based on predicted occurrence probability: Very low suitability (0–0.25), Low suitability (0.25–0.5), Moderate suitability (0.5–0.75), High suitability (0.75–1.0)
The Fig. 4 illustrate how the probable habitat suitablity of Z. majdae would vary in 2050 and 2070. Under several climate change scenarios, According to the findings, Iran’s anticipated climate change scenarios are expected to significantly alter the species’ habitat suitability (Fig. 4; Table 2). Under current conditions, a predominant portion of the study area (approximately 94.74%) is categorized as unsuitable habitat for Zhumeria majdae. In contrast, highly suitable habitat currently comprises only a small fraction, accounting for 0.63% of the total area. Low and moderately suitable habitats cover 2.76% and 1.87% respectively. Projections for 2050 under both RCP 4.5 and RCP 8.5 scenarios indicate a general trend of slight expansion in suitable habitats compared to current conditions. Specifically, the unsuitable area is projected to decrease, dropping to 94.12% under RCP 4.5 and 93.97% under RCP 8.5 by 2050. Concurrently, high suitability areas are projected to increase, reaching 0.82% (RCP 4.5–2050) and 0.88% (RCP 8.5–2050). Moderate suitability also shows an increase in these scenarios. Looking further to 2070, the trends become more complex. Under the RCP 4.5–2070 scenario, the high suitability area is projected to remain slightly higher than current levels at 0.77%. However, the most severe climate change scenario (RCP 8.5–2070) reveals a concerning shift. In this scenario, the high suitability area is projected to decrease to 0.60%, which is even lower than the current observed 0.63%. Although the total unsuitable area still decreases slightly from current levels to 94.31% in this scenario, the expansion of moderate suitability area is less pronounced compared to other future scenarios (2.21%). This suggests that while overall habitat suitability might shift, the most favorable conditions for Zhumeria majdae could diminish significantly under higher emission pathways by the end of the century.
Fig. 4.

Area of predicted habitat suitability classes for Z. majdae under different climate changes scenarios (RCP 4.5 and RCP 8.5 for 2050 and 2070). Values are presented in million square kilometers (10⁶ km²) of the total study area
Table 2.
Area of predicted habitat suitability classes for Z. majdae under different climate changes scenarios (RCP 4.5 and RCP 8.5 for 2050 and 2070).
| Scenarios | Unsuitable | Low_Suitable | Moderate _Suitable | High_Suitable | ||||
|---|---|---|---|---|---|---|---|---|
| m.km2 | % | m.km2 | % | m.km2 | % | m.km2 | % | |
| Current | 1.517584 | 94.74 | 0.044151 | 2.76 | 0.029951 | 1.87 | 0.010102 | 0.63 |
| 4.5–2050 | 1.50767 | 94.12 | 0.043434 | 2.71 | 0.037562 | 2.35 | 0.013122 | 0.82 |
| 8.5–2050 | 1.505194 | 93.97 | 0.043838 | 2.74 | 0.038733 | 2.42 | 0.014023 | 0.88 |
| 4.5–2070 | 1.506147 | 94.03 | 0.044699 | 2.79 | 0.038562 | 2.41 | 0.01238 | 0.77 |
| 8.5–2070 | 1.510677 | 94.31 | 0.046091 | 2.88 | 0.035434 | 2.21 | 0.009586 | 0.6 |
Values are presented in million square Kilometers (10⁶ km²) and percentage of the total study area
The distribution map presented in Fig. 5 illustrates the potential distribution of the studied species under future climate change scenarios. This map predicts areas with suitable environmental conditions for the species’ presence based on future climate modeling. As clearly depicted in Fig. 5, projected climate change will lead to a distinct spatial shift in suitable habitats for the species. Suitable habitats for the species in southern regions, particularly in the south of Hormozgan province, are predicted to decrease and may even become entirely unsuitable due to unfavorable climatic conditions (likely an increase in temperature and/or changes in precipitation patterns). This indicates a northward shift in habitat suitability. Conversely, new areas with favorable climatic conditions for the species are projected to emerge in the north of Hormozgan province, as well as in the southern parts of Kerman and Fars provinces. These regions, which might have been unsuitable for the species previously, will now become potential habitats due to climate change. This signifies an expansion towards higher latitudes and/or higher altitudes. Table 2 clearly demonstrates that the unsuitable class consistently covers the largest area across all scenarios, ranging from 93.97 to 94.74% of the study region. However, the most notable change is observed in the high suitability class, which shows a slight increase from the current 0.63% to a peak of 0.88% in the 2050 RCP 8.5 scenario, followed by a decline to 0.60% by 2070 under RCP 8.5.
Fig. 5.

Spatiotemporal projections of suitable habitat for Z. majdae under RCP 4.5 and RCP 8.5 climate change Scenarios in Southern Iran (2050 and 2070). A; RCP4.5-2050, B; RCP8.5-2050, C; RCP4.5-2070, D: RCP8.5-2070
The distribution range of Z. majdae may potentially vary as a result of a decline or rise in places with currently favorable conditions. According to Table 3, under RCPs 4.5–2050, 8.5–2050, and 4.5–2070, respectively, climate change is predicted to lead to habitat increases of 20.12%, 29.95%, and 21.63%, while under RCP 8.5–2070, it is expected to result in a decrease of -1.15%. In contrast, the south of Fars and Kerman provinces will be suitable habitats for Z. majdae in the future. Modeling results indicate that the most suitable habitat loss will occur at lower latitudes, resulting in the elimination of suitable habitats in the south of Hormozgan province (Fig. 4).
Table 3.
Projected habitat gain, loss, and range change for Z. majdae under two climate change scenarios—semi-optimistic (RCP4.5) and Pessimistic (RCP8.5) for the 2050s and 2070s
| Scenarios | Total range (Km2) | Stable | Loss | Gain | Range changes | |||||
|---|---|---|---|---|---|---|---|---|---|---|
| Km2 | Km2 | % | Km2 | % | Km2 | % | ||||
| Current | 29,537 | - | - | - | - | - | - | - | ||
| 4.5–2050 | 35,481 | 26,873 | 2664 | 9.02 | 8608 | 29.14 | 5944 | 20.12 | ||
| 8.5–2050 | 38,382 | 27,324 | 2213 | 7.49 | 11,058 | 37.44 | 8845 | 29.95 | ||
| 4.5–2070 | 35,927 | 25,461 | 4076 | 13.8 | 10,466 | 35.43 | 6390 | 21.63 | ||
| 8.5–2070 | 29,197 | 22,045 | 7492 | 25.36 | 7152 | 24.31 | -340 | -1.15 | ||
Discussion
The main environmental variables influencing distribution of Z. majdae and its current potential distribution
The utilization of species distribution models to identify suitable places for the presence of medicinal flora has been corroborated through extensive research [62, 76–78]. The spatial distribution of species is influenced by a plethora of variables. In the present study, the variables that most strongly influenced the potential distribution of Z. majdae included precipitation during the warmest quarter (Bio18), precipitation during the coldest quarter (Bio19), solar radiation, slope angle, and soil pH. Bio18 and Bio19 had the highest relative contributions (31.3% and 26.3%, respectively), underscoring the crucial role of seasonal precipitation in shaping the spatial pattern of this species. In contrast, temperature variables such as the minimum temperature of the coldest month (Bio6) and the mean temperature of the warmest quarter (Bio10) had limited influence, with contributions of only 1.1% and 0.7%, respectively. Response curve analysis revealed that Z. majdae exhibits ecological preferences that reflect its adaptation to semi-arid and montane environments. The species thrives in dry summer climates, with optimal suitability predicted in regions where precipitation during the warmest quarter (Bio18) ranges from 10 to 40 mm (Fig. 2C). Likewise, moderate winter precipitation levels between 100 and 150 mm (Bio19; Fig. 2D) were associated with high suitability, indicating that the species depends on sufficient, but not excessive, moisture during the dormant or early growth stages.
Although temperature variables played a minor role overall, response curves suggest that Z. majdae prefers mild winters, with minimum winter temperatures (Bio6) between − 3 °C and 5 °C (Fig. 2A), and moderate summer temperatures, with warmest-quarter means (Bio10) exceeded 28 °C (Fig. 2B). This reflects a thermophilic and no cold-tolerant nature, allowing it to occupy low to mid-elevation zones without exposure to frost. Prior research has underscored the significance of precipitation in determining plant distributions [79–81]. Shi et al. (2023) identified that excessively low temperatures and their duration constituted significant limiting factors during the overwintering phase of certain plant species, such as Magnolia wufengensis [82]. An investigation conducted by Gwitira et al. (2014) revealed that the precipitation during the warmest quarter and the temperature of the warmest month serve as essential bioclimatic variables elucidating variations in plant species richness in Zimbabwe [80]. Indeed, by modulating plant gas exchange and their long-term responses to changes of climate, alterations in precipitation, rather than global warming, may exert a more substantial influence on the productivity of grassland ecosystems [83]. Furthermore, in temperate and subtropical regions, the survival of plant species, particularly arboreal species, has been shown to be constrained by insufficient precipitation [84, 85]. Additionally, temperature constitutes a significant environmental factor impacting plant distribution. Particularly for tropical and subtropical species, low temperature (Bio6) typically serves as a primary factor restricting their northward expansion. Given the thermophilic characteristics of this species, this variable appears to be a constraining factor in the species’ dispersal towards higher northern latitudes. In line with these findings, several studies focusing on Iranian endemic plants have also highlighted the crucial role of precipitation. For instance, in a MaxEnt-based modeling study of Zataria multiflora, precipitation-related variables such as the precipitation of the driest quarter (BIO17) and the coldest quarter (BIO19) were among the main contributors to habitat suitability, alongside solar radiation and slope [18]. The study by Khajoei Nasab et al. (2020) on endemic Onosma species in Iran demonstrated that precipitation, slope, and temperature are the most influential factors affecting the distribution of these mountainous species [28]. Topographically, the species showed a marked preference for moderate slopes greater than 10° (Fig. 2F). Such terrains typically provide better drainage, reduced competition, and heterogeneous microhabitats that may buffer climatic extremes. The percentage of slope is instrumental in modulating the spatial distribution of soil nutrients, soil stability [86, 87], water availability, thermal conditions, and sunlight exposure [88]. It engenders a variety of microclimates characterized by distinctive soil properties, particularly within mountainous terrains such as those found in Iran [59, 89, 90]. The distribution patterns of flora in mountainous regions are significantly influenced by slope percentage, which is acknowledged as a fundamental topographic determinant [91]. Solar radiation emerged as another key variable, with optimal habitats receiving between 12,000 and 14,000 kJ/m²/day (Fig. 2E). High light availability likely supports the photosynthetic and phenological requirements of Z. majdae, particularly in the relatively open, sunlit landscapes of dry mountainous regions. This association underscores the species’ affinity for well-lit, exposed environments, possibly reflecting its physiological adaptation to high-radiation settings [93–95]. Soil pH was also a significant determinant, with response curves indicating optimal presence in slightly alkaline soils (pH 7.4 to 8.5) (Fig. 2G). These conditions are typical of calcareous soils in arid and semi-arid landscapes. Prior ecological studies have described Z. majdae as a lime-loving species that frequently inhabits alkaline rock slopes [97, 98]. This adaptation may facilitate nutrient uptake and microbial symbioses in these chemically distinct soil environments.
Spatial modeling (Fig. 3) predicted that the current suitable habitats for Z. majdae are primarily located in the mountainous areas of Hormozgan, Fars and Kerma Provinces, within the Sudano-Zambezian phytogeographic region, which includes savannas, dry woodlands, and semi-arid grasslands. These regions are marked by high topographic variation, with precipitation levels ranging from 300 mm in lowlands to 600 mm in highlands [99]. The species’ affinity for such environments underscores its adaptation to moderately moist winters, hot and dry summers, alkaline substrates, and elevated, sunny slopes, making it a typical representative of flora in arid mountain ecosystems [92].
Predict the future distribution of Z. majdae
Climate change has significantly influenced the geographical distribution of species, although the resulting effects depend on the species characteristics [58, 93, 94]. Due to the complex structure of the earth’s ecosystems, predicting the distribution pattern of species is very important to conservation management [95]. An understanding of the prospective contraction or expansion of habitats is of paramount importance for the conservation of rare and endangered species. Figure 5 comprehensively visualizes the projected spatial shifts in the suitable habitat for Z. majdae under different climate change scenarios. A comparative analysis of the four panels reveals a complex pattern of habitat stability, gains, and losses for Z. majdae. Notably, stable habitat for Z. majdae appears to be a significant component across all scenarios, particularly prominent in the central and eastern parts of the species’ current range, extending into parts of Fars and Kerman provinces. This suggests a degree of resilience or suitability persistence in these regions under projected climatic shifts. Habitat gains for Z. majdae are also evident, primarily concentrated in more inland and northern localities, potentially reflecting an expansion into newly favorable climatic envelopes. This indicates a northward or upward shift in suitable conditions, which is a common response of species to global warming (Fig. 6). However, the extent of these gains varies across scenarios. Conversely, habitat losses for Z. majdae are predominantly concentrated in the southern coastal and near-coastal regions, particularly in Hormozgan province. This pattern of loss in warmer, low-lying areas is consistent with expected negative impacts of rising temperatures and altered precipitation regimes [98, 99].
Fig. 6.

Latitudinal and altitude distribution of suitable habitat for Z.majdae under current and future climate scenarios (RCP 4.5 and RCP 8.5 for 2050 and 2070)
A crucial observation from the comparison of scenarios is that habitat losses tend to be more pronounced, and stable areas appear to diminish, under the higher emissions scenario (RCP 8.5) compared to the moderate emissions scenario (RCP 4.5), (Fig. 5; Table 2) for both 2050 and 2070. This pattern indicates that a higher magnitude of climate change could lead to more significant habitat contraction for Z. majdae. Furthermore, comparing the 2050 and 2070 projections within each RCP reveals a temporal exacerbation: losses generally expand, and stable areas potentially shrink over time, particularly under RCP 8.5 (Fig. 4; Tables 2 and 3), underscoring the escalating threat of climate change to Z. majdae’s habitat. These projections have critical implications for the conservation of Z. majdae. Based on these models, future protected areas or expansions of existing protected areas for Z. majdae should primarily prioritize the identification and safeguarding of the stable habitat areas, especially those that remain robust across different RCPs and timeframes. These stable zones represent crucial refugia that are likely to maintain suitable conditions for the species. Establishing protected areas or ecological corridors that link current stable habitats with future gain areas would facilitate natural range shifts and gene flow, allowing Z. majdae to adapt to changing climatic conditions. According to Fig. 7, the area classified as stable under the pessimistic 2070 scenario covers approximately 54.500 km², of which around 25.000 km² (equivalent to 45.8%) is located within two protected areas in Hormozgan Province. These regions currently support populations of the focal species.
Fig. 7.

Projected stable habitats for Zhumeria majdae under a pessimistic climate change scenario for the year 2070, overlaid with current protected areas
While loss areas, will become less suitable, they may still hold current populations, requiring immediate attention for monitoring or potential assisted relocation, though they are less ideal for long-term protected area establishment. Ultimately, a dynamic and adaptive conservation plan focusing on both current stable strongholds and future suitable expansion zones is essential for the long-term persistence of Z. majdae.
Figure 6 panel A and B illustrate the potential latitudinal and altitudinal shifts in the suitable habitat range of Z. majdae under current and future climate scenarios (RCP 4.5 and RCP 8.5 for the years 2050 and 2070). It indicate a clear tendency for the species’ suitable range to shift towards higher latitudes and elevations over time, particularly under more severe climate change scenarios (RCP 8.5). In the latitudinal distribution (Fig. 6A), a notable northward shift is evident in all future scenarios compared to the current distribution, which is in line with expectations of species’ responses to rising temperatures. This shift reflects the species’ movement toward cooler regions to maintain optimal ecological conditions. The altitudinal distribution (Fig. 6B) also shows an upward trend in elevation. The peak of habitat suitability density is progressively located at higher altitudes under future climate projections. This phenomenon is consistent with established patterns of species elevational migration in response to warming, as many organisms retreat to cooler, higher elevations to track suitable thermal environments [103, 104]. These observations support broader ecological findings that climate change drives shifts in species distributions along both latitudinal and altitudinal gradients [100–102]. Such range shifts may lead to habitat contraction or fragmentation, particularly for species with limited dispersal capabilities or narrow ecological niches. In response to rising temperatures driven by climate change, numerous species are expected to alter their latitudinal and altitudinal positions, migrating towards higher latitudes or elevations [103, 104]. For instance, research conducted by Zhang et al. (2021) predicts a contraction in the distribution of Xanthium italicum in the future, a change attributed to climate change [105]. Additional studies have indicated that climate change has a positive influence on the distribution of Aegilops triuncialis in Iran [24]. Although, according to the findings of our research, while certain regions in the southern part of Hormozgan province may prove unsuitable for the growth of Z. majdae, in north there will emerge new areas conducive to its growth, which is advantageous for its conservation and introduction (Fig. 5). Despite the beneficial influence of climate change on the dissemination of this species, the limited scope of its distribution, coupled with variables such as habitat degradation, infrastructure development, indiscriminate harvesting practices, and diminished reproductive capacity, will precipitate a significant decline in population numbers and consequently categorize it as endangered [38]. Moreover, the exceedingly diminished seed germination rates and the inadequate propagation frequency have resulted in ecological and biological vulnerability of this species [106]. In a comparable manner, Quercus castaneifolia is confronted with habitat degradation attributed to anthropogenic influences (e.g., forest thinning and degradation) [107]. Furthermore, various species of nectar-producing taxa [108], and Thymus (Hosseini et al., 2024) are anticipated to experience significant population declines as a consequence of alterations in land use and the concomitant loss of suitable habitats [108, 109]. Shi et al. (2023) identified that extremely low temperatures and their duration represent critical limiting factors during the overwintering phase of thermophilic species such as Magnolia wufengensis [82]. Based on the modeling outcomes and the findings of Soltanipoor et al. (2015), the species in question is classified as thermophilic [110].
Conclusion
The contemporary ecological modeling presents significant utility for rare plant taxa, particularly those for which only a restricted population persists in this region, characterized by the challenges of ecological sampling. Consequently, to enhance the efficacy of ecological models, it is imperative to incorporate alternative environmental variables within the species distribution model (SDM) to accurately forecast suitable habitats for both rare and threatened taxa. The response patterns to environmentale variables collectively define the ecological niche of Z. majdae and offer valuable insights into the environmental conditions most conducive to its persistence. The identified optimal ranges can inform habitat conservation efforts, ecological restoration projects, and predictive modeling of future distributions under various climate change scenarios. These projections underscore the importance of scenario-specific conservation strategies. Under RCP4.5, management efforts could focus on identifying and protecting newly suitable habitats to support range expansion. Under RCP8.5, urgent actions may be required to mitigate habitat loss through habitat restoration, managed relocation, or ex-situ conservation measures. Targeted monitoring and flexible management plans will be essential to respond to rapidly changing habitat dynamics driven by climate change. So, the establishment of plant micro-reserves in loss areas is an effective and cost-efficient strategy for the conservation of the fragmented and diminutive populations of this species.
Research limitations
Although, SDMs predominantly depict the fundamental ecological niches of species, but some factors such as interspecific competition and biotic interactions affecting the scope of a niche remain unexamined within this research. Conversely, the exclusive reliance on bioclimatic variables may cause systematic biases into the findings, while anthropogenic influences significantly contribute to the predictive modeling of future species distributions. Undoubtedly, the precision of SDMs is contingent upon the caliber of the data, particularly regarding the integration of human activity and species interactions, although such valuable data are frequently unavailable in regions analogous to our study area. Consequently, to enhance the accuracy of the MaxEnt model utilized in this research, we have incorporated a diverse array of environmental variables, including topographical and soil factors, alongside the bioclimatic variables.
Acknowledgements
Not applicable.
Author contributions
NH: Conceptualization, Writing—original draft, Visualization, Supervision, AM: Writing—review & editing, Validation, Methodology, FKN: Resources, Project administration, Methodology, review & editing, HM: Writing—review & editing, Formal analysis, MG: Resources, Methodology, Writing—review & editing.
Funding
Not applicable.
Data availability
The data will be available on request from any author.
Declarations
Ethics approval and consent to participate
All methods performed in this study including the collection of plant materials were in compliance with the relevant institutional, national, and international guidelines and legislation.
Consent for publication
Not applicable.
Competing interests
The authors declare no competing interests.
Footnotes
Publisher’s note
Springer Nature remains neutral with regard to jurisdictional claims in published maps and institutional affiliations.
Contributor Information
Naser Hosseini, Email: n-hosseini@araku.ac.ir.
Mansour Ghorbanpour, Email: m-ghorbanpour@araku.ac.ir.
References
- 1.Wang J, Qian Q, Zhang F, Jia XJ, He J. The possible future changes in potential suitable habitats of tetrastigma Hemsleyanum (Vitaceae) in China predicted by an ensemble model. Global Ecol Conserv. 2022;35:e02083. [Google Scholar]
- 2.Sękiewicz K, Salvà-Catarineu M, Walas Ł, Romo A, Gholizadeh H, Naqinezhad A et al. Consequence of habitat specificity: a rising risk of habitat loss for endemic and sub-endemic Woody species under climate change in the hyrcanian ecoregion. Reg Envriron Chang. 2024;24.
- 3.Della Rocca F, Milanesi P. The new dominator of the world: modeling the global distribution of the Japanese beetle under land use and climate change scenarios. Land. 2022;11:567. [Google Scholar]
- 4.Wang GG, Lu D, Gao T, et al. Climate-smart forestry: an AI-enabled sustainable forest management solution for climate change adaptation and mitigation. J Res. 2025;36:7. 10.1007/s11676-024-01802-x.
- 5.Wiens JJ, Zelinka J. How many species will Earth lose to climate change? Glob Change Biol. 2024;30:e17125. [DOI] [PubMed] [Google Scholar]
- 6.Weiskopf SR, Rubenstein MA, Crozier LG, Gaichas S, Griffis R, Halofsky JE, et al. Climate change effects on biodiversity, ecosystems, ecosystem services, and natural resource management in the united States. Sci Total Environ. 2020;733:137782. [DOI] [PubMed] [Google Scholar]
- 7.Staude IR, Navarro LM, Pereira HM. Range size predicts the risk of local extinction from habitat loss. Glob Ecol Biogeogr. 2020;29:16–25. [Google Scholar]
- 8.Subedi SC, Drake S, Adhikari B, et al. Climate-change habitat shifts for the vulnerable endemic oak species (Quercus Arkansana Sarg). J Res. 2024;35:23 10.1007/s11676-023-01673-8.
- 9.Beridze B, Sękiewicz K, Walas Ł, Thomas PA, Danelia I, Fazaliyev V, et al. Biodiversity protection against anthropogenic climate change: conservation prioritization of castanea sativa in the South Caucasus based on genetic and ecological metrics. Ecol Evol. 2023;13:e10068. [DOI] [PMC free article] [PubMed] [Google Scholar]
- 10.Lee H, Calvin K, Dasgupta D, Krinner G, Mukherji A, Thorne P et al. IPCC, 2023: Climate Change 2023: Synthesis Report, Summary for Policymakers. Contribution of Working Groups I, II and III to the Sixth Assessment Report of the Intergovernmental Panel on Climate Change [Core Writing Team, H. Lee and J. Romero, editors]. IPC. 2023.
- 11.Thomson AM, Calvin KV, Smith SJ, Kyle GP, Volke A, Patel P, et al. RCP4. 5: a pathway for stabilization of radiative forcing by 2100. Clim Change. 2011;109:77–94. [Google Scholar]
- 12.Hama AA, Khwarahm NR. Predictive mapping of two endemic oak tree species under climate change scenarios in a semiarid region: range overlap and implications for conservation. Ecol Inf. 2023;73:101930. [Google Scholar]
- 13.Naudiyal N, Wang J, Ning W, Gaire NP, Peili S, Yanqiang W, et al. Potential distribution of abies, picea, and Juniperus species in the sub-alpine forest of Minjiang headwater region under current and future climate scenarios and its implications on ecosystem services supply. Ecol Ind. 2021;121:107131. [Google Scholar]
- 14.Fois M, Cuena-Lombrana A, Fenu G, Cogoni D, Bacchetta G. The reliability of conservation status assessments at regional level: past, present and future perspectives on Gentiana Lutea L. Ssp. Lutea in Sardinia. J Nat Conserv. 2016;33:1–9. [Google Scholar]
- 15.Elith J, Phillips SJ, Hastie T, Dudík M, Chee YE, Yates CJ. A statistical explanation of maxent for ecologists. Divers Distrib. 2011;17:43–57. [Google Scholar]
- 16.Pearson RG, Raxworthy CJ, Nakamura M, Townsend Peterson A. Predicting species distributions from small numbers of occurrence records: a test case using cryptic geckos in Madagascar. J Biogeogr. 2007;34:102–17. [Google Scholar]
- 17.Khajoei Nasab F, Mehrabian A, Mostafavi H, Neemati A. The influence of climate change on the suitable habitats of allium species endemic to Iran. Environ Monit Assess. 2022;194. [DOI] [PubMed]
- 18.Hosseini N, Mostafavi H, Ghorbanpour M. Forecasting the future distribution of Zataria multiflora in Iran affected by climate change: a maxent approach. Integr Environ Assess Manag. 2025. vjaf043. [DOI] [PubMed]
- 19.Bashari H, Tarkesh M, Besalatpour AA. Identifying the determinant habitat characteristics influencing the Spatial distribution of ferula Ovina (Boiss.) in semiarid rangelands of Iran using machine learning methods. Ecol Complex. 2021;45 February:100909.
- 20.Hosseini N, Mostafavi H, Ghorbanpour M. The future range of two thymus daenensis subspecies in Iran under climate change scenarios: maxent model-based prediction. Genet Resour Crop Evol. 2024;:1–18.
- 21.Abdelaal M, Fois M, Fenu G, Bacchetta G. Using maxent modeling to predict the potential distribution of the endemic plant Rosa Arabica crép. In Egypt. Ecol Inf. 2019;50:68–75. [Google Scholar]
- 22.Khanum R, Mumtaz AS, Kumar S. Predicting impacts of climate change on medicinal asclepiads of Pakistan using maxent modeling. Acta Oecol. 2013;49:23–31. [Google Scholar]
- 23.Yang X-Q, Kushwaha SPS, Saran S, Xu J, Roy PS. MaxEnt modeling for predicting the potential distribution of medicinal plant, Justicia Adhatoda L. in lesser Himalayan foothills. Ecol Eng. 2013;51:83–7. [Google Scholar]
- 24.Hosseini N, Mehrabian A, Mostafavi H. Modeling climate change effects on Spatial distribution of wild Aegilops L.(Poaceae) toward food security management and biodiversity conservation in Iran. Integr Environ Assess Manag. 2022;18:697–708. [DOI] [PubMed] [Google Scholar]
- 25.Hosseini N, Mostafavi H, Sadeghi SMM. Impact of climate change on the future distribution of three ferulago species in Iran using the maxent model. Integrated Environmental Assessment and Management; 2024. [DOI] [PubMed]
- 26.Ma B, Sun J. Predicting the distribution of stipa purpurea across the Tibetan plateau via the maxent model. BMC Ecol. 2018;18:1–12. [DOI] [PMC free article] [PubMed] [Google Scholar]
- 27.Noroozi J, Talebi A, Doostmohammadi M, Manafzadeh S, Asgarpour Z, Schneeweiss GM. Endemic diversity and distribution of the Iranian vascular flora across phytogeographical regions, biodiversity hotspots and areas of endemism. Sci Rep. 2019;9:12991. [DOI] [PMC free article] [PubMed] [Google Scholar]
- 28.Khajoei Nasab F, Mehrabian A, Mostafavi H. Mapping the current and future distributions of Onosma species endemic to Iran. J Arid Land. 2020;12:1031–45. [Google Scholar]
- 29.Valavi R, Shafizadeh-Moghadam H, Matkan AA, Shakiba A, Mirbagheri B, Kia SH. Modelling climate change effects on Zagros forests in Iran using individual and ensemble forecasting approaches. Theoret Appl Climatol. 2019;137:1015–25. [Google Scholar]
- 30.Soltanipour MA, Jamzad Z, Jalili A, Mahmoodi M. The conservation status of Zhumeria majdae, an endemic species of Iran. Iran Nat. 2020;5:91–6. [Google Scholar]
- 31.Safa O, Soltanipoor MA, Rastegar S, Kazemi M, Dehkordi KN, Ghannadi A. An ethnobotanical survey on hormozgan province, Iran. Avicenna J Phytomedicine. 2013;3:64. [PMC free article] [PubMed] [Google Scholar]
- 32.Moein S, Moein MR. Relationship between antioxidant properties and phenolics in Zhumeria Majdae. J Med Plants Res. 2010;4:517–21. [Google Scholar]
- 33.Hosseinzadeh H, Ramezani M, Fadishei M, Mahmoudi M. Antinociceptive, anti-inflammatory and acute toxicity effects of Zhumeria Majdae extracts in mice and rats. Phytomedicine. 2002;9:135–41. [DOI] [PubMed] [Google Scholar]
- 34.Ekrami A, Ghadermazi M, Ekrami M, Hosseini MA, Emam-Djomeh Z, Hamidi-Moghadam R. Development and evaluation of Zhumeria Majdae essential oil-loaded nanoliposome against multidrug-resistant clinical pathogens causing nosocomial infection. J Drug Deliv Sci Technol. 2022;69:103148. [Google Scholar]
- 35.Moein MR, Pawar RS, Khan SI, Tekwani BL, Khan IA. Antileishmanial, antiplasmodial and cytotoxic activities of 12, 16-dideoxy aegyptinone B F.om Zhumeria Majdae rech. F. & wendelbo. Phytotherapy research: an international journal devoted to Pharmacological and toxicological evaluation of natural product derivatives. 2008;22:283–5. [DOI] [PubMed]
- 36.Dizajeyekan YI, Haghighi AR, Gajoti TE. Regional altitude and soil physicochemical factors ınfluence the essential oil of thymus pubescens (Lamiales: Lamiaceae). 2016.
- 37.Khosravi K, Mamaghani AM, Hosseinzadeh H. Pharmacological and toxicity effects of Zhumeria Majdae and its bioactive constituents: A review. Iran J Basic Med Sci. 2023;26:255. [DOI] [PMC free article] [PubMed] [Google Scholar]
- 38.Soltanipoor MA, Asadpour R. Flora, life form and chorology of Dehgin basin, hormozgan Province. J Plant Res (Iranian J Biology). 2020;33:662–76. [Google Scholar]
- 39.Jamzad Z. FLORA OF IRAN(lamiaceae). Iran. Tehran: Research Institute of Forests and Rangelands; 2012. [Google Scholar]
- 40.Rechinger K. Flora iranica, labiatae, akademische Druke-u. Verlagsanstalt Graz Austria. 1982;150:479–80. [Google Scholar]
- 41.RECHINGER KH, Wendelbo P. ZHUMERIA MAJDAE. NYTT. 1967.
- 42.Yousefzadeh S, Abedi R, Mokhtassi-Bidgoli A. Which environmental factors are more important for geographic distributions of thymus species and their physio-morphological and phytochemical variations? Arab J Geosci. 2021;14:1864. [Google Scholar]
- 43.Erfanian MB, Sagharyan M, Memariani F, Ejtehadi H. Predicting range shifts of three endangered endemic plants of the Khorassan-Kopet Dagh floristic Province under global change. Sci Rep. 2021;11:9159. [DOI] [PMC free article] [PubMed] [Google Scholar]
- 44.Chitale V, Behera MD. How will forest fires impact the distribution of endemic plants in the Himalayan biodiversity hotspot? Biodivers Conserv. 2019;28:2259–73. [Google Scholar]
- 45.Dagnino D, Guerrina M, Minuto L, Mariotti MG, Médail F, Casazza G. Climate change and the future of endemic flora in the South Western alps: relationships between niche properties and extinction risk. Reg Envriron Chang. 2020;20:121. [Google Scholar]
- 46.Loarie SR, Carter BE, Hayhoe K, McMahon S, Moe R, Knight CA, et al. Climate change and the future of california’s endemic flora. PLoS ONE. 2008;3:e2502. [DOI] [PMC free article] [PubMed] [Google Scholar]
- 47.Mkala EM, Mutinda ES, Wanga VO, Oulo MA, Oluoch WA, Waswa EN, et al. Modeling impacts of climate change on the potential distribution of three endemic Aloe species critically endangered in East Africa. Ecol Inf. 2022;71:101765. [Google Scholar]
- 48.Mahmoodi S, Heydari M, Ahmadi K, Khwarahm NR, Karami O, Almasieh K, et al. The current and future potential geographical distribution of Nepeta Crispa willd., an endemic, rare and threatened aromatic plant of iran: implications for ecological conservation and restoration. Ecol Ind. 2022;137:108752. [Google Scholar]
- 49.Zandi H, Rahimi H. 2-D surface wave tomography in the Northwest part of the Iranian plateau. J Earth Space Phys. 2020;45:133–42. [Google Scholar]
- 50.Djamali M, Akhani H, Khoshravesh R, Andrieu-Ponel V, Ponel P, Brewer S. Application of the global bioclimatic classification to iran: implications for Understanding the modern vegetation and biogeography. Ecol Mediterranea. 2011;37:91–114. [Google Scholar]
- 51.Paroon S, Yavari GR, Rezazadeh M. Impacts of climate change on watermelon and cucumber agriculture in hormozgan Province and prediction of long-term pattern. Geograp Res. 2019;34:347–55. [Google Scholar]
- 52.Najafi Shabankareh K, Khosroshahi M, Gholampoor M. Determination of the geographical domain of hormozgan Province desert area in vegetation view. Iran J Range Desert Res. 2008;15:95–113. [Google Scholar]
- 53.Takhtajan A. Floristic regions of the world. Taxon. 1987;36:672. [Google Scholar]
- 54.Thiers B. Index Herbariorum: a global directory of public herbaria and associated staff. New York Garden’s Virtual Herbarium. New York Garden‘s Virtual Herbarium. 2022. http://sweetgum.nybg.org/ih
- 55.Khan AM, Li Q, Saqib Z, Khan N, Habib T, Khalid N, et al. MaxEnt modelling and impact of climate change on habitat suitability variations of economically important Chilgoza pine (Pinus Gerardiana Wall.) in South Asia. Forests. 2022;13:715. [Google Scholar]
- 56.Bucklin DN, Basille M, Benscoter AM, Brandt LA, Mazzotti FJ, Romanach SS, et al. Comparing species distribution models constructed with different subsets of environmental predictors. Divers Distrib. 2015;21:23–35. [Google Scholar]
- 57.Elith J, Graham H, Anderson CP, Dudík R, Ferrier M, Guisan S. Novel methods improve prediction of species’ distributions from occurrence data. Ecography. 2006;29:129–51. [Google Scholar]
- 58.Wu Y-M, Shen X-L, Tong L, Lei F-W, Mu X-Y, Zhang Z-X. Impact of past and future climate change on the potential distribution of an endangered montane shrub lonicera oblata and its conservation implications. Forests. 2021;12:125. [Google Scholar]
- 59.Momeni Damaneh J, Ahmadi J, Rahmanian S, Sadeghi SMM, Nasiri V, Borz SA. Prediction of wild pistachio ecological niche using machine learning models. Ecol Inf. 2022;72:101907. [Google Scholar]
- 60.Yang M, Sun L, Yu Y, Zhang H, Malik I, Wistuba M, et al. Predicting the potential geographical distribution of Rhodiola L. in China under climate change scenarios. Plants. 2023;12:1397. [DOI] [PMC free article] [PubMed] [Google Scholar]
- 61.Zeng Y, Low BW, Yeo DCJ. Novel methods to select environmental variables in maxent: a case study using invasive crayfish. Ecol Model. 2016;341:5–13. [Google Scholar]
- 62.Asadpoor R, Soltanipoor MA. Study of some ecological characteristics of Zataria multiflora in hormozgan Province. Iran J Med Aromatic Plants Res. 2005;21:161–73. [Google Scholar]
- 63.Edalat M, Jahangiri E, Dastras E, Pourghasemi HR. Prioritization of effective factors on Zataria multiflora habitat suitability and its Spatial modeling. Elsevier Inc.; 2019.
- 64.Phillips SJ, Anderson RP, Schapire RE. Maximum entropy modeling of species geographic distributions. Ecol Model. 2006;190:231–59. [Google Scholar]
- 65.Hijmans RJ, Phillips S, Leathwick J, Elith J, Hijmans MRJ. Package ‘dismo ’ Circles. 2017;9:1–68. [Google Scholar]
- 66.R Core Team (2018) R: a language and environment for statistical computing. R Foundation for Statistical Computing, Vienna. https://www.R-project.org
- 67.Maruthadurai R, Das B, Ramesh R. Predicting the invasion risk of rugose spiraling whitefly, aleurodicus rugioperculatus, in India based on CMIP6 projections by maxent. Pest Manag Sci. 2023;79:295–305. [DOI] [PubMed] [Google Scholar]
- 68.Makki T, Mostafavi H, Matkan AA, Valavi R, Hughes RM, Shadloo S, et al. Predicting climate heating impacts on riverine fish species diversity in a biodiversity hotspot region. Sci Rep. 2023;13:14347. [DOI] [PMC free article] [PubMed] [Google Scholar]
- 69.Valavi R, Elith J, Lahoz-Monfort JJ, Guillera-Arroita G, blockCV. An r package for generating spatially or environmentally separated folds for k-fold cross-validation of species distribution models. Methods Ecol Evol. 2019;10:225–32. [Google Scholar]
- 70.Liu C, White M, Newell G. Selecting thresholds for the prediction of species occurrence with presence-only data. J Biogeogr. 2013;40:778–89. [Google Scholar]
- 71.Omar K, Elgamal I. IUCN red list and species distribution models as tools for the conservation of poorly known species: a case study of endemic plants micromeria Serbaliana and Veronica kaiseri in South sinai, Egypt. Kew Bull. 2021;76:477–96. [Google Scholar]
- 72.Yi Yjun, Cheng X, Yang ZF, Zhang SH. MaxEnt modeling for predicting the potential distribution of endangered medicinal plant (H. riparia Lour) in yunnan, China. Ecol Eng. 2016;92:260–9. [Google Scholar]
- 73.Fois M, Cuena-Lombraña A, Fenu G, Bacchetta G. Using species distribution models at local scale to guide the search of poorly known species: review, methodological issues and future directions. Ecol Model. 2018;385:124–32. [Google Scholar]
- 74.Phillips SJ, Dudík M, Elith J, Graham CH, Lehmann A, Leathwick J, et al. Sample selection bias and presence-only distribution models: implications for background and pseudo-absence data. Ecol Appl. 2009;19:181–97. [DOI] [PubMed] [Google Scholar]
- 75.Eskildsen A, le Roux PC, Heikkinen RK, Høye TT, Kissling WD, Pöyry J, et al. Testing species distribution models across space and time: high latitude butterflies and recent warming. Glob Ecol Biogeogr. 2013;22:1293–303. [Google Scholar]
- 76.Hosseini N, Ghorbanpour M, Mostafavi H. Habitat potential modelling and the effect of climate change on the current and future distribution of three thymus species in Iran using maxent. Sci Rep. 2024;14:269. [DOI] [PMC free article] [PubMed] [Google Scholar]
- 77.Hosseini N, Ghorbanpour M, Mostafavi H. The influence of climate change on the future distribution of two thymus species in iran: maxent model-based prediction. BMC Plant Biol. 2024;24:269. [DOI] [PMC free article] [PubMed] [Google Scholar]
- 78.Mahmoodi S, Ahmadi K, Zahravi M, Karami O. Modeling of Iranian oak distribution in the Southwest of Iran based on the presence-based approach maximum entropy (MaxEnt). For Res Dev. 2022;8:113–31. [Google Scholar]
- 79.Shi P, Preisler HK, Quinn BK, Zhao J, Huang W, Röll A, et al. Precipitation is the most crucial factor determining the distribution of Moso bamboo in Mainland China. Global Ecol Conserv. 2020;22:e00924. [Google Scholar]
- 80.Gwitira I, Murwira A, Shekede MD, Masocha M, Chapano C. Precipitation of the warmest quarter and temperature of the warmest month are key to Understanding the effect of climate change on plant species diversity in Southern African Savannah. Afr J Ecol. 2014;52:209–16. [Google Scholar]
- 81.Zeppel MJB, Wilks JV, Lewis JD. Impacts of extreme precipitation and seasonal changes in precipitation on plants. Biogeosciences. 2014;11:3083–93. [Google Scholar]
- 82.Shi X, Yin Q, Sang Z, Zhu Z, Jia Z, Ma L. Habitat distribution pattern of rare and endangered plant Magnolia wufengensis in China under climate change. Forests. 2023;14.
- 83.Wu G, Cheng Z, Alatalo JM, Zhao J, Liu Y. Climate warming consistently reduces grassland ecosystem productivity. Earth’s Future. 2021;9:e2020EF001837. [Google Scholar]
- 84.Allen CD, Macalady AK, Chenchouni H, Bachelet D, McDowell N, Vennetier M, et al. A global overview of drought and heat-induced tree mortality reveals emerging climate change risks for forests. For Ecol Manag. 2010;259:660–84. [Google Scholar]
- 85.Aguirre-Gutiérrez J, Oliveras I, Rifai S, Fauset S, Adu-Bredu S, Affum-Baffoe K, et al. Drier tropical forests are susceptible to functional changes in response to a long-term drought. Ecol Lett. 2019;22:855–65. [DOI] [PubMed] [Google Scholar]
- 86.Abdi E, Saleh HR, Majnonian B, Deljouei A. Soil fixation and erosion control by haloxylon persicum roots in arid lands, Iran. J Arid Land. 2019;11:86–96. [Google Scholar]
- 87.Deljouei A, Cislaghi A, Abdi E, Borz SA, Majnounian B, Hales TC. Implications of Hornbeam and Beech root systems on slope stability: from field and laboratory measurements to modelling methods. Plant Soil. 2023;483:547–72. [Google Scholar]
- 88.Farahnak M, Mitsuyasu K, Jeong S, Otsuki K, Chiwa M, Sadeghi SMM, et al. Soil hydraulic conductivity differences between upslope and downslope of two coniferous trees on a hillslope. J for Res. 2019;24:143–52. [Google Scholar]
- 89.Douaihy CB, Restoux G, Machon N, Dagher-Kharrat MB. Ecological characterization of the Juniperus excelsa stands in Lebanon. Ecologia Mediterranea. 2013;39:169–80. [Google Scholar]
- 90.Santos X, Brito JC, Sillero N, Pleguezuelos JM, Llorente GA, Fahd S, et al. Inferring habitat-suitability areas with ecological modelling techniques and GIS: a contribution to assess the conservation status of Vipera latastei. Biol Conserv. 2006;130:416–25. [Google Scholar]
- 91.Oke OA, Thompson KA. Distribution models for mountain plant species: the value of elevation. Ecol Model. 2015;301:72–7. [Google Scholar]
- 92.Zohary M. Geobotanical foundations of the middle East. Fischer; 1973.
- 93.Amiri MJ, Eslamian SS. Investigation of climate change in Iran. J Environ Sci Technol. 2010;3:208–16. [Google Scholar]
- 94.Zhang X, Yuan Y, Zhu Z, Ma Q, Yu H, Li M et al. Predicting the distribution of Oxytropis ochrocephala bunge in the source region of the yellow river (China) based on uav sampling data and species distribution model. Remote Sens. 2021;13.
- 95.Pearson RG, Dawson TP. Predicting the impacts of climate change on the distribution of species: are bioclimate envelope models useful? Global ecology and biogeography. 2003;12:361–71.
- 96.Shen M, Piao S, Dorji T, Liu Q, Cong N, Chen X, et al. Plant phenological responses to climate change on the Tibetan plateau: research status and challenges. Natl Sci Rev. 2015;2:454–67. [Google Scholar]
- 97.Zhao D, Wei M, Wang X, Aqeel M, Ran J, Deng J. Morpho-physiological adaptations to drought stress in nitrogen-fixing and non-nitrogen-fixing plants. Front Ecol Evol. 2024;12:1407882. [Google Scholar]
- 98.Miranda Jd, Armas D, Padilla C, Pugnaire FM. Climatic change and rainfall patterns: effects on semi-arid plant communities of the Iberian Southeast. J Arid Environ. 2011;75:1302–9. [Google Scholar]
- 99.Wertin TM, Reed S, Belnap J. The effect of increased temperature and altered precipitation on plants in an arid ecosystem. In: AGU Fall Meeting Abstracts. 2011. p. GCD33–01.
- 100.Guo F, Lenoir J, Bonebrake TC. Land-use change interacts with climate to determine elevational species redistribution. Nat Commun. 2018;9:1315. [DOI] [PMC free article] [PubMed] [Google Scholar]
- 101.Lenoir J, Gégout J-C, Marquet PA, de Ruffray P, Brisse H. A significant upward shift in plant species optimum elevation during the 20th century. Science. 2008;320:1768–71. [DOI] [PubMed] [Google Scholar]
- 102.Zu K, Wang Z, Zhu X, Lenoir J, Shrestha N, Lyu T, et al. Upward shift and elevational range contractions of subtropical mountain plants in response to climate change. Sci Total Environ. 2021;783:146896. [DOI] [PubMed] [Google Scholar]
- 103.Griffith B, Scott JM, Adamcik R, Ashe D, Czech B, Fischman R, et al. Climate change adaptation for the US National wildlife refuge system. Environ Manage. 2009;44:1043–52. [DOI] [PubMed] [Google Scholar]
- 104.Ramalho Q, Vale MM, Manes S, Diniz P, Malecha A, Prevedello JA. Evidence of stronger range shift response to ongoing climate change by ectotherms and high-latitude species. Biol Conserv. 2023;279:109911. [Google Scholar]
- 105.Zhang Y, Tang J, Ren G, Zhao K, Wang X. Global potential distribution prediction of xanthium italicum based on maxent model. Sci Rep. 2021;11:16545. [DOI] [PMC free article] [PubMed] [Google Scholar]
- 106.Jalili A, Jamzad Z. Red data book of iran; a preliminary survey of endemic, rare and endangered plant species in iran; research Institute of forest and rangelands; ministry of Jahad-e Sazandegi. Tech. 1999;215:748. [Google Scholar]
- 107.Shahnaseri G, Malekian M, Pourmoghadam K. Habitat loss of the chestnut-leaved oak (Quercus castaneifolia) in the hyrcanian forests of iran: impacts of anthropogenic factors on forest thinning and degradation. Global Ecol Conserv. 2023;46:e02600. [Google Scholar]
- 108.Zeraatkar A, Khajoei Nasab F. Mapping the habitat suitability of endemic and sub-endemic almond species in Iran under current and future climate conditions. Environ Dev Sustain. 2023;:1–18.
- 109.Taleshi H, Jalali SG, Alavi SJ, Hosseini SM, Naimi B, Zimmermann NE. Climate change impacts on the distribution and diversity of major tree species in the temperate forests of Northern Iran. Reg Envriron Chang. 2019;19:2711–28. [Google Scholar]
- 110.Soltanipoor MA, Jonoubi P, Hejazi SMH, Mirza M. Effect of some ecological factors on quantity and quality of the essential oils of Zhumeria Majdae. J Med Plants By-Products. 2015;4:45–50. [Google Scholar]
Associated Data
This section collects any data citations, data availability statements, or supplementary materials included in this article.
Data Availability Statement
The data will be available on request from any author.