

Abstract
Microbubbles (MBs) hold substantial promise for medical imaging and therapy; nonetheless, knowledge gaps persist between composition, structure and in vivo performance, especially with respect to pharmacokinetics. Of particular interest is the role of the poly(ethylene glycol) (PEG) layer, which is thought to shield the MB against opsonization and rapid clearance but is also known to cause an antibody response upon multiple injections. The goal of this study was, therefore, to elucidate the role of the PEG layer in circulation persistence of MBs in the naïve animal (prior to an adaptive immune response). Here, we directly observe the number and size of individual MBs obtained from blood samples, unifying size and concentration into the microbubble volume dose (MVD) parameter. This approach enables direct evaluation of the pharmacokinetics of intact MBs, comprising both the lipid shell and gaseous core, rather than separately assessing the lipid or gas components. We examined the in vivo circulation persistence of 3-μm diameter phospholipid-coated MBs with three different mPEG2000 content: 2 mol% (mushroom), 5 mol% (intermediate) and 10 mol% (brush). MB size and concentration in the blood were evaluated by a hemocytometer analysis over 30 min following intravenous injections of 20 and 40 μL/kg microbubble volume dose in Sprague-Dawley rats. Interestingly, pharmacokinetic analysis demonstrated that increasing PEG concentration on the MB surface resulted in faster clearance. This was evidenced by a 1.6-fold reduction in half-life and area-under-the-curve (AUC) (p<0.05) in the central compartment. Conversely, the AUC in the peripheral compartment increased with PEG density, suggesting enhanced MB trapping by the mononuclear phagocyte system. This was supported by an in vitro assay, which showed a significant rise in complement C3a activation with higher PEG content. In conclusion, a minimal PEG concentration on the MB shell (mushroom configuration) was found to prolong circulation and mitigate immunogenicity.
Keywords: Poly(ethylene glycol) Configuration, Microbubble Volume Dose, Pharmacokinetics, Immune response
Graphical Abstract

1. Introduction
Microbubbles (MBs) are 1-10 μm diameter gas-filled microspheres, typically comprising a perfluorocarbon gas core and a thin stabilizing shell of phospholipid, protein or polymer.1–3 Owing to their versatile acoustic behavior, MBs hold great promise for ultrasound imaging and therapy.4–6 However, whether utilized in clinical or research practice, challenges persist in their formulations, characterized by limited in vivo circulation (usually 2–5 min) and variations in composition, size distribution, concentration and recommended dosage.7,8 These variations result in diverse acoustic responses,9,10 biological effects11,12 and biomedical outcomes,13–16 prompting the need to reveal interrelationships between MB composition and bio-interactions, while minimizing confounding effects of MB size distribution and dose. Such discoveries may inspire innovative approaches to extend MB circulation persistence, improve pharmacokinetics, establish standardized dosing and enhance clinical utility.
The complexity of assessing in vivo circulation through the echogenicity of MBs is a convoluted function of the ultrasound imaging system (including the transducer, pulsing, system transfer functions, image processing etc.), details of acoustic propagation through the imaged specimen, and multiple properties inherent to the MBs themselves (such as size, concentration, shell viscoelasticity, nonlinear response to the specific imaging pulse, inter-MB distance and multi-scattering, viscoelastic properties of the local microenvironment, etc.). Through direct observation of the circulating MBs, we have eliminated these confounding factors, providing a more accurate description of the MB pharmacokinetics,17 which may be more generally applied for ultrasound imaging and therapy, as well as other applications such as gas carriers.18
Efforts to boost the performance of lipid-coated MB formulations have primarily focused on modifying the physicochemical characteristics of their shells to prevent dissolution and phagocytosis. Research indicates that increasing the length of the zwitterionic lipid-saturated diacyl chains results in greater intermolecular cohesion,19,20 providing a more rigid shell19,21–24 that is less gas-permeable,25 thereby causing the MBs to persist longer in vivo26,27 and enhancing biomedical outcomes.28 Because these saturated long-chain diacyl lipids have very low critical micelle concentrations,29 polyethylene glycol (PEG)-conjugated lipids are added to facilitate shell formation and stabilization during MB synthesis.19,30 PEG-lipids with a polydisperse PEG weight of 2000 or 5000 Da are typically added at molar ratios of 5% to 10% of total lipid to achieve the intermediate to brush configuration,31 which is thought to reduce coalescence3,32 and opsonization.33 On the other hand, PEG-lipids are known to induce lateral phase separation on the MB surface34 and have been implicated in enhancing immunogenicity in nanoparticles,35 even leading to an adaptive immune response that decreases MB circulation time after multiple injections.12 Thus, while the need for PEG-lipids in MB formulation has been well-established, their role in bio-interactions and in vivo performance remains poorly understood.
This is made even more relevant by recent reports indicating that naïve individuals have pre-existing antibodies against PEG, potentially leading to the production of anti-immunoglobulin M (anti-IgM) in rodents or anti-immunoglobulin G (anti-IgG) in humans.36–39 These antibodies can bind to PEG, facilitating clearance through the activation of the immune complement pathway, potentially resulting in C3b-mediated phagocytosis, C3a/C5a-mediated hypersensitivity reactions, or accelerated blood clearance upon repeated administration.38,39 Therefore, understanding the interactions between PEGylated MBs and the host immune system is crucial, as it has potential implications for diagnostic and therapeutic applications.
Until recently, limited in vivo studies have explored the impact of PEGylated MBs on pharmacokinetics, clearance mechanisms and immune interactions. For targeted MBs, shielding the ligand-bearing PEG with a methyl-terminated PEG overbrush was found to reduce complement activation and increase circulation persistence.11,40,41 Fisher et al. 42 discovered that combining neutral phospholipids with PEGylated surfactants reduces C3b complement deposition on MBs. This reduction results in decreased MB retention in the lungs and heart, leading to improved pharmacokinetics. In a study by Fix et al.12 it was found that the repeated administration of PEGylated MBs, including commercial and laboratory MBs, results in accelerated clearance due to the development of anti-IgM antibodies, particularly in the liver.
When PEG is present at an interface, it can adopt either a brush or mushroom configuration, and this architecture depends on the PEG molecular weight and surface density.43 In clinical and research practice, most MB formulations predominantly employ the brush configuration. However, the reason for favoring high PEG densities in these formulations remains unexplained in current in vivo studies. Consequently, given emerging evidence suggesting that PEG may trigger immune activation, it is imperative to investigate the impact of PEG surface density on the pharmacokinetic behavior of MBs.
In our previous work, we introduced MB volume dose (MVD) as a standard metric, unifying the MB size distribution and concentration into a single dose parameter (μL/kg).44 This method allows direct assessment of the pharmacokinetics of intact MBs, comprising both the lipid shell and gaseous core, rather than the separately evaluating the lipid45,46 or gas components,47,48 as conducted in prior studies. Moreover, this innovation allowed us to directly explore in vivo MB pharmacokinetics across various sizes and MVDs, identifying a transition from mono- to bi-exponential clearance from 20 to 40 μL/kg.17 Additionally, we determined that the maximum MVD of freely circulating MBs is achieved at a diameter of 3 μm.17 Therefore, the purpose of this study was to comprehensively evaluate and analyze the in vivo pharmacokinetic behavior of different PEG-grafted densities on 3-μm diameter MBs at 20 and 40 μL/kg MVD. We also investigated the in vitro interaction between PEGylated MBs and complement C3 proteins to better understand the in vivo findings.
2. Materials and Methods
2.1. Materials
All solutions were prepared using filtered, sterile, deionized water (Direct-Q 3 Millipore, Billerica, MA). All glassware was thoroughly sanitized and cleaned using 70 vol% isopropyl alcohol (LabChem, Zelienople, PA). 1,2-Dibehenoyl-sn-glycero-3-phosphocholine (DBPC) was purchased from Avanti Polar Lipids (Alabaster, AL). Perfluorobutane gas (C4F10, PFB) was obtained from FluroMed (Round Rock, TX). N-(Methylpolyoxyethylene oxycarbonyl)-1,2-distearoyl-sn-glycero-3-phosphoethanolamine (DSPE-mPEG2000) was acquired from NOF America Corporation (White Plains, NY). Chloroform and sterile filtered citrate dextrose solution (ACD) were purchased from Sigma-Aldrich (St. Louis, MO). Sterile saline solution and phosphate-buffered saline solution (PBS) were obtained from Fisher Scientific (Pittsburg, PA). Water molecular biology grade was obtained from Research Products International (Mt. Prospect, IL). Heparin sodium 1000 UI was sourced from Pfizer/Hospira Inc. Human and Sprague Dawley rat serum (complement preserved) were purchased from BioIVT (Hicksville, NY). The serum was thawed once to aliquot into 1-mL Eppendorf tubes and stored at −80 °C. Enzyme-linked immunosorbent assay (ELISA) kits for rat C3/C3a (catalog no. MBS2503333), rat C3/C3b (catalog no. MBS9343415), and human C3/C3a (catalog no. MBS2021584) were purchased from MyBioSource (San Diego, CA) and the ELISA for human C3/C3b (catalog no. EC3301-1) was purchased from Assaypro LLC (St. Charles, MO). All reagents have a purity of ≥ 99% and were used as received without further purification.
2.2. Theoretical predictions of PEG-microbubble configuration
The conformation adopted by PEG is influenced by two key factors:43 the Flory radius of the PEG coils (),
| (1) |
and the grafting distance between the two nearest PEG anchors (D):
| (2) |
where a is the monomer length, N is the number of monomers per chain, is the area occupied per lipid and m is the mole fraction of PEG incorporated in the shell.
When the grafting density is low (), a mushroom configuration is formed. Conversely, a brush is formed at a higher grafting density ().43 The transition between the mushroom and brush configurations, referred to as an intermediate configuration (), becomes noticeable when the molar fraction of PEG2000 () is approximately 4-5 mol% (Table 1).49,50 To determine the PEG2000 chain’s configuration and obtain the RF and the corresponding D values (Table 1), we use the following values:
Table 1.
Microbubble shell PEG configurations calculated by Equations 1 and 2 with a = 0.35 nm, N = 45, Alipid = 0.476 nm2.20,49,50
| DBPC (%) | DSPE-mPEG2000 (mol %) | D (nm) | Configuration |
|---|---|---|---|
| 98 | 2 | 4.9 | Mushroom |
| 95 | 5 | 3.1 | Intermediate |
| 90 | 10 | 2.2 | Brush |
Here, we use the terms “mushroom”, “intermediate” and “brush” for PEG configuration, following the conventions for hydrophilic polymers grafted onto lipid monolayers and bilayers, defined by polymer Flory radius compared to the distance between grafting sites,51 as established in prior studies of PEG configurations on MBs.50,52 In this calculation, we assume that the PEGylated lipid mixes uniformly with DBPC in the lipid monolayer shell of the MB, and we neglect effects such as lateral phase separation,53,54 which may alter the true grafting density from our simple estimation. In designing our experiments, we used this calculation as a guide to estimate the necessary PEGylated lipid mol% to investigate effects of PEG configuration on the resulting MB pharmacokinetics.
2.3. Microbubble preparation and characterization
Phospholipid-coated MBs with a PFB gas core were prepared using the sonication technique as previously described.17,55 Briefly, mushroom, intermediate and brush MBs were engineered by adjusting the content of DSPE-PEG2000 to 2%, 5% and 10% in the mixture of DBPC and DSPE-PEG2000 (Figure 1A). Under sterile conditions, a dry lipid film was hydrated with filtered and sterile 1X PBS at 75 °C for 40 min, resulting in a final concentration of 2 mg/mL. The lipid solution was then sonicated using a 20-kHz probe (Model 250A, Branson Ultrasonics; Danbury, CT) at low power (3/10; 3 W) for 10 min. After sonication, the solution was allowed to cool to room temperature. Next, a polydisperse suspension of MBs was generated by subjecting the lipid solution to high-power sonication (10/10; 33 W) for 15 s in the presence of PFB gas. These polydisperse MBs underwent a series of washing and size-isolation steps through differential centrifugation, resulting in a monodisperse suspension of MBs with a mean diameter of 3 μm.17 The concentration and size distributions (number- and volume-weighted) of the MBs were measured using a Multisizer 3 Coulter Counter (Beckman Coulter). The MB gas volume fraction (φMB) was determined by integrating the area under the curve when plotting the MB concentration (c, MBs/mL) against the MB volume (μL), as defined by equation 3:5,7
| (3) |
Figure 1.

Experimental setup. A) Diagram illustrating the 3 μm size-selected microbubbles (MBs) showcasing different PEG content: 2 mol % (mushroom), 5 mol% (intermediate) and 10 mol% (brush). B) Intravenous injection of MBs and determination of the timepoint for collecting blood samples. C) Separation of MBs [hemocytometer top plane, buoyancy force (FB)] from red blood cells (RBCs) [hemocytometer bottom plane, orbital force (Forbital)] achieved through orbital shaking. D) Image preprocessing procedure to identify MBs within the collected blood samples: a) detection of MBs utilizing a normalized Kernel—Convolution filter, b) subtraction of RBC background and isolation of detected MBs using a convolution filter and c) MB detection utilizing the Analyze Particle script integrated into ImageJ software.
Three independent MB preparations were evaluated for each MB configuration and stored in the refrigerator at 4 °C for subsequent use.
2.4. Microbubble injection and blood withdrawals
All animal studies were conducted following the University of Colorado Boulder IACUC approval, using our previously reported method.17 We utilized adult male and female Sprague-Dawley rats (Charles River, Wilmington, MA), weighing 290-400 g with pre-catheterized jugular veins, in accordance with the National Institutes of Health Animal Care Guidelines. Rats were deeply anesthetized with an isoflurane-medical air mixture (2-3%, SomnoSuite®, Kent Scientific, Torrington, CT) and placed on a heated pad to maintain their body temperature.
Each PEG-MB configuration was injected at an MVD of 20 or 40 μL/kg using a blunt 23G needle at the pre-catheterized jugular site. After each administration, 100 μL of heparinized saline solution was flushed into the catheter to ensure MB injection and prevent catheter retention. Blood samples (100 μL) were collected from the catheter at 1, 2, 3, 4 and 5 min, and at 10, 20 and 30 min (Figure 1B). To ensure the collection of fresh blood at each interval, 100 μL of heparinized saline solution was flushed between collections, exceeding the dead volume of the catheter (50 μL). As a result, 7 blood samples were obtained for 20 μL/kg MVD and 8 samples for 40 μL/kg MVD, totaling 15 samples per rat. This cumulative sampling represents a blood volume of 1.5 mL, constituting <7% of the rat’s total blood volume. Following each collection, the blood was diluted in ACD solution at a volumetric ratio of 3:1 to prevent coagulation and was stored at 4 °C for MB measurement. Three different rats were used for each MVD to assess the pharmacokinetics of the three different PEG-MB configurations.
2.5. Microbubble detection in blood samples
The detection of MBs and quantification of MVD variations over time were conducted as previously described.17 Blood samples were diluted with sterile-filtered deionized water at a 50:50 ratio for 20 μL/kg or 25:75 for a 40 μL/kg MVD. Subsequently, 15 μL of each diluted sample was placed into a hemocytometer chamber (Hausser Scientific Phase Counter Chamber, Horsham, PA), where it underwent 5 min of orbital shaking at 100 rpm to separate MBs from red blood cells (RBCs) (Figure 1C). We then captured 16 microscope images per chamber from the top (4 images per quadrant) using a QI click 74-0083-A0 camera (exposure time = 30–60 ms, gain = 0.7) and 20× objective (UPLFLN, Olympus BX52, Tokyo, Japan) and analyzed them using ImageJ software (National Institutes of Health, Bethesda, MD). The resolving power of the 20× objective we employed is 0.67 μm, with an Abbe limit of 380 nm. To isolate MBs from RBCs, we applied different preprocessing filters: a Kernel convolution filter (center value 30-35) to enhance the edge of MBs (Figure 1D–a) and a convolution filter (center value 40-70) to eliminate RBC background (Figure 1D–b). The images were then binarized and MBs were quantified using the Analyze Particles script (Figure 1D–c). Blood samples were collected prior to MB injection to confirm the absence of MBs (Figure S1).
Finally, the MVD values at each time were calculated as follows:
| (4) |
where MVD represents the MVD in μL/kg; #MBsBW is the total number of MBs per mass of bodyweight (#MBsBW = (MBs/mL) hemocytometer × TVBBW); TVBBW is the total volume of blood in mL (TVBBW= 64 mL/kg × BW) and VMB is the mean volume of the total MBs counted at each time (μm3).
2.6. Pharmacokinetic analysis
As previously reported, one- and two-compartment models17 were used to analyze MVD pharmacokinetics profiles at 20 and 40 μL/kg MVD, respectively, using OriginPro 2021 software. Model selection was based on the shape of the MVD decay, with fittings exhibiting an R2≥0.98 chosen as the preferred model curves. Here we employ pharmacokinetics terminology typically used in biotransport56 and our prior study.17 The one-compartment model refers to the blood and any elimination mechanism (dissolution, trapping etc.). The two-compartment model simply refers to the central compartment (i.e., the blood) and the peripheral compartment (all tissues such as the lung, liver and spleen that may temporarily trap and/or permanently eliminate MBs). We do not mean to infer that the MBs are extravasating, nor do we refer to the biodistribution of the lipid shell debris as has been considered in other studies.45,46 For the one-compartment model (equation 5):56
| (5) |
Parameters estimated included the MVD of freely circulating MBs in the central compartment (C1) and the first-order clearance rate constant (ke). C0 was set to the initial MVD injected (20 μL/kg) and the time at which C0 is reached was theoretically calculated using the curve model fit. This fit allowed the calculation of key pharmacokinetic parameters: distribution volume (V1= TVBBW), clearance rate (ClB= V1ke), half-life (t1/2= ln(2)/ke) and area-under-the-curve (AUC1= C0/ke). For the two-compartment model (equation 6):56
| (6) |
representing a bi-exponential decay. Here, C1 is the MVD of freely circulating MBs in the central compartment, C0 is the initial MVD injected (40 μL/kg), α, λ1, and λ2 are hybrid constants to describe the distribution and the elimination phases. These constants are used to estimate the clearance rate constant (), mass transfer constants [, ], half-lives (t1/2(1) = ln(2)/ λ2 and t1/2(2) = ln(2)/ λ1), area-under-the-curve [, ], and clearance rate (). Where , V2 is the distribution volume of the peripheral compartment (C2), and V1 is the distribution volume of the central compartment. This ratio was calculated taking in account the mass of blood and rat organs at body weight.57,58
2.7. Measurements of microbubble surface area variation over time
MB surface area (SA) changes were determined over the course of time using image analysis on blood samples obtained during pharmacokinetic experiments. This analysis was conducted for both 20 and 40 μL/kg MVD across all PEG configurations. The following equation was employed for this estimation:
| (7) |
where , represents the mean MB SA calculated at each time point during the pharmacokinetic experiment and represents the mean MB SA calculated prior to the MB injection.
2.8. Human and rat complement-preserved serum C3b and C3a activity assay
The analysis of C3b and C3a activity analysis was conducted in both human and rat complement-preserved serum, with modifications to our previously described method.11 Initially, 1 mL of serum was preheated at 37 °C using a digital block heater (VWR; West Chester, PA) for 30 min. Next, an MB cake containing 20 and 40 μL/mL of φMB for each MB configuration was resuspended and incubated in 400 μL of either human or rat serum on a benchtop rotator for 2 h at room temperature. Following incubation, the samples were centrifugated at 100G for 5 min to collect the serum and remove the MBs. Finally, free C3b and C3a levels in the serum samples were measured following the manufacturer’s instructions. For rat serum, both undiluted and 1:8 dilutions were used, whereas, for human serum, dilutions of 1:800000 and 1:10000 dilution were employed, respectively.
2.9. Statistical Analysis
All data are expressed as the mean ± standard deviation. Differences between experimental groups were assessed using one-way ANOVA and Tukey test for multiple comparisons. Data were plotted and evaluated using GraphPad software (San Diego, CA). A p-value ≤ 0.05 was considered to indicate statistical significance.
3. Results and Discussion
3.1. Microbubble characterization
Size-isolated PEG-MBs with 2 mol%, 5 mol% and 10 mol% content yielded uniform MB suspensions characterized by spherical shapes and an absence of aggregation, as demonstrated in the microscopic images (Figure 2A). Monodispersity was further validated through narrow number- and volume-weighted distributions (DN% and DV%) exhibiting a single peak at approximately 3 μm in diameter (Figure 2B–C, Table 2). Prior research also indicated no changes in MB size when exposed to varying molar ratios and/or molecular weights of DSPE-PEG emulsifiers.50,59,60
Figure 2.

Characterization of size-isolated MBs. (A) Representative bright-filed microscopic images depict 3-μm diameter PEG-MBs with 2 mol% (purple), 5 mol% (orange) and 10 mol% (green). (B-C) Corresponding number- and volume-weighted size distributions. (D) MB concentration versus MB volume; gas volume fraction (φMB) is represented by the area-under-the-curve. Data represent the mean ± standard deviation for three different experiments.
Table 2.
MB characterization parameters obtained from the number- and volume-weighted distributions (DN% and DV%) and MB concentration vs. MB volume plot for each PEG configuration (Fig. 2D).
| mPEG2000 (mol%) | DN% (μm) | DV% (μm) | φMB @ 109 MBs/mL (μL/mL) |
|---|---|---|---|
| 2 | 2.6 ± 0.8 | 3.2 ± 0.8 | 11.3 ± 0.5 |
| 5 | 2.8 ± 0.6 | 3.2 ± 0.7 | 13.3 ± 1.0 |
| 10 | 3.0 ± 0.6 | 3.3 ± 0.7 | 15.1 ± 0.4 |
Non-PEGylated MBs (100% DBPC:0% PEG) were excluded as a control group due to their insufficient yield (3.4 ± 1.4 ×10⁸ MBs/mL), making them unsuitable for centrifugal size-isolation at 3 μm diameter MBs (Figure S2). Previous research has demonstrated the challenge in producing non-PEGylated MBs, primarily due to their inherent instability.50 Segers et. al. observed that the addition of PEG-lipid increased the viscosity during elongational flow in the thin intervening aqueous layer between MBs as they approach one another, thus preventing coalescence.61 Substantial coalescence was observed on their microfluidic platform in the absence of PEGylated lipid. Additionally, theoretical predictions showed that the PEG brush provides a strong and relatively long-range (tens of nm) repulsive force that resists coalescence.3 This highlights the importance of maintaining a minimum surface density (2 mol% PEG for our study) for successful MB generation and centrifugal size-isolation, particularly crucial prior to in vivo administration.
Interestingly, we found that PEG-MBs with 2 mol% exhibited a 1.5-fold higher concentration compared to 5 and 10 mol%. This observed concentration trend aligns with the findings reported by Azami et al.62 in their study involving polydisperse DPPC: DPPE-PEG2000 MB suspensions. It is worth noting that some studies have suggested an optimal concentration of 5% DSPE-PEG2000 for achieving maximum MB concentration.50 The decline in MB concentration relative to increasing PEG surface density can be attributed to the increased repulsive forces between PEG chains, disrupting of the phospholipid shell.50,63 Previous research via NMR spectroscopy established a linear correlation with unity slope between DSPE-PEG2000 concentrations (ranging from 0% to 20%) in the bulk solution and the MB shell following centrifugal washing.54 This study confirmed that centrifugation procedures for size isolation uphold the initial MB shell composition and preserve the different PEG configurations as theorized.
3.2. Pharmacokinetic analysis
3.2.1. One-compartment pharmacokinetic model
Intravenous administration of PEG-MBs with 2-, 5- and 10-mol% at a 20 μL/kg MVD revealed mono-exponential decay patterns, consistent with a one-compartment pharmacokinetic model (Figure 3A, solid lines). This model indicates that the primary mechanisms for MB clearance involve dissolution and elimination by the lungs.17 All three configurations exhibited circulation times under 20 min. Notably, the 10- and 5-mol% PEG configurations exhibited a slightly faster decay in MVD over time compared to the 2 mol% PEG configuration.
Figure 3.
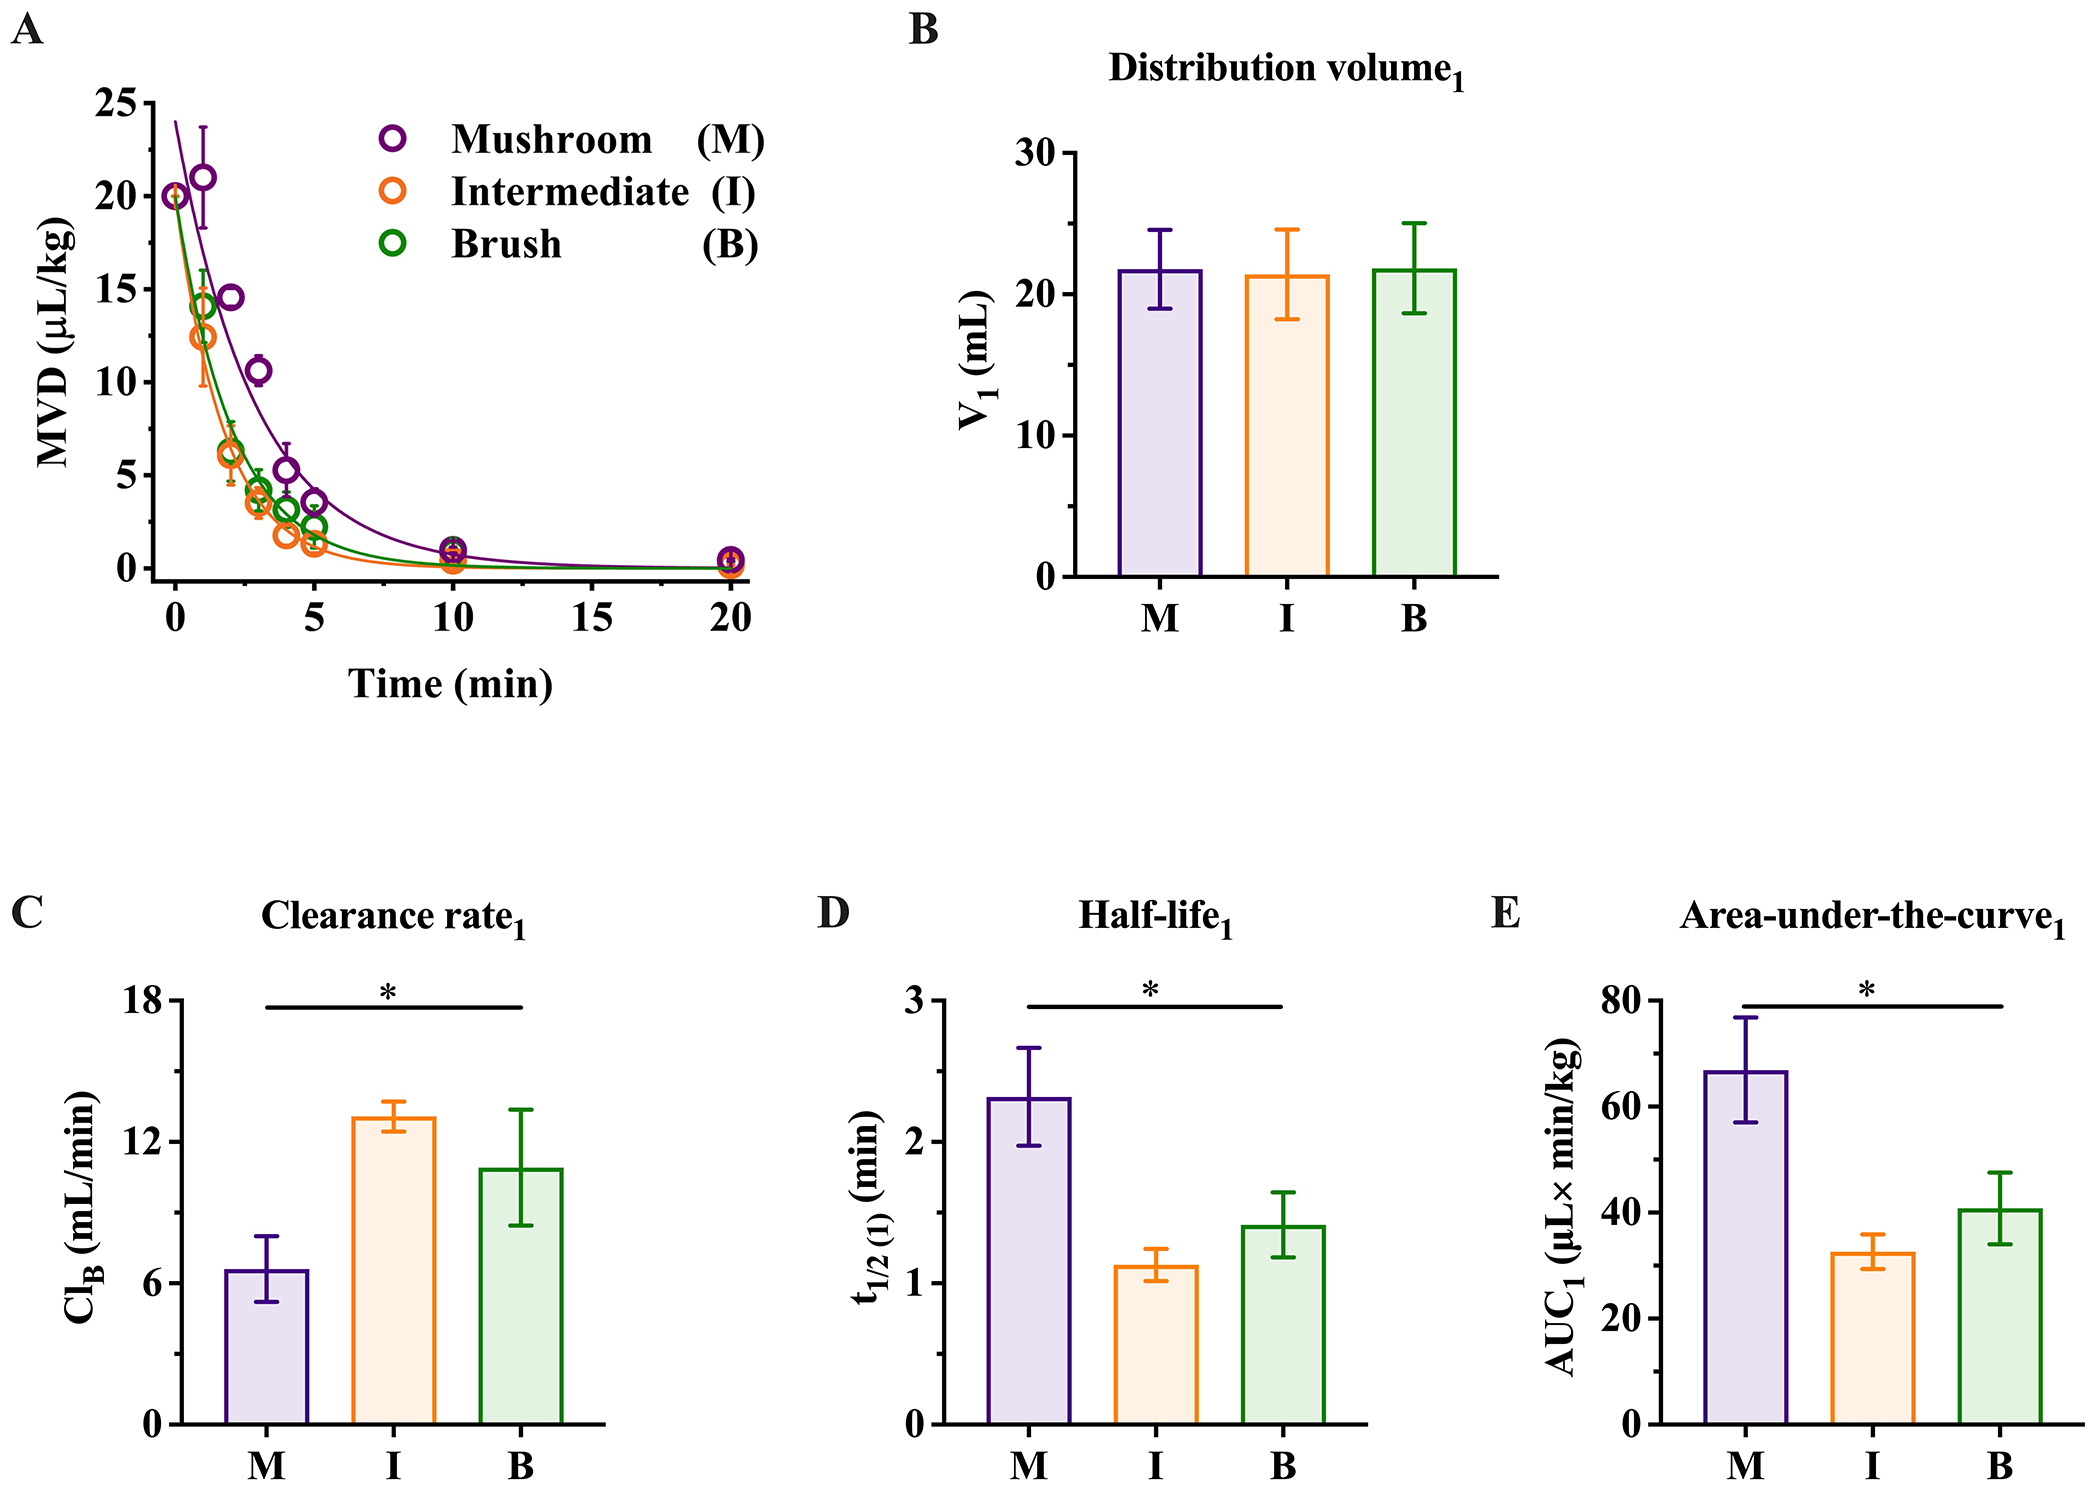
Analysis of the pharmacokinetic behavior in a one-compartment model for 2-, 5- and 10-mol % PEG-MBs configurations administered at 20 μL/kg MVD. (A) Pharmacokinetic profiles of MBs. The solid lines depict a monoexponentially decay fit with R2 ≥0.98. (B-E) Pharmacokinetic parameters of the MB configurations within the central compartment (C1): distribution volume (V1), clearance rate (CLB), half-life (t1/2) and area-under-the-curve (AUC). **p≤ 0.001 and ***p<0.0001. The data represent the mean ± standard deviation from three different rats for each MB configuration.
To further investigate MB dynamics within C1, we conducted a comprehensive analysis of pharmacokinetic parameters, including distribution volume (V1), clearance rate (CLB), half-life (t1/2(1)) and area-under-the-curve (AUC1), employing equation 5. The value of V1 demonstrated similar blood volume values across animals used for each of the three configurations, measuring at 21.8 ± 2.8, 21.4 ± 3.2 and 23.1 ± 3.6 mL (Figure 3B). Our analysis revealed a strong dependency of CLB, t1/2(1) and AUC1 on the PEG density. CLB increased progressively from 2- to 5-mol%, while remaining relatively constant between the 5- and 10-mol%, with values of 7.7 ± 0.7, 14.2 ± 0.9 and 12.8 ± 1.7 mL/min (Figure 1C). This rise in CLB resulted in a reduction in t1/2(1) (2.0 ± 0.1, 1.0 ± 0.1 and 1.2 ± 0.1 min) (Figure 1D) and AUC1 (56.3 ± 4.0, 30.0 ± 3.0 and 34.4 ± 3.7 μL×min/kg) (Figure 1E), with a 1.6-fold decrease from 2- to 10-mol%. These findings suggest that lower PEG concentrations are optimal for maximizing circulation time and the MVD of freely circulating MBs. Moreover, this is line with previous studies that have suggested that optimal plasma circulation lifetimes of liposomes could be achieved with 2 mol% DSPE-PEG2000.64
In contrast to these findings, prior research had suggested that higher concentrations of PEGylated lipids (5%) enhance MB stability and prevent coalescence.50 In previous studies, our group extensively examined the engineering of MB composition aimed at enhancing their performance in ultrasound imaging and therapeutic applications. Our findings demonstrate that increasing the lipid acyl chain length from DPPC (C16:0) to DBPC (C22:0) results in a more rigid24 and less gas-permeable25 shell, thereby reducing MB dissolution21 and substantially prolonging MB circulation.27 While acyl chain length mismatch may be present, we note that such mismatch is unnecessary to induce microstructural defects65,66 and even phase separation53,54 on MB shells. Therefore, we expect that our findings on the effects of PEG configuration on pharmacokinetics would be reproducible in studies employing MBs with less stable shells comprising DPPC (C16:0) or DSPC (C18:0).
Additionally, our previous in vivo study indicated that combining longer carbon chain lipids with PEGylated lipids in the brush regime (10 mol%) extended MB circulation persistence.27 Surprisingly, our current study revealed that using longer chain lipids combined with just 2 mol % of PEGylated lipid content increases MB half-life. Also, MB aggregation was not detected in any of the blood-collected samples. Furthermore, our previous pharmacokinetic study had shown that, at a given MVD of fixed MB composition, the pharmacokinetic parameters for the one-compartment model remained relatively unaffected by MB size.17 However, this study demonstrates that when MB size and MVD are held constant, the PEG composition has a significant impact on the MB pharmacokinetic behavior.
3.2.2. Two-compartment pharmacokinetic model
Intravenous administration of PEG-MBs with 2-, 5- and 10- mol% at an MVD of 40 μL/kg revealed a two-compartment pharmacokinetic model (Figure 4A, solid lines). Overall, increasing the MVD to 40 μL/kg extended circulation time from ~20 to ~30 minutes. MB clearance primarily involved dissolution and elimination by the lungs in C1, while MB retention is expected to occur in the liver, lungs and spleen in C2.17,45,46,67–69 Both the 10- and 5-mol% configurations displayed slightly accelerated biexponential decay when compared to the 2 mol% configuration.
Figure 4.

Analysis of the pharmacokinetic behavior in a two-compartment model for 2-, 5- and 10- mol % PEG-MB configurations administered at 40 μL/kg MVD. (A) Pharmacokinetic profiles of different PEG configurations. The solid lines depict a bi-exponential decay fit with R2≥0.98. (B-E) Pharmacokinetic parameters of the PEG configurations that describe the elimination phase within the central compartment (C1): distribution volume (V1), clearance rate (CLB), half-life (t1/2(1)) and area-under-the-curve (AUC1); and within the distribution phase in the peripheral compartment (C2): half-life (t1/2(2)) and area-under-the-curve (AUC2). *p< 0.05, **p<0.005, ***p≤0.0005, ****p<0.0001. The data represent the mean ± standard deviation from three different rats for each MB configuration.
Using equation 6, we estimated and compared pharmacokinetic variances in both compartments, C1 (Figure 4B–E) and C2 (Figure 4F–G). V1 remained consistent across groups and with the values reported for an MVD of 20 μL/kg (Figure 4B). However, CLB increased significantly as we transitioned from the 2- to 5- and 10-mol% PEG configurations, measuring 8.7 ± 0.8, 17.1 ± 2.1 and 36.8 ± 7.8 mL/min (Figure 4C), respectively. This resulted in a considerable reduction in values from the 2- to 10-mol% configuration for t1/2(1) (0.36 ± 0.05 to 0.18 ± 0.03 min), while values remained consistent from 5 to 10 mol% configuration (Figure 4D). The AUC1 decreased as PEG density increased, measuring 99.5 ± 5.9, 46.7 ± 5.6 and 24.4 ± 6.7 min μL×min/kg, (Figure E). Notably, CLB increased by 1.0-, 1.2- and 2.9-fold compared to MBs administered at 20 μL/kg across 2-, 5- and 10-mol% configurations. Conversely, t1/2(1) exhibited a considerable decrease ranging from 5.5- to 6.7-fold across the configurations. Moreover, AUC1 showed distinct trends, with increases of 1.8- and 1.5-fold observed for 2 mol% and 5 mol% configurations, while experiencing a decrease of 1.4-fold for the 10 mol% configuration.
In C2 (noncirculating compartment), t1/2(2) decreased from 2- to 10-mol% and were similar to 5 mol%, but remained higher than the values obtained for C1, ranging from 2.4 ± 0.1, to and 1.8 ± 0.1 min (Figure 4F). In contrast, AUC2 increased from 19.2 ± 1.6 to 27.0 ± 1.7 min μL×min/kg (Figure 4G). These contrasting results in AUC2 at high PEG densities suggest the presence of an additional mechanism for MB elimination from C2.
To explore the alternative mechanism for MB clearance, we conducted a comparative analysis of mass transfer constants (ke(1), k1, and k2) for all MB configurations (Figure 5). The ke(1) constant, representing the clearance rate from C1, demonstrated an increase from 2- and 5-mol% to 10 mol% configuration, ranging from 0.40 ± 0.02 to 0.87 ± 0.12 and 1.71 ± 0.41 min−1 (Figure 5A). Similarly, the k1 mass transfer constant for MB from C1 to C2 exhibited an increase, ranging from 0.44 ± 0.07 to 0.88 ± 0.05 and 1.66 ± 0.31 min−1 (Figure 5B). These findings align with the observed reductions in CLB, t1/2(1) and AUC1 in C1, from 10- to 2-mol% configuration, supporting accelerated MB clearance from C1 as PEG density increased. Interestingly, the k2 mass transfer constant, responsible for moving MB from C2 to C1, decreased from 2- to 10-mol% (1.38± 0.22 to 0.89 ± 0.14 min−1) and remained similar for 5 mol% configuration (1.60 ± 0.65 min−1) (Figure 5C). These observations confirm the presence of an additional clearance mechanism in C2 for high PEG concentrations.
Figure 5.

Comparison of mass transfer constants for 2-, 5- and 10-mol% PEG-MB configurations derived from the two-compartment model fitting. (A) MB clearance constant, ke(1), from the central compartment (C1). (B-C) Mass-transfer constants of MB that describe the influx of MB from C1 to the peripheral compartment (C2) (k1) and the efflux of MB from C2 to C1 (k2). *p≤0.05, **p<0.005 and ***p=0005. The data represent the mean ± standard deviation from three rats experiments for each MB configuration.
In prior positron emission tomography (PET),45,46,68 3D-μCT69 and fluorescence microscopy imaging 67,70 studies, it has been established that MBs can accumulate in the lungs, liver and spleen, with variations depending on the animal model, time post-injection and MB formulation. As a potential physiological mechanism for the peripheral compartment, MBs have been observed to be temporarily trapped in capillary vessels until they deform to flow through, analogous to leukocyte plugging, and this phenomenon may be mediated by complement activation.42,71 This accumulation is intricately linked to the mononuclear phagocyte system (MPS), which comprises specialized macrophages distributed across these organs, serving as the primary mechanism for the phagocytic removal of undesired circulatory components.72–74 Both in vitro and in vivo evidence support the involvement of Kupffer cells75–78 and activated leukocytes79 in the phagocytosis of MBs. The activation of the C3 pathway triggers the cleavage of C3 into C3b and C3a, initiating the phagocytic process and mediating inflammation or immune responses.80 Also, it has been reported that the presence of anti-PEG antibodies reduces the half-life of PEGylated drugs by 2–10-fold and increases hepatic and spleen uptake by 2–5 and 1–2-fold, respectively.36,81 This observation corroborates our findings, which predict enhanced MB retention in C2, likely the lungs, spleen and liver, 45,46,67–70 which may be mediated by the complement activation. Thus, the secondary mechanism of MB clearance in C2 can be attributed to phagocytosis by resident macrophages within the clearance organs. Overall, these collective findings indicate that an increase in PEGylated lipid content results in a significant acceleration of MB clearance from the blood. This effect is undesirable for clinical applications due to reduced freely circulating MBs.
3.3. Mechanism of microbubble clearance
3.3.1. Complement C3a activation
Recent reports highlight that individuals without prior exposure to PEGylated pharmaceutical compounds can develop antibodies against PEG. These antibodies can bind to PEG, initiating its clearance via activation of the immune complement pathway. Consequently, this process may lead to C3b-mediated phagocytosis, hypersensitivity reactions mediated by C3a/C5a, or accelerated clearance upon repeated administrations of PEGylated components.38,39 Therefore, we sought to investigate whether 2-, 5-and 10-mol% PEG-MB configurations at a φMB of 20 or 40 μL/mL activate C3a in rat and complement-preserved human serum using ELISA assays (Figure 6). The C3a activation increased as a function of PEGylated lipid content from 2- to 10-mol% configuration, as well as MVD. In control serum samples, C3a concentration was 13 ± 2 ng/mL for humans and 29 ± 2 ng/mL for rats, respectively. Following MB incubation at a φMB of 20 μL/mL C3a levels increased from 15 ± 3 ng/mL to 58 ± 6 ng/mL in human serum and from 31 ± 1 ng/mL to 40 ± 2 ng/mL in rat serum. Conversely, when MBs were incubated at a φMB of 40 μL/mL, levels of C3a ranged from 20 ± 1 ng/mL to 81 ± 16 ng/mL in human serum and from 34 ± 4 ng/mL to 47 ± 7 ng/mL in rat serum. These results corresponded to 4.5-fold and 6-fold increases for human serum and 1.4-fold and 1.6-fold increases for rat serum from the control to the 10 mol% configuration at 20 and 40 μL/mL, respectively. Thus, low PEG grafted densities are preferred to avoid C3a activation. Prior research has shown that phosphatidyl ethanolamine (PE) lipids in liposomes can activate complement.82 This may explain why increasing the DSPE-mPEG2000 content in MBs causes an increase in C3a activation, which, in turn, decreases the MB circulation time in vivo.
Figure 6.

ELISA results of complement C3a activity induced by 2-, 5-and 10-mol% PEG-MB configurations at a φMB of 20 or 40 μL/mL in (A) rat and (B) human complement-preserved serum. *p< 0.05, **p= 0.001, ***p< 0.0005 and ****p< 0.0001 at φMB of 20 and 40 μL/mL. The data represent the mean ± standard deviation from three different experiments.
3.3.2. PEG-lipid shedding
We conducted an analysis of the MB surface area (SA) variations over time using blood samples obtained during pharmacokinetic experiments for both 20 and 40 μL/kg MVD (Figure 7). Before injection, the calculated SA values for 2-, 5- and 10- mol% PEG-MBs were as follows: 30.8 ± 3.6, 31.0 ± 4.0 and 32.1 ± 1.5 μm2, respectively. Following injection, the most significant changes occurred at 1 min, 20 min or 30 min post-injection for both MVDs. For MBs administered at 20 μL/kg, SA decreased by 16.5 ± 2.6 and 6.4 ± 3.0 % for 2 mol%, 25.6 ± 12.1 and 33.6 ± 9.2 % for 5 mol%, and 41.8 ± 7.7 and 39.8 ± 3.0% for 10 mol% (Figure 7A). For MBs administered at 40 μL/kg, SA decreased 20.0 ± 9.0 and 28.9 ± 18.0 % for 2 mol%, 23.8 ± 9.8 and 32.4 ± 27.9 % for 5 mol%, and 46.5 ± 0.4 and 57.6 ± 8.0 % for 10 mol% (Figure 7B). Thus, MBs decreased in size slightly after injection, and the surface area reduction increased significantly with increasing PEG density.
Figure 7.

Variations in in vivo microbubble (MB) surface area (SA) over time. The SA average variations were determined via image analysis of blood samples collected at each time point following the intravenous administration of 2-, 5- and 10- mol% PEG-MB configurations at an MVD of (A) 20 μL/kg and (B) 40 μL/kg. *p< 0.05, **p≤ 0.005 and ***p≤0.0005 when comparing 2% PEG versus 10% PEG configuration between the same time points. The data represent the mean ± standard deviation from three different experiments.
The transport of detached lipids from the shell into the bulk solution can be characterized by the residence time () of lipids associated with the monolayer, which is dependent on the critical micelle concentration (CMC) of the lipid.29 The can be estimated using the equation 8:
| (8) |
where CMC is expressed in Molarity (M), and describes the dynamic movement of molecules within the monolayer.29 Our calculations predict values of 212 h for DBPC (29 and 5.5 s for DSPE-PEG2000 ().83 This substantial difference in indicates that DSPE-PEG2000 can detach from the monolayer approximately times faster than DBPC. Our result of increased surface area reduction by lipid shedding with increasing PEG density aligns with this observation, suggesting that PEG-lipids are lost from the MB shell shortly after injection.
We also measured C3b concentrations in serum contacted with MBs with different PEG densities. The C3b concentration in control serum samples was 1022 ± 354 μg/mL for humans and 22 ± 3 ng/mL for rats, respectively. Following MB incubation at the two different φMB doses, no significant variation in C3b levels was observed compared to the control samples (Figure S3). It is known that complement proteins (e.g., C3b) can bind to the phosphate group of the PE group in the DSPE-mPEG2000 molecule.82 The binding of a large soluble macromolecule to the lipid shell would be expected to substantially increase the CMC, thus reducing of the PEG-lipid:C3b complex compared to the PEG-lipid alone. Hence, complement fixation to PEG-lipids on the MB surface, and subsequent PEG-lipid shedding, may contribute to the higher surface area reduction seen on MBs with higher PEG densities.
5. Conclusion
In conclusion, the findings of this study indicate that increasing PEG-lipid density leads to heightened in vitro complement activation, diminished in vivo circulation time, and an augmented reduction in MB surface area in vivo. Thus, lower PEG fractions (e.g., 2 mol%) would be recommended for lipid-coated MBs to prolong circulation time and mitigate immunogenicity.
Supplementary Material
Image preprocessing procedure in blood samples before microbubble (MB) injections (Figure S1). Number- and volume-weighted size distributions for non-PEGylated MBs before and after size-isolation procedures. (Figure S2). Complement C3b activation induced by 2-, 5- and 10 mol% PEG configurations (Figure S3).
Acknowledgements
This work was supported by the U.S. National Institutes of Health award R01CA239465. We would like to thank Dr. Kang-Ho Song for assisting us during the MB injections and blood sample collections.
Footnotes
The authors declare no competing financial interest.
References
- (1).Klibanov AL Microbubble Contrast Agents: Targeted Ultrasound Imaging and Ultrasound-Assisted Drug-Delivery Applications. Invest Radiol 2006, 41 (3), 354–362. 10.1097/01.rli.0000199292.88189.0f. [DOI] [PubMed] [Google Scholar]
- (2).Bettinger T; Tranquart F Design of Microbubbles for Gene/Drug Delivery. Adv Exp Med Biol 2016, 880, 191–204. 10.1007/978-3-319-22536-4_11. [DOI] [PubMed] [Google Scholar]
- (3).Borden MA; Song K-H Reverse Engineering the Ultrasound Contrast Agent. Advances in Colloid and Interface Science 2018, 262, 39–49. 10.1016/j.cis.2018.10.004. [DOI] [PMC free article] [PubMed] [Google Scholar]
- (4).Chong WK; Papadopoulou V; Dayton PA Imaging with Ultrasound Contrast Agents: Current Status and Future. Abdom Radiol (NY) 2018, 43 (4), 762–772. 10.1007/s00261-018-1516-1. [DOI] [PubMed] [Google Scholar]
- (5).Navarro-Becerra JA; Borden MA Targeted Microbubbles for Drug, Gene, and Cell Delivery in Therapy and Immunotherapy. Pharmaceutics 2023, 15 (6), 1625. 10.3390/pharmaceutics15061625. [DOI] [PMC free article] [PubMed] [Google Scholar]
- (6).Fournier L; De La Taille T; Chauvierre C Microbubbles for Human Diagnosis and Therapy. Biomaterials 2023, 294, 122025. 10.1016/j.biomaterials.2023.122025. [DOI] [PubMed] [Google Scholar]
- (7).Song K-H; Harvey BK; Borden MA State-of-the-Art of Microbubble-Assisted Blood-Brain Barrier Disruption. Theranostics 2018, 8 (16), 4393–4408. 10.7150/thno.26869. [DOI] [PMC free article] [PubMed] [Google Scholar]
- (8).Frinking P; Segers T; Luan Y; Tranquart F Three Decades of Ultrasound Contrast Agents: A Review of the Past, Present and Future Improvements. Ultrasound in Medicine & Biology 2020, 46 (4), 892–908. 10.1016/j.ultrasmedbio.2019.12.008. [DOI] [PubMed] [Google Scholar]
- (9).Chomas JE; Dayton P; Allen J; Morgan K; Ferrara KW Mechanisms of Contrast Agent Destruction. IEEE Trans Ultrason Ferroelectr Freq Control 2001, 48 (1), 232–248. 10.1109/58.896136. [DOI] [PubMed] [Google Scholar]
- (10).Sonne C Differences in Definity and Optison Microbubble Destruction Rates at a Similar Mechanical Index with Different Real-Time Perfusion Systems. Journal of the American Society of Echocardiography 2003, 16 (11), 1178–1185. 10.1067/j.echo.2003.07.001. [DOI] [PubMed] [Google Scholar]
- (11).Chen CC; Borden MA The Role of Poly(Ethylene Glycol) Brush Architecture in Complement Activation on Targeted Microbubble Surfaces. Biomaterials 2011, 32 (27), 6579–6587. 10.1016/j.biomaterials.2011.05.027. [DOI] [PMC free article] [PubMed] [Google Scholar]
- (12).Fix SM; Nyankima AG; McSweeney MD; Tsuruta JK; Lai SK; Dayton PA Accelerated Clearance of Ultrasound Contrast Agents Containing Polyethylene Glycol Is Associated with the Generation of Anti-Polyethylene Glycol Antibodies. Ultrasound in Medicine & Biology 2018, 44 (6), 1266–1280. 10.1016/j.ultrasmedbio.2018.02.006. [DOI] [PMC free article] [PubMed] [Google Scholar]
- (13).Kovacs ZI; Kim S; Jikaria N; Qureshi F; Milo B; Lewis BK; Bresler M; Burks SR; Frank JA Disrupting the Blood-Brain Barrier by Focused Ultrasound Induces Sterile Inflammation. Proc Natl Acad Sci U S A 2017, 114 (1), E75–E84. 10.1073/pnas.1614777114. [DOI] [PMC free article] [PubMed] [Google Scholar]
- (14).McMahon D; Hynynen K Acute Inflammatory Response Following Increased Blood-Brain Barrier Permeability Induced by Focused Ultrasound Is Dependent on Microbubble Dose. Theranostics 2017, 7 (16), 3989–4000. 10.7150/thno.21630. [DOI] [PMC free article] [PubMed] [Google Scholar]
- (15).Kovacs ZI; Burks SR; Frank JA Focused Ultrasound with Microbubbles Induces Sterile Inflammatory Response Proportional to the Blood Brain Barrier Opening: Attention to Experimental Conditions. Theranostics 2018, 8 (8), 2245–2248. 10.7150/thno.24181. [DOI] [PMC free article] [PubMed] [Google Scholar]
- (16).McMahon D; Hynynen K Reply to Kovacs et al.: Concerning Acute Inflammatory Response Following Focused Ultrasound and Microbubbles in the Brain. Theranostics 2018, 8 (8), 2249–2250. 10.7150/thno.25468. [DOI] [PMC free article] [PubMed] [Google Scholar]
- (17).Navarro-Becerra JA; Song K-H; Martinez P; Borden MA Microbubble Size and Dose Effects on Pharmacokinetics. ACS Biomater. Sci. Eng 2022, 8 (4), 1686–1695. 10.1021/acsbiomaterials.2c00043. [DOI] [PMC free article] [PubMed] [Google Scholar]
- (18).Fix SM; Borden MA; Dayton PA Therapeutic Gas Delivery via Microbubbles and Liposomes. Journal of Controlled Release 2015, 209, 139–149. 10.1016/j.jconrel.2015.04.027. [DOI] [PubMed] [Google Scholar]
- (19).Kim DH; Costello MJ; Duncan PB; Needham D Mechanical Properties and Microstructure of Polycrystalline Phospholipid Monolayer Shells: Novel Solid Microparticles. Langmuir 2003, 19 (20), 8455–8466. 10.1021/la034779c. [DOI] [Google Scholar]
- (20).Borden MA Intermolecular Forces Model for Lipid Microbubble Shells. Langmuir 2019, 35 (31), 10042–10051. 10.1021/acs.langmuir.8b03641. [DOI] [PubMed] [Google Scholar]
- (21).Borden MA; Longo ML Dissolution Behavior of Lipid Monolayer-Coated, Air-Filled Microbubbles: Effect of Lipid Hydrophobic Chain Length. Langmuir 2002, 18 (24), 9225–9233. 10.1021/la026082h. [DOI] [Google Scholar]
- (22).Kwan JJ; Borden MA Lipid Monolayer Dilatational Mechanics during Microbubble Gas Exchange. Soft Matter 2012, 8 (17), 4756. 10.1039/c2sm07437k. [DOI] [Google Scholar]
- (23).Van Rooij T; Luan Y; Renaud G; Van Der Steen AFW; Versluis M; De Jong N; Kooiman K Non-Linear Response and Viscoelastic Properties of Lipid-Coated Microbubbles: DSPC versus DPPC. Ultrasound in Medicine & Biology 2015, 41 (5), 1432–1445. 10.1016/j.ultrasmedbio.2015.01.004. [DOI] [PubMed] [Google Scholar]
- (24).Lum JS; Dove JD; Murray TW; Borden MA Single Microbubble Measurements of Lipid Monolayer Viscoelastic Properties for Small-Amplitude Oscillations. Langmuir 2016, 32 (37), 9410–9417. 10.1021/acs.langmuir.6b01882. [DOI] [PMC free article] [PubMed] [Google Scholar]
- (25).Borden MA; Longo ML Oxygen Permeability of Fully Condensed Lipid Monolayers. J. Phys. Chem. B 2004, 108 (19), 6009–6016. 10.1021/jp037815p. [DOI] [Google Scholar]
- (26).Reusser TD; Song K-H; Ramirez D; Benninger RK; Papadopoulou V; Borden MA Phospholipid Oxygen Microbubbles for Image-Guided Therapy. Nanotheranostics 2020, 4 (2), 83–90. 10.7150/ntno.43808. [DOI] [PMC free article] [PubMed] [Google Scholar]
- (27).Garg S; Thomas AA; Borden MA The Effect of Lipid Monolayer In-Plane Rigidity on in Vivo Microbubble Circulation Persistence. Biomaterials 2013, 34 (28), 6862–6870. 10.1016/j.biomaterials.2013.05.053. [DOI] [PMC free article] [PubMed] [Google Scholar]
- (28).Wu S-Y; Chen CC; Tung Y-S; Olumolade OO; Konofagou EE Effects of the Microbubble Shell Physicochemical Properties on Ultrasound-Mediated Drug Delivery to the Brain. Journal of Controlled Release 2015, 212, 30–40. 10.1016/j.jconrel.2015.06.007. [DOI] [PMC free article] [PubMed] [Google Scholar]
- (29).Israelachvili JN Intermolecular and Surface Forces, 3rd ed.; Academic Press: Burlington, MA, 2011. [Google Scholar]
- (30).Kwan JJ; Borden MA Lipid Monolayer Collapse and Microbubble Stability. Adv Colloid Interface Sci 2012, 183-184, 82–99. 10.1016/j.cis.2012.08.005. [DOI] [PubMed] [Google Scholar]
- (31).Needham D; Kim DH PEG-Covered Lipid Surfaces: Bilayers and Monolayers. Colloids Surf B Biointerfaces 2000, 18 (3–4), 183–195. 10.1016/s0927-7765(99)00147-2. [DOI] [PubMed] [Google Scholar]
- (32).Segers T; Lohse D; Versluis M; Frinking P Universal Equations for the Coalescence Probability and Long-Term Size Stability of Phospholipid-Coated Monodisperse Microbubbles Formed by Flow Focusing. Langmuir 2017, 33 (39), 10329–10339. 10.1021/acs.langmuir.7b02547. [DOI] [PubMed] [Google Scholar]
- (33).Allen TM; Hansen C Pharmacokinetics of Stealth versus Conventional Liposomes: Effect of Dose. Biochim Biophys Acta 1991, 1068 (2), 133–141. 10.1016/0005-2736(91)90201-i. [DOI] [PubMed] [Google Scholar]
- (34).Borden MA; Martinez GV; Ricker J; Tsvetkova N; Longo M; Gillies RJ; Dayton PA; Ferrara KW Lateral Phase Separation in Lipid-Coated Microbubbles. Langmuir 2006, 22 (9), 4291–4297. 10.1021/la052841v. [DOI] [PubMed] [Google Scholar]
- (35).Verhoef JJF; Anchordoquy TJ Questioning the Use of PEGylation for Drug Delivery. Drug Deliv Transl Res 2013, 3 (6), 499–503. 10.1007/s13346-013-0176-5. [DOI] [PMC free article] [PubMed] [Google Scholar]
- (36).Yang Q; Lai SK Anti-PEG Immunity: Emergence, Characteristics, and Unaddressed Questions: Anti-PEG Immunity. WIREs Nanomed Nanobiotechnol 2015, 7 (5), 655–677. 10.1002/wnan.1339. [DOI] [PMC free article] [PubMed] [Google Scholar]
- (37).Yang Q; Jacobs TM; McCallen JD; Moore DT; Huckaby JT; Edelstein JN; Lai SK Analysis of Pre-Existing IgG and IgM Antibodies against Polyethylene Glycol (PEG) in the General Population. Anal. Chem 2016, 88 (23), 11804–11812. 10.1021/acs.analchem.6b03437. [DOI] [PMC free article] [PubMed] [Google Scholar]
- (38).Hoang Thi TT; Pilkington EH; Nguyen DH; Lee JS; Park KD; Truong NP The Importance of Poly(Ethylene Glycol) Alternatives for Overcoming PEG Immunogenicity in Drug Delivery and Bioconjugation. Polymers 2020, 12 (2), 298. 10.3390/polym12020298. [DOI] [PMC free article] [PubMed] [Google Scholar]
- (39).Chen B-M; Cheng T-L; Roffler SR Polyethylene Glycol Immunogenicity: Theoretical, Clinical, and Practical Aspects of Anti-Polyethylene Glycol Antibodies. ACS Nano 2021, 15 (9), 14022–14048. 10.1021/acsnano.1c05922. [DOI] [PubMed] [Google Scholar]
- (40).Borden MA; Zhang H; Gillies RJ; Dayton PA; Ferrara KW A Stimulus-Responsive Contrast Agent for Ultrasound Molecular Imaging. Biomaterials 2008, 29 (5), 597–606. 10.1016/j.biomaterials.2007.10.011. [DOI] [PMC free article] [PubMed] [Google Scholar]
- (41).Chen CC; Sirsi SR; Homma S; Borden MA Effect of Surface Architecture on in Vivo Ultrasound Contrast Persistence of Targeted Size-Selected Microbubbles. Ultrasound Med Biol 2012, 38 (3), 492–503. 10.1016/j.ultrasmedbio.2011.12.007. [DOI] [PMC free article] [PubMed] [Google Scholar]
- (42).Fisher NG; Christiansen JP; Klibanov A; Taylor RP; Kaul S; Lindner JR Influence of Microbubble Surface Charge on Capillary Transit and Myocardial Contrast Enhancement. Journal of the American College of Cardiology 2002, 40 (4), 811–819. 10.1016/S0735-1097(02)02038-7. [DOI] [PubMed] [Google Scholar]
- (43).De Gennes PG Polymers at an Interface; a Simplified View. Advances in Colloid and Interface Science 1987, 27 (3–4), 189–209. 10.1016/0001-8686(87)85003-0. [DOI] [Google Scholar]
- (44).Song K-H; Fan AC; Hinkle JJ; Newman J; Borden MA; Harvey BK Microbubble Gas Volume: A Unifying Dose Parameter in Blood-Brain Barrier Opening by Focused Ultrasound. Theranostics 2017, 7 (1), 144–152. 10.7150/thno.15987. [DOI] [PMC free article] [PubMed] [Google Scholar]
- (45).Tartis MS; Kruse DE; Zheng H; Zhang H; Kheirolomoom A; Marik J; Ferrara KW Dynamic microPET Imaging of Ultrasound Contrast Agents and Lipid Delivery. Journal of Controlled Release 2008, 131 (3), 160–166. 10.1016/j.jconrel.2008.07.030. [DOI] [PMC free article] [PubMed] [Google Scholar]
- (46).Rajora MA; Dhaliwal A; Zheng M; Choi V; Overchuk M; Lou JWH; Pellow C; Goertz D; Chen J; Zheng G Quantitative Pharmacokinetics Reveal Impact of Lipid Composition on Microbubble and Nanoprogeny Shell Fate. Advanced Science 2024, 11 (4), 2304453. 10.1002/advs.202304453. [DOI] [PMC free article] [PubMed] [Google Scholar]
- (47).Li P; Hoppmann S; Du P; Li H; Evans PM; Moestue SA; Yu W; Dong F; Liu H; Liu L Pharmacokinetics of Perfluorobutane after Intra-Venous Bolus Injection of Sonazoid in Healthy Chinese Volunteers. Ultrasound in Medicine & Biology 2017, 43 (5), 1031–1039. 10.1016/j.ultrasmedbio.2017.01.003. [DOI] [PubMed] [Google Scholar]
- (48).Hutter JC; Luu HM; Mehlhaff PM; Killam AL; Dittrich HC Physiologically Based Pharmacokinetic Model for Fluorocarbon Elimination after the Administration of an Octafluoropropane-Albumin Microsphere Sonographic Contrast Agent. Journal of Ultrasound in Medicine 1999, 18 (1), 1–11. 10.7863/jum.1999.18.1.1. [DOI] [PubMed] [Google Scholar]
- (49).Garbuzenko O; Barenholz Y; Priev A Effect of Grafted PEG on Liposome Size and on Compressibility and Packing of Lipid Bilayer. Chemistry and Physics of Lipids 2005, 135 (2), 117–129. 10.1016/j.chemphyslip.2005.02.003. [DOI] [PubMed] [Google Scholar]
- (50).Abou-Saleh RH; Swain M; Evans SD; Thomson NH Poly(Ethylene Glycol) Lipid-Shelled Microbubbles: Abundance, Stability, and Mechanical Properties. Langmuir 2014, 30 (19), 5557–5563. 10.1021/la404804u. [DOI] [PubMed] [Google Scholar]
- (51).Marsh D; Bartucci R; Sportelli L Lipid Membranes with Grafted Polymers: Physicochemical Aspects. Biochimica et Biophysica Acta (BBA) - Biomembranes 2003, 1615 (1–2), 33–59. 10.1016/S0005-2736(03)00197-4. [DOI] [PubMed] [Google Scholar]
- (52).Kim DH; Klibanov AL; Needham D The Influence of Tiered Layers of Surface-Grafted Poly(Ethylene Glycol) on Receptor–Ligand-Mediated Adhesion between Phospholipid Monolayer-Stabilized Microbubbles and Coated Glass Beads. Langmuir 2000, 16 (6), 2808–2817. 10.1021/la990749r. [DOI] [Google Scholar]
- (53).Langeveld SAG; Schwieger C; Beekers I; Blaffert J; Van Rooij T; Blume A; Kooiman K Ligand Distribution and Lipid Phase Behavior in Phospholipid-Coated Microbubbles and Monolayers. Langmuir 2020, 36 (12), 3221–3233. 10.1021/acs.langmuir.9b03912. [DOI] [PMC free article] [PubMed] [Google Scholar]
- (54).Borden MA; Martinez GV; Ricker J; Tsvetkova N; Longo M; Gillies RJ; Dayton PA; Ferrara KW Lateral Phase Separation in Lipid-Coated Microbubbles. Langmuir 2006, 22 (9), 4291–4297. 10.1021/la052841v. [DOI] [PubMed] [Google Scholar]
- (55).Feshitan JA; Chen CC; Kwan JJ; Borden MA Microbubble Size Isolation by Differential Centrifugation. Journal of Colloid and Interface Science 2009, 329 (2), 316–324. 10.1016/j.jcis.2008.09.066. [DOI] [PubMed] [Google Scholar]
- (56).Truskey GA; Yuan F; Katz DF Transport Phenomena in Biological Systems, 2nd ed.; Pearson Prentice Hall bioengineering; Pearson Prentice Hall: Upper Saddle River, N.J, 2009. [Google Scholar]
- (57).Vitello DJ; Ripper RM; Fettiplace MR; Weinberg GL; Vitello JM Blood Density Is Nearly Equal to Water Density: A Validation Study of the Gravimetric Method of Measuring Intraoperative Blood Loss. Journal of Veterinary Medicine 2015, 2015, 1–4. 10.1155/2015/152730. [DOI] [PMC free article] [PubMed] [Google Scholar]
- (58).Schoeffner DJ ORGAN WEIGHTS AND FAT VOLUME IN RATS AS A FUNCTION OF STRAIN AND AGE. Journal of Toxicology and Environmental Health, Part A 1999, 56 (7), 449–462. 10.1080/009841099157917. [DOI] [PubMed] [Google Scholar]
- (59).Dicker S; Mleczko M; Schmitz G; Wrenn SP Determination of Microbubble Cavitation Threshold Pressure as Function of Shell Chemistry. Bubble Science, Engineering & Technology 2010, 2 (2), 55–64. 10.1179/1758897910Y.0000000001. [DOI] [Google Scholar]
- (60).Dicker S; Mleczko M; Schmitz G; Wrenn SP Size Distribution of Microbubbles as a Function of Shell Composition. Ultrasonics 2013, 53 (7), 1363–1367. 10.1016/j.ultras.2013.04.004. [DOI] [PubMed] [Google Scholar]
- (61).Segers T; Lohse D; Versluis M; Frinking P Universal Equations for the Coalescence Probability and Long-Term Size Stability of Phospholipid-Coated Monodisperse Microbubbles Formed by Flow Focusing. Langmuir 2017, 33 (39), 10329–10339. 10.1021/acs.langmuir.7b02547. [DOI] [PubMed] [Google Scholar]
- (62).Azami RH; Aliabouzar M; Osborn J; Kumar KN; Forsberg F; Eisenbrey JR; Mallik S; Sarkar K Material Properties, Dissolution and Time Evolution of PEGylated Lipid-Shelled Microbubbles: Effects of the Polyethylene Glycol Hydrophilic Chain Configurations. Ultrasound in Medicine & Biology 2022, 48 (9), 1720–1732. 10.1016/j.ultrasmedbio.2022.04.216. [DOI] [PMC free article] [PubMed] [Google Scholar]
- (63).Ferrara KW; Borden MA; Zhang H Lipid-Shelled Vehicles: Engineering for Ultrasound Molecular Imaging and Drug Delivery. Acc. Chem. Res 2009, 42 (7), 881–892. 10.1021/ar8002442. [DOI] [PMC free article] [PubMed] [Google Scholar]
- (64).Dos Santos N; Allen C; Doppen A-M; Anantha M; Cox KAK; Gallagher RC; Karlsson G; Edwards K; Kenner G; Samuels L; Webb MS; Bally MB Influence of Poly(Ethylene Glycol) Grafting Density and Polymer Length on Liposomes: Relating Plasma Circulation Lifetimes to Protein Binding. Biochimica et Biophysica Acta (BBA) - Biomembranes 2007, 1768 (6), 1367–1377. 10.1016/j.bbamem.2006.12.013. [DOI] [PubMed] [Google Scholar]
- (65).Kim DH; Costello MJ; Duncan PB; Needham D Mechanical Properties and Microstructure of Polycrystalline Phospholipid Monolayer Shells: Novel Solid Microparticles. Langmuir 2003, 19 (20), 8455–8466. 10.1021/la034779c. [DOI] [Google Scholar]
- (66).Borden MA; Pu G; Runner GJ; Longo ML Surface Phase Behavior and Microstructure of Lipid/PEG-Emulsifier Monolayer-Coated Microbubbles. Colloids and Surfaces B: Biointerfaces 2004, 35 (3–4), 209–223. 10.1016/j.colsurfb.2004.03.007. [DOI] [PubMed] [Google Scholar]
- (67).Barrefelt Å; Zhao Y; Larsson MK; Egri G; Kuiper RV; Hamm J; Saghafian M; Caidahl K; Brismar TB; Aspelin P; Heuchel R; Muhammed M; Dähne L; Hassan M Fluorescence Labeled Microbubbles for Multimodal Imaging. Biochemical and Biophysical Research Communications 2015, 464 (3), 737–742. 10.1016/j.bbrc.2015.07.017. [DOI] [PubMed] [Google Scholar]
- (68).Willmann JK; Cheng Z; Davis C; Lutz AM; Schipper ML; Nielsen CH; Gambhir SS Targeted Microbubbles for Imaging Tumor Angiogenesis: Assessment of Whole-Body Biodistribution with Dynamic Micro-PET in Mice. Radiology 2008, 249 (1), 212–219. 10.1148/radiol.2491072050. [DOI] [PMC free article] [PubMed] [Google Scholar]
- (69).Lazarova N; Causey PW; Lemon JA; Czorny SK; Forbes JR; Zlitni A; Genady A; Foster FS; Valliant JF The Synthesis, Magnetic Purification and Evaluation of 99mTc-Labeled Microbubbles. Nuclear Medicine and Biology 2011, 38 (8), 1111–1118. 10.1016/j.nucmedbio.2011.04.008. [DOI] [PubMed] [Google Scholar]
- (70).Oddo L; Paradossi G; Cerroni B; Ben-Harush C; Ariel E; Di Meco F; Ram Z; Grossman R In Vivo Biodistribution of Engineered Lipid Microbubbles in Rodents. ACS Omega 2019, 4 (8), 13371–13381. 10.1021/acsomega.9b01544. [DOI] [PMC free article] [PubMed] [Google Scholar]
- (71).Lindner JR; Coggins MP; Kaul S; Klibanov AL; Brandenburger GH; Ley K Microbubble Persistence in the Microcirculation During Ischemia/Reperfusion and Inflammation Is Caused by Integrin- and Complement-Mediated Adherence to Activated Leukocytes. Circulation 2000, 101 (6), 668–675. 10.1161/01.CIR.101.6.668. [DOI] [PubMed] [Google Scholar]
- (72).Summers KM; Bush SJ; Hume DA Network Analysis of Transcriptomic Diversity amongst Resident Tissue Macrophages and Dendritic Cells in the Mouse Mononuclear Phagocyte System. PLoS Biol 2020, 18 (10), e3000859. 10.1371/journal.pbio.3000859. [DOI] [PMC free article] [PubMed] [Google Scholar]
- (73).Yona S; Gordon S From the Reticuloendothelial to Mononuclear Phagocyte System – The Unaccounted Years. Front. Immunol 2015, 6. 10.3389/fimmu.2015.00328. [DOI] [PMC free article] [PubMed] [Google Scholar]
- (74).Hume DA; Irvine KM; Pridans C The Mononuclear Phagocyte System: The Relationship between Monocytes and Macrophages. Trends in Immunology 2019, 40 (2), 98–112. 10.1016/j.it.2018.11.007. [DOI] [PubMed] [Google Scholar]
- (75).Yanagisawa K; Moriyasu F; Miyahara T; Yuki M; Iijima H Phagocytosis of Ultrasound Contrast Agent Microbubbles by Kupffer Cells. Ultrasound in Medicine & Biology 2007, 33 (2), 318–325. 10.1016/j.ultrasmedbio.2006.08.008. [DOI] [PubMed] [Google Scholar]
- (76).Quaia E; Blomley MJK; Patel S; Harvey CJ; Padhani A; Price P; Cosgrove DO Initial Observations on the Effect of Irradiation on the Liver-Specific Uptake of Levovist. European Journal of Radiology 2002, 41 (3), 192–199. 10.1016/S0720-048X(01)00458-2. [DOI] [PubMed] [Google Scholar]
- (77).Lim AKP; Patel N; Eckersley RJ; Taylor-Robinson SD; Cosgrove DO; Blomley MJK Evidence for Spleen-Specific Uptake of a Microbubble Contrast Agent: A Quantitative Study in Healthy Volunteers. Radiology 2004, 231 (3), 785–788. 10.1148/radiol.2313030544. [DOI] [PubMed] [Google Scholar]
- (78).Iijima H; Moriyasu F; Miyahara T; Yanagisawa K Ultrasound Contrast Agent, Levovist Microbubbles Are Phagocytosed by Kupffer Cells—In Vitro and in Vivo Studies. Hepatology Research 2006, 35 (4), 235–237. 10.1016/j.hepres.2006.04.016. [DOI] [PubMed] [Google Scholar]
- (79).Lindner JR; Dayton PA; Coggins MP; Ley K; Song J; Ferrara K; Kaul S Noninvasive Imaging of Inflammation by Ultrasound Detection of Phagocytosed Microbubbles. Circulation 2000, 102 (5), 531–538. 10.1161/01.CIR.102.5.531. [DOI] [PubMed] [Google Scholar]
- (80).Murphy KM; Weaver C Janeway’s Immunobiology, 9th edition.; GS, Garland Science, Taylor & Francis Group: New York London, 2017. [Google Scholar]
- (81).Shi D; Beasock D; Fessler A; Szebeni J; Ljubimova JY; Afonin KA; Dobrovolskaia MA To PEGylate or Not to PEGylate: Immunological Properties of Nanomedicine’s Most Popular Component, Polyethylene Glycol and Its Alternatives. Advanced Drug Delivery Reviews 2022, 180, 114079. 10.1016/j.addr.2021.114079. [DOI] [PMC free article] [PubMed] [Google Scholar]
- (82).Mold C Effect of Membrane Phospholipids on Activation of the Alternative Complement Pathway. J Immunol 1989, 143 (5), 1663–1668. [PubMed] [Google Scholar]
- (83).Ashok B; Arleth L; Hjelm RP; Rubinstein I; Önyüksel H In Vitro Characterization of PEGylated Phospholipid Micelles for Improved Drug Solubilization: Effects of PEG Chain Length and PC Incorporation. Journal of Pharmaceutical Sciences 2004, 93 (10), 2476–2487. 10.1002/jps.20150. [DOI] [PubMed] [Google Scholar]
Associated Data
This section collects any data citations, data availability statements, or supplementary materials included in this article.