

Abstract
Melanoma and non-small cell lung cancer (NSCLC) display exceptionally high mutational burdens. Hence, immune targeting in these cancers has primarily focused on tumor antigens (TAs) predicted to derive from nonsynonymous mutations. Using comprehensive proteogenomic analyses, we identified 589 TAs in cutaneous melanoma (n = 505) and NSCLC (n = 90). Of these, only 1% were derived from mutated sequences, which was explained by a low RNA expression of most nonsynonymous mutations and their localization outside genomic regions proficient for major histocompatibility complex (MHC) class I-associated peptide generation. By contrast, 99% of TAs originated from unmutated genomic sequences specific to cancer (aberrantly expressed tumor-specific antigens (aeTSAs), n = 220), overexpressed in cancer (tumor-associated antigens (TAAs), n = 165) or specific to the cell lineage of origin (lineage-specific antigens (LSAs), n = 198). Expression of aeTSAs was epigenetically regulated, and most were encoded by noncanonical genomic sequences. aeTSAs were shared among tumor samples, were immunogenic and could contribute to the response to immune checkpoint blockade observed in previous studies, supporting their immune targeting across cancers.
Subject terms: Immunoediting, Immunoediting, Systems analysis, MHC class I, Cancer
Based on a proteogenomic analysis, Perreault and colleagues report that the majority of predicted tumor antigens originate from unmutated genomic sequences in melanoma and non-small cell lung cancer.
Main
Superior response to immune checkpoint blockade (ICB) in cancers with high mutational load, including melanoma and NSCLC, has led to the assumption that ICB efficacy is dictated by the immune recognition of mutated tumor-specific antigens (mTSAs), also known as mutated neoantigens1,2. This belief has been fueled by associations of response to ICB with increased tumor mutational burden (TMB) or intratumor genomic heterogeneity or with the number of total, clonal or persistent, in silico-predicted mTSAs3–8. However, cases of ICB responders with low pretreatment TMB and nonresponders with high TMB challenge this assumption7,9. Moreover, several attempts using mass spectrometry to validate the presence of predicted mTSAs at the surface of tumor cells, an essential prerequisite to recognition by tumor-reactive CD8+ lymphocytes, have been largely unsuccessful10–13.
Another prerequisite to CD8+ T cell activation by a TA is its immunogenicity, determined by the presence and affinity of antigen-specific CD8+ T cells in the patient’s immune cell repertoire. TAs that are not found in normal tissues, such as mTSAs, can induce strong T cell activation. By contrast, unmutated antigens overexpressed in cancer but present in normal tissues, called tumor-associated antigens (TAAs), are poor immunogens because developing cognate T cells are deleted or anergized by medullary thymic epithelial cells (mTECs) to prevent autoimmunity. Accordingly, the therapeutic targeting of unmutated TAs has been largely viewed as a failure due to disappointing results obtained by targeting TAAs1. Nevertheless, the recent rediscovery of unmutated aeTSAs derived from allegedly noncoding regions (that is, introns, untranslated regions, intergenic regions, endogenous retroelements) and from embryonic transcriptional programs has sparked renewed interest in unmutated TAs for immunotherapy14–24. These aeTSAs have shown success in preclinical vaccination studies15,16,22, and CD8+ T cells with strong reactivity to such antigens were found in peripheral blood mononuclear cells (PBMCs) of healthy donors and patients with cancer, including melanoma14,17–19,25,26, and in the pool of tumor-infiltrating lymphocytes from human tumors27. This indicates that aeTSAs can contribute to anti-tumor immunity spontaneously and upon treatment.
In addition to TAAs and TSAs, a third type of TAs has been demonstrated to be involved in tumor immunosurveillance, albeit at the expense of varying degrees of organ-specific autoimmunity. These antigens, termed lineage-specific antigens (LSAs), are specifically expressed in cell types with specialized functions28. For example, in melanoma, premelanosome protein (PMEL), tyrosinase (TYR), tyrosine-related proteins 1 and 2 (TRP1 and TRP2) and MLANA (or MART1, melanoma antigen recognized by T cells), which are involved in the production of melanin in melanocytes, induce long-term protective immune responses following the induction of local inflammation and can rescue response to ICB in TMB-low tumors29.
A third prerequisite to anti-tumor immunity is CD8+ T cell priming mediated primarily by dendritic cells29–32. We have previously proposed that noncanonical TAs make poor antigens for spontaneous priming due to their instability and rapid degradation, which limit uptake by dendritic cells33,34. On the flip side, they are ideal candidates for immunotherapy due to their high number in tumors, their tumor specificity and lack of spontaneous immunoediting33. Despite this, currently, no clinical trials study the immune targeting of noncanonical TAs, and only a handful of such studies exist on canonical unmutated TAs in melanoma, lymphoma, ovarian, testicular and other cancers (refs. 35,36; ClinicalTrials.gov identifier NCT04503278). While the extensive efforts channeled into targeting predicted mTSAs have benefited some patients via direct (target recognition) or indirect (systemic immune activation and epitope spreading) vaccine responses37–39, we posit that adding unmutated canonical and noncanonical TSAs to the target repertoire could substantially improve the efficacy and durability of response to treatment. To evaluate the landscape of targetable TAs in indications with high TMB, we systematically assessed the cell surface presentation of mutated and unmutated TAs in melanoma and NSCLC. Having found few mTSAs, we provide insights into why predicted mTSAs are rarely detected in tumor immunopeptidomes. Lastly, our study uncovers the potential contribution of aeTSAs in response to ICB observed in previous studies and argues for their high relevance for immunotherapy.
Results
Unmutated TAs outnumber mTSAs in melanoma and NSCLC
We used proteogenomics to analyze the immunopeptidomes (that is, the sum of MHC class I-associated peptides, MAPs) of 26 NSCLC and 12 cutaneous melanoma biopsies (Supplementary Tables 1–3). In addition, we reanalyzed the RNA-sequencing (RNA-seq) and paired immunopeptidomics data from seven patient-derived melanoma cell lines from Chong et al.18. Briefly, bulk RNA-seq was used to construct sample-specific databases containing (1) the annotated (canonical) expressed proteome following sample-specific single-nucleotide polymorphism (SNP) insertion and (2) three-frame translations of RNA sequences absent from mTECs, including those deriving from non-annotated (noncanonical) genomic regions (Extended Data Fig. 1a). Tandem mass spectra (MS/MS) of MAPs from each sample were searched against these databases to identify canonical and noncanonical peptide sequences.
Extended Data Fig. 1. Mass spectrometry-based identification of tumor antigens in melanoma and NSCLC.

a, Proteogenomic workflow for TA identification from melanoma and NSCLC samples. Immunopeptidomic and RNA-seq data for melanoma cell lines were obtained from Chong et al.18. pMHC-IP, peptide-MHC I immunoprecipitation; MAP, MHC I-associated peptide; LC-MS/MS, liquid chromatography with tandem mass spectrometry; FDR, false discovery rate; RPHM, reads per hundred million. b, Heatmap showing representative expression of the three classes of unmutated TAs identified from melanoma samples across normal tissues [from GTEx, purified melanocytes, purified blood, and bone marrow (BM) cells, mTECs] and melanoma samples (from TCGA, various published datasets3,5,7,9,18 and the present study). Numbers in parentheses show the number of samples. c, The absolute number of non-redundant TAs identified per TA type in primary NSCLC samples, primary melanomas, and melanoma cell lines. Numbers in parentheses indicate the number of samples analyzed. The rate of TA generation expressed as the median number of TAs identified per 1000 total MAPs is also shown per sample group. d, Pearson’s correlation between the tumor purity scores from ESTIMATE and the number of total TAs identified across primary melanoma (melanoma_local, n = 12 samples) and NSCLC samples (lung_local, n = 26 samples).
At the intersection between two spectrum search engines (PEAKS and Comet), we identified a total of 60,012 unique MAP sequences from NSCLC, 31,289 from primary cutaneous melanomas and 59,708 from melanoma cell lines. Next, we obtained their RNA coding sequences, genomic locations and expression in benign versus cancer tissues using BamQuery17,40, and we evaluated the class of TA candidates (aeTSAs, TAAs, LSAs or mTSAs) and their biotypes. MAPs deriving from mutations in canonical or noncanonical regions and for which coding sequences were not expressed in benign tissues were classified as mTSAs. For unmutated TAs, a MAP was kept as a TA candidate if its coding sequence was shared by at least 5% of cancer samples from the Cancer Genome Atlas (TCGA): for NSCLC, sharing was assessed in the lung adenocarcinoma (LUAD) and lung squamous cell carcinoma (LUSC) cohorts, while, for melanoma, it was evaluated in the skin cutaneous melanoma (SKCM) cohort. Next, (1) absence or minimal expression in normal tissues except the testis classified TA candidates as aeTSAs, and (2) expression restricted to normal lung or skin (for NSCLC and melanoma, respectively) resulted in LSA classification, (3) whereas significant expression in other normal tissues and at least twofold overexpression in TCGA defined TAAs (Methods, Extended Data Fig. 1a,b and Supplementary Table 4).
We found a total of 90 TAs from NSCLC samples, 90 TAs from primary melanomas and 434 TAs from the melanoma cell lines, for a total of 505 nonredundant melanoma TAs (Fig. 1a, Extended Data Fig. 1c and Supplementary Tables 5–7). Several complementary analyses supported the accuracy of our TA identifications (‘Quality of tumor antigen identifications’ and Extended Data Figs. 2 and 3). While the number of TAs identified correlated with the total number of MAPs detected in both lung and melanoma (Fig. 1b), the median rate of TAs generated per 1,000 MAPs was 2.3 times higher in primary melanomas than in NSCLC (Extended Data Fig. 1c). This could be explained by a lower tumor purity estimate for NSCLC samples due to higher immune infiltration, which can hamper the detection of genuine TAs (Fig. 1c and Extended Data Fig. 1d). Indeed, many MAPs from NSCLC samples, but not from melanoma, were immunoglobulin derived, consistent with the high B cell and plasma cell infiltration of this tumor type41,42. The tumor purity could also explain the 2.8 times higher number of TAs per sample identified in melanoma cell lines than in primary melanomas (Fig. 1b,c and Extended Data Fig. 1c).
Fig. 1. Unmutated TAs outnumber mTSAs in melanoma and NSCLC.

a, Number of nonredundant MAPs per TA type identified across primary melanomas and melanoma cell lines from Chong et al.18 (left) and primary NSCLC (right) samples. b, Scatterplot showing Pearson’s correlation between the total number of MAPs and the number of TAs identified per sample in melanoma (left) and NSCLC (right). c, Tumor purity (left) and immune infiltration (right) scores from ESTIMATE across samples. Box plots show the median (center line) and interquartile range (IQR, box with limits at 25th and 75th percentiles), and whiskers extend to the largest value no further than 1.5 × IQR from the box hinges. P values from two-sided unpaired t-test with NSCLC samples as a reference group; no adjustments were made for multiple testing. Primary melanoma (n = 12 samples), primary NSCLC (n = 26 samples), melanoma cell lines (n = 7 samples) (b,c). d,e, Proportion of TAs corresponding to each biotype for each TA type in melanoma (d) and NSCLC (e). The total number of TAs per cancer type is displayed in a. a,d,e, n = 19 melanoma samples and 26 NSCLC samples. UTR, untranslated region; ncRNA, noncoding RNA.
Extended Data Fig. 2. Quality of TA identifications.

a-b, Identification of Tas using the geometric expression mean across normal versus tumor samples. TA numbers were identified by calculating the fold-change between cancer and normal samples using the arithmetic mean (Tas reported in Supplementary Tables 6 and 7) and with the geometric mean (Tas gained or lost listed in Supplementary Table 25 and 26) for melanoma (a) and NSCLC (b) Tas. aeTSA, aberrantly expressed tumor-specific antige; TAA, tumor-associated antigen; LSA, lineage-specific antigen. c, Violin and box plots showing the proportion of HLA binders (rank elution < 2% in NetMHCpan-4.1b44) among 8-11 amino acid peptides across melanoma (left) and NSCLC (right) samples. Each grey dot represents one sample (n = 19 melanoma samples and 26 NSCLC samples studied), and the numbers indicate the median proportion across samples. d, Length distribution of MAPs identified from melanoma (left) and NSCLC (right) samples, compared between canonical MAPs and Tas (p > 0.05; Kolmogorov-Smirnov test). e-f, Spectrum scores I and mass errors (f) of MAPs (n = 119429 canonical and 663 TA MAPs in melanoma, and 108311 canonical and 117 TA MAPs in NSCLCs) identified from melanoma (left) and NSCLC (right) samples, compared between canonical MAPs and Tas (ns, non-significant; two-sided unpaired Wilcoxon’s nonparametric test). g, Pearson’s correlations between observed retention times and predicted retention times (left) or hydrophobicity index (right) for melanoma MAPs according to the TA and canonical MAP status for primary samples analyzed in house or for melanoma cells lines. See Supplementary Table 3 for the sample names analyzed with each mass spectrometer. h, Pearson’s correlations between observed retention times and predicted retention times (left) or hydrophobicity index (right) for NSCLC MAPs according to the TA and canonical MAP status for primary samples analyzed on a Q-Exactive or EXPLORIS mass spectrometer. See Supplementary Table 3 for the sample names analyzed with each mass spectrometer. I, Top: the number of Tas re-identified with group-specific FDR of 5% (calculated separately for canonical and non-canonical peptides) in melanoma (left) and NSCLC (right) samples. Bottom: Dot plot showing the Prosit spectral angle (max value per peptide) and the Prosit Pearson’s r (max value per peptide) across melanoma (left) and NSCLC (right) samples, and color-coded according to their re-identification with the group FDR (see top panel). a-I, n = 19 melanoma samples and 26 NSCLC samples. All box plots show the median (center line) and interquartile range (IQR, box with limits at 25th and 75th percentiles), whiskers extend to the largest value no further than 1.5 * IQR from the box hinges, and black dots represent outliers beyond the whiskers.
Extended Data Fig. 3. MS validation of aeTSAs from NSCLC samples using synthetic peptides.

Mirror plots show the MS spectra, Pearson correlation coefficients for each endogenous peptide, and the corresponding synthetic analog.
Notably, more than 50% of aeTSAs in both NSCLC and melanoma were noncanonical, with a high contribution from intergenic regions, introns and noncoding RNAs (Fig. 1d,e). While TAAs and LSAs were mainly derived from annotated open reading frames (ORFs), LSAs in melanoma were also enriched in noncoding RNA and intron-derived MAPs, suggesting melanocyte-specific biogenesis (Fig. 1d). Similarly, mTSAs were essentially canonical, but they were significantly underrepresented in both cancer types (Fig. 1a,d,e). Remarkably, we identified only a single mTSA in NSCLC and primary melanomas and four in melanoma cell lines.
Predicted mTSAs are poor MAP generators
To understand the scarcity of mTSAs identified using mass spectrometry (MS), we assessed the presentation of predicted mTSAs encoded by mutated protein-coding exons. mTSA predictions were based on nonsynonymous mutations (single- and multiple-nucleotide variants and short insertion–deletion events, indels) called from RNA-seq for primary samples and from RNA-seq and exome sequencing (exome-seq) for melanoma cell lines with data available from Chong et al.18 (Methods) (Fig. 2a and Supplementary Tables 8–15).
Fig. 2. Predicted mTSAs are poor MAP generators.

a, Number of nonsynonymous mutations per Mb per sample in melanoma (left) and NSCLC (right), called from RNA-seq or exome-seq or identified from exome-seq and expressed in the RNA-seq data. b, Stacked bar plot showing the number of nonsynonymous mutations generating at least one predicted mTSA with strong binding affinity to HLA (percent rank elution < 0.5, NetMHCpan-4.1b) or with weak binding affinity to HLA (0.5 < percent rank elution < 2, NetMHCpan-4.1b) or neither. c, Stacked bar plot showing the number of predicted mTSAs per sample in melanoma (left) and NSCLC (right) and binding status according to the strongest binding affinity to the corresponding sample’s HLA alleles. d, Number of predicted mTSAs identified by MS using mTEC k-mer databases in melanoma (left) and NSCLC (right). a–d, n = 8 primary melanoma samples, seven melanoma cell lines, 26 NSCLC samples.
The first observation we made was that most nonsynonymous mutations (83% in NSCLC and 85% in melanoma) were predicted to generate mTSAs, for a median of 959 predicted mTSAs per sample in NSCLC (range, 416–1,787) and 1,294 in melanoma (range, 381–3,709) (Fig. 2b,c and Supplementary Tables 8–15). In other words, most exonic nonsynonymous mutations can code for a MAP with adequate predicted MHC I-binding affinity (elution percentile rank < 2, NetMHCpan-4.1b43). However, only a tiny proportion of these predicted mTSAs per sample were detected by MS (Fig. 2d and Supplementary Tables 8–15). Because our initial personalized MS databases included only sequences derived from single-nucleotide variants (Extended Data Fig. 1a and the Methods), we performed new MS searches with databases comprising all sample-specific predicted mTSAs (spanning single- and multiple-nucleotide variants and indels). Only one additional predicted mTSA from a multinucleotide variant was identified in melanoma and one from a single-nucleotide variant in NSCLC (Extended Data Fig. 4a and Supplementary Table 15). Overall, the two databases allowed the identification of 48 nonredundant mTSA candidates across NSCLC and melanoma samples. Next, we performed transcriptomic analyses of tumor samples and normal tissues to determine which of the 48 mTSA candidates were genuine mTSAs. Only five MAPs were validated as genuine exonic mTSAs (Fig. 1a and Supplementary Tables 5–15). The remaining 43 mTSA candidates did not qualify as targetable mTSAs due to high expression in normal tissues, either because (1) in normal samples, other nonmutated genomic regions were expressed for which the amino acid sequence matched the purported mTSA sequences, as previously observed for other proposed mTSAs40, or (2) the purported somatic mutations called from tumor RNA were rare germline variants that were found in later dbSNP versions and normal samples or were instances of RNA editing occurring in normal tissues as well (Extended Data Fig. 4b–d). Accordingly, most of the 43 predicted mTSAs were found in the human leukocyte antigen (HLA) Ligand Atlas44 (Supplementary Tables 8–15).
Extended Data Fig. 4. MS-based identification of predicted mTSAs.

a, Number of predicted mTSAs identified by mass spectrometry (MS) using mTEC k-mer databases concatenated with all predicted mTSA sequences derived from single- and multi-nucleotide variants and INDELs in melanoma (upper, n = 15 samples) and NSCLC (lower, n = 26 samples). b, Heatmap showing the expression of all RNA sequences with perfect alignment to the reference genome+dbSNP155 coding for 43/48 non-redundant predicted mTSAs identified by mass spectrometry (from panel a and Fig. 2d) across normal tissues [from GTEx, purified melanocytes, bronchial brushing samples (GSE79209), purified blood and bone marrow (BM) cells, mTECs] and the cancer samples analyzed herein. Numbers in parentheses represent the number of samples analyzed. c, Heatmap showing the expression of the mutated RNA sequences corresponding to 5/48 non-redundant predicted mTSAs identified by mass spectrometry (from panel a and Fig. 2d) that had no perfect alignment to the reference genome+dbSNP155 across normal tissues [from GTEx, purified melanocytes, bronchial brushing samples (GSE79209), purified blood and bone marrow (BM) cells, mTECs] and cancer samples (from TCGA, various published datasets3,5,7,9,18,50–52, or analyzed herein). Peptide RVWDVSGLRK was a predicted mTSA generated from the Ile164Val variant in COPA at the RNA editing site chr1:160332454110. Numbers in parentheses represent the number of samples analyzed. d, Bar plot shows the read count expression of RNA sequences coding for the predicted mTSAs identified by MS and with perfect alignment to the reference genome+dbSNP155 (peptides from panel b, 10/43 peptides excluded due to respective mutation selected with dbSNP149 matching variant in dbSNP155), for their corresponding mutated sequences (dark blue) and sequences matching the reference genome+dbSNP155 (light blue). *, expression of the non-synonymous mutated sequence is higher than the unmutated sequences coding for the same peptide in the sample of origin.
RNA expression is a prerequisite of MAP presentation17,34,45. We noted that at most 32% of the exome-derived mutations were expressed in the RNA-seq reads from melanoma cell lines (range of 23–32%; Fig. 2a and Supplementary Tables 8–15), an observation consistent with another recent report46, meaning that most exonic mutations have no chance of MAP generation. In addition, we compared the expression of the RNA sequences (8–11 codons in length) coding for predicted mTSAs that generated MAPs or not and those coding for the unmutated TAs identified in the present study (Fig. 1a). We found that predicted mTSAs that were not detected by MS analyses had an RNA expression significantly inferior to that of unmutated TAs, whereas the expression of predicted mTSAs that generated MAPs lay in between (Fig. 3a). The same pattern was observed when we analyzed the entire set of transcripts coding for predicted mTSAs (rather than only the short MAP-coding sequence): they were less expressed than transcripts coding for unmutated TAs or other MAPs identified in this study (Fig. 3b). To validate further the negative impact of low RNA expression on MAP generation, we extended our analyses to all unmutated MAPs. In both NSCLC and melanoma, transcripts coding for predicted mTSAs undetected by MS generated fewer unmutated MAPs than other classes of transcripts (Fig. 3c). This indicates that transcripts coding for predicted mTSAs were overall less processed for antigen presentation primarily because of low RNA expression. Of note, features regulating the protein regulation rate (disorder, instability and ubiquitination) showed subtle or no significant intergroup differences (Extended Data Fig. 5a–c).
Fig. 3. RNA expression disfavors predicted mTSA presentation.
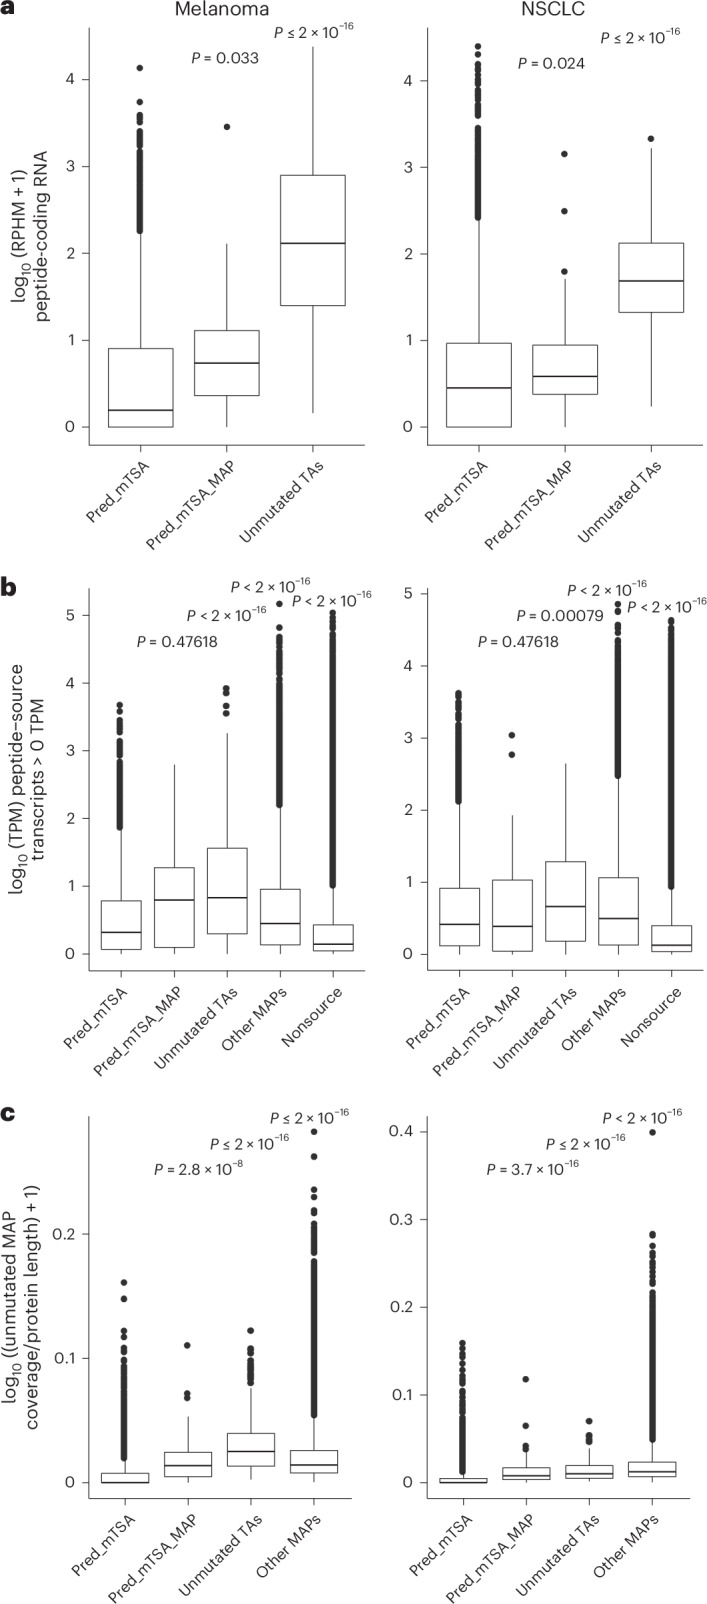
a, Expression of the peptide-coding RNA sequences for predicted mTSAs generating no MAPs (pred_mTSA), predicted mTSAs generating MAPs (pred_mTSA_MAP) and unmutated TAs, across melanoma (left) and NSCLC (right) samples. RPHM, reads per hundred million reads. Pred_mTSA (melanoma, n = 23,919 peptides; NSCLC, n = 26,271 peptides); pred_mTSA_MAP (melanoma, n = 18 peptides; NSCLC, n = 52 peptides); unmutated TA (melanoma, n = 596 peptides; NSCLC, n = 116 peptides). b, Expression of the transcripts’ (with non-null expression) source of pred_mTSA, pred_mTSA_MAP, unmutated TAs, other MAPs or transcripts generating no MAPs (nonsource), across melanoma (left) and NSCLC (right) samples. TPM, transcripts per million. c, Proportion of amino acids covered by unmutated MAPs per protein corresponding to transcripts with non-null expression source of pred_mTSA, pred_mTSA_MAP, unmutated TAs or other MAPs, across melanoma (left) and NSCLC (right) samples. Pred_mTSA (melanoma, n = 9,133 transcripts; NSCLC, n = 11,999 transcripts); pred_mTSA_MAP (melanoma, n = 24 transcripts; NSCLC, n = 67 transcripts); unmutated TA (melanoma, n = 637 transcripts; NSCLC, n = 183 transcripts); other MAPs (melanoma, n = 187,834 transcripts; NSCLC, n = 270,608 transcripts); nonsource (melanoma, n = 1,085,966 transcripts; NSCLC, n = 2,509,130 transcripts) (b,c). a–c, n = 15 melanoma and 26 NSCLC samples. All box plots show the median (center line) and IQR (box with limits at 25th and 75th percentiles), whiskers extend to the largest value no further than 1.5 × IQR from the box hinges, and black dots represent outliers beyond the whiskers. P values from two-sided Wilcoxon’s nonparametric test, with predicted mTSAs’ source RNA or transcripts generating no detectable MAPs as a reference group; no adjustments were made for multiple testing.
Extended Data Fig. 5. Selected features of transcripts source of predicted mTSAs and other MAPs.

a, Predicted instability index from protParam for the reference protein sequences corresponding to the transcripts source of predicted mTSAs generating no MAPs (pred_mTSA_source), predicted mTSAs generating MAPs (pred_mTSA_MAP-source), unmutated TAs (unmutated_TA-source), and other MAPs (other MAP-source) across melanoma (left, n = 15 samples) and NSCLC (right, n = 26 samples) samples. The red dotted line corresponds to an instability index of 40, above which proteins are predicted to be unstable. pred_mTSA_source (n = 8764 transcripts, melanoma; n = 11490, NSCLC), pred_mTSA_MAP-source (n = 24 transcripts, melanoma; n = 65, NSCLC), unmutated_TA-source (n = 619, melanoma; n = 179, NSCLC), other MAP-source (n = 178333 transcripts, melanoma; n = 255944, NSCLC). b, Proportion of disordered residues from IUPred per reference protein sequences corresponding to the transcripts source of predicted mTSAs generating no MAPs (pred_mTSA_source), predicted mTSAs generating MAPs (pred_mTSA_MAP-source), unmutated TAs (unmutated_TA-source), and other MAPs (other MAP-source) across melanoma (left, n = 15 samples) and NSCLC (right, n = 26 samples) samples. pred_mTSA_source (n = 9133 transcripts, melanoma; n = 12002, NSCLC), pred_mTSA_MAP-source (n = 24 transcripts, melanoma; n = 67, NSCLC), unmutated_TA-source (n = 637, melanoma; n = 183, NSCLC), other MAP-source (n = 187928, melanoma; n = 268142, NSCLC). c, Proportion of residues prone to ubiquitination from UbPred per reference protein sequences corresponding to the transcripts source of i) predicted mTSAs generating no MAPs (pred_mTSA_source), ii) predicted mTSAs generating MAPs (pred_mTSA_MAP-source), iii) unmutated TAs (unmutated_TA-source), and iv) other MAPs (other MAP-source) across melanoma (left, n = 15 samples) and NSCLC (right, n = 26 samples) samples. The number of transcripts per category were: pred_mTSA_source (n = 8763 in melanoma; n = 11493 in NSCLC), pred_mTSA_MAP-source (n = 24 in melanoma; n = 65 in NSCLC), unmutated_TA-source (n = 619 in melanoma; n = 179 in NSCLC), other MAP-source (n = 178414 in melanoma; n = 256064 in NSCLC). d, Genomic distribution of MAPs defining MAP hotspots. Each black line across the chromosomes represents the genomic start site of a canonical MAP from IEDB, the HLA ligand atlas45, or identified in this study (n = 506,908 non-redundant MAPs). e, Proportion (and absolute numbers) of TAAs from melanoma (left) and NSCLC (right) samples (reported in Fig. 1a and Supplementary Tables 6 and 7) that overlap or not with MAP hotspots. n = 19 melanoma and 26 NSCLC samples. f, Proportion (and absolute numbers) of MAPs predicted from normal PBMC-derived non-synonymous germline variants on Chr1 (total) and those predicted and detected by MS in the matched melanoma cell lines18 (generating MAPs) that overlap or not with MAP hotspots. OR = 0.1824, p < 0.0001, Fisher’s exact test. n = 7 melanoma cell lines. g, Expression of the transcripts (with non-null expression) source of MAPs predicted from non-synonymous germline variants on Chr1 that were not detected by mass spectrometry (pred_germline-source), or were detected by mass spectrometry (pred_germline_MAP-source), unmutated TAs, and other MAPs, across melanoma cell lines. TPM, transcript per million. Pred_germline-source (n = 5027 transcripts); pred_germline_MAP-source (n = 84 transcripts); unmutated_TAs (n = 532 transcripts); other_MAPs (n = 128510 transcripts). n = 7 melanoma cell lines. h, Heatmap showing the expression of the unmutated RNA sequences matching the reference genome+dbSNP and coding for 16/21 predicted mTSAs selected from seven NSCLC samples to be tested using targeted mass spectrometry, across normal tissues [from GTEx, purified melanocytes, bronchial brushing samples (GSE79209), purified blood and bone marrow (BM) cells, mTECs]. 5/21 predicted mTSAs selected for targeted mass spectrometry had no perfect alignment to the reference genome+dbSNP and are not shown. The number of samples analyzed per tissue is noted in parentheses. i, Mirror plot showing the MS spectra and Pearson correlation coefficient (r) for the endogenous predicted mTSA identified (bottom) and its corresponding synthetic analog (top). All box plots show the median (center line) and interquartile range (IQR, box with limits at 25th and 75th percentiles), whiskers extend to the largest value no further than 1.5 * IQR from the box hinges, and black dots represent outliers beyond the whiskers. Significance values from two-sided Wilcoxon test, with predicted mTSAs generating no MAPs as a reference group; no adjustments were made for multiple testing.
We previously reported that MAPs preferentially derive from selective genomic regions called MAP hotspots20. These MAP hotspots are actively transcribed and translated and generate a high proportion of defective ribosomal products34,45,47. We therefore asked whether predicted mTSAs were located within MAP hotspots. We defined MAP hotspots as the genomic regions within annotated ORFs generating at least one unmutated MAP reported in the Immune Epitope Database (IEDB) or the HLA Ligand Atlas44 or identified in this study (n = 506,908 nonredundant MAPs; Fig. 4a and Extended Data Fig. 5d). We found that only 25% of NSCLC and 33% of melanoma mutations called from RNA-seq data overlapped these MAP hotspots (Fig. 4b). Notably, predicted mTSAs deriving from mutations outside MAP hotspots were at least five times less likely to generate MAPs than mutations in MAP hotspots in both NSCLC (MAP hotspots-in, 37 of 8,186 versus MAP hotspots-out, 15 of 18,396, P < 0.001, Fisher’s exact test) and melanoma (MAP hotspots-in, 14 of 5,577 versus MAP hotspots-out, four of 8,432, P < 0.005, Fisher’s exact test) (Fig. 4c). These MAP generation rules held for TAAs (when TAAs identified solely in this study were excluded from the list of MAP hotspots) and nonsynonymous germline variants as well. Indeed, TAAs (Supplementary Tables 5–7) and predicted nonsynonymous germline variants generating MAPs detected by MS had a high rate of overlap with MAP hotspots (Extended Data Fig. 5e,f), and they derived from transcripts with high expression (Fig. 3b for TAAs and Extended Data Fig. 5g for germline variants called for melanoma cell lines).
Fig. 4. Predicted mTSAs are preferentially located outside MAP hotspots.

a, Illustration depicting MAP hotspots, defined as the genomic regions generating unmutated canonical MAPs from the IEDB or the HLA Ligand Atlas19 or identified in this study (n = 506,908 nonredundant MAPs). Somatic mutations within MAP hotspots are expected to have a higher likelihood of MAP generation. b, Proportion (and absolute numbers) of nonsynonymous mutations called from RNA-seq that overlap or not with MAP hotspots across melanoma (left, n = 15) and NSCLC (right, n = 26) samples. c, Proportion (and absolute numbers) of predicted mTSAs called from RNA-seq (total) and of predicted mTSAs called from RNA-seq and detected by MS (generating MAPs) that overlap or not with MAP hotspots across melanoma (left, n = 15) and NSCLC (right, n = 26) samples. d, Box plots showing the expression of nonsynonymous mutations generating predicted mTSAs (in read counts of variant at the location, left) and of predicted mTSA-coding sequences (in RPHM, right) in seven NSCLC samples. Nonsynonymous mutations and the respective predicted mTSAs selected for targeted MS are highlighted in blue (tested, not detected), red (tested and detected) or yellow (synthesis unsuccessful) circles. Number of variants per sample (left): AAEQEAGO-T (n = 327), COT6ZACG-T (n = 166), ILS34047D3-T (n = 109), ILS36726FT2-T (n = 188), ILS39926FT3-T (n = 151), ILS40683FT1-T (n = 112), ILS40700FT3-T (n = 162). Number of predicted mTSAs per sample (right): AAEQEAGO-T (n = 1,644), COT6ZACG-T (n = 825), ILS34047D3-T (n = 495), ILS36726FT2-T (n = 901), ILS39926FT3-T (n = 610), ILS40683FT1-T (n = 414), ILS40700FT3-T (n = 592). Box plots show the median (center line) and IQR (box with limits at 25th and 75th percentiles), whiskers extend to the largest value no further than 1.5 × IQR from the box hinges, and black dots represent outliers beyond the whiskers.
Finally, to evaluate whether higher MS sensitivity could enlarge the detection of predicted mTSAs, we selected 21 predicted mTSAs in seven NSCLC samples for targeted MS analysis (Supplementary Tables 8–15). Targeted MS can be used only for a limited number of MAPs at a time, but it is more sensitive than shotgun MS (used at the discovery stage) and yields quantitative results48. We selected the three ‘best’ mTSA candidates per sample across seven NSCLC samples. Criteria for sequential selection were (1) the mTSA candidates derived from different variants with the highest alternative read count in the sample of origin, for which no predicted mTSAs were detected by shotgun MS, (2) for each variant location, priority was given to peptides predicted to bind multiple HLA alleles per sample, (3) next, priority was given to strongest HLA binders (based on percent rank elution in NetMHCpan-4.1b18). Three of the predicted mTSAs had no RNA reads covering the entire peptide-coding sequence in the samples of origin, and one predicted mTSA could not be synthesized, indicating a poor interest for therapy (Fig. 4d). Altogether, only one predicted mTSA was detected by targeted MS. It represents a targetable mTSA, as it was not expressed in normal tissues (Fig. 4d and Extended Data Fig. 5h,i). This demonstrates that the lack of MS detection of most predicted mTSAs is more likely due to a lack of presentation than the detection threshold of MS analyses.
We conclude that, in melanoma and NSCLC, most predicted mTSAs do not generate MAPs presented at the cell surface because their coding sequences are preferentially located outside MAP hotspots in lowly expressed transcripts.
aeTSAs are immunogenic and may contribute to ICB response
Despite their high abundance in cancer cells, little is known about the role of unmutated TAs in spontaneous or treatment-induced anti-tumor immunity in vivo. To evaluate this, we first predicted the number of unmutated TAs identified here (Fig. 1a) in pretreatment biopsies from patients with NSCLC and melanoma treated with ICB (anti-PD-1, anti-PD-L1, anti-CTLA). TA presentation in individual tumors was inferred based on two criteria: expression at the RNA level of both the TA and a cognate HLA allotype (that is, presence of TA–HLA pairs)17. In all datasets tested for melanoma3,5,7,9,49–51 and NSCLC4,41, patients presented high numbers of TA–HLA pairs. Still, no significant difference in the number of TA–HLA pairs was seen in pretreatment samples between responders and nonresponders (Fig. 5a and Extended Data Fig. 6a,b). A recent meta-analysis suggests that the lack of correlation between TA load and response to ICB commonly results from a threshold effect: when one or a few TAs are immunogenic, having more TAs does not confer any advantage52. For now, the lack of immunopeptidomics data and complete sets of unmutated TAs from these patients prevents us from drawing definitive conclusions on the value of unmutated TA numbers in predicting response to ICB.
Fig. 5. aeTSAs may contribute to the response to ICB in melanoma.

a, Box plots showing the number of TA–HLA pairs per pretreatment sample (gray dots) from Riaz et al.24, according to the response groups from the original study. P values from unpaired two-tailed t-test. PRCR (n = 7 patients), PD (n = 12 patients), SD (n = 8 patients). b, Box plots showing the number of TA–HLA pairs in pretreatment (pre) and on-treatment (on) samples from Riaz et al.24. Gray lines connect pretreatment and on-treatment samples per patient; P values from paired two-tailed t-test. PRCR (n = 7 patients), PD (n = 12 patients), SD (n = 8 patients). c, Pearson’s correlation between the number of expanded T cell clones and the number of TA–HLA pairs lost on-therapy per patient (colored dots; PRCR, n = 5 patients; PD, n = 9 patients) from Riaz et al.24. Patients with SD were excluded due to the low number of samples with both RNA-seq and TCR-seq data (n = 2 patients). a,b, All box plots show the median (center line) and IQR (box with limits at 25th and 75th percentiles), whiskers extend to the largest value no further than 1.5 × IQR from the box hinges, and black dots represent outliers beyond the whiskers. No adjustments were made for multiple testing. PRCR, PD or SD, as reported by Riaz et al.3.
Extended Data Fig. 6. The predicted presentation of unmutated TAs in melanoma and NSCLC samples from patients receiving ICB.

a, b, Box plots showing the number of TA-HLA pairs (that is, the sum of the HLA alleles per sample capable of presenting each expressed TA) per pre-treatment sample (grey dots) from various published studies in melanoma5,7,9,50,51 (a) and NSCLC4,42 (b), according to the response groups from the original studies. P-values from unpaired two-tailed T-test; no adjustments were made for multiple testing. Numbers in parentheses represent number of patients per response group. c, d, Box plots showing the number of TA-HLA pairs in pre- and on-treatment samples from Gide et al.50 (c) and Du et al.51 (d) according to the response groups from the original studies. Grey lines connect pre- and on-treatment samples per patient; p-values from paired two-tailed T-tests are indicated, with no adjustments made for multiple testing. Numbers in parentheses represent number of patients per response group. e, Box plots showing the difference in purity scores from ESTIMATE between on- and pre-therapy samples, where negative values indicate a decrease in tumor purity on-therapy in samples from Riaz et al.3 (left). The heatmap on the right shows Pearson’s correlation coefficient between the purity change (from the left panel) and the change in the number of TA-HLA pairs in on- vs. pre-ICB samples from corresponding patients. Numbers in parentheses represent number of patients per response group. f, FEST assay showing the expansion of specific CD8 T cell clonotypes following in vitro stimulation with the indicated aeTSAs selected based on their complete loss of RNA expression on-therapy in at least one responder from Riaz et al.3. Number of TCRB clonotypes expanded per condition listed in Supplementary Table 16. g, Flow cytometry gating strategy for cytotoxicity experiments analyzed by flow (plots from experiment 1 and replicate 1 of condition B-LCLs m13 + T m13, Fig. 6b and Source Data Fig.5e). The cell morphology was used to gate on viable cells based on FSC-A (size) and SSC-A (complexity). Then, FSC-A and FSC-H were used to gate on singlet cells. Finally, remaining viable B-LCL target cells were gated and counted based on CFSE+/7-AAD− staining. All box plots show the median (center line) and interquartile range (IQR, box with limits at 25th and 75th percentiles), whiskers extend to the largest value no further than 1.5 * IQR from the box hinges, and black dots represent outliers beyond the whiskers.
In their previous study of anti-PD-1 therapy in melanoma, Riaz and colleagues reported a linear correlation between the number of expanded T cell clones and the number of predicted mTSAs lost on-therapy in responders (patients with partial and complete response, PRCR) but not in nonresponders (patients with stable or progressive disease, SD or PD)3. Notably, using Riaz et al.’s data3, we found that responders, but not nonresponders, showed a marked decrease in the number of unmutated TA–HLA pairs on-therapy (Fig. 5b), which could not be explained solely by decreased tumor purity (Extended Data Fig. 6e). The positive correlation between unmutated TA disappearance and response to ICB was validated in one of two additional datasets with pre-ICB and on-ICB samples49,50 (Extended Data Fig. 6c,d). Furthermore, the loss of aeTSA–LA numbers in responders had a strong linear correlation with the number of T cell clones expanded on-therapy, whereas a positive but nonsignificant correlation with T cell expansion was observed for TAAs and LSAs (Fig. 5c).
To determine whether the melanoma aeTSAs lost in responders are immunogenic and can be recognized by CD8+ T cells, we first performed a functional expansion of specific T cells (FEST) assay53. In FEST assays, T cell receptor (TCR)B sequencing is performed on T cells isolated from healthy donor PBMCs and stimulated with autologous cells pulsed or not with synthetic aeTSAs. TCR clonotypes responsive to aeTSAs are then identified based on their significant expansion in the aeTSA-stimulated condition compared to the control. The FEST assay was performed on 12 melanoma aeTSAs identified here (Fig. 1a and Supplementary Table 6), selected based on (1) their complete loss of expression on-therapy in at least one responder, (2) their HLA allotypes matching those of the healthy PBMC donor, (3) their biotype (nine of 12 noncanonical) and (4) previously unreported status (Supplementary Tables 16–20). Stringent criteria revealed that all 12 aeTSAs were immunogenic and induced a polyclonal T cell expansion (range of four to 14 specific CD8+ T cell clonotypes; Fig. 6a, Extended Data Fig. 4f and Supplementary Tables 16–20), an important factor in the long-term clinical benefit from ICB in melanoma21. The proliferative capacity of aeTSA-responsive T cells (29-fold to 5,753-fold; Fig. 6a and Supplementary Tables 16–20) is relevant because it is the first effector function lost by anergic or exhausted T cells54–56. Nevertheless, to provide incontrovertible evidence of the functional quality of the aeTSA-directed T cell response, we also performed cytotoxicity assays on six HLA-A*02:01-binding aeTSAs (of which one was also tested in the FEST assay, and an additional five aeTSAs were selected based on their high expression in melanoma samples; Fig. 6a,b, Extended Data Fig. 6f and Supplementary Table 6). T cells primed against at least four of these aeTSAs killed aeTSA-presenting B lymphoblastoid cell line (B-LCL) target cells very efficiently: their cytotoxic activity was equal or superior to that of T cells primed against viral peptides (from NS3 and Gag) used as controls (Fig. 6b and Extended Data Fig. 6g). Tetramer staining and interferon γ (IFN-γ) enzyme-linked immunosorbent spot (ELISpot) assays confirmed that CD8+ T cells expanded by these four aeTSAs were specific and functional, respectively (Fig. 6c,d and Extended Data Fig. 7a,b). Lastly, we tested whether T cells primed against two of these aeTSAs would kill unmanipulated (that is, unpulsed, untransfected) melanoma cells constitutively expressing the aeTSAs. The targets were the melanoma cell lines used for aeTSA discovery (Fig. 1a and Supplementary Table 6). Remarkably, while these two aeTSAs had RNA expression 500–1,700 times lower than the unmodified MelanA control peptide (EAAGIGILTV), they mediated equal or superior killing of the melanoma cell lines presenting them. No specific killing was observed when the aeTSA was not detected at the RNA or peptide level (Fig. 6e and Extended Data Fig. 7c,d). These functional assays demonstrate that aeTSAs are highly immunogenic and mediate specific and effective killing of cells expressing them.
Fig. 6. aeTSAs are immunogenic.

a, FEST assay showing the expansion of specific CD8+ T cell clonotypes (n indicated in red) following stimulation with the indicated aeTSAs, compared with unpulsed CD8+ T cells (FC, fold change). Box plots show the median (center line) and IQR (box with limits at 25th and 75th percentiles); whiskers extend to the largest value no further than 1.5 × IQR from the box hinges. n = 1 biological sample per peptide. b, Specific lysis (%) of peptide-pulsed B-LCLs after overnight co-incubation with peptide-primed T cells, expressed as percent compared to dimethylsulfoxide (DMSO)-pulsed B-LCLs. Calculated on the mean number of cells from technical triplicates. Bar plot shows the mean of two independent experiments. c, Flow cytometry plots show the percentage of tetramer-positive cells among live CD8+ T cells following expansion with the peptide indicated. The expansion fold of tetramer-positive CD8+ T cells is shown in red compared to the DMSO-expanded CD8+ T cell condition. n = 1 biological sample per peptide. d, Number of spot-forming units (SFU) per 106 (M) CD8+ T cells, measured by an IFN-γ ELISpot assay. Data represent the mean and individual data points for three technical replicates from one independent experiment (n = 1 independent experiment performed). e, Quantification of Incucyte images after 3 h of co-culture. Bar plot represents the percentage of cytotoxicity for each melanoma cell line co-cultured with peptide- or DMSO-primed CD8+ T cells. The MelanA-negative A375 melanoma cell line was used as a negative control for ELAGIGILTV-expanded CD8+ T cells. RNA expression values (RPHM) of each peptide in the respective cell line are displayed in red below each bar. The RPHM value shown for ELAGIGILTV corresponds to the unmodified peptide counterpart, EAAGIGILTV. NA, not applicable. Numbers in blue represent the fold change compared to the DMSO condition. Data represent the mean and individual data points for three technical replicates from one independent experiment (n = 1 independent experiment performed). a–e, Anti-aeTSA T cells were generated by priming T cells from healthy donors with autologous peptide-pulsed PBMCs (Methods).
Extended Data Fig. 7. Immunogenicity assays and sharing of unmutated Tas.

a-b, Flow cytometry plots showing the gating strategy used to quantify the percentage of expanded peptide-positive CD8 T cells shown in Fig. 6c, using the VLWRGDSPL-expanded condition as a representative example (a), and the percentage of peptide-specific CD8 T cells in the DMSO condition for all peptides shown in Fig. 6c (b). n = one biological sample per peptide. c, Representative images of the cytotoxicity assay using CellTracker GFP (green) as a marker for live target cells (Me275, Me290, and A375) and YOYO-3 (red) as a marker of dead cells, captured by Incucyte® S3 live-cell imaging at the 3 h time point. White arrows point to target cells killed by specific T cells (orange/yellow/red with faint green). The scale bar is 100 µm. d, Percentage of cytotoxicity at different time points in the T-cell killing assay imaged over time using an Incucyte for each melanoma cell line indicated. The 3 h time point is presented in Fig. 6e. The dotted line represents the maximum cytotoxicity level across time points in the DMSO condition. Data represent the mean and standard deviation of three technical replicates at each time point per condition. e-f, Stacked bar chart showing the proportion (and absolute numbers) of genes generating TAs across different numbers of melanoma (e, n = 19 samples) and NSCLC (f, n = 26 samples) samples analyzed.
Overall, these results suggest a previously underappreciated contribution of unmutated TAs, particularly aeTSAs, to the anti-tumor response induced by ICB in melanoma and warrant further investigation of their role in mediating tumor control and their therapeutic potential across cancers, independent of the TMB.
aeTSAs are ideal candidates for immunotherapy
A therapeutically attractive feature of unmutated TAs is their sharing between patients. In contrast to mTSAs, which were rare, lowly expressed and largely patient specific, unmutated TAs from melanoma and NSCLC were abundant and shared at the peptide and RNA levels (Fig. 7a–d). The MAP-level sharing further increased when considering sharing at the gene level to account for HLA heterogeneity across the samples analyzed (Extended Data Fig. 7e,f and Supplementary Tables 6, 7, 21 and 22). Nevertheless, unmutated TAs showed TA type-, cancer type- and cancer subtype-specific expression pattern and regulation. Specifically, we found that aeTSAs and TAAs were highly shared in melanoma and LUSC samples from TCGA (Fig. 7c,d). Consistent with an increased stemness of these tumors (Extended Data Fig. 8a), many of these shared TAs were encoded by oncofetal (or cancer germline) genes (aeTSAs) and cell cycle genes (TAAs) (Supplementary Tables 5–7 and 21–24). Notably, the top TAA-generating gene across NSCLC samples was UHRF1, an epigenetic regulator and oncogenic driver for which overexpression promotes cell cycle progression and tumor growth in several cancer types57 (Supplementary Table 22). By contrast, NSCLC-derived LSAs, primarily derived from ROS1, extracellular matrix-related genes (that is, COL6A5, ADAMTS12) or genes involved in surfactant production (that is, SFTPA1; Supplementary Tables 5–7) were preferentially detected in the LUAD subtype, the predominant cells of origin of which are alveolar type 2 cells (Fig. 7d and Extended Data Fig. 8b).
Fig. 7. TA sharing and expression regulation across cancer samples.

a,b, Stacked bar chart showing the proportion of TA types (and absolute TA numbers) shared between different numbers of melanoma (a, n = 19) and NSCLC (b, n = 26) samples analyzed. c,d, Box plots showing the proportion of TCGA samples expressing each TA (gray dots) at least two times higher than the 95th-percentile value for the respective TA in Genotype–Tissue Expression (GTEx) samples except the testis for melanoma TAs (c) or in normal bronchial brushing samples and GTEx samples except the testis for NSCLC TAs (d). Box plots show the median and IQR, and whiskers extend to the largest value no further than 1.5 × IQR from the box hinges. e,f, Spearman’s correlation between the RPHM expression of each melanoma TA and the corresponding omics value (source gene expression (FPKM, fragments per kilobase of transcript per million mapped reads), copy number variation, methylation βvalue and TMB) across the analyzed SKCM samples from TCGA (e), and the proportion of TAs with a significant correlation (adjusted P value (Padj) < 0.05, heatmap cells with * in e) among TAs with omics data available (non-empty cells in e) (f). g,h, Spearman’s correlation between the RPHM expression of each NSCLC TA and the corresponding omic values (source gene expression (FPKM), copy number variation, methylation β value and TMB) across the analyzed LUSC and LUAD samples from TCGA according to the smoking history status (g) and the proportion of TAs with a significant correlation (Padj < 0.05, cells with * in g) among TAs with omics data available (non-empty cells in g) (h). Numbers in parentheses represent the minimum number of samples analyzed per TA (e,g). Correlation data for TMB in TCGA-LUSC; nonsmokers were excluded due to the low number of samples (n < 5). a–e,g, Total TA numbers are per the data in Fig. 1a.
Extended Data Fig. 8. TA expression according to cancer subtype, smoking history and select oncogene status.

a, Box plots showing the stemness scores obtained using ssGSEA in the TCGA samples studied herein across the LUAD, LUSC, and SKCM cohorts. P-values from two-sided Wilcoxon test. Numbers in parentheses indicate the number of samples analyzed per tissue. b, Number of TAs identified in the primary NSCLC samples studied here, based on the NSCLC subtype. P-values for comparing adenocarcinoma (LUAD) and squamous cell carcinoma (LUSC) samples using a two-tailed unpaired T-test. Numbers in parentheses indicate the number of samples. c, Non-synonymous mutation rates (obtained from Firebrowse) in samples analyzed from TCGA, according to their NSCLC subtype and smoking history from cBioPortal. P-values for the comparison between smokers and non-smokers from a two-tailed unpaired T-test. Numbers in parentheses indicate the number of samples. d, RNA expression for unmutated TAs in TCGA samples analyzed according to the NSCLC subtype and smoking history. P-values for the comparison between smokers and non-smokers from a two-tailed Wilcoxon test. Numbers in parentheses indicate the number of samples. aeTSA (n = 22), TAA (n = 40), LSA (n = 27). e, Number of TAs with non-null RNA expression across TCGA samples analyzed according to the NSCLC subtype and smoking history. P-values for the comparison between smokers and non-smokers from a two-tailed unpaired T-test. Numbers in parentheses indicate the number of samples. f, Comparison of TCGA-LUSC and TCGA-LUAD patient numbers expressing ≥ median numbers of TAs with high expression (heTA, for each TA type) versus the others, among patients with (MUT) or without (WT) mutations in indicated genes (P-values from Fisher’s exact test). The number of patients per group is shown above each bar. All box plots show the median (center line) and interquartile range (IQR, box with limits at 25th and 75th percentiles), whiskers extend to the largest value no further than 1.5 * IQR from the box hinges, and black dots represent outliers beyond the whiskers. No p-value adjustments were made for multiple testing.
Using TCGA multiomics data, we found a pronounced correlation between the RNA expression of TAs and their corresponding source genes, suggesting a gene-level regulation (Fig. 7e–h). Expression of aeTSAs was often correlated with hypomethylation of the source gene promoters in both NSCLC and melanoma. By contrast, in melanoma, TAAs and LSAs showed a prevalent association with both the focal DNA copy number (CNV) and the hypomethylation of source gene promoters, whereas no TA type was correlated with the TMB (Fig. 7e,f). In LUSC, the CNV was the most important contributor to TAA expression, whereas LSAs were underrepresented in this subtype (Fig. 7g,h and Extended Data Fig. 8b). Lastly, in LUAD, TAA and LSA expression was associated with smoking status and TMB (Fig. 7g,h). A history of smoking correlated with a higher TMB, higher TAA (and aeTSA) expression and lower LSA expression (Fig. 6g,h and Extended Data Fig. 8c,d), consistent with reports showing that the TMB in LUAD is increased in metastases and samples with poor differentiation58. Consequently, nonsmokers with LUAD showed a higher number of LSAs expressed at the RNA level, which were often correlated with increased CNV and source gene promoter hypomethylation (Fig. 7f and Extended Data Fig. 8e). Nevertheless, despite the association between TA numbers and overall TMB, the number of TAs with high expression (that is, above-median expression across patients with non-null expression for a given TA) in patients with LUAD and LUSC was independent of the nonsynonymous mutation status of select oncogenes59, except for EGFR mutations, which were associated with high LSA expression in LUAD (Extended Data Fig. 8f). In summary, these results indicate that, in agreement with the role of MAPs in mirroring the internal cell state, TA expression reflects cancer cell programs shared between patients and regulated, at least in part, at the mutational and/or epigenetic level. The association with cancer (sub)type, smoking history and degree of dedifferentiation suggests that unmutated TA prioritization is possible and likely important for effective therapy.
MAPs obtained from MHC I immunoprecipitation of bulk tumor lysates are ‘contaminated’ by peptides from tumor-infiltrating immune cells and other stromal cells in the microenvironment60. Hence, we aimed to validate that unmutated TA expression is associated with malignant cells (or with the cell lineage of origin for LSAs) using published single-cell RNA-seq (scRNA-seq) datasets from melanoma61 and NSCLC62 (Extended Data Fig. 9). We found that unmutated TAs were highly and primarily expressed by cancer cells in both cancer types (Extended Data Fig. 10). Among the aeTSAs detected, most were expressed in cancer cells only (72% in melanoma and 88% in NSCLC), whereas most NSCLC LSAs were cancer- and alveolar cell specific (Fig. 8a,b). When detected in annotated noncancer cells, TA expression was associated with up to 100% cell doublet formation between noncancer and cancer cells (Fig. 8c). Indeed, melanoma TA-positive noncancer cell populations showed increased expression of melanoma (and melanocyte) markers MLANA and PMEL compared to TA-negative noncancer cells (Fig. 8d). Hence, aeTSAs were cancer cell specific, and their detection in other cell populations resulted from technical limitations in single-cell sample preparation.
Extended Data Fig. 9. Annotation of scRNA-seq data from previous studies of melanoma and NSCLC.

a, Balloon plot showing the average expression and proportion of cells expressing the indicated genes used for cluster annotation in each cluster identified across cutaneous melanoma samples from Zhang et al.62 (n = 4 samples from 3 patients). The genes used for cluster annotation were obtained from the original article. b, UMAPs showing the clusters identified (upper) and their cell type annotation according to the genes in (a) (lower) across cutaneous melanoma samples from Zhang et al.62. c, Balloon plot showing the average expression and proportion of cells expressing the indicated genes used for cluster annotation in each cluster identified across NSCLC samples from Lambrechts et al.63 (n = 24 tumor samples from 8 patients). The genes used for cluster annotation were obtained from the original article. d, UMAPs showing the clusters identified (upper) and their cell type annotation according to the genes in (c) (lower) across NSCLC samples from Lambrechts et al.63.
Extended Data Fig. 10. Expression of unmutated TAs in scRNA-seq data from melanoma and NSCLC.

a, Box plots showing the read count of cancer-specific melanoma TAs from Fig. 8a across cell types from cutaneous melanoma samples from Zhang et al.62 (n = 4 samples from 3 patients). Each grey dot represents one TA per cell. aeTSAs (n = 81 TAs), TAAs (n = 56 TAs), LSAs (n = 73 TAs). b, Box plots showing the read count of cancer-specific NSCLC TAs or cancer- and alveolar-specific NSCLC LSAs from Fig. 8b across cell types from NSCLC samples from Lambrechts et al.63 (n = 24 samples from 8 patients). Each grey dot represents one TA per cell. aeTSAs (n = 7 TAs), TAAs (n = 5 TAs), LSAs (n = 17 TAs). c, Box plots showing the read count of melanoma TAs expressed in non-cancer cell types from cutaneous melanoma samples from Zhang et al.62 (n = 4 samples from 3 patients). Each grey dot represents one TA per cell. aeTSAs (n = 31 TAs), TAAs (n = 61 TAs), LSAs (n = 92 TAs). d, Box plots showing the read count of NSCLC TAs expressed in non-cancer cell types from NSCLC samples from Lambrechts et al.63 (n = 24 samples from 8 patients). Each grey dot represents one TA per cell. aeTSAs (n = 1 TA), TAAs (n = 29 TAs), LSAs (n = 3 TAs). All box plots show the median (center line) and interquartile range (IQR, box with limits at 25th and 75th percentiles), whiskers extend to the largest value no further than 1.5 * IQR from the box hinges, and black dots represent outliers beyond the whiskers.
Fig. 8. TA expression in scRNA-seq data from melanoma and NSCLC.

a, Bar plots showing the proportion (and absolute numbers) of melanoma TAs expressed (read count above 1) in cancer cells only in cutaneous melanoma scRNA-seq data from Zhang et al.61 (n = 4 samples from three patients). b, Bar plots showing the proportion (and absolute numbers) of NSCLC TAAs and aeTSAs expressed (read count above 1) in cancer cells only and the proportion of NSCLC LSAs expressed in cancer cells and normal alveolar cells only in NSCLC scRNA-seq data from Lambrechts et al.62 (n = 24 tumor samples from eight patients). c, Proportion of cell doublets among cells expressing a TA (cells expressing TA > 1 read count) versus the TA-negative cell fraction per annotated cell type from cutaneous melanomas (n from Zhang et al.41 (n = 4 samples from three patients). Each gray dot represents a TA expressed in at least one cell of the respective cell type. TAs analyzed here were those expressed in at least one noncancer cell: aeTSAs (n = 31 TAs), TAAs (n = 61 TAs) and LSAs (n = 92 TAs). Neg, negative; pos, positive. d, Box plots show the normalized expression of MLANA (left) and PMEL (right) in cell types from cutaneous melanoma samples from Zhang et al.61 (n = 4 samples from three patients), comparing cells expressing at least one TA (TA+) versus cells negative for all TAs (TA−). TAs analyzed here were those expressed in at least one noncancer cell: aeTSAs (n = 31 TAs), TAAs (n = 61 TAs) and LSAs (n = 92 TAs). All box plots show the median (center line) and IQR (box with limits at 25th and 75th percentiles), whiskers extend to the largest value no further than 1.5 × IQR from the box hinges, and black dots represent outliers beyond the whiskers. P values from two-sided Wilcoxon’s nonparametric test; no adjustments were made for multiple testing.
Altogether, the results presented in this study strongly support the immune targeting of unmutated TAs across cancers with varying TMB levels. aeTSAs are particularly attractive targets for immunotherapy considering their cancer specificity, immunogenicity, high abundance and sharing between patients.
Discussion
Following breakthroughs of melanoma regression resulting from targeting mutated TAs35,37,38,46,63,64, the search for actionable TAs focused on mTSAs (mutated neoantigens). However, a growing body of evidence indicates that unmutated TAs can trigger potent in vivo anti-tumor responses in mice and humans17,28,29. This prompted us to use an unbiased MS-based multiomic approach to investigate the TA profile of the two cancer types with the highest TMB, melanoma and NSCLC. A critical feature of our approach is to be genome wide (rather than being limited to the exome). This feature is particularly relevant to the identification of mTSAs and aeTSAs. Our search’s genome-wide scope enhances its breadth by allowing the identification of TSAs coded by any reading frame from all genomic regions. It also increases the stringency of our TA definition. Indeed, when our MS analyses identify a MAP, we grant it the TSA status only when it cannot be encoded by any genomic region (not only by annotated ORFs) expressed in benign tissues.
We found that only 1% of actionable TAs were mTSAs, whereas 99% of TAs were unmutated and derived from genomic regions with aberrant expression specific to cancer (aeTSAs), overexpressed in cancer compared to benign tissues (TAAs) or specific to the cell lineage of origin for the respective cancer type (melanocytes and alveolar epithelial cells) (LSAs). Our detailed analyses of predicted mTSAs revealed that the low mTSA identification by MS was explained by two features: their low RNA expression and their localization outside genomic regions proficient for MAP generation labeled as MAP hotspots45,65. The strong positive correlation between RNA expression and MAP generation is well established17,18,34,45. In addition, when identified by MS, most predicted mTSAs did not qualify as tumor specific because they could also be encoded by unmutated genomic regions with high expression in benign tissues. More sensitive targeted MS analyses of 20 predicted mTSAs with expression levels comparable to the unmutated TAs detected only one additional mTSA. With the sensitivity of targeted MS being in the low femtomolar range, some very-low-abundance MAPs (mutated or not) may remain undetected. TSAs of such low abundance should be enriched in nonclonal antigens because clonality (expression by all cancer cells) increases MAP abundance and facilitates detection by MS. We therefore conclude that most actionable TAs with detectable expression are unmutated.
Lung LSAs do not represent potential targets, as the lung epithelium is an essential tissue. While all other unmutated TAs described here have therapeutic potential, aeTSAs are particularly attractive targets for immunotherapy for several reasons: (1) aeTSAs are cancer specific (as assessed with bulk and scRNA-seq), (2) they are shared between patients, and (3) they are immunogenic (that is, stimulation with aeTSAs induced specific expansion of CD8+ T cells, specific IFN-γ release and specific killing of aeTSA-presenting cells). The 12 aeTSAs that we tested in FEST assays elicited polyclonal TCR responses. This is noteworthy because anti-tumor responses following anti-PD-1 immunotherapy are triggered by TAs eliciting polyclonal TCR responses46. This may be explained by the fact that a polyclonal TCR repertoire is more likely to include high- and low-avidity TCRs, which play complementary roles in tumor eradication and long-term protection66,67. Evidence of aeTSAs’ therapeutic potential also came from the reanalysis of data from ICB-treated patients. First, responders to ICB had a decrease in the number of aeTSAs predicted to be presented in pretherapy samples. Second, the loss of predicted aeTSA presentation had a linear correlation with the number of T cell clones expanded in responders to anti-PD-1 treatment from Riaz et al.3, suggesting a direct contribution to anti-tumor immunity.
Why did we find many more aeTSAs than mTSAs? The main factor is likely the number of tumor-specific peptides that can undergo MHC processing. As most mTSAs arise from single-nucleotide variants, their number is limited to the few peptides processed from the mutated protein that contains the amino acid variation. By contrast, all peptides generated from aberrantly expressed full-length polypeptides are tumor specific and denoted as aeTSAs. Another contributing factor may be the differential efficiency of cross-presentation of aeTSAs and mTSAs. The immunopeptidome of cancer cells is sculpted by immunoediting, which leads to the loss of some highly immunogenic TAs during tumor evolution68. This immunoediting depends on TA cross-presentation by dendritic cells in the tumor microenvironment69,70. Cross-presentation of antigens from ‘donor cells’ (here cancer cells) preferentially samples long-lived, abundant and stable proteins71. Over 50% of aeTSAs in melanoma and NSCLC were derived from noncanonical translation products, which are rapidly degraded34 and unlikely to undergo uptake by dendritic cells for cross-presentation to T cells33. The implication is that many aeTSAs may not be subjected to immunoediting. These escapees from immunoediting might be more valuable targets for cancer vaccines because the immune system has not been exposed to them during tumor evolution.
The presentation of numerous aeTSAs by tumors with a high TMB is not unexpected. Indeed, several of the top significantly mutated genes in melanoma encode epigenetic and splicing regulators72, which can lead to the de novo transcription and translation of aeTSAs in cancer17,33. In our study, aeTSA presentation correlated with epigenetic changes (promoter hypomethylation). Because epigenetic modifications are stable and heritable, the resulting aeTSAs are more likely to be clonal (truncal)73. This should curtail the emergence of antigen-loss variants and be advantageous in cancer immunotherapy.
Methods
Institutional review board statement
The project was approved by the research ethics board of the University of Montreal.
Primary human NSCLC and melanoma samples
The 12 flash-frozen cutaneous melanoma specimens used in this study were purchased from Tissue Solutions, whereas the 26 flash-frozen NSCLC samples were bought from Tissue Solution, BioIVT or Reprocell. Between 500 mg and 1.3 g per tumor was used for MS analyses, and 30 mg to 70 mg was used for RNA-seq. Sample information is presented in Supplementary Tables 1 and 2.
Melanoma cell lines
The primary melanoma cell lines Me290 and Me275 were previously reported by Chong et al.18 A375 cells were obtained from the ATCC (CRL-1619). All cell lines were cultured at 37 °C with 5% CO2 for a maximum of 20 passages after thawing and were cultured in RPMI 1640, GlutaMAX (Thermo Fisher) supplemented with 10% FBS (Thermo Fisher), 1% penicillin–streptomycin (Thermo Fisher), 10 mM HEPES (Thermo Fisher), 200 µM l-asparagine (Sigma, A7094), 500 µM l-arginine (Sigma) and 1.5 mM l-glutamine (Thermo Fisher).
RNA extraction and sequencing
This was performed as previously described19. The RNA integrity numbers, amount of RNA used, number of PCR cycles and number of reads generated per sample are detailed in Supplementary Table 3.
Database generation for shotgun mass spectrometry analyses
This was conducted as previously described16,19, with gene annotations from Ensembl (https://useast.ensembl.org) version 88 (for NSCLC) or Ensembl version 99 (for melanoma). See Supplementary Tables 3 and 4 for thresholds and parameters applied to each sample.
Immunoprecipitation of MHC I-associated peptides
The W6/32 antibodies (Bio X Cell) were coupled to protein A magnetic or Sepharose beads. Antibodies coupled to protein A beads were incubated in PBS for 60 min at room temperature with PureProteome protein A magnetic beads (Millipore) at a ratio of 1 mg of antibody per ml of slurry. Antibodies were covalently cross-linked to magnetic beads using dimethyl pimelidate, as described previously74. For antibodies coupled to CNBR-activated Sepharose 4B beads (Cytivia), these were covalently cross-linked to the beads as described by Sirois et al.75. Both types of beads were stored at 4 °C in PBS, pH 7.2 and 0.02% NaN3. Next, MHC I-associated peptides were isolated from tissues as previously described19,20.
Mass spectrometry analyses
The TMT labeling information and the MS instrument used to analyze the immunopeptidome of each sample are listed in Supplementary Table 3. For TMT labeling, samples were reconstituted in 20 μl of 200 mM HEPES buffer, pH 8.2. The TMT reagents (Thermo Fisher Scientific) were dissolved in 40 μl of anhydrous acetonitrile (ACN; Sigma-Aldrich), and 50 or 100 µg of reagent was added to the peptides. The solution was gently mixed and incubated for 90 min without agitation at room temperature before the reaction was quenched with hydroxylamine (Thermo Fisher Scientific). Samples were desalted on a Silica C18 UltraMicroSpin Column (the Nest Group), dried down and reconstituted in 4% FA (EMD Millipore).
Liquid chromatography–tandem mass spectrometry analyses
Dried peptide extracts were resuspended in 4% FA and loaded on a homemade C18 analytical column (20-cm × 150-µm i.d. packed with C18 Jupiter Phenomenex) with a 106-min gradient from 0% to 30% ACN (0.2% FA) and a flow rate of 600 nl min−1 on an EASY-nLC II system. For Q Exactive HF, analyses were done in positive ion mode with a Nanospray 2 source at 1.6 kV. Each full MS spectrum, acquired with a resolution of 60,000, was followed by 20 MS/MS spectra, where the most abundant multiply charged ions were selected for MS/MS sequencing with a resolution of 60,000 (melanoma) or 30,000 (NSCLC), an automatic gain control target of 2 × 10⁴, an injection time of 800 ms and a collisional energy of 28% (melanoma) or 25% (NSCLC). Analyses with the Orbitrap Fusion mass spectrometer were done in positive ion mode with a Nanoflex source at 2.8 kV. Each full MS spectrum, acquired in HCD dissociation mode with a resolution of 120,000, was followed by 20 MS/MS spectra, where the most abundant multiply charged ions were selected for MS/MS sequencing with a resolution of 50,000, an automatic gain control target of 2 × 10⁴, an injection time of 1,000 ms and a collisional energy of 35%. Analyses with the Orbitrap Exploris 480 mass spectrometer were done in positive ion mode with a Nanoflex source at 2.8 kV. Each full MS spectrum, acquired with a resolution of 240,000, was followed by 20 MS/MS spectra, where the most abundant multiply charged ions were selected for MS/MS sequencing with a resolution of 30,000, an automatic gain control target of 100%, an injection time of 700 ms and a collisional energy of 34%.
Targeted MS analyses
Predicted mTSAs were selected based on (1) the highest alternative read count at the variant location in the sample of origin, (2) priority given to peptides predicted to bind multiple HLA alleles per sample, (3) priority given to the strongest HLA binders (based on percent rank elution in NetMHCpan-4.1b43) and (4) not detected with shotgun MS (Fig. 4d and Supplementary Tables 8–15).
Between 530 mg and 1.1 g of NSCLC tissue was used for targeted MS analyses. Experiments were conducted on a neo-Vanquish LC instrument coupled to an Orbitrap Tribrid Ascend mass spectrometer. Peptide separation was achieved on an IonOpticks Aurora (25-cm × 75-µm i.d.) with a flow rate of 300 nl min−1 and a gradient of 1–38% aqueous ACN (0.1% FA) in 1 h. MS survey scans were acquired at a resolution of 120,000, automatic gain control at 4 × 10⁵ and maximum injection time at 251 ms. Scheduled targeted HCD MS/MS scans were acquired at a resolution of 45,000 and used an isolation window of 1.2 m/z with 27% normalized collision energy. Synthetic peptides of 20 predicted mTSAs, purchased from GenScript, were used to build the isolation list with m/z and z. Skyline76 was used to extract the endogenous MS/MS spectrum of each TSA candidate and compare it to the relevant synthetic peptide MS/MS spectrum.
Targeted MS analyses for synthetic peptide validations
Synthetic peptides (GenScript) were dissolved in DMSO at 1 nmol μl−1 and diluted to 0.25 pmol μl−1 in 4% formic acid. From these stock solutions, peptides were combined before MS analysis. Targeted MS/MS was performed on an Exploris 480 interface with an EASY-nLC 1200 system (Thermo Scientific). Synthetic peptides were loaded on a C4 precolumn (Optimize Technologies) and separated on a 20-cm × 150-μm homemade Jupiter C18 (Phenomenex) 3-μm, 300 Å column. Elution was performed using a 56-min linear gradient of 7% to 30% aqueous ACN (0.1% formic acid) at a flow rate of 600 nl min−1. Survey scan resolution, automatic gain control and injection time were set at 120,000, 1 × 10⁶ and auto, respectively, over a scan range of 300–1,200 m/z. Targeted MS scans were run with an inclusion list, a resolution of 30,000, a normalized AGC target of 100% and an HCD normalized collision energy of 34. Mirror plots were generated as described below in ‘Quality of tumor antigen identifications’.
Bioinformatic analyses
Identification of MAPs
LC–MS/MS data were searched against the relevant database using PEAKS 10.5 or 10.6 (Bioinformatics Solutions). For peptide identification, tolerance was set at 10 ppm and 0.01 Da for precursor and fragment ions, respectively. Oxidation (M) and deamidation (NQ) were set as variable modifications. In addition, for TMT-labeled samples, the occurrences of K and N terminus were set as fixed modifications, and the occurrence of STY was established as a variable modification. Following peptide identification, we used the modified target-decoy approach in PEAKS to apply a sample-specific threshold on the PEAKS scores to ensure a false discovery rate (FDR) of 5%, calculated as the ratio between the number of decoy hits and the number of target hits above the score threshold. PEAKS scores corresponding to a 5% FDR for each sample were determined, and peptides that passed the threshold were further analyzed for reidentification with Comet. Specifically, following MAP identification with PEAKS, the set of LC–MS/MS data produced by PEAKS (MGF files) were searched against the relevant database using Comet 2021.01 revision 0 or 2022.01 revision 0 (ref. 77), with the same parameters used in PEAKS. The resulting peptide–spectrum matches passing an FDR of 5% as determined by Percolator version 3.4 (ref. 78) (features: mass, mass error, charge, sequence length, ions matched and total, Comet e value/Xcorr/deltaCN/sp score) and overlapping with the PEAKS identifications were further filtered to match the following criteria: peptide length between eight and 11 amino acids and eluted ligand likelihood prediction rank for any of the sample’s HLA alleles <2% based on NetMHCpan-4.1b43 (Extended Data Fig. 1a). These filtering steps were done with the use of MAPDP79. The HLA types for each primary tumor sample were determined from the RNA-seq data using OptiType version 1.3.5 (ref. 80). Peptides passing these criteria were the total MAPs used for the selection of TAs (Supplementary Tables 5–7).
Selection of tumor antigens
TA candidates were selected based on their source RNA expression in the cancer sample of origin and mTECs, as previously described16. MAPs were retained as TA candidates if all possible MAP-coding sequences for a given MAP (1) were expressed below 2 KPHM (minimum occurrence of the MAP-coding sequence’s 24-nucleotide-long k-mer set per hundred million reads) in mTECs and (2) had a KPHM fold change greater than or equal to 10 in cancer compared to mTECs. Because leucine (L) and isoleucine (I) variants are not distinguishable by standard MS approaches, L/I TA candidates for which an existing I/L variant was flagged as a non-TA candidate were discarded unless the L/I TA had higher RNA expression than the I/L variant in the respective tumor sample.
Next, BamQuery17,40 was used with genome annotation options Ensembl version 88 or 99 (GENCODE version 26 or 33, respectively) to evaluate the genomic location and biotypes of TA candidates and the expression of their coding sequences in benign and cancer tissues. Genomic locations and biotypes were manually validated using the UCSC Genome Browser. TAs listed here are the peptides meeting the following criteria:
mTSAs are MAPs for which no possible coding sequence has a perfect match with the reference genome and dbSNP155 variants (except if the nonsynonymous variant is annotated as ‘pathogenic’ or ‘likely_pathogenic’ in cancer); are derived from mutated genomic sequences supported by at least five reads and 5% of reads at the locus; their source RNA is expressed below 8.55 RPHM in more than 90% of normal samples from mTECs, melanocytes and bronchial brushing tissues (for melanoma and NSCLC, respectively), blood and bone marrow cells and each GTEx tissue.
- Unmutated TAs are MAPs for which at least one possible coding sequence has a perfect match with the reference genome and dbSNP155 variants; their 95th-percentile RNA expression value in TCGA samples (SKCM for melanoma and LUSC and LUAD for lung cancer samples) is at least two times higher than the 95th-percentile RNA expression value in GTEx (except testis, and either skin or lung, for melanoma or NSCLC, respectively) and mTEC samples; their source RNA is expressed in the MAP’s sample of origin (RPHM > 0); they do not derive from hypervariable regions (HLA, immunoglobulins); and, in addition:
-
For aeTSAs:The aeTSA’s source RNA is expressed below 8.55 RPHM in more than 90% of normal samples from mTECs, melanocytes or bronchial brushing tissues (for melanoma or NSCLC, respectively), blood and bone marrow cells and each GTEx tissue except the testis. For melanoma, the mean expression is at least two times higher in TCGA-SKCM than in normal GTEx skin, and the mean expression is at least two times higher in melanoma cell lines than in normal melanocytes. For the lung, the mean expression is at least two times higher in TCGA-LUSC or TCGA-LUAD samples than the maximum between normal GTEx lung or bronchial brushing samples.
-
For TAAs:The TAA’s source RNA can be expressed above 8.55 RPHM in >10% of samples from any normal tissues (GTEx, melanocytes or bronchial brushing, mTECs and/or blood and bone marrow cells), but the mean expression is at least two times higher in TCGA than in mTECs and each GTEx tissue (except the testis). For melanoma TAAs, the mean expression in melanoma cell lines is at least two times higher than in purified melanocytes.
-
For LSAs:The LSA’s source RNA is expressed below 8.55 RPHM in more than 90% of normal samples from mTECs, blood and bone marrow cells and each GTEx tissue (except the testis and the tumor tissue of origin). For melanoma, the LSA is expressed above 8.55 RPHM in at least 10% of GTEx skin samples or purified melanocytes, and the mean expression in GTEx skin is higher than in all other GTEx tissues. For NSCLC, the LSA is expressed above 8.55 RPHM in at least 10% of GTEx lung or bronchial brushing samples, and the mean expression in these samples is higher than in all other GTEx tissues.
-
The cutoff threshold of 8.55 RPHM corresponds to a 5% probability of MAP generation in myeloid cells17. This threshold should result in an even lower likelihood of MAP generation in extrathymic epithelial cells because their MHC I cell surface density is 10- to 100-fold lower than that of myeloid cells81.
As outliers can skew the mean, we also evaluated whether calculating the fold change between TCGA and GTEx using the geometric mean instead of the arithmetic mean would significantly alter the unmutated TA lists in melanoma and NSCLC (Extended Data Fig. 2a,b). We found that TAAs were the class of unmutated TAs most affected by outliers, with 78% and 66% of TAAs lost when the geometric mean was used, whereas 95–100% of aeTSAs and LSAs were reidentified in both cancer types (Extended Data Fig. 2a,b and Supplementary Tables 25 and 26). Importantly, all unmutated TAs reidentified with the geometric mean maintained their classification (no TA class changes). In addition, we found that using the geometric mean did not significantly increase the number of TA identifications. Nevertheless, this method identified two additional TAAs in melanoma, whereas, in NSCLC, it identified four additional aeTSAs and seven TAAs (Extended Data Fig. 2a,b and Supplementary Tables 25 and 26).
Quality of tumor antigen identifications
Several complementary methods were used to assess the quality of the TA identifications, and these analyses supported the accuracy of the TAs reported here:
Most 8–11-amino acid peptides identified from our MS experiments passed the 2% rank elution threshold for HLA-binding prediction using NetMHCpan-4.1b43 (median of 96% for melanoma and 100% for NSCLC samples; Extended Data Fig. 2c).
TAs had a length distribution similar to that of other canonical MAPs (Extended Data Fig. 2d).
TAs had a PEAKS score distribution similar to that of other canonical MAPs (Extended Data Fig. 2e).
TAs had a mass error distribution similar to that of other canonical MAPs (Extended Data Fig. 9f).
Similar to other canonical MAPs, TAs had strong correlations between the observed retention time and the predicted retention time or the hydrophobicity index, the two best-in-class metrics for validation of MAPs identified with high-throughput MS82,83 (Extended Data Fig. 2g,h). DeepLC 1.1.2 (ref. 83) was used to predict MAP retention times within MAPDP79. The protViz version 0.7.7 package in R was used to calculate hydrophobicity indices based on peptide sequences.
Most TAs (84% in melanoma and 83% in NSCLC) were reidentified with a group-specific FDR of 5% (FDR calculated separately for canonical and noncanonical peptides in PEAKS and Comet, and the intersection of the two identification lists was analyzed for TA reidentification). In addition, most (77% in melanoma and 61% in NSCLC) TAs that were not reidentified with the group-specific FDR had a Prosit84 spectral angle above 0.5 (ref. 85) and overlapped with the TAs reidentified by the group-specific FDR, supporting their accurate identification (Extended Data Fig. 2i). The Prosit spectral angle and Pearson’s R scores were obtained from data processing (prediction model Non-tryptic 2020 HCD) with the Prosit implementation in MAPDP79.
Validation of peptide identifications was performed for 22 aeTSAs from NSCLC samples by comparing the endogenous peptide spectra with those of synthetic peptides (Extended Data Fig. 3). Retention time and MS2 spectrum similarity metrics were used to confirm peptide identity. Normalized b and y fragment intensities (including H2O and NH3 neutral losses) from the centroided endogenous and synthetic spectra were correlated using the SciPy version 1.11.4 implementation of Pearson and Spearman correlation coefficients and compared with the normalized spectral contrast angle. Fragment peaks were matched at a tolerance of 0.02 Da and with a minimum relative intensity of 0.05. Mirror plots were drawn using spectrum-utils version 0.4.2.
Estimation of sample purity and immune score
The sample purity and immune score of primary tumors and melanoma cell lines were estimated from the RNA-seq reads using the ESTIMATE package in R, starting from the kallisto-generated TPM values.
Reactome pathway overrepresentation test
Gene symbols corresponding to genes coding for TAAs from melanoma and NSCLC were submitted to Panther’s ‘statistical overrepresentation test’ (http://www.pantherdb.org/) using real-time pathways as the annotation set and the parameters listed in Supplementary Tables 23 and 24. The top 20 overrepresented pathways are shown in Supplementary Tables 23 and 24 (ref. 40).
Predicted mTSA analyses
Somatic variant calling and mTSA predictions
For exome-seq-based analyses, whole-exome sequence reads for the melanoma cell lines and matched germline samples from Chong et al.18 were preprocessed according to the GATK best practices (https://gatk.broadinstitute.org/), including read trimming with Trimmomatic, alignment to the GRCh38 human reference genome assembly with BWA 0.7.17 (ref. 86), sorting by coordinates and marking duplicates with Picard 2.26.10 and applying base recalibration scores with GATK 4.2.4.1. Next, somatic single-nucleotide variants and indels were called using Mutect2 according to the GATK framework. For RNA-seq-based analyses, SNP calling was performed using freebayes as described above. RNA-seq and exome-seq-derived variants were then annotated using SnpEff version 5.0e87 (with SnpEff’s GRCh38.99 database) and SnpSift version 5.0e88. For exome-seq, variants were kept for mTSA predictions if they passed GATK’s FilterMutectCalls filtering (provided with contamination table and read orientation model), they were within canonical chromosomes and outside hypervariable regions (HLA, IGHV) and they were nonsynonymous and were covered by at least five reads and 5% of reads at the locus (mutations). For RNA-seq, variants were kept if they were nonsynonymous, were outside hypervariable regions (HLA, IGHV), had freebayes quality >20, were covered by at least five reads and 5% of reads at the locus and did not match dbSNP149 entries except when annotated as ‘pathogenic’ or ‘likely_pathogenic’ in melanoma or lung, respectively (mutations). Nonsynonymous variants that matched dbSNP149 entries without ‘pathogenic’ or ‘likely pathogenic’ annotations were considered to be germline variants.
Mutations and their coordinates in protein-coding transcripts were used to generate mutated amino acid contigs per sample. These contigs contained the amino acid variation flanked by ten amino acids. When a nonsynonymous germline variant was present within a contig in the respective sample, all possible nonsynonymous combinations were generated (MUT contigs). Contigs corresponding to the reference amino acid sequence at the mutation location, with all combinations of nonsynonymous germline variants within the contig, were kept as WT contigs. For melanoma cell lines, contigs were built from the union of mutations from exome-seq and RNA-seq, and nonsynonymous germline variants were inferred from RNA-seq.
Deduplicated contigs were then used to obtain predicted mTSAs, which were defined as mutation-containing peptides with a length between eight and 11 amino acids and with eluted ligand likelihood prediction rank to any of the sample’s HLA alleles <2% based on NetMHCpan-4.1b. In addition, contigs not already included in the k-mer MS databases (generated from multiple-nucleotide variants or indels) were concatenated to the k-mer MS databases, and new MS searches were performed as described above.
The TMB was calculated as the number of mutations divided by 35.68 Mb, corresponding to the exome size in the GENCODE version 33 annotation (Ensembl version 99). For melanoma cell lines, the number of exome-seq-derived mutations expressed in the RNA-seq data was calculated as the number of exome-seq-derived mutations present in the unfiltered SNP calls from freebayes on RNA-seq reads (Supplementary Tables 8–15). Four local melanoma samples were identified as outliers (TMB greater than Q3 + 1.5 × IQR; Q3, third quartile) and were excluded from all predicted mTSA analyses: 1367_16T, 1836_18T, 258_20T, 738_20T.
Nonsynonymous germline variant calling
Whole-exome-seq reads of normal matched PBMCs for the melanoma cell lines from Chong et al.18, preprocessed as described above for somatic variant calling, were used to identify nonsynonymous germline variants using HaplotypeCaller according to the GATK framework. Variants were filtered per sample using the hard-filtering parameters recommended in the GATK manual. Contigs and analyses presented for germline variants were generated as described in this section for somatic nonsynonymous variants, except that they were performed only on variants from chromosome 1.
Features of predicted mTSAs
Predicted mTSA expression in benign tissue RNA-seq was queried using BamQuery40, with genome annotation options Ensembl version 88 or 99 (GENCODE version 26 or 33, respectively) and dbSNP version 155. Predicted mTSAs were excluded if expressed above 8.55 RPHM in more than 10% of normal samples. Ubiquitination sites were predicted using UbPred89 (≥0.84). IUPred90 was used to predict disordered protein regions (>0.5). The instability index of each protein was computed using the function ProteinAnalysis from the module ProtParam of the Biopython module SeqUtils.
Single-cell RNA-sequencing analyses
scRNA-seq data from NSCLC and melanoma were downloaded from ArrayExpress (accession number E-MTAB-6653) and GEO (accession number GSE215120), respectively. Read alignment, quantification and cell clustering were performed as previously described91. Cell population annotations were performed using gene lists from Lambrechts et al.62 for NSCLC samples and from Zhang et al.40,61 for melanoma. BamQuery40 was used to quantify the read counts of unmutated TAs. The proportion of cancer-specific TAs (or cancer and alveolar cell-specific LSAs from NSCLC) was defined for each TA type as the number of TAs expressed specifically in cancer cells (or in cancer and alveolar cells for NSCLC-derived LSAs) (read count > 1) divided by the number of TAs expressed in at least one cell (read count > 1). The scDblFinder package in R was used for cell doublet detection.
The Cancer Genome Atlas analyses
Processed TCGA data were retrieved and analyzed as previously described19. Oncogene mutation status for TCGA samples was obtained from UCSC Xena (https://pancanatlas.xenahubs.net, dataset mc3.v0.2.8.PUBLIC.nonsilentGene.xena), and smoking history records were obtained from cBioPortal (https://www.cbioportal.org/).
Immune checkpoint blockade analyses
Predicted tumor antigen presentation
HLA alleles for melanoma or NSCLC samples from previous studies on ICB were inferred from RNA-seq using OptiType. Promiscuous binders for a given MAP (all HLA alleles capable of presenting the MAP) were obtained using NetMHCpan-4.1b. They corresponded to HLA alleles for which the given MAP had an eluted ligand likelihood prediction rank <2%. A given TA was considered as presented in a sample if it had expression > 0 RPHM and at least one of the patient’s HLA allotypes was a potential binder. If the patient expressed more than one HLA allele capable of presenting a TA, the TA was counted multiple times. Only cutaneous melanoma samples from previous studies were analyzed.
The number of T cell clones expanded on-therapy in patients from Riaz et al
The TCRB clonotypes from Riaz et al.3 were downloaded from https://www.github.com/riazn/bms038_analysis. Next, the TCRB clones expanded per patient were determined using the FEST web tool (http://www.stat-apps.onc.jhmi.edu/FEST) with the following parameters per patient: (1) pretherapy sample as a reference, (2) nTemplates_threshold = 1, (3) Ignore_baseline_threshold = TRUE, (4) Nucleotide_level = FALSE, (5) an FDR of 5% and an OR of 5.
Immunogenicity assays
Peptide-specific T cell functional expansion method used for TCR Vβ CDR3 sequencing (FEST assays)
T cells were cultured as previously described19. Parameters used for the FEST web tool53 (http://www.stat-apps.onc.jhmi.edu/FEST) are described in Supplementary Table 19.
Cytotoxicity assays analyzed by flow cytometry
Following the same protocol of expansion described above for FEST assays, T cells from D48 (leukapheresis product from a healthy HLA-A*02:01-positive donor from BioIVT) were expanded in eight different conditions with individual aeTSAs (VLMMKLEDL, RLLELHITM, VLWRGDSPL, KLITQIRTA, YQIGQVQGV, NLITEEHPV) or viral peptides (Gag (SLYNTVATL) and NS3 (CINGVCWTV)), all presented by HLA-A*02:01. Cytokines were added until day 20, and T cells were collected on days 24 and 26 and used as effectors for cytotoxic assays, with B-LCL cells used as target cells, as previously described19.
Peptide-specific CD8+ T cell expansion protocol used for tetramer staining, ELISpot and Incucyte cytotoxicity assays
CD8+ T cells from D50 (leukapheresis product from a healthy HLA-A*02:01-positive donor from BioIVT) were expanded in eight different conditions: with individual aeTSAs (VLMMKLEDL, RLLELHITM, VLWRGDSPL, YQIGQVQGV), control peptides (MelanA26-35A27L, ELAGIGILTV; pp65495–503, NLVPMVATV), an aeTSA from ovarian cancer (Ov-aeTSA, LLSSKLLLM) described as immunogenic by our group92, all presented by HLA-A*02:01, or DMSO as the negative control. Thawed PBMCs were enriched for naive CD8+ T cells using the Human CD8+ T Cell Isolation Kit combined with CD45RO and CD57 MicroBeads (Miltenyi Biotec) to remove memory T cells from the CD8+ T cell fraction. These naive CD8+ T cells were then expanded for 14 d with T Cell TransAct (Miltenyi Biotec) in TexMACS Medium (Miltenyi Biotec) supplemented with interleukin (IL)-7 and IL-21 (PeproTech, at final concentrations of 5 ng ml−1 and 10 ng ml−1, respectively) before specific expansion. Next, CD8+ T cells were expanded with the eight conditions described above using a modified version of the protocol developed by Bozkus et al.93. On day 0, PBMCs from the same donor were thawed and co-cultured with pre-expanded naive CD8+ T cells at a ratio of 1:1 (0.05 × 10⁶ cells of each in 200 µl per well in a 96-well plate) using X-VIVO 15 medium (Lonza) containing 5% Human Serum (Sigma) and 1× penicillin–streptomycin and 1 mM sodium pyruvate) supplemented with 1,000 IU ml−1 GM-CSF, 500 IU ml−1 IL-4 (PeproTech) and 50 ng ml−1 FLT3-L (PeproTech). On day 1, 100 µl of medium was removed per well and 100 µl of fresh X-VIVO 15 medium supplemented with 20 µM R848 (Invitrogen), 200 ng ml−1 LPS (Sigma), 20 ng ml−1 IL-1β (PeproTech) and 20 µg ml−1 of specific peptide or DMSO was added (final concentrations of 10 µM, 100 ng ml−1, 10 ng ml−1 and 10 µg ml−1, respectively). All peptides and DMSO were tested separately in one full 96-well plate per condition. From day 2 to day 14, every 2 or 3 d, 100 µl of medium was removed and replaced with 100 µl of fresh R10 complete medium (RPMI 1640, 10 mM HEPES, 10 mg ml−1 gentamicin, 1× GlutaMAX-I and 10% human serum) containing 20 IU ml−1 IL-2 IS (Miltenyi Biotec), 20 ng ml−1 IL-7 (PeproTech) and 20 ng ml−1 IL-15 (PeproTech, final concentrations of 10 IU ml−1, 10 ng ml−1 and 10 ng ml−1, respectively). Between days 9 and 11, cells from each 96-well plate were transferred into a flask depending on the confluence. On day 14, the previously described steps were repeated (from step day 0) with the same ratios and media. For this second round of stimulation (days 14 to 28), two full 96-well plates were used per condition (each peptide or DMSO). On days 28 and 32, tetramer staining, ELISpot and cytotoxic assays were performed.
Tetramer staining assay
Peptide–HLA tetramers were produced using UV peptide exchange technology (Flex-T, BioLegend), according to the manufacturer’s instructions. One million CD8+ T cells (peptide-specific and DMSO-expanded T cells) were stained with PE- and APC-conjugated tetramers for 30 min at 4 °C. Next, after washing, cells were stained with anti-CD3–APC H7 and anti-CD8–BB515 antibodies (BD Biosciences, at 1:50 and 1:200 dilutions, respectively) for 20 min at 4 °C. Cells were then analyzed with a FACSCelesta cytometer (BD Biosciences) after adding 7-AAD to exclude dead cells. DMSO-expanded T cells were used as a negative control to calculate the expansion fold of tetramer-positive CD8+ T cells in each peptide-specific expanded condition.
ELISpot assays
ELISpot assays were performed using the ELISpot Plus: Human IFN‑γ (ALP) kit (Mabtech) following the manufacturer’s protocol. CD8+ T cells were seeded into the ELISpot plates at a density of 2 × 10⁵ cells per well for all conditions except for MelanA-specific expanded T cells, which were seeded at 1 × 10⁵ cells. CD8+ T cells were co-stimulated with a cocktail of anti-CD28 antibody (1 µg ml−1, BioLegend), Ultra-LEAF purified anti-human CD49d antibody (1 µg ml−1, BioLegend) and IL-7 (Peprotech, 20 ng ml−1). Each ELISpot condition was tested in triplicate, adding the specific peptide (final concentration of 10 µg ml−1), DMSO or anti-CD3 monoclonal antibody (CD3-2 provided in the kit, 1:1,000) as a positive control for IFN-γ production for each CD8+ T cell culture condition (peptide- or DMSO-expanded cells). The plates were incubated for 40–44 h at 37 °C and then washed and developed following the manufacturer’s protocol. Spots (spot-forming units) were counted using an AID Classic ELISpot Reader.
Cytotoxicity assay analyzed using the Incucyte live cell analysis system
Melanoma cell lines were seeded in a 96-well plate at a subconfluent density in 200 μl of medium 2 d before co-culture with T cells to allow cell spreading. Due to their different cell growth rates, the seeding densities were 1,000 cells per well for A375 cells and 3,000 cells per well for Me275 and Me290 cells. On the day of the assay, melanoma cells were loaded with CellTracker Green CMFDA at a concentration of 1 µM in RPMI according to the manufacturer’s instructions (Thermo Fisher Scientific). Melanoma cells were incubated for 15 min at 37 °C, and loading medium was aspirated. Next, melanoma cells were supplemented with 0.1 μM YOYO-3 (Thermo Fisher Scientific) in R10 medium. Peptide-specific expanded CD8+ T cells were then added in triplicate at an effector-to-target ratio of 50:1, and no T cells were added in the ‘target alone’ condition. Plates were incubated at 37 °C for up to 24 h, and five images were recorded per well every 1.5 h using the Incucyte S3 Live Cell Analysis Instrument with a ×10 objective. The presence of green and red cells was monitored and analyzed with the Basic Analyzer module of the Incucyte S3 software (Sartorius, version 2019A). The percentage of cytotoxicity was calculated using the following formula:
The number of melanoma target cells per well was determined using five images and the average of the three wells. The 3-h time point was then selected to represent the observed cytotoxic effect.
Quantification and statistical analysis
No statistical methods were used to predetermine sample sizes, but our sample sizes are similar to those reported in previous publications17,20. Statistical tests were performed as described in the respective figure legends. All statistical tests performed were two-sided. When a t-test was performed to assess statistical significance, data distribution was assumed to be normal, but this was not formally tested. When applicable, P values were adjusted for multiple comparisons using the Benjamini–Hochberg method and the p.adjust function in R. All box plots show the median (center line) and IQR (box with limits at 25th and 75th percentiles), whiskers extend to the largest value no further than 1.5 × IQR from the box hinges, and black dots represent outliers beyond the whiskers. Box plots do not display confidence intervals; the degrees of freedom are standard for two sample tests, n − 2, with n as the sample size. Effect sizes were not considered. Unless mentioned, all correlations were performed using Spearman’s correlation coefficient. Plots and statistical analyses were performed in R version 4.2.0 (with packages including ggplot2 and ggpubr, pheatmap) or Python version 3.6.7 (with packages including matplotlib). Flow cytometry analyses and figure generation were performed using FACSDiva and FlowJo. Data collection and analysis were not performed blind to the conditions of the experiments.
Reporting summary
Further information on research design is available in the Nature Portfolio Reporting Summary linked to this article.
Supplementary information
Supplementary Tables 1–26.
Source data
Numerical source data.
Numerical source data.
Numerical source data.
Numerical source data.
Numerical source data.
Numerical source data.
Numerical source data.
Numerical source data.
Numerical source data.
Numerical source data.
Numerical source data.
Numerical source data.
Numerical source data.
Numerical source data.
Numerical source data.
Acknowledgements
We thank E. Audemard from the IRIC Bioinformatics Platform for discussions and suggestions for exploratory analyses. We are indebted to B. Fairfax and R. Watson (University of Oxford) for valuable discussions and exploratory analyses of TCR-seq data and to C. Robert, D. Gautheret and H. Herrmann (Gustave Roussy Institute) for insightful discussions on ICB resistance in melanoma. We also thank the IRIC genomics core facility staff for technical assistance with RNA-seq. In addition, we are grateful to Genentech for access to data from Banchereau et al.16 and to the GTEx Consortium, TCGA, the Melanoma Genome Sequencing Project and the authors of previous studies who granted us access to data that enabled this study. This study was supported by grants from the Canadian Cancer Society (705604) (to C.P. and P.T.), the SynergiQc program (to C.P. and P.T.) and the Fonds Vaccins Thérapeutiques Contre le Cancer (to C.P.). A.A. was supported by a doctoral studentship from the Fonds de Recherche du Québec—Santé. The funders had no role in study design, data collection and analysis, decision to publish or preparation of the manuscript.
Extended data
Author contributions
A.A., Q.Z. and C.P. designed the study. A.A. performed analyses, interpreted results and wrote the first draft of the manuscript. Q.Z. performed analyses and interpreted results. L.H., M. Cahuzac, S.B., A.A., J.P. and J.H. performed immunogenicity experiments. C.D. and J.L. performed MS experiments. A.A. performed TA identifications. Q.Z., M.-P.H. and K.V. contributed to TA identification in NSCLC. J.-D.L. processed scRNA-seq data. A.A. performed TA analyses with scRNA-seq data. A.A., Q.Z., L.H., M. Cahuzac, C.D., J.-D.L., M.-P.H., K.V., S.B., J.-P.L., J.L., M. Courcelles, P.G., M.V.R.C., E.K., G.E., S.L., P.T. and C.P. contributed to methodology development. M.L. and I.R.W. provided valuable suggestions for melanoma data analysis and interpretation. D.E.S. and M.B.-S. provided melanoma cell lines used in the study, and M.B.-S. provided us with access to proteomic and genomic data studied by Chong et al.18. All authors discussed the results and reviewed and edited the manuscript.
Peer review
Peer review information
Nature Cancer thanks Lélia Delamarre, Alex Jaeger and the other, anonymous, reviewer(s) for their contribution to the peer review of this work.
Data availability
The RNA-seq data generated and analyzed during the present study were deposited at GEO and can be accessed with accession number GSE230489. The MS data generated and analyzed here (except the raw MS data for the melanoma cell lines from Chong et al.18) were deposited at PRIDE with accession numbers PXD043059 for melanoma samples (https://www.ebi.ac.uk/pride/archive/projects/PXD043059) and PXD043057 for NSCLC samples (https://www.ebi.ac.uk/pride/archive/projects/PXD043057). The raw MS data for the melanoma cell lines from Chong et al.18 were downloaded from PRIDE with accession PXD013649 (https://www.ebi.ac.uk/pride/archive/projects/PXD013649). The RNA-seq and exome-seq data for the melanoma cell lines from Chong et al.18 were downloaded from the EGA Archive with accession numbers EGAS00001003723 and EGAS00001003724 (https://ega-archive.org/datasets/EGAD00001005097) upon request to the related data access committee. Accession numbers for all other data downloaded from previous studies and used here are listed in Supplementary Table 4. All remaining data supporting the present study’s findings are available within the article, the Supplementary Information, source data and/or from the corresponding authors upon request. Source data are provided with this paper.
Code availability
The code used for MS-based peptide identification16 is available on Zenodo at 10.5281/zenodo.1484486 (ref. 94).
Competing interests
A.A., K.V., M.-P.H., P.T. and C.P. are named inventors on patent applications filed by the Université de Montréal and covering TAs reported in this article (patent application number WO2024211992, titled Novel tumor antigens for melanoma and uses thereof; patent application number WO2024187278, titled Novel tumor antigens for lung cancer and uses thereof). P.T. and C.P. receive grant support and consultant fees from Epitopea. The other authors declare no competing interests.
Footnotes
Publisher’s note Springer Nature remains neutral with regard to jurisdictional claims in published maps and institutional affiliations.
Contributor Information
Pierre Thibault, Email: pierre.thibault@umontreal.ca.
Claude Perreault, Email: claude.perreault@umontreal.ca.
Extended data
is available for this paper at 10.1038/s43018-025-00979-2.
Supplementary information
The online version contains supplementary material available at 10.1038/s43018-025-00979-2.
References
- 1.Haen, S. P., Löffler, M. W., Rammensee, H. G. & Brossart, P. Towards new horizons: characterization, classification and implications of the tumour antigenic repertoire. Nat. Rev. Clin. Oncol.17, 595–610 (2020). [DOI] [PMC free article] [PubMed] [Google Scholar]
- 2.Capietto, A.-H., Hoshyar, R. & Delamarre, L. Sources of cancer neoantigens beyond single-nucleotide variants. Int. J. Mol. Sci.23, 10131 (2022). [DOI] [PMC free article] [PubMed] [Google Scholar]
- 3.Riaz, N. et al. Tumor and microenvironment evolution during immunotherapy with nivolumab. Cell171, 934–949 (2017). [DOI] [PMC free article] [PubMed] [Google Scholar]
- 4.Kim, J. Y., Choi, J. K. & Jung, H. Genome-wide methylation patterns predict clinical benefit of immunotherapy in lung cancer. Clin. Epigenetics12, 119 (2020). [DOI] [PMC free article] [PubMed] [Google Scholar]
- 5.Van Allen, E. M. et al. Genomic correlates of response to CTLA-4 blockade in metastatic melanoma. Science352, 207–212 (2015). [DOI] [PMC free article] [PubMed] [Google Scholar]
- 6.Wolf, Y. & Samuels, Y. Intratumor heterogeneity and antitumor immunity shape one another bidirectionally. Clin. Cancer Res.28, 2994–3001 (2022). [DOI] [PMC free article] [PubMed] [Google Scholar]
- 7.Hugo, W. et al. Genomic and transcriptomic features of response to anti-PD-1 therapy in metastatic melanoma. Cell165, 35–44 (2016). [DOI] [PMC free article] [PubMed] [Google Scholar]
- 8.Niknafs, N. et al. Persistent mutation burden drives sustained anti-tumor immune responses. Nat. Med.29, 440–449 (2023). [DOI] [PMC free article] [PubMed] [Google Scholar]
- 9.Liu, D. et al. Integrative molecular and clinical modeling of clinical outcomes to PD1 blockade in patients with metastatic melanoma. Nat. Med.25, 1916–1927 (2019). [DOI] [PMC free article] [PubMed] [Google Scholar]
- 10.Bassani-Sternberg, M. et al. Direct identification of clinically relevant neoepitopes presented on native human melanoma tissue by mass spectrometry. Nat. Commun.7, 13404 (2016). [DOI] [PMC free article] [PubMed] [Google Scholar]
- 11.Löffler, M. W. et al. Multi-omics discovery of exome-derived neoantigens in hepatocellular carcinoma. Genome Med.11, 28 (2019). [DOI] [PMC free article] [PubMed] [Google Scholar]
- 12.Newey, A. et al. Immunopeptidomics of colorectal cancer organoids reveals a sparse HLA class i neoantigen landscape and no increase in neoantigens with interferon or MEK-inhibitor treatment. J. Immunother. Cancer7, 309 (2019). [DOI] [PMC free article] [PubMed] [Google Scholar]
- 13.Kraemer, A. I. et al. The immunopeptidome landscape associated with T cell infiltration, inflammation and immune editing in lung cancer. Nat. Cancer4, 608–628 (2023). [DOI] [PMC free article] [PubMed] [Google Scholar]
- 14.Schiavetti, F., Thonnard, J., Colau, D., Boon, T. & Coulie, P. G. A human endogenous retroviral sequence encoding an antigen recognized on melanoma by cytolytic T lymphocytes. Cancer Res.62, 5510–5516 (2002). [PubMed] [Google Scholar]
- 15.Zeh, H. J. 3rd, D, P.-L., Dudley, M. E., Rosenberg, S. A. & Yang, J. C. High avidity CTLs for two self-antigens demonstrate superior in vitro and in vivo antitumor efficacy. J. Immunol.162, 989–994 (1999). [PubMed] [Google Scholar]
- 16.Laumont, C. M. et al. Noncoding regions are the main source of targetable tumor-specific antigens. Sci. Transl. Med.10, eaau5516 (2018). [DOI] [PubMed] [Google Scholar]
- 17.Ehx, G. et al. Atypical acute myeloid leukemia-specific transcripts generate shared and immunogenic MHC class-I-associated epitopes. Immunity54, 737–752 (2021). [DOI] [PubMed] [Google Scholar]
- 18.Chong, C. et al. Integrated proteogenomic deep sequencing and analytics accurately identify non-canonical peptides in tumor immunopeptidomes. Nat. Commun.11, 1293 (2020). [DOI] [PMC free article] [PubMed] [Google Scholar]
- 19.Apavaloaei, A. et al. Induced pluripotent stem cells display a distinct set of MHC I-associated peptides shared by human cancers. Cell Rep.40, 111241 (2022). [DOI] [PubMed] [Google Scholar]
- 20.Zhao, Q. et al. Proteogenomics uncovers a vast repertoire of shared tumor-specific antigens in ovarian cancer. Cancer Immunol. Res.8, 544–555 (2020). [DOI] [PubMed] [Google Scholar]
- 21.Ouspenskaia, T. et al. Unannotated proteins expand the MHC-I-restricted immunopeptidome in cancer. Nat. Biotechnol.40, 209–217 (2022). [DOI] [PMC free article] [PubMed] [Google Scholar]
- 22.Kershaw, M. H. et al. Immunization against endogenous retroviral tumor-associated antigens. Cancer Res.61, 7920–7924 (2001). [PMC free article] [PubMed] [Google Scholar]
- 23.Kooreman, N. G. et al. Autologous iPSC-based vaccines elicit anti-tumor responses in vivo. Cell Stem Cell22, 501–513 (2018). [DOI] [PMC free article] [PubMed] [Google Scholar]
- 24.Yaddanapudi, K. et al. Vaccination with embryonic stem cells protects against lung cancer: is a broad-spectrum prophylactic vaccine against cancer possible? PLoS ONE7, e42289 (2012). [DOI] [PMC free article] [PubMed] [Google Scholar]
- 25.Saini, S. K. et al. Human endogenous retroviruses form a reservoir of T cell targets in hematological cancers. Nat. Commun.11, 5660 (2020). [DOI] [PMC free article] [PubMed] [Google Scholar]
- 26.Mullins, C. S. & Linnebacher, M. Endogenous retrovirus sequences as a novel class of tumor-specific antigens: an example of HERV-H env encoding strong CTL epitopes. Cancer Immunol. Immunother.61, 1093–1100 (2012). [DOI] [PMC free article] [PubMed] [Google Scholar]
- 27.Schwarz, S. et al. T cells of colorectal cancer patients’ stimulated by neoantigenic and cryptic peptides better recognize autologous tumor cells. J. Immunother. Cancer10, e005651 (2022). [DOI] [PMC free article] [PubMed] [Google Scholar]
- 28.Zitvogel, L., Perreault, C., Finn, O. J. & Kroemer, G. Beneficial autoimmunity improves cancer prognosis. Nat. Rev. Clin. Oncol.18, 591–602 (2021). [DOI] [PubMed] [Google Scholar]
- 29.Lo, J. A. et al. Epitope spreading toward wild-type melanocyte-lineage antigens rescues suboptimal immune checkpoint blockade responses. Sci. Transl. Med.13, eabd8636 (2021). [DOI] [PMC free article] [PubMed] [Google Scholar]
- 30.Spranger, S., Bao, R. & Gajewski, T. F. Melanoma-intrinsic β-catenin signalling prevents anti-tumour immunity. Nature523, 231–235 (2015). [DOI] [PubMed] [Google Scholar]
- 31.Salmon, H. et al. Expansion and activation of CD103+ dendritic cell progenitors at the tumor site enhances tumor responses to therapeutic PD-L1 and BRAF inhibition. Immunity44, 924–938 (2016). [DOI] [PMC free article] [PubMed] [Google Scholar]
- 32.Topalian, S. L., Taube, J. M. & Pardoll, D. M. Neoadjuvant checkpoint blockade for cancer immunotherapy. Science367, eaax0182 (2020). [DOI] [PMC free article] [PubMed] [Google Scholar]
- 33.Apavaloaei, A., Hardy, M., Thibault, P. & Perreault, C. The origin and immune recognition of tumor-specific antigens. Cancers12, 2607 (2020). [DOI] [PMC free article] [PubMed] [Google Scholar]
- 34.Ruiz Cuevas, M. V. et al. Most non-canonical proteins uniquely populate the proteome or immunopeptidome. Cell Rep.34, 108815 (2021). [DOI] [PMC free article] [PubMed] [Google Scholar]
- 35.Sahin, U. et al. An RNA vaccine drives immunity in checkpoint-inhibitor-treated melanoma. Nature585, 107–112 (2020). [DOI] [PubMed] [Google Scholar]
- 36.Vasileiou, S. et al. T-cell therapy for lymphoma using nonengineered multiantigen-targeted T cells is safe and produces durable clinical effects. J. Clin. Oncol.39, 1415–1425 (2021). [DOI] [PMC free article] [PubMed] [Google Scholar]
- 37.Sahin, U. et al. Personalized RNA mutanome vaccines mobilize poly-specific therapeutic immunity against cancer. Nature547, 222–226 (2017). [DOI] [PubMed] [Google Scholar]
- 38.Ott, P. A. et al. A phase Ib trial of personalized neoantigen therapy plus anti-PD-1 in patients with advanced melanoma, non-small cell lung cancer, or bladder cancer. Cell183, 347–362 (2020). [DOI] [PubMed] [Google Scholar]
- 39.Rojas, L. A. et al. Personalized RNA neoantigen vaccines stimulate T cells in pancreatic cancer. Nature618, 144–150 (2023). [DOI] [PMC free article] [PubMed] [Google Scholar]
- 40.Cuevas, M. V. R. et al. BamQuery: a proteogenomic tool to explore the immunopeptidome and prioritize actionable tumor antigens. Genome Biol.24, 188 (2023). [DOI] [PMC free article] [PubMed] [Google Scholar]
- 41.Banchereau, R. et al. Molecular determinants of response to PD-L1 blockade across tumor types. Nat. Commun.12, 3969 (2021). [DOI] [PMC free article] [PubMed] [Google Scholar]
- 42.Zhang, H. et al. Spatial positioning of immune hotspots reflects the interplay between B and T cells in lung squamous cell carcinoma. Cancer Res.83, 1410–1425 (2023). [DOI] [PMC free article] [PubMed] [Google Scholar]
- 43.Reynisson, B., Alvarez, B., Paul, S., Peters, B. & Nielsen, M. NetMHCpan-4.1 and NetMHCIIpan-4.0: improved predictions of MHC antigen presentation by concurrent motif deconvolution and integration of MS MHC eluted ligand data. Nucleic Acids Res.48, W449–W454 (2020). [DOI] [PMC free article] [PubMed] [Google Scholar]
- 44.Marcu, A. et al. HLA Ligand Atlas: a benign reference of HLA-presented peptides to improve T-cell-based cancer immunotherapy. J. Immunother. Cancer9, e002071 (2021). [DOI] [PMC free article] [PubMed] [Google Scholar]
- 45.Pearson, H. et al. MHC class I-associated peptides derive from selective regions of the human genome. J. Clin. Invest.126, 4690–4701 (2016). [DOI] [PMC free article] [PubMed] [Google Scholar]
- 46.Puig-Saus, C. et al. Neoantigen-targeted CD8+ T cell responses with PD-1 blockade therapy. Nature615, 697–704 (2023). [DOI] [PMC free article] [PubMed] [Google Scholar]
- 47.Daouda, T. et al. CAMAP: artificial neural networks unveil the role of codon arrangement in modulating MHC-I peptides presentation. PLoS Comput. Biol.17, e1009482 (2021). [DOI] [PMC free article] [PubMed] [Google Scholar]
- 48.Chong, C., Coukos, G. & Bassani-Sternberg, M. Identification of tumor antigens with immunopeptidomics. Nat. Biotechnol.40, 175–188 (2022). [DOI] [PubMed] [Google Scholar]
- 49.Gide, T. N. et al. Distinct immune cell populations define response to anti-PD-1 monotherapy and anti-PD-1/anti-CTLA-4 combined therapy. Cancer Cell35, 238–255 (2019). [DOI] [PubMed] [Google Scholar]
- 50.Du, K. et al. Pathway signatures derived from on-treatment tumor specimens predict response to anti-PD1 blockade in metastatic melanoma. Nat. Commun.12, 6023 (2021). [DOI] [PMC free article] [PubMed] [Google Scholar]
- 51.Auslander, N. et al. Robust prediction of response to immune checkpoint blockade therapy in metastatic melanoma. Nat. Med.24, 1545–1549 (2018). [DOI] [PMC free article] [PubMed] [Google Scholar]
- 52.Gurjao, C., Tsukrov, D., Imakaev, M., Luquette, L. J. & Mirny, L. A. Is tumor mutational burden predictive of response to immunotherapy? eLife10.7554/eLife.87465.1 (2023). [Google Scholar]
- 53.Danilova, L. et al. The mutation-associated neoantigen functional expansion of specific T cells (MANAFEST) assay: a sensitive platform for monitoring antitumor immunity. Cancer Immunol. Res.6, 888–899 (2018). [DOI] [PMC free article] [PubMed] [Google Scholar]
- 54.Wherry, E. J. & Kurachi, M. Molecular and cellular insights into T cell exhaustion. Nat. Rev. Immunol.15, 486–499 (2015). [DOI] [PMC free article] [PubMed] [Google Scholar]
- 55.Pircher, H., Pinschewer, D. D. & Boehm, T. MHC I tetramer staining tends to overestimate the number of functionally relevant self-reactive CD8 T cells in the preimmune repertoire. Eur. J. Immunol.53, e2350402 (2023). [DOI] [PubMed] [Google Scholar]
- 56.Yu, W. et al. Clonal deletion prunes but does not eliminate self-specific αβ CD8+ T lymphocytes. Immunity42, 929–941 (2015). [DOI] [PMC free article] [PubMed] [Google Scholar]
- 57.Kim, A. & Benavente, C. A. Oncogenic roles of UHRF1 in cancer. Epigenomes8, 26 (2024). [DOI] [PMC free article] [PubMed] [Google Scholar]
- 58.Stein, M. K. et al. Tumor mutational burden is site specific in non-small-cell lung cancer and is highest in lung adenocarcinoma brain metastases. JCO Precis. Oncol.3, 1–13 (2019). [DOI] [PubMed] [Google Scholar]
- 59.Chevallier, M., Borgeaud, M., Addeo, A. & Friedlaender, A. Oncogenic driver mutations in non-small cell lung cancer: past, present and future. World J. Clin. Oncol.12, 217–237 (2021). [DOI] [PMC free article] [PubMed] [Google Scholar]
- 60.Jaeger, A. M. et al. Deciphering the immunopeptidome in vivo reveals new tumour antigens. Nature607, 149–155 (2022). [DOI] [PMC free article] [PubMed] [Google Scholar]
- 61.Zhang, C. et al. A single-cell analysis reveals tumor heterogeneity and immune environment of acral melanoma. Nat. Commun.13, 7250 (2022). [DOI] [PMC free article] [PubMed] [Google Scholar]
- 62.Lambrechts, D. et al. Phenotype molding of stromal cells in the lung tumor microenvironment. Nat. Med.24, 1277–1289 (2018). [DOI] [PubMed] [Google Scholar]
- 63.Hu, Z. et al. Personal neoantigen vaccines induce persistent memory T cell responses and epitope spreading in patients with melanoma. Nat. Med.27, 515–525 (2021). [DOI] [PMC free article] [PubMed] [Google Scholar]
- 64.Kim, S. P. et al. Adoptive cellular therapy with autologous tumor-infiltrating lymphocytes and T-cell receptor-engineered T cells targeting common p53 neoantigens in human solid tumors. Cancer Immunol. Res.10, 932–946 (2022). [DOI] [PMC free article] [PubMed] [Google Scholar]
- 65.Müller, M., Gfeller, D., Coukos, G. & Bassani-Sternberg, M. ‘Hotspots’ of antigen presentation revealed by human leukocyte antigen ligandomics for neoantigen prioritization. Front. Immunol.8, 1367 (2017). [DOI] [PMC free article] [PubMed] [Google Scholar]
- 66.Hay, Z. L. Z., Knapp, J. R., Magallon, R. E., O’Connor, B. P. & Slansky, J. E. Low TCR binding strength results in increased progenitor-like CD8+ tumor-infiltrating lymphocytes. Cancer Immunol. Res.11, 570–582 (2023). [DOI] [PMC free article] [PubMed] [Google Scholar]
- 67.Schmidt, J. et al. Neoantigen-specific CD8 T cells with high structural avidity preferentially reside in and eliminate tumors. Nat. Commun.14, 3188 (2023). [DOI] [PMC free article] [PubMed] [Google Scholar]
- 68.Schreiber, R. D., Old, L. J. & Smyth, M. J. Cancer immunoediting: integrating immunity’s roles in cancer suppression and promotion. Science331, 1565–1570 (2011). [DOI] [PubMed] [Google Scholar]
- 69.Ochsenbein, A. F. Immunological ignorance of solid tumors. Springer Semin. Immunopathol.27, 19–35 (2005). [DOI] [PubMed] [Google Scholar]
- 70.Roberts, E. W. et al. Critical role for CD103+/CD141+ dendritic cells bearing CCR7 for tumor antigen trafficking and priming of T cell immunity in melanoma. Cancer Cell30, 324–336 (2016). [DOI] [PMC free article] [PubMed] [Google Scholar]
- 71.Norbury, C. C. et al. CD8+ T cell cross-priming via transfer of proteasome substrates. Science304, 1318–1321 (2004). [DOI] [PubMed] [Google Scholar]
- 72.Alkallas, R. et al. Multi-omic analysis reveals significantly mutated genes and DDX3X as a sex-specific tumor suppressor in cutaneous melanoma. Nat. Cancer1, 635–652 (2020). [DOI] [PMC free article] [PubMed] [Google Scholar]
- 73.Heide, T. et al. The co-evolution of the genome and epigenome in colorectal cancer. Nature611, 733–743 (2022). [DOI] [PMC free article] [PubMed] [Google Scholar]
- 74.Lamoliatte, F., McManus, F. P., Maarifi, G., Chelbi-Alix, M. K. & Thibault, P. Uncovering the SUMOylation and ubiquitylation crosstalk in human cells using sequential peptide immunopurification. Nat. Commun.8, 14109 (2017). [DOI] [PMC free article] [PubMed] [Google Scholar]
- 75.Sirois, I., Isabelle, M., Duquette, J. D., Saab, F. & Caron, E. Immunopeptidomics: isolation of mouse and human MHC class I- and II-associated peptides for mass spectrometry analysis. J. Vis. Exp.176, e63052 (2021). [DOI] [PubMed]
- 76.MacLean, B. et al. Skyline: an open source document editor for creating and analyzing targeted proteomics experiments. Bioinformatics26, 966–968 (2010). [DOI] [PMC free article] [PubMed] [Google Scholar]
- 77.Eng, J. K., Jahan, T. A. & Hoopmann, M. R. Comet: an open-source MS/MS sequence database search tool. Proteomics13, 22–24 (2013). [DOI] [PubMed] [Google Scholar]
- 78.Käll, L., Canterbury, J. D., Weston, J., Noble, W. S. & MacCoss, M. J. Semi-supervised learning for peptide identification from shotgun proteomics datasets. Nat. Methods4, 923–925 (2007). [DOI] [PubMed] [Google Scholar]
- 79.Courcelles, M. et al. MAPDP: a cloud-based computational platform for immunopeptidomics analyses. J. Proteome Res.19, 1873–1881 (2020). [DOI] [PubMed] [Google Scholar]
- 80.Szolek, A. et al. OptiType: precision HLA typing from next-generation sequencing data. Bioinformatics30, 3310–3316 (2014). [DOI] [PMC free article] [PubMed] [Google Scholar]
- 81.Benhammadi, M. et al. IFN-λ enhances constitutive expression of MHC class I molecules on thymic epithelial cells. J. Immunol.205, 1268–1280 (2020). [DOI] [PubMed] [Google Scholar]
- 82.Krokhin, O. V. Sequence-specific retention calculator. Algorithm for peptide retention prediction in ion-pair RP-HPLC: application to 300- and 100-Å pore size C18 sorbents. Anal. Chem.78, 7785–7795 (2006). [DOI] [PubMed] [Google Scholar]
- 83.Bouwmeester, R., Gabriels, R., Hulstaert, N., Martens, L. & Degroeve, S. DeepLC can predict retention times for peptides that carry as-yet unseen modifications. Nat. Methods18, 1363–1369 (2021). [DOI] [PubMed] [Google Scholar]
- 84.Gessulat, S. et al. Prosit: proteome-wide prediction of peptide tandem mass spectra by deep learning. Nat. Methods16, 509–518 (2019). [DOI] [PubMed] [Google Scholar]
- 85.Wilhelm, M. et al. Deep learning boosts sensitivity of mass spectrometry-based immunopeptidomics. Nat. Commun.12, 3346 (2021). [DOI] [PMC free article] [PubMed] [Google Scholar]
- 86.Li, H. Aligning sequence reads, clone sequences and assembly contigs with BWA-MEM. Preprint at https://arxiv.org/abs/1303.3997 (2013).
- 87.Cingolani, P. et al. A program for annotating and predicting the effects of single nucleotide polymorphisms, SnpEff: SNPs in the genome of Drosophila melanogaster strain w1118; iso-2; iso-3. Fly6, 80–92 (2012). [DOI] [PMC free article] [PubMed] [Google Scholar]
- 88.Cingolani, P. et al. Using Drosophila melanogaster as a model for genotoxic chemical mutational studies with a new program, SnpSift. Front. Genet.3, 35 (2012). [DOI] [PMC free article] [PubMed] [Google Scholar]
- 89.Radivojac, P. et al. Identification, analysis, and prediction of protein ubiquitination sites. Proteins78, 365–380 (2010). [DOI] [PMC free article] [PubMed] [Google Scholar]
- 90.Mészáros, B., Erdos, G. & Dosztányi, Z. IUPred2A: context-dependent prediction of protein disorder as a function of redox state and protein binding. Nucleic Acids Res.46, W329–W337 (2018). [DOI] [PMC free article] [PubMed] [Google Scholar]
- 91.Larouche, J.-D. et al. Transposable elements regulate thymus development and function. eLife12, RP91037 (2024). [DOI] [PMC free article] [PubMed] [Google Scholar]
- 92.Hesnard, L. et al. Immunogenicity of non-mutated ovarian cancer-specific antigens. Curr. Oncol.31, 3099–3121 (2024). [DOI] [PMC free article] [PubMed] [Google Scholar]
- 93.Cimen Bozkus, C., Blazquez, A. B., Enokida, T. & Bhardwaj, N. A T-cell-based immunogenicity protocol for evaluating human antigen-specific responses. STAR Protoc.2, 100758 (2021). [DOI] [PMC free article] [PubMed] [Google Scholar]
- 94.Laumont, C. M. et al. Non-coding regions are the main source of targetable tumor-specific antigens — CODES. Zenodo10.5281/zenodo.1484486 (2018). [DOI] [PubMed]
Associated Data
This section collects any data citations, data availability statements, or supplementary materials included in this article.
Supplementary Materials
Supplementary Tables 1–26.
Numerical source data.
Numerical source data.
Numerical source data.
Numerical source data.
Numerical source data.
Numerical source data.
Numerical source data.
Numerical source data.
Numerical source data.
Numerical source data.
Numerical source data.
Numerical source data.
Numerical source data.
Numerical source data.
Numerical source data.
Data Availability Statement
The RNA-seq data generated and analyzed during the present study were deposited at GEO and can be accessed with accession number GSE230489. The MS data generated and analyzed here (except the raw MS data for the melanoma cell lines from Chong et al.18) were deposited at PRIDE with accession numbers PXD043059 for melanoma samples (https://www.ebi.ac.uk/pride/archive/projects/PXD043059) and PXD043057 for NSCLC samples (https://www.ebi.ac.uk/pride/archive/projects/PXD043057). The raw MS data for the melanoma cell lines from Chong et al.18 were downloaded from PRIDE with accession PXD013649 (https://www.ebi.ac.uk/pride/archive/projects/PXD013649). The RNA-seq and exome-seq data for the melanoma cell lines from Chong et al.18 were downloaded from the EGA Archive with accession numbers EGAS00001003723 and EGAS00001003724 (https://ega-archive.org/datasets/EGAD00001005097) upon request to the related data access committee. Accession numbers for all other data downloaded from previous studies and used here are listed in Supplementary Table 4. All remaining data supporting the present study’s findings are available within the article, the Supplementary Information, source data and/or from the corresponding authors upon request. Source data are provided with this paper.
The code used for MS-based peptide identification16 is available on Zenodo at 10.5281/zenodo.1484486 (ref. 94).