Abstract
Fluorescence ratio imaging microscopy and microelectrode ion flux estimation techniques were combined to study mechanisms of pH homeostasis in Listeria monocytogenes subjected to acid stress at different levels of glucose availability. This novel combination provided a unique opportunity to measure changes in H+ at either side of the bacterial membrane in real time and therefore to evaluate the rate of H+ flux across the bacterial plasma membrane and its contribution to bacterial pH homeostasis. Responses were assessed at external pHs (pHo) between 3.0 and 6.0 for three levels of glucose (0, 1, and 10 mM) in the medium. Both the intracellular pH (pHi) and net H+ fluxes were affected by the glucose concentration in the medium, with the highest absolute values corresponding to the highest glucose concentration. In the presence of glucose, the pHi remained above 7.0 within a pHo range of 4 to 6 and decreased below pHo 4. Above pHo 4, H+ extrusion increased correspondingly, with the maximum value at pHo 5.5, and below pHo 4, a net H+ influx was observed. Without glucose in the medium, the pHi decreased, and a net H+ influx was observed below pHo 5.5. A high correlation (R = 0.75 to 0.92) between the pHi and net H+ flux changes is reported, indicating that the two processes are complementary. The results obtained support other reports indicating that membrane transport processes are the main contributors to the process of pHi homeostasis in L. monocytogenes subjected to acid stress.
It is generally accepted that the cell membrane acts as a natural barrier to control entry and exit of materials from the cell. Recent progress in electrophysiology and molecular genetics has revealed the crucial role of cellular membrane transporters in perception and signaling in response to environmental factors (30). Changes in plasma membrane potential and/or ion flux modulations are among the earliest cellular events measured in response to temperature, osmotic stress, and mechanical stimulation in many organisms (19, 28, 30). However, little is known of early events in the adaptive response of Listeria monocytogenes that occur at the cell membrane and enable survival in hostile environments or growth in foods.
Like other neutrophiles, L. monocytogenes maintains intracellular pH (pHi) at around 8 even when the pH of the external medium (pHo) decreases (3, 4, 24). The maintenance of homeostasis requires an intact semipermeable cell membrane and the expenditure of energy. Therefore, any treatments that disrupt membranes or interfere with the generation of cellular energy will hinder or abolish homeostatic capacity and will eventually lead to cell degeneration and death (12). Acid stress has a direct effect on the proton motive force and therefore may result in instantaneous changes in cell membrane potential (29). Inevitably, this will significantly affect the transport of all other major nutrients taken in cotransport with H+ (13). Regulation of the pHi is a fundamental requirement for the survival and viability of L. monocytogenes.
Of special importance are kinetic studies. Adaptive responses of bacterial cells are usually very fast. The synthesis of specific proteins in response to low-pH treatment (acid tolerance response [ATR]) is known to occur ∼60 min after stress onset (7, 16). Long before de novo synthesis of the stress-induced proteins becomes evident, biophysical responses take place (a time scale of minutes or even seconds) (20). Therefore, a high rate of data sampling is required during that time to achieve temporal resolution and to understand underlying mechanisms of bacterial pH homeostasis.
Bacteria attempt to maintain their pHi by minimizing membrane permeability to H+, buffering the cytoplasm, ameliorating the pHo through catabolism or selective substrate utilization, and using the H+ pump system (1, 5, 6, 11, 21, 27). The literature does not suggest which, if any, of these mechanisms is predominant in L. monocytogenes. Consequently, it is important to study membrane transport processes and their input, if any, into the process of Listeria homeostasis.
In recent years, fluorescent ratio imaging microscopy (FRIM) has become a very powerful tool in microbial research (3, 26). Among the advantages of the technique are the ability to perform real-time measurements of pHi for individual bacterial cells and simplicity of handling. While it is able to detect the overall effect of acid stress on pHi, this technique cannot reveal the underlying mechanisms involved.
Recently, we introduced the microelectrode ion flux estimation (MIFE) system to microbiology to study membrane transport processes in bacterial cells. This technique allows measurement of the net ion fluxes at the surfaces of immobilized bacterial cells (23). There are several advantages of this approach. First, fluxes of specific ions can be measured with high spatial (few micrometers) and temporal (ca. 5-s) resolution. Second, fluxes of several ions (up to four in the present configuration of the MIFE system) can be measured simultaneously and in a relatively small volume. This provides an opportunity to monitor membrane transport processes in real time and to investigate the ionic mechanism involved. However, as many processes may contribute to measured pH changes (interpreted by the MIFE technique as net H+ flux), unambiguous interpretation of H+ flux data is sometimes problematic.
In this study, we combined the FRIM and MIFE techniques in one experimental setup and performed simultaneous measurements of pHi and net H+ fluxes in response to acidification of the medium. This novel combination of techniques enabled real-time changes in H+ concentrations at either side of the bacterial membrane to be measured concurrently and allowed the contribution of plasma membrane H+ transporters to bacterial pH homeostasis to be investigated.
MATERIALS AND METHODS
Bacterial strain and growth conditions.
The bacterial strain used throughout this study was L. monocytogenes 4140, provided by the Danish Meat Research Institute, Roskilde, Denmark, and isolated from bacon. The inoculum and the culture were prepared as described previously by Budde and Jakobsen (3). Briefly, 15 ml of brain heart infusion broth (Difco, Detroit, Mich.) adjusted to pH 6 with 5 M HCl was inoculated with 0.25 ml of inoculum, which was grown at 37°C for 18 h without agitation.
In experiments with dead cells, an aliquot of the culture was autoclaved at 121°C for 15 min. The immobilization procedure and flux measurements were performed similarly for viable and dead cells.
Acid stress and recovery.
Cultures were harvested by centrifugation at 10,000 × g for 5 min, followed by washing, suspension in a minimal medium (MM) at pH 6, and adaptation for 1 h. The MM composition was 0.5 mM (NH4)2HPO4, 0.2 mM KCl, 0.1 mM NaCl, and 0.2 mM MgSO4 with various concentrations of glucose (0, 1, and 10 mM). The net H+ flux and pHi were monitored under three conditions. (i) Static experiments included challenge with a range of constant pHos from 3.0 to 6.0 at intervals of 0.5 pH units, followed by adaptation for 1 h, with measurements of pHi and H+ flux resumed immediately. (ii) Kinetic studies were performed by a shift in pHo from 6.0 to 4.0 or 3.0. (iii) Recovery experiments involved monitoring bacterial recovery at pHo 6.0 at glucose concentrations similar to the starting concentration after acidic treatments at pHo 4.0 or 3.0.
Staining cells for FRIM.
Staining of cells was performed essentially as described by Budde and Jakobsen (3). Briefly, cells harvested by centrifugation were suspended in 50 mM phosphate-buffered saline (pH 7.4) followed by incubation with 5(6)-carboxyfluorescein diacetate succinimidyl ester (cFDASE) (Molecular Probes Inc., Eugene, Oreg.) at a final concentration of 30 μM at 37°C for 30 min. Subsequently, the cells were washed and incubated with MM containing the desired glucose concentration and at the desired pH at 37°C for 30 min. The cell suspension was centrifuged at 10,000 × g for 5 min and suspended in an equivalent volume of MM at the same pH and glucose concentration.
Immobilization of cells.
Cells were immobilized on a coverslip essentially as described by Shabala et al. (23) with some modifications. A glass coverslip was cleaned with ethanol, thoroughly rinsed with running distilled water, and then dried. Poly-l-lysine (0.1% [wt/vol] aqueous solution [P 8920; Sigma Diagnostics, St. Louis, Mo.]) was used to attach the cells to the glass surface. A drop of the poly-l-lysine solution was applied to the coverslip, followed by rinsing with running distilled water after 2 to 3 min of poly-l-lysine application. The suspension of the stained cells was diluted in MM at a 1:5 ratio. An aliquot of 0.1 ml of the culture was applied to a prepared coverslip and allowed to settle for ∼2 to 3 min. The coverslip with immobilized bacteria was washed with running MM to remove unattached cells, followed by assembly of the chamber with the prepared coverslip. The perfusion chamber thus formed (∼1-ml volume) was filled with MM at the desired glucose concentration and pH. All the preparations were performed under reduced illumination in the room due to the instability of fluorescent preparations. The chamber was mounted on a platform (type PH1; Warner Instrument Corp., Hamden, Conn.) and placed on the microscope stage (Zeiss model Axiovert 135 TV; Brock & Michelsen A/S, Birker/od, Denmark). For kinetic experiments, solutions were perfused through the chamber at a rate of up to 6 ml/min.
pHi measurements.
The pHi of individual cells was measured by ratio imaging using a fluorescence microscope as described by Budde and Jakobsen (3). Stained cells were excited at 490 and 435 nm with an exposure time of 1 s. Fluorescence emission was recorded at wavelengths between 515 and 565 nm by using a cooled charge-coupled device camera (EEV 512 × 1024; 12-bit frame transfer camera; Princeton Instruments Inc., Trenton, N.J.). To minimize photobleaching of the stained cells, a 2.5% neutral-density filter was used in the excitation path. Ratio imaging of emission signals collected from excitation at 490 and 435 nm was performed by using the software package MetaFluor, version 3.5 (Universal Imaging Corp., West Chester, Pa.).
Image acquisition and pHi calculation.
Data analysis was carried out on single cells using MetaFluor 3.5 software. Cells were randomly selected on the 435-nm image, which is pH independent (in order to avoid selection by a high intensity based on the 490-nm image, which is pH dependent). The ratios R490 and R435 were corrected for background signal. The pHi calculations were performed using a calibration curve. In each experiment, between 15 and 25 randomly selected individual L. monocytogenes cells were analyzed. Each experiment was repeated at least twice.
Microelectrode fabrication.
The complete experimental procedure for ion-selective microelectrode fabrication was given in our earlier publications (22, 23). Briefly, prepared electrode blanks were backfilled with backfilling solution (0.15 mM NaCl plus 0.4 mM KH2PO4) adjusted to pH 6.0 with NaOH. Immediately after the backfilling, the electrode tips were front filled with commercially available ionophore cocktail (95297; Fluka Chemical). The electrodes were calibrated in a set of three known standards with pHs from 3.0 to 7.0. Electrodes with responses of <50 mV per decade and with correlation coefficients of <0.999 were discarded. A reference electrode was fabricated in a similar way from a glass microcapillary and filled with 1 M KCl in 2% agar.
H+ flux measurements.
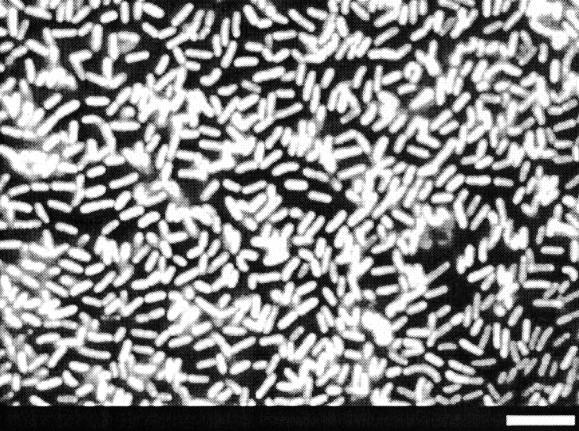
Bacterial cells were immobilized essentially as described above for pHi measurements, with some modifications. In particular, the washed cells were suspended in 30 μl of MM and immobilized on a coverslip. A near-confluent bacterial layer was created (Fig. 1) that allowed measurements of net ion fluxes from the surfaces of immobilized bacterial cells using the MIFE technique.
FIG. 1.
Immobilized Listeria monocytogenes cells. Cells were harvested by centrifugation at 10,000 × g for 5 min, washed, and suspended in 30 μl of MM. An aliquot of the culture was applied to a coverslip cleaned and coated with poly-l-lysine and was allowed to settle for 2 to 3 min, after which the unattached bacteria were washed off under running MM. Bar, 5 μm.
The theory of noninvasive ion flux measurements was recently reviewed (15). Microelectrodes were held in E45P-F15PH electrode holders (CDR Clinical Technology, Middle Cove, Australia) mounted on a three-dimensional micromanipulator (22, 23). An open-type perfusion chamber inserted on a microscope stand allowed easy access to both sides of the glass coverslip to measure the net flux from bacteria. For kinetic experiments, the rate of solution flow through the perfusion chamber was up to 6 ml min−1. All measurements were made under steady-state conditions at least 1.5 min after the solution flow stopped to satisfy unstirred-layer conditions essential for the MIFE measurements (15).
Hydrogen electrodes were positioned 15 to 20 μm above the immobilized bacteria and moved 30 μm up and down in a square-wave manner with 0.05-Hz frequency by a computer-driven hydraulic manipulator. Under this design, the measured H+ flux originated from the surface area of 300 to 400 μm2 (15), i.e., it represented an average net flux from more than 300 bacterial cells (Fig. 1).
The recorded voltages were converted into concentration differences using the calibrated Nernst slopes of the electrodes. The initial 4 s after each movement was ignored to allow for settling of the system (15, 25). The flux of H+ (inward positive) was calculated by the MIFE software, assuming planar diffusion geometry of the bacterial layer (15).
Each flux measurement lasted about 3 min in static experiments. The electrodes were then repositioned to another site of immobilized bacteria about 200 μm away, and the measurements were resumed. On average, five to seven sites were measured from the immobilized bacteria at every pHo and glucose concentration studied. In kinetic experiments, one site was monitored throughout the experiment.
Data analysis.
Standard Excel (Microsoft Corp.) tools were used to calculate correlation coefficients between different data series. The significance of the differences between means was calculated using the t test.
RESULTS
Methodological aspects.
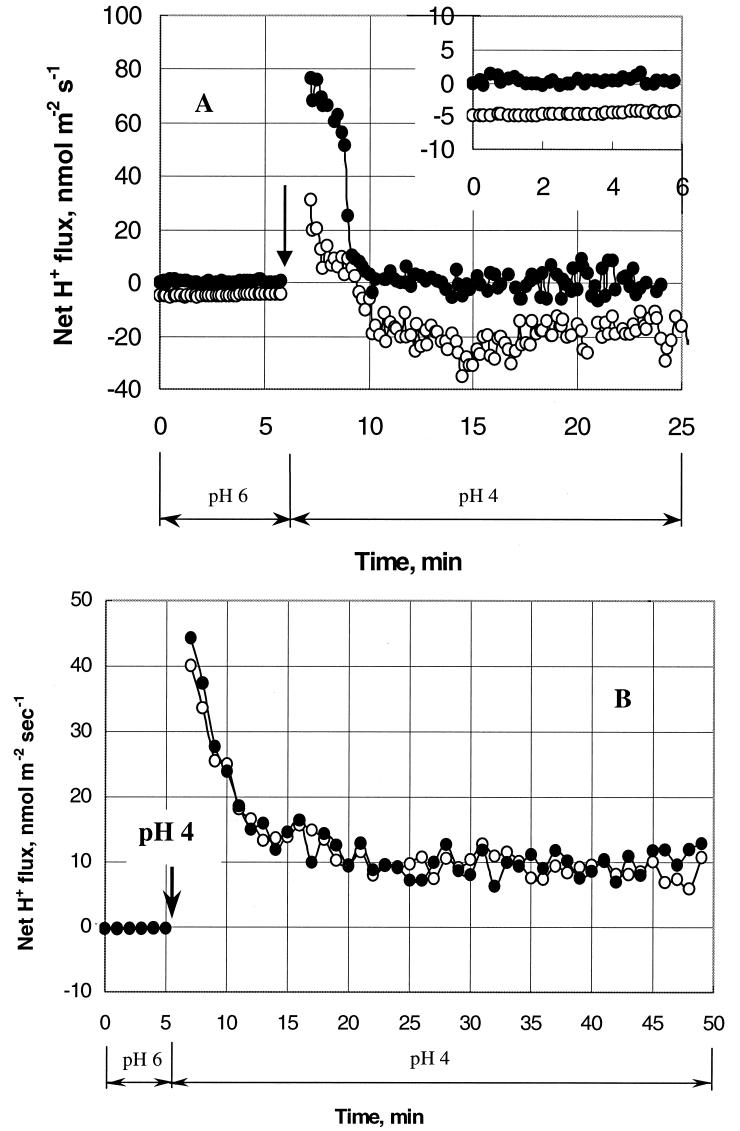
Before acid stress experiments were undertaken, several methodological issues were addressed. To ensure that the observed fluxes were due to the activity of living cells, measurements were conducted using viable and dead cells (Fig. 2A). Zero net H+ flux was observed from the dead cells (Fig. 2A, from 0 to 6 min). Immediately after the pHo was shifted from 6 to 4, a brief (<5-min) transient uptake of H+ was observed, followed by a return to zero net H+ flux (from 10 min onward).
FIG.2.
Methodological aspects. (A) Kinetics of net H+ fluxes from viable (open circles) and dead (solid circles) L. monocytogenes cells in response to change of medium pH. The change of solution from pHo 6 to 4 is indicated by the arrow. Experimental solutions containing 10 mM glucose were used. An enlarged inset shows the net H+ fluxes at pHo 6. Data acquisition occurred every 0.1 min. (B) Effect of fluorescent probe application on net H+ flux changes in L. monocytogenes during pHo change from 6 to 4 (indicated by the arrow) in the absence of glucose. L. monocytogenes cells were stained with 30 μM cFDASE (open circles). Control cells were prepared using a similar protocol but without the fluorescent probe (solid circles). Data were taken every 0.1 min. Each point represents the average value over 1 min.
In contrast, viable cells of L. monocytogenes 4140 extruded H+ at pHo 6 at the level typical for these experimental conditions. Furthermore, a shift from pHo 6 to pHo 4 resulted in a transient net H+ influx (Fig. 2A, 7 to 9 min) followed by H+ extrusion.
Furthermore, the potential effects on cell physiology and membrane transport activity of dye loaded in the cell for FRIM measurements were studied. The cells were loaded with the fluorescent probe cFDASE used for pHi measurements, and kinetic experiments were conducted using the MIFE system to monitor the net H+ flux at pHo 6 and after medium change to pHo 4 (Fig. 2B). These data were compared with control L. monocytogenes cell responses prepared in a similar way but without the addition of cFDASE. The results demonstrated almost identical responses of control cells and cells loaded with the fluorescent dye, indicating the absence of any negative effect of the probe on cell metabolism.
H+ fluxes and pHis at different pHo and glucose concentrations. (i) Static experiments.
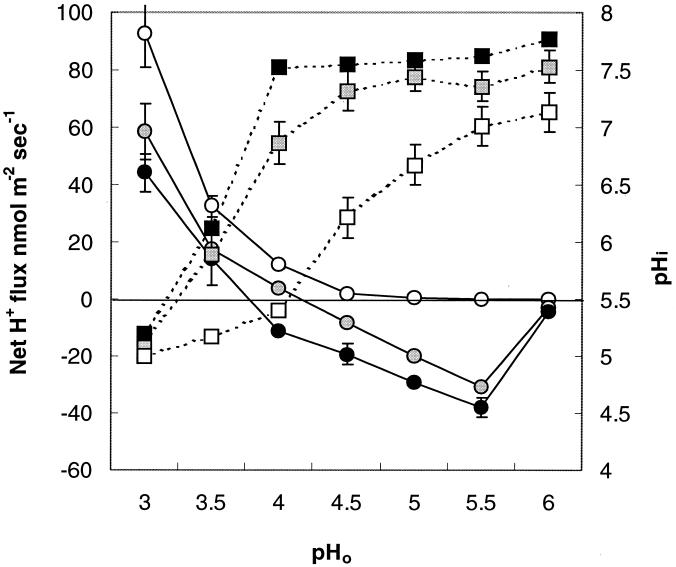
L. monocytogenes cells were able to maintain a constant pHi between 7 and 8 for a pHo of >4.0 in trials with glucose in the medium, while the pHi decreased dramatically below pHo 4.0 (Fig. 3). In the absence of glucose in the medium, the pHi was lower than corresponding data for the trials with glucose at any pHo and started to decline below pHo 5.5.
FIG. 3.
Net H+ fluxes (circles) and pHi (squares) as functions of pHo (static experiments). Cells were adapted for 1 h in a pHo range between 3.0 and 6.0 at 0.5-pH unit intervals at three levels of glucose in MM before measurement. Open symbols, 0 mM glucose; shaded symbols, 1 mM glucose; solid symbols, 10 mM glucose. The pHi values are averages of 40 to 60 single cells; the net H+ flux values are averages of three to six independent experiments with four to six distinct areas of immobilized cells measured in each. The error bars indicate standard errors of the mean.
Concurrently measured H+ fluxes showed net H+ extrusion at a pHo of >4.0 and net H+ influx below pHo 4.0 in the presence of glucose in the medium (Fig. 3). Maximum H+ extrusion occurred at pHo 5.5. The net H+ flux was zero for the trial without glucose at pHos 6.0 and 5.5, followed by net H+ influx below pHo 5.5.
The magnitudes of both pHi and net H+ flux were related to the glucose concentration in the medium, with a higher pHi and H+ extrusion corresponding to a higher glucose concentration.
(ii) Kinetic studies.
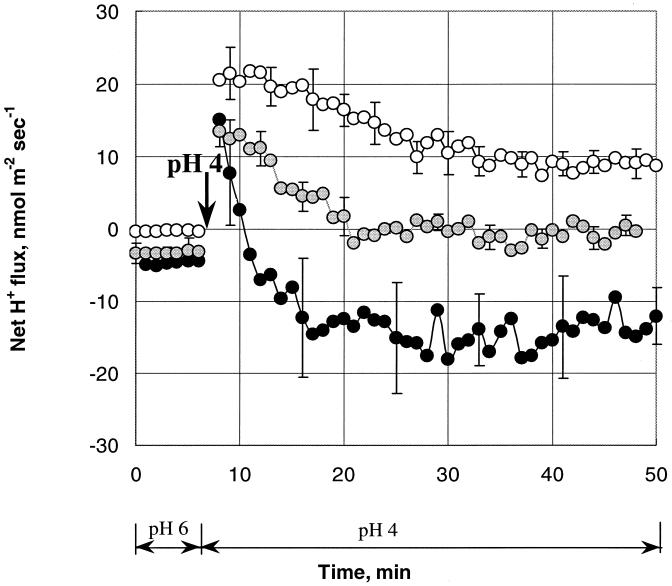
Kinetic experiments were crucial to evaluate the time constants of the mechanisms underlying cell ATR and contributing to L. monocytogenes pHi homeostasis. Immediately after the onset of acid stress, hydrogen ions entered the cell at an average rate of about 20 nmol m−2 s−1 regardless of the availability of glucose in the medium (Fig. 4). The subsequent kinetics, however, were strikingly different for 0, 1, and 10 mM glucose variants. Cells provided with 10 mM glucose were able to extrude H+ at a significantly higher rate: 3.3 compared to 0.5 nmol m−2 s−1 per min for cells not provided with glucose. As a result, 5 min after the onset of acid stress, these cells pumped out excess H+ (a net H+ efflux after 10 min [Fig. 4, 10 mM glucose]). Glucose-deprived cells (Fig. 4, 0 mM glucose) continued to display net H+ influx for the whole period of measurement (50 min). Cells incubated with intermediate glucose concentrations were able to extrude H+ only 20 min after the onset of stress.
FIG. 4.
Kinetics of net H+ fluxes from immobilized L. monocytogenes in response to change of pHo from 6 to 4 (indicated by the arrow) at three levels of glucose in MM. Open symbols, 0 mM glucose; shaded symbols, 1 mM glucose; solid symbols, 10 mM glucose. Each point represents the average value of three to seven independent experiments. The error bars indicate standard errors of the mean.
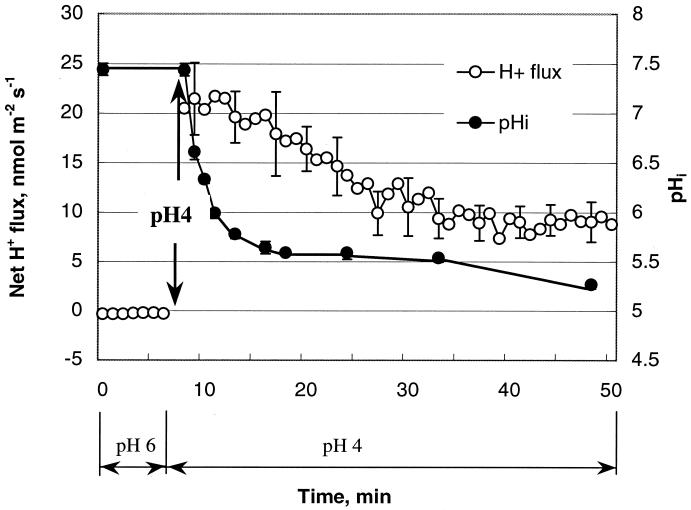
There was high (R > 0.90; P < 0.01) correlation between pHi and H+ flux kinetics for the trials with glucose. As H+ ions flowed into the cell, the intracellular pHi declined sharply for 2 to 3 min after the onset of stress (Fig. 5). The resulting drop in pHi (about 2 pH units) reduced the magnitudes of the electrochemical gradients (ΔμH+) and resulted in decreased ingress of H+ into the cell (Fig. 5). The rate of pHi change was inversely proportional to the glucose concentration in the medium, with the fastest stabilization after acid treatment occurring at the highest glucose concentration (data not shown).
FIG. 5.
Kinetics of net H+ fluxes and pHi in response to acidic treatment at pHo 4.0. Cells adapted for 1 h to pHo 6 without glucose in MM were subjected to pHo 4 without glucose (acid stress is indicated by the arrow). The same cells were monitored throughout the experiment. The error bars indicate standard errors of the mean of four independent experiments.
(iii) Recovery after acid stress.
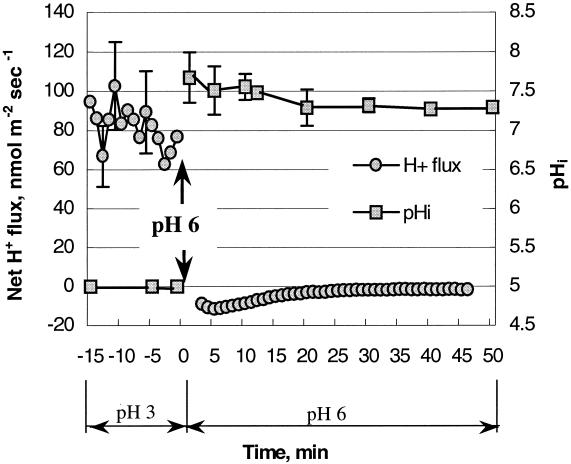
After acid stress was removed, bacterial cells were able to recover their pHi values. Immediately after the solution was changed from pH 3 to 6, the net H+ flux switched from influx to efflux (Fig. 6). This resulted in almost complete recovery of pHi values (around 7.3) (Fig. 6). The magnitude of the response after recovery depended on the severity of the stress applied (the pHo of treatment), the duration of acid stress, and the glucose concentration in the medium (data not shown).
FIG. 6.
Kinetics of recovery measured as pHi and net H+ flux changes at pHo 6.0 after an acid stress at pH 3.0. The change of pHo from 3 to 6 is indicated by the arrow. The medium contained 1 mM glucose for all of the treatments; 20 individual cells were monitored for pHi analyses. The error bars indicate standard errors of the mean (n = 3).
DISCUSSION
Recently, we demonstrated the applicability of the FRIM (3, 26) and MIFE (23) techniques in microbiology. Here, we have extended the application of these techniques by combining them to elucidate the role of plasma membrane H+ transporters in acid stress responses and in maintaining pHi homeostasis in L. monocytogenes.
Before acid stress responses were studied, some methodological issues were addressed to ensure the absence of any confounding effect on the measurements. We demonstrated that only viable (not dead) cells are able to extrude H+ after acid stress (Fig. 2A), thus validating the approach used. Dead cells are permeable for protons. A shift from pHo 6 to 4 led to rapid equilibration of internal (6.0 under our experimental conditions) and external (4.0) pH. Once concentrations of H+ at both sides of the bacterial membrane are in equilibrium, zero H+ flux is observed (from 10 min onward [Fig. 2A, solid symbols]).
We also observed that the net H+ flux was not affected by the fluorescent probe used (Fig. 2B), which illustrates the fact that the MIFE method may be used to validate other physiological techniques applied to an organism.
It is generally accepted that pHi exerts a feedback effect on cell metabolism. Cell membranes have low permeability to H+ (9, 27), and the regulation of pHi implies control over this permeability. Protons enter and exit the cell by interacting with the cell systems that control H+ transport, such as H+-ATPase, Na+ and H+ antiporters, decarboxylase systems, and electron transport systems (2, 5, 6, 8). In aerobic bacteria, the active transport of H+ is coupled to the process of electron transport in respiratory chains. In anaerobic bacteria, H+ transport is carried out by H+-ATPase molecules (the proton pump) using energy from ATP hydrolysis. L. monocytogenes, a facultative anaerobic bacterium, may use both processes to achieve pHi homeostasis (18). Apart from proton transport processes, pH homeostasis is achieved by cytoplasmic buffering (11, 21). As many different processes may contribute to pHi regulation, the unambiguous interpretation of the underlying mechanisms is difficult. Until now, a precise role for any of these mechanisms had not been clearly established.
In this study, we monitored the response of L. monocytogenes to acid stress in real time using the MIFE and FRIM techniques. This provided a better understanding of mechanisms contributing to regulation of L. monocytogenes pH homeostasis. We demonstrated that in the presence of glucose, the pHi remained constant at intermediate pHo while corresponding net H+ extrusion was increased, with the maximum value occurring at pHo 5.5 (Fig. 3). The activity of H+-ATPase increases with the lowering of the pHo for a number of bacteria (10, 14, 17). The optimal pHo for maximum H+-ATPase activity has been shown to vary between 5.0 and 6.5 depending on the species used, as established for lactic acid bacteria (10, 14, 17). Furthermore, application of N,N′-dicyclohexylcarbodiimide, an inhibitor of H+-ATPase, significantly decreased the observed net H+ extrusion at intermediate pHo, thus supporting the involvement of H+-ATPase in the L. monocytogenes response to acid stress (data not shown). Our data also confirm the observations of Cotter et al. on the role of H+-ATPase in the ATR of L. monocytogenes (5).
We showed that the magnitudes of the responses of both pHi and H+ flux depended on glucose concentration in the medium and that both pHi and H+ extrusion had maximum values at the highest glucose concentration in the medium for any given pHo (Fig. 3). Moreover, the lowest pHo at which the pHi started to decrease occurred at the highest glucose concentration and reflected the ability of L. monocytogenes cells to expel protons. Indeed, the pHi only started to decrease for pHos of <4, 4.5, and 5.5 for 10, 1, and 0 mM of glucose, respectively. These values corresponded to a net H+ influx below the indicated pHo for similar glucose trials. The kinetics of net H+ fluxes also demonstrated that the maximum rate of response occurred at the highest glucose concentration in the medium (Fig. 4). On the other hand, glucose-deprived cells were not able to pump H+ out even 50 min after the onset of stress (Fig. 4). H+-ATPase activity has been shown to correlate with cytoplasmic ATP levels (10, 17), which depend on the glucose concentration in the medium. The absence of H+ extrusion in the trial without glucose (Fig. 3) is in accord with this and suggests involvement of H+-ATPase. The concentrations of glucose (1 and 10 mM) used in the present study correspond to high and low affinities, respectively, for glucose transport in L. monocytogenes that are fueled by the proton motive force (5). Consequently, the net H+ flux response observed in our experiments at intermediate pHo levels might be attributed to H+-ATPase activity that was modulated by the glucose concentration in the medium. The modulation of H+ transport across the bacterial membrane was sufficient to maintain the pHi at a constant level at pHo values within the pH range that permits the growth of L. monocytogenes.
The interdependence of the pHi and the net H+ flux was also evident in the kinetics of acid stress and recovery (Fig. 5 and 6). The acidification of the pHo from 6 to 4 led to a decrease in the pHi followed by a net H+ influx measured immediately after the onset of stress (Fig. 5). During recovery, bacterial cells immediately (within the time resolution of the experiment [Fig. 6]) switched from net H+ influx to efflux, which led to almost complete recovery of pHi. This is in accord with complementary survival data (24). The data demonstrate the complementary origins of the pHi and the H+ flux and therefore imply a crucial role of bacterial membrane H+ transporters in acid stress responses and pH homeostasis in L. monocytogenes. This conclusion is further supported by the correlation (R = 0.76 without glucose [P < 0.05]; R > 0.90 with glucose [P < 0.01]) between the pHi and net H+ flux changes for all glucose concentrations studied in a pHo range of 3.0 to 6.0. Collectively, these results support the involvement of active membrane processes in internal pH regulation and might be important in understanding the mechanism of ATR induction. Adaptation at intermediate pHo induces ATR in bacteria, including L. monocytogenes, increasing survival at lower pHo values (7, 16). ATR is known to be induced after ∼60 min of pH treatment at an intermediate pH and involves the synthesis of specific proteins. However, the processes involved in bacterial adaptation prior to ATR induction are not known. This knowledge is important for understanding early events in bacterial adaptation. The reported maximum ATR induction for L. monocytogenes at pHo 5.5 (5) correlates well with the observed maximum H+ extrusion at this pHo. The increase in net H+ extrusion might represent early steps in the process of adaptation.
The combination of the FRIM and MIFE techniques proved to be a powerful tool to study bacterial response to acid stress in real time. To our knowledge, this is the first study of its kind in the literature. Further possible applications of the synergism of the two techniques used in this work include studies of bacterial response to other stresses, such as organic acids, salinity, and temperature.
Acknowledgments
We acknowledge S. Shabala for the lease of the MIFE system and for his valuable discussions of both technical and scientific aspects of this work. J. Olley is thanked for reading the manuscript.
This work was supported by the DISR Targeted Research Alliances program (Australia), Meat and Livestock Australia, the Danish FØTEK Program (grant 93S-2444-Å99-00058), the Danish Bacon and Meat Council, a stipend of the School of Agricultural Science to L.S., and an Australian Society for Microbiology Foundation Scholarship to L.S.
REFERENCES
- 1.Booth, I. R. 1985. Regulation of cytoplasmic pH in bacteria. Microbiol. Rev. 49:359-378. [DOI] [PMC free article] [PubMed] [Google Scholar]
- 2.Booth, I. R. 1999. The regulation of intracellular pH in bacteria, p. 19-28. In D. J. Cladwick and G. Cardew (ed.), Bacterial responses to pH. Novartis Foundation Symposium 221. John Wiley & Sons, Brisbane, Australia. [DOI] [PubMed]
- 3.Budde, B. B., and M. Jakobsen. 2000. Real-time measurements of the interaction between single cells of Listeria monocytogenes and nisin on a solid surface. Appl. Environ. Microbiol. 66:3568-3591. [DOI] [PMC free article] [PubMed] [Google Scholar]
- 4.Christensen, D. P., and R. W. Hutkins. 1992. Collapse of the proton motive force in Listeria monocytogenes caused by a bacteriocin produced by Pediococcus acidilactici. Appl. Environ. Microbiol. 58:3312-3315. [DOI] [PMC free article] [PubMed] [Google Scholar]
- 5.Cotter, P. D., C. G. M. Gahan, and C. Hill. 2000. Analysis of the role of the Listeria monocytogenes F0F1-ATPase operon in the acid tolerance response. Int. J. Food Microbiol. 60:137-146. [DOI] [PubMed] [Google Scholar]
- 6.Cotter, P. D., C. G. M. Gahan, and C. Hill. 2001. A glutamate decarboxylase system protects Listeria monocytogenes in gastric fluid. Mol. Microbiol. 40:465-475. [DOI] [PubMed] [Google Scholar]
- 7.Davis, M. J., P. J. Coote, and C. P. O'Byrne. 1996. Acid tolerance in Listeria monocytogenes: the adaptive acid tolerance response (ATR) and growth-phase-dependent acid resistance. Microbiology 142:2975-2982. [DOI] [PubMed] [Google Scholar]
- 8.Dilworth, M. J., and A. R. Glenn. 1999. Problems of adverse pH and bacterial strategies to combat it, p. 4-18. In D. J. Cladwick and G. Cardew (ed.), Bacterial responses to pH. Novartis Foundation Symposium 221. John Wiley & Sons, Brisbane, Australia. [DOI] [PubMed]
- 9.Harold, F. M., and J. van Brunt. 1978. Circulation of H+ and K+ across the plasma membrane is not obligatory for bacterial growth. Science 197:372-373. [DOI] [PubMed] [Google Scholar]
- 10.Kobayashi, H., T. Suzuki, N. Kinoshita, and T. Unemoto. 1984. Amplification of the Streptococcus faecalis proton-translocating ATPase by a decrease in cytoplasmic pH. J. Bacteriol. 158:1157-1160. [DOI] [PMC free article] [PubMed] [Google Scholar]
- 11.Krulwich, T. A., R. Agus, M. Schneier, and A. A. Guffanti. 1985. Buffering capacity of bacilli that grow at different pH ranges. J. Bacteriol. 162:768-772. [DOI] [PMC free article] [PubMed] [Google Scholar]
- 12.Mackey, B. M. 2000. Injured bacteria, p. 315-341. In B. M. Lund, A. C. Bird-Parker, and G. W. Gould (ed.), The microbiological safety and quality of food, vol. 1. Aspen Publishers Inc., Gaithersburg, Md. [Google Scholar]
- 13.Maloney, P., and T. H. Wilson. 1996. Ion-coupled transport and transporters, p. 1130-1148. In F. C. Neidhardt et al. (ed.), Escherichia coli and Salmonella: cellular and molecular biology. ASM Press, Washington, D.C.
- 14.Nannen, N. L., and R. W. Hutkins. 1991. Proton-translocating adenosine triphosphate activity in lactic acid bacteria. J. Dairy Sci. 74:747-751. [Google Scholar]
- 15.Newman, I. A. 2001. Ion transport in roots: measurement of fluxes using ion-selective microelectrodes to characterise transporter function. Plant Cell Environ. 24:1-14. [DOI] [PubMed] [Google Scholar]
- 16.O'Driscoll, B., C. G. Gahan, and C. Hill. 1996. Adaptive acid tolerance response in Listeria monocytogenes: isolation of an acid-tolerant mutant which demonstrates increased virulence. Appl. Environ. Microbiol. 62:1693-1698. [DOI] [PMC free article] [PubMed] [Google Scholar]
- 17.O'Sullivan, E., and S. Condon. 1999. Relationship between acid tolerance, cytoplasmic pH, and ATP and H+-ATPase levels in chemostat cultures of Lactococcus lactis. Appl. Environ. Microbiol. 65:2287-2293. [DOI] [PMC free article] [PubMed] [Google Scholar]
- 18.Phan-Thanh, L., F. Mahouin, and S. Alige. 2000. Acid responses of Listeria monocytogenes. Int. J. Food Microbiol. 55:121-126. [DOI] [PubMed] [Google Scholar]
- 19.Poolman, B., and E. Glaasker. 1998. Regulation of compatible solute accumulation in bacteria. Mol. Microbiol. 29:397-407. [DOI] [PubMed] [Google Scholar]
- 20.Reich, J., and E. E. Sel'kov. 1981. Energy metabolism of the cell: a theoretical treatise. Academic Press, San Diego, Calif.
- 21.Rius, N., M. Sole, A. Francia, and J. G. Loren. 1995. Buffering capacity and H+ membrane conductance of Gram-negative bacteria. FEMS Microbiol. Lett. 130:103-110. [DOI] [PubMed] [Google Scholar]
- 22.Shabala, L., S. Shabala, T. Ross, and T. McMeekin. 2001. Membrane transport activity and ultradian ion flux oscillations associated with cell cycle of Thraustochytrium sp. Aust. J. Plant Physiol. 28:87-99. [Google Scholar]
- 23.Shabala, L., T. Ross, I. Newman, T. McMeekin, and S. Shabala. 2001. Measurements of net fluxes and extracellular changes of H+, Ca2+, K+, and NH4+ in Escherichia coli using ion-selective microelectrodes. J. Microbiol. Methods 46:119-129. [DOI] [PubMed] [Google Scholar]
- 24.Shabala, L., B. Budde, T. Ross, H. Siegumfeldt, and T. McMeekin. 2002. Responses of Listeria monocytogenes to acid stress and glucose availability monitored by measurements of intracellular pH and viable counts. Int. J. Food Microbiol. 75:89-97. [DOI] [PubMed] [Google Scholar]
- 25.Shabala, S. N., I. A. Newman, and J. Morris. 1997. Oscillations in H+ and Ca2+ ion fluxes around the elongation of corn roots and effects of external pH. Plant Physiol. 113:111-118. [DOI] [PMC free article] [PubMed] [Google Scholar]
- 26.Siegumfeldt, H., K. B. Rechinger, and M. Jakobsen. 1999. Use of fluorescence ratio imaging for intracellular pH determination of individual bacterial cells in mixed cultures. Microbiology 145:1703-1709. [DOI] [PubMed] [Google Scholar]
- 27.Van de Vossenberg, J. L. C. M., A. J. M. Driessen, M. S. da Costa, and W. N. Konings. 1999. Homeostasis of the membrane proton permeability in Bacillus subtilis grown at different temperatures. Biochim. Biophys. Acta 1419:97-104. [DOI] [PubMed] [Google Scholar]
- 28.Wood, J. M. 1999. Osmosensing in bacteria: signals and membrane-based sensors. Microbiol. Mol. Biol. Rev. 63:230-262. [DOI] [PMC free article] [PubMed] [Google Scholar]
- 29.Young, K. M., and P. M. Foegeding. 1993. Acetic, lactic and citric acids and pH inhibition of Listeria monocytogenes Scott A and the effect on intracellular pH. J. Appl. Bacteriol. 74:515-520. [PubMed] [Google Scholar]
- 30.Zimmermann, S., T. Ehrhardt, G. Plesch, and B. Muller-Rober. 1999. Ion channels in plant signalling. Cell. Mol. Life Sci. 55:183-203. [DOI] [PMC free article] [PubMed] [Google Scholar]


