Abstract
Primer sets specific for 16S rRNA genes were designed for four phylogenetic groups of clostridia known to contain mesophilic cellulolytic species. Specific amplification of these groups from landfill leachate DNA extracts demonstrated the widespread occurrence of clostridia from the Clostridium thermocellum and C. leptum groups. In contrast, the C. botulinum group was never detected, and the C. coccoides-C. lentocellum group was only occasionally detected. Amplification products were analyzed by temporal thermal gel electrophoresis to generate profiles of the clostridial groups and to identify dominant bands. Sequence analysis of 17 landfill clones confirmed that the primers were specific for the clostridial subgroups and that the cloned sequences had a close relationship with known cellulose-degrading clostridia. The primers have therefore been authenticated for use in the rapid identification of clostridia in anaerobic environments.
Anaerobic degradation in landfills involves several coordinated groups of microorganisms and follows a process that is typical of waste degradation in anaerobic environments, such as soils, sediment, and sludge. As the primary stage of waste degradation, polysaccharide breakdown is an important limiting factor in anaerobic treatment of waste, which in municipal landfills primarily involves the decomposition of complexed polymers, including cellulose, hemicellulose, and lignin. Although cellulose is an important substrate in landfills, anaerobic degradation is poorly understood, and our knowledge is based on studies using culture-based methods (1). The enumeration of cellulolytic bacteria in landfills has often resulted in low cell counts (10), suggesting that culture-based methods may be underestimating bacterial numbers. The aim of the study reported here was to use information on 16S rRNA gene sequences to develop tools for the specific detection of cellulose-degrading bacteria in landfill sites.
It is likely that anaerobic cellulose degradation in landfills is due primarily to bacteria related to the genera Clostridium and Eubacterium. Although very few cellulolytic strains have been isolated from landfill sites, Westlake et al. (15) have identified isolates related to these two groups. The genus Clostridium and its relatives constitute an ancient group whose members exhibit a wide range of phenotypic characteristics. Phylogenetic analysis of 16S rRNA genes shows that the group is very diverse, with deeply branching clusters that include nonclostridial species. Comparison of 16S rRNA genes has allowed the division of the genus Clostridium into subgroups, and cellulose-degrading representatives from genera such as Clostridium, Eubacterium, and Ruminococcus can be found in a number of different clusters (3). However, mesophilic cellulose-degrading strains tend to be found in groups I, III, IV, and XIVab, with group III comprising only cellulose-degrading strains to date.
Consequently, we have exploited this clostridial 16S rRNA database to investigate the presence of clostridial subgroups I, III, IV, and XIVab in landfill sites. Although these subgroups do not comprise solely cellulose-degrading species, their detection could be used to indicate the distribution of saccharolytic and proteolytic degrading bacteria in landfill sites. Specific PCR amplification, temporal thermal gel electrophoresis (TTGE), and sequence analysis are used to detect and profile these key groups of clostridia. TTGE can separate DNA fragments of the same length but with different sequence compositions. When combined with specific or nonspecific gene amplification, this method can rapidly profile the genetic diversity of microbial populations.
Pooled leachate samples from sites designated R, C, H, W, B, P, and S were obtained from landfill sites in the northwest of England that contained primarily municipal solid waste and were provided by UK Waste Ltd., Terry Adams Ltd., and Cleanaway Ltd. Samples So and Br were obtained from test cell reactors containing municipal solid waste and were provided by J. Wayne, Centre for Applied Microbiology Research, Porton Down, United Kingdom, and the Energy Technology Support Unit. One-liter samples of leachate were concentrated by centrifugation at 27,000 × g for 40 min, and the solids were resuspended in 20 ml of 0.1 M K2HPO4 buffer. Aliquots derived from 75 ml of leachate were harvested by centrifugation at 16,000 × g for 5 min, and the pellets were stored at −70°C. A sample from sheep rumen, provided by D. Mercer, Rowett Research Institute, Aberdeen, United Kingdom, was used as a control known to contain a high concentration of cellulolytic bacteria. One-milliliter samples of rumen fluid were concentrated by centrifugation at 16,000 × g for 5 min, and the pellets were stored at −70°C. Reference strains and their sources are listed in Table 1.
TABLE 1.
Bacterial strains used to test the specificities of PCR amplification primers designed for clostridia
| Clustera | Species | Strain |
|---|---|---|
| III | Acetivibrio cellulolyticus | DSM 1870 |
| III | Bacteroides cellulosolvens | DSM 2933 |
| III | C. aldrichii | DSM 6159 |
| III | C. cellobioparum | NCIMB 10669 |
| III | C. cellulolyticum | DSM 5812 |
| III | C. papyrosolvens | NCIMB 11394 |
| III | C. stercorarium | NCMIB 11754 |
| III | C. termitidis | DSM 5398 |
| III | C. thermocellum | NCIMB 10682 |
| III | C. thermolacticum | DSM 2910 |
| I | C. sporogenes | LIV 91 |
| XIVab | C. celecrescens | NCIMB 12829 |
| IV | C. sporosphaeroides | NCIMB 10672 |
| I | C. pasteurianum | NCIMB 9486 |
| IX | Selenomonas ruminantium subsp. ruminantium | DSM 8903 |
| Corynebacterium xerosis | LIV 43 | |
| Bacillus stereothermophilus | LIV 57 | |
| Burkholderia cepacia | NCIMB 9085 | |
| Alcaligenes faecalis | LIV 206 |
Clusters as defined by Collins et al. (3).
DNA was extracted from pure cultures with a Hybaid Ribolyser. A 2-ml tube containing 0.5 g of glass beads (0.17- to 0.18-mm diameter), 0.5 ml of 0.12 M K2HPO4 (pH 8.0), 0.5 ml of saturated phenol (pH 8.0), and 0.5 ml of cell suspension was processed at 6 m/s for 30 s, placed on ice for 5 min, and centrifuged at 16,000 × g for 5 min. Supernatant was extracted with phenol-chloroform-isoamyl alcohol (25:24:1) and chloroform-isoamyl alcohol (49:1), and the DNA was precipitated with ethanol and then resuspended in water. Cell lysis and DNA purification from landfill leachate and rumen samples were performed with the Bio 101 FastDNA SPIN kit for soil (Anachem). Cell pellets were resuspended in 0.2 ml of 0.1 M K2HPO4 buffer and lysed with a Hybaid Ribolyser. The DNA was recovered and purified according to the Bio 101 protocol and purified further using the Wizard DNA Clean-up system (Promega).
16S rRNA gene sequences were obtained from the Ribosomal Database Project (RDP) (9) and GenBank (2) databases. The sequences were aligned using the Genetics Computer Group Wisconsin package version 8.1 and the Genetic Data Environment. Primer sequences were located visually, and the suite was completed using published oligonucleotides (Table 2). Primers were tested for specificity using the RDP CHECK_PROBE and FASTA (11) search programs. The appropriate annealing temperatures (Table 2) and primer specificities were determined using pure-culture control strains (Table 1).
TABLE 2.
Primer sequences and targets used to amplify 16S ribosomal DNA of Clostridium groups and for TTGE analysis
| Specificitya | Name | Sequence (5′-3′)b | Product size (kb) | Annealing temp (°C) | Reference |
|---|---|---|---|---|---|
| Clostridium cluster I | S-∗-Chis-0150-a-S-23 | AAAGGRAGATTAATACCGCATAA | 0.82 | 65 | 4 |
| S-∗-Cbot-0983-a-A-21 | CARGRGATGTCAAGYCYAGGT | This study | |||
| Clostridium cluster III | S-∗-Cther-0650-a-S-23 | TCTTGAGTGYYGGAGAGGAAAGC | 0.72 | 60 | This study |
| S-∗-Cther-1352-a-A-19 | GRCAGTATDCTGACCTRCC | This study | |||
| Clostridium cluster IV | S-∗-Clos-0561-a-S-17 | TTACTGGGTGTAAAGGG | 0.58 | 60 | This study |
| S-∗-Clept-1129-a-A-17 | TAGAGTGCTCTTGCGTA | This study | |||
| Clostridium cluster XIVab | S-∗-Erec-0482-a-S-19 | CGGTACYTGACTAAGAAGC | 0.62 | 55 | 4 |
| S-∗-Ccoc-1112-a-A-19 | TGGCTACTRDRVAYARGGG | This study | |||
| Bacteria (TTGE-1) | S-D-Bact-0907-a-S-20 | AAACTCAAAGGAATTGACGG | 0.31 | 60 | 7 |
| S-D-Grps-1097-a-A-20 | (GC-clamp)c-ACATAAGGGGCATGATGATT | 5 | |||
| Bacteria (TTGE-2) | S-D-Bact-0786-a-S-20 | (GC-clamp)-GATTAGATACCCTGGTAGTC | 0.30 | 62 | 16 |
| S-D-Bact-1060-a-A-21 | TCACGACACGAGCTGACGACA | 16 |
Clusters as defined by Collins et al. (3).
Y, T/C; V, G/C/A; R, A/G.
GC-clamp, CGCCCGCCGCGCCCCGCGCCCGGCCCGCCGCCCCCGCCCC.
PCR amplification of DNA with Clostridium group primers was performed as follows with (per 50-μl reaction volume) 50 ng of genomic DNA, 10 pmol of each primer, 2 U of SuperTaq (HT Biotechnologies), 10 mM Tris-HCl (pH 9.0), 1.5 mM Mg2+, 50 mM KCl, 0.01% (wt/vol) gelatin, 0.1% Triton X-100, and 200 μM deoxynucleoside triphosphate. Reaction mixtures were covered with mineral oil, denatured for 5 min at 94°C before addition of the polymerase, and cycled at 94°C for 1 min, at the appropriate annealing temperature (Table 2) for 1 min, and at 72°C for 1 min. This cycle was repeated 40 times for the amplification of clostridial DNA from landfill leachate and rumen and 30 times for the amplification of DNA from pure cultures, followed by a final incubation at 72°C for 5 min. Products were visualized by agarose gel electrophoresis and ethidium bromide staining. Products from amplification of landfill DNA with group-specific primers were purified using the Qiagen PCR Preps Purification kit, cloned into the pGEM-T vector (Promega), and transformed into E. coli JM109 competent cells (Promega).
TTGE analysis was performed to profile amplified DNA from each Clostridium group and to compare banding patterns with clones derived from the amplification products. A nested PCR protocol was used, in which amplification products from Clostridium group-specific primers were reamplified using the TTGE primer sets (Table 2). The amplification reaction mixtures were as described above, with 2 ng of group-specific PCR product as a template and 25 amplification cycles at the annealing temperatures listed in Table 2.
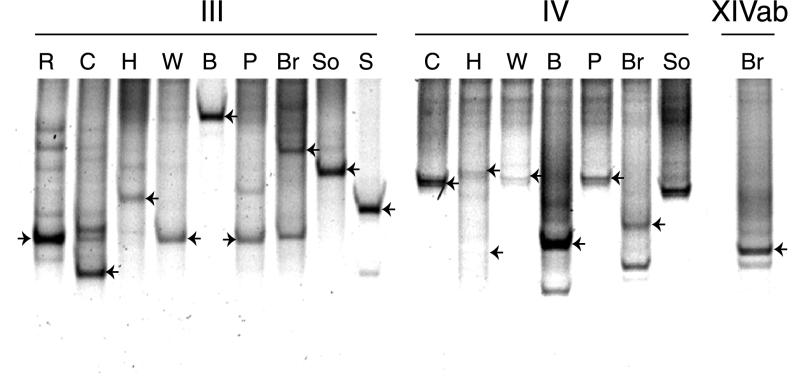
Products from amplification with the TTGE-1 and TTGE-2 primers were separated using the Bio-Rad TTGE system. The gels comprised 6% acrylamide (37:1 acrylamide- bisacrylamide), 7 M urea, 20% formamide, 2% glycerol, and 1.25× TAE buffer (50 mM Tris, 25 mM acetic acid, 1.25 mM Na2EDTA [pH 8]) (TAE buffer). Approximately 20 to 30 ng of pure-culture or clone product and 200 ng of landfill leachate product were run at 75 V from 43 to 51°C (0.5°C h−1) for 16 h. The gels were stained using SYBR Green I nucleic acid gel stain (Flowgen) that was diluted 1:50,000 (vol/vol) in 1.25× TAE buffer (pH 8) and were visualized using a Storm 860 optical scanner and ImageQuant software (Molecular Dynamics). DNA preparations from pure cultures were used to optimize the conditions for band separation. TTGE profiles from each landfill site were repeated at least twice, and the banding patterns were shown to be reproducible. Representative TTGE profiles for each Clostridium group are shown in Fig. 1.
FIG. 1.
TTGE profiles of 16S rRNA genes of Clostridium clusters III, IV, and XIVab. Amplification products using group-specific primers were reamplified using primer TTGE-1 (cluster III) or TTGE-2 (clusters IV and XIVab) and were separated by TTGE analysis. The profiles comprise amplification products from landfill sites R, C, H, W, B, P, Br, S, and So. Cloned sequences that matched bands marked with arrows on the TTGE gel were sequenced and used for phylogenetic analysis.
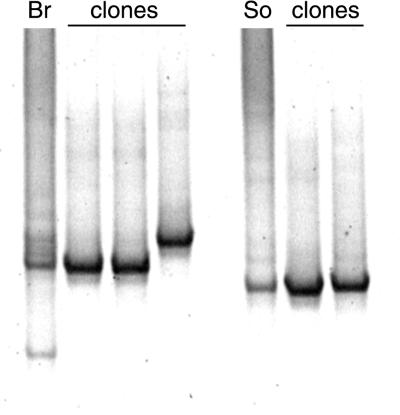
As exemplified in Fig. 2, clones that gave bands of the same mobility as the most intense bands in landfill leachate (Fig. 1) were selected for sequencing. The entire cloned insert, obtained using group-specific primers, was sequenced. Plasmids containing cloned inserts were purified using the Qiagen plasmid miniprep kit. Sequence analysis was performed using the ABI 373 (Perkin-Elmer) and Li-Cor 4200 (MWG-Biotechnology) sequencing systems. Further 16S rRNA gene sequence data were obtained from the RDP. Sequence alignments were manipulated using the Wisconsin package version 8.1 and the Genetic Data Environment. Phylogenetic analysis was performed with TREECON for Windows version 1.3b (14) using the Jukes-Cantor (6) and neighbor-joining (13) distance calculations, with bootstrap analysis performed on 100 replicates.
FIG. 2.
TTGE profiles of 16S rRNA genes of Clostridium cluster III amplified from Br and So landfill leachate DNAs. The lanes labeled “clones” contain amplification products of DNAs cloned from sites Br and So.
No amplification products were obtained from any landfill leachate or rumen fluid samples with primers specific for the Clostridium botulinum group (cluster I), indicating that this group of bacteria is either not present or present in low numbers. Similarly, Franks et al. (4) could detect only low numbers of cells that hybridized to the cluster I probe in human fecal samples.
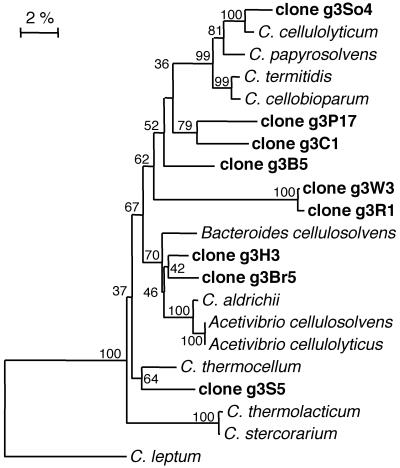
Both forward and reverse primers for the C. thermocellum group (cluster III) were designed in this study. Cluster III primers amplified DNA from landfill leachate from each site tested and from rumen fluid, resulting in gene products of the expected size. The C. thermocellum group is of particular interest in the context of this work, as to date it contains sequences only from cellulose-degrading strains isolated from environmental sources (8). TTGE analysis of Clostridium cluster III 16S rRNA genes showed that there were one or two dominant species present in each landfill site (Fig. 1). Phylogenetic analysis showed that the dominant sequences amplified from landfill sites grouped within sequences from pure-culture representatives (Fig. 3). Only one clone from site S (g3S5) was closely related to the thermophile C. thermocellum. Cloned sequences from sites H (g3H3) and Br (g3Br5) were similar to C. aldrichii and its relatives, and the remaining five clones from sites P, C, B, W, and R (g3P17, g3C1, g3B5, g3W3, and g3R1) were most closely related to the group containing C. papyrosolvens.
FIG. 3.
Phylogenetic tree showing relationships of 16S rRNA genes from Clostridium cluster III. Sequences recovered from landfill sites are in boldface. The tree was constructed using the Jukes-Cantor distance matrix and the neighbor-joining method. The scale bar represents a 2% difference in nucleotide sequence positions.
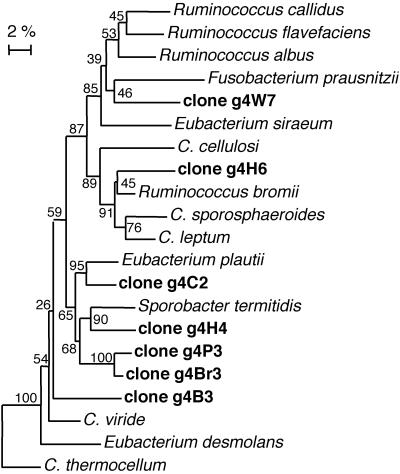
The C. leptum group (cluster IV) is closely related to cluster III (3) and contains representatives of a mixture of genera, including Clostridium, Eubacterium, and Ruminococcus. A number of species are mesophilic and cellulolytic, including Ruminococcus albus, Ruminococcus flavefaciens, and C. cellulosi. Noncellulolytic strains are also present, although many of these will degrade other polysaccharides (12). Using primers specific for the C. leptum group, amplification products were obtained from the rumen fluid sample and from all landfill sites except R and S. TTGE profiles showed that the landfill sites contained one or two strong bands with a number of less intensely stained bands (Fig. 1). Cloned sequences from landfill sites grouped among sequences from pure-culture representatives of this phylum (Fig. 4), confirming the specificity of the primer set. Clones from sites C, H, P, and Br (g4C2, g4H4, g4P3, and g4Br3) were all closely related to Eubacterium plautii and Sporobacter termitidis, clone g4H6 was closely related to Ruminococcus bromii, clone g4W7 was closely related to Fusobacterium prausnitzii, and g4B3 was not closely related to any of the Clostridium cluster IV pure-culture sequences. Clones from site So were not analyzed.
FIG. 4.
Phylogenetic tree showing relationships of 16S rRNA genes from Clostridium cluster IV. Sequences recovered from landfill sites are in boldface. The tree was constructed as described in the legend to Fig. 3.
Clostridium cluster XIVab is a large and diverse group, with isolates having both high and low G+C contents. Cluster XIVab contains both cellulolytic and noncellulolytic members from both human and animal gut, rumen, and environmental sources. In a study of human feces, bacteria that hybridized to the cluster XIVab probe Erec482 constituted 29% of the total (4). We could amplify cluster XIVab genes from sheep rumen fluid but could detect this group in only one landfill site sample (site Br). The clone from landfill site Br (g14Br5) was found to group within XIVa and was most closely related to C. aminovalericum (not shown).
The results of this study show that among the clostridial and eubacterial groups tested, the predominant and most ubiquitous groups in landfill are C. thermocellum (cluster III) and C. leptum (cluster IV). These two groups are closely related, suggesting that they may have derived from a precursor organism that was adapted to the conditions found in many anaerobic environments. For example, the low nitrogen availability in environments such as soils and landfills may select for bacteria with nitrogenase activity, which is present in the cluster III cellulose-degrading strains C. papyrosolvens and C. cellobioparum (8). The C. thermocellum group contains 16S rRNA sequences from only cellulolytic bacteria, which suggests that this phenotype is typical of the group. It is tempting to speculate that sequences obtained using cluster III-specific primers will also have a cellulolytic phenotype. However, to determine if the 16S rRNA sequences obtained using group-specific primers are saccharolytic, they will need to be compared with sequences from metabolically characterized pure-culture isolates.
Molecular detection of clostridial populations has been described for the human intestinal tract (4), but never in a landfill environment. Improved understanding of the microbial populations of landfill sites, and especially the groups involved in initial hydrolysis of waste material, can lead to an overall scheme to monitor bacterial populations involved in anaerobic degradation in situ. Changes in group-specific amplification and TTGE banding patterns can be used to monitor changing conditions at the landfill sites, especially if these techniques target RNA to give some measure of activity. The techniques will also have application to other areas of anaerobic ecology, such as soils, sediments, anaerobic digestors, and the gastrointestinal tract. The application of molecular biological techniques will therefore contribute to our understanding of the ecology of an important bacterial group that has been difficult to isolate and monitor.
Nucleotide sequence accession numbers.
The GenBank accession numbers for the nucleotide sequences are AF401533 to AF401549.
Acknowledgments
This research was funded by the EPSRC/NERC (United Kingdom) Waste and Pollution Management Programme.
We are grateful to Paul Loughnane for technical assistance.
REFERENCES
- 1.Barlaz, M. A., D. M. Schaefer, and R. K. Ham. 1989. Bacterial population development and chemical characteristics of refuse decomposition in a simulated sanitary landfill. Appl. Environ. Microbiol. 55:55-65. [DOI] [PMC free article] [PubMed] [Google Scholar]
- 2.Benson, D. A., I. Karsch-Mizrachi, D. J. Lipman, J. Ostell, B. A. Rapp, and D. L. Wheeler. 2000. GenBank. Nucleic Acids Res. 28:15-18. [DOI] [PMC free article] [PubMed] [Google Scholar]
- 3.Collins, M. D., P. A. Lawson, A. Willems, J. J. Cordoba, J. Fernandez-Garayzabal, P. Garcia, J. Cai, H. Hippe, and J. A. E. Farrow. 1994. The phylogeny of the genus Clostridium: proposal of five new genera and eleven new species combinations. Int. J. Syst. Bacteriol. 44:812-826. [DOI] [PubMed] [Google Scholar]
- 4.Franks, A. H., H. J. M. Harmsen, G. C. Raangs, G. J. Jansen, F. Schut, and G. W. Welling. 1998. Variations of bacterial populations in human feces measured by fluorescent in situ hybridization with group-specific 16S rRNA-targeted oligonucleotide probes. Appl. Environ. Microbiol. 64:3336-3345. [DOI] [PMC free article] [PubMed] [Google Scholar]
- 5.Fry, N. K., J. K. Fredrickson, S. Fishbain, M. Wagner, and D. A. Stahl. 1997. Population structure of microbial communities associated with two deep, anaerobic, alkaline aquifers. Appl. Environ. Microbiol. 63:1498-1504. [DOI] [PMC free article] [PubMed] [Google Scholar]
- 6.Jukes, T. H., and C. R. Cantor. 1969. Evolution of protein molecules, p. 21-132. In H. N. Munro (ed.), Mammalian protein metabolism. Academic Press, New York, N.Y.
- 7.Lane, D. J., B. Pace, G. J. Olsen, D. A. Stahl, M. L. Sogin, and N. R. Pace. 1985. Rapid determination of 16S ribosomal RNA sequences for phylogenetic analyses. Proc. Natl. Acad. Sci. USA 82:6955-6959. [DOI] [PMC free article] [PubMed] [Google Scholar]
- 8.Leschine, S. B. 1995. Cellulose degradation in anaerobic environments. Annu. Rev. Microbiol. 49:399-426. [DOI] [PubMed] [Google Scholar]
- 9.Maidak, B. L., J. R. Cole, C. T. Parker, G. M. Garrity, N. Larsen, B. Li, T. G. Lilburn, M. J. McCaughey, G. J. Olsen, R. Overbeek, S. Pramanik, T. M. Schmidt, J. M. Tiedje, and C. R. Woese. 1999. A new version of the RDP (Ribosomal Database Project). Nucleic Acids Res. 27:171-173. [DOI] [PMC free article] [PubMed] [Google Scholar]
- 10.Palmisano, A. C., D. A. Maruscik, and B. S. Schwab. 1993. Enumeration of fermentative and hydrolytic micro-organisms from three sanitary landfills. J. Gen. Microbiol. 139:387-391. [Google Scholar]
- 11.Pearson, W. R. 1990. Rapid and sensitive sequence comparison with FAST and FASTA. Methods Enzymol. 183:63-98. [DOI] [PubMed] [Google Scholar]
- 12.Rainey, F. A., and P. H. Janssen. 1995. Phylogenetic analysis by 16S ribosomal DNA sequence comparison reveals two unrelated groups of species within the genus Ruminococcus. FEMS Microbiol. Lett. 129:69-74. [DOI] [PubMed] [Google Scholar]
- 13.Saitou, N., and M. Nei. 1987. The neighbor-joining method: a new method for constructing phylogenetic trees. Mol. Biol. Evol. 4:406-425. [DOI] [PubMed] [Google Scholar]
- 14.Van de Peer, Y., and R. De Wachter. 1994. TREECON for Windows: a software package for the construction and drawing of evolutionary trees for the Microsoft Windows environment. Comput. Appl. Biosci. 10:569-570. [DOI] [PubMed] [Google Scholar]
- 15.Westlake, K., D. B. Archer, and D. R. Boone. 1995. Diversity of cellulolytic bacteria in landfill. J. Appl. Bacteriol. 79:73-78. [Google Scholar]
- 16.Woese, C. R. 1987. Bacterial evolution. Microbiol. Rev. 51:221-271. [DOI] [PMC free article] [PubMed] [Google Scholar]


