Abstract
The viability of the polychlorinated biphenyl-degrading bacterium Comamonas testosteroni TK102 was assessed by flow cytometry (FCM) with the fluorogenic ester Calcein-AM (CAM) and the nucleic acid dye propidium iodide (PI). CAM stained live cells, whereas PI stained dead cells. When double staining with CAM and PI was performed, three physiological states, i.e., live (calcein positive, PI negative), dead (calcein negative, PI positive), and permeabilized (calcein positive, PI positive), were detected. To evaluate the reliability of this double-staining method, suspensions of live and dead cells were mixed in various proportions and analyzed by FCM. The proportion of dead cells measured by FCM directly correlated with the proportion of dead cells in the sample (y = 0.9872 x + 0.18; R2 = 0.9971). In addition, the proportion of live cells measured by FCM inversely correlated with the proportion of dead cells in the sample (y = −0.9776 x + 98.36; R2 = 0.9962). The proportion of permeabilized cells was consistently less than 2%. These results indicate that FCM in combination with CAM and PI staining is rapid (≤1 h) and distinguishes correctly among live, dead, and permeabilized cells.
Polychlorinated biphenyls (PCBs) are widespread environmental pollutants, and the aerobic microbial transformation of these compounds has been well studied (1, 3, 10). We have used Comamonas testosteroni (formerly Pseudomonas alcaligenes) strain TK102, a PCB degrader that has the ability to degrade high concentrations of a commercial PCB mixture, Kaneclor 300, for the mineralization of PCBs in batch reactors (29). TK102 efficiently degrades Kaneclor 300 during the initial 24 h, after which the PCB degradation efficiency of the cells decreases (30). Because the overall efficiency of PCB degradation depends on the contribution of individual cells, it is necessary to monitor the physiological status of individual bacterial cells during the degradation of PCBs. Traditional plate count methods typically used to assess bacterial viability are time-consuming (2, 11); therefore, there is a need for a more rapid method for monitoring bacterial viability.
Flow cytometry (FCM) makes it possible to perform a rapid assessment of individual cell viability when used in combination with fluorescent dyes, for example, dyes based on enzyme activity, membrane integrity, and membrane potential (7, 15, 22, 28, 31). Fluorogenic esters such as fluorescein diacetate and carboxyfluorescein diacetate are cleaved by nonspecific esterases to green fluorescent products that are polar and retained by cells with intact membranes (8, 9). Compared with other fluorescent products, calcein, which is the hydrolysis product of Calcein-AM (CAM), has greater fluorescence intensity and superior cell retention and exhibits pH-insensitive fluorescence (Handbook of Fluorescent Probes and Research Chemicals, 6th ed. Molecular Probes, Inc., Eugene, Oreg., 1996). The ability of CAM to detect viable eukaryotes has been reported (17). In contrast, the ability of CAM to detect viable prokaryotes has been reported to be limited (9, 17, 28). Non-membrane-permeating nucleic acid dyes such as propidium iodide (PI) and ethidium bromide (EB) have been used to evaluate membrane integrity (15, 19, 32). These dyes are excluded by intact cells but can enter cells through damaged membranes. Once inside cells, the dyes intercalate into double-stranded nucleic acids and result in enhanced red fluorescence. It has been reported that PI is more suitable than EB for evaluating membrane integrity, because EB slowly penetrates the membranes of intact cells (26, 27). Double-staining methods, which are used to obtain additional information on heterogeneity in cell populations, assess cell viability by staining live cells with one dye and dead cells with another dye of a different color (6, 21, 22, 24). Although double staining with CAM and PI has been used to assess the viability of eukaryotes by fluorescence microscopy, its application to prokaryotes has been limited (17). Also, double staining with CAM and PI has not been used to assess bacterial viability by FCM. The aim of this study was to evaluate the effectiveness of double staining with CAM and PI for assessing the viability of C. testosteroni TK102 by FCM.
Bacterial strain and culture conditions.
The gram-negative bacterium C. testosteroni strain TK102, which was isolated from soil contaminated with PCBs, was grown and maintained at 30°C in phosphate-buffered minimal salt medium (18) with biphenyl as the sole carbon source. Preincubation was carried out with a 500-ml Erlenmeyer flask containing 100 ml of minimal salt medium supplemented with 500 mg of biphenyl/liter, and incubation was carried out at 30°C for 48 h with shaking at 80 rpm. One milliliter of the preculture was used to inoculate a 500-ml flask containing 100 ml of one-third-diluted Luria-Bertani medium, and incubation was carried out at 30°C with shaking at 80 rpm.
Staining protocols and FCM.
One milliliter of the exponential-phase culture was harvested by centrifugation (2,500 × g for 5 min at 4°C); washed once in phosphate-buffered saline (PBS [pH 7.2]), Tris-EDTA (100 mM Tris-HCl, 1 mM EDTA [pH 8.0]) buffer, or 10 mM HEPES (pH 7.0) buffer; and resuspended in 1 ml of PBS. Dead cells were prepared by ethanol fixation. One milliliter of the culture was washed once in PBS, fixed in 70% ethanol, and stored at 4°C until use. No growth of TK102 was observed on one-third-diluted Luria-Bertani agar plates following ethanol fixation. Before staining, the ethanol-fixed cells were washed and resuspended in 1 ml of PBS. The cell suspensions were diluted in PBS to a concentration of 106 cells per ml. CAM (Dojindo, Kumamoto, Japan) was added to a final concentration of 5 μg/ml from a 1-mg/ml stock solution in dimethyl sulfoxide, and the mixture was incubated for 30 min at 30°C. PI (Sigma Chemical Co., St. Louis, Mo.) was added to a final concentration of 5 μg/ml from a 1-mg/ml stock solution in ethanol, and the mixture was incubated for 5 min at room temperature in the dark. When double staining with CAM and PI was performed, the same dye concentrations and incubation times were used. HEPES-washed (live) cells and ethanol-fixed (dead) cells were mixed in various proportions; the proportion of dead bacteria varied in 25% increments from 0 to 100% (vol/vol). Samples were stained by the double-staining method with CAM and PI as described above. Samples were analyzed by FCM.
FCM was carried out with a FACSCalibur instrument (Becton Dickinson, San Jose, Calif.) equipped with an argon ion laser providing 15 mW at 488 nm and with the standard filter setup. All parameters were collected as logarithmic signals. Fluorescence emission was detected at the FL1 channel (530 ± 15 nm) for CAM and at the FL2 channel (585 ± 21 nm) for PI. The sheath fluid was FACSFlow (Becton Dickinson). The sample flow rate was set to low (12 μl/min), and at least 5,000 cells were acquired for analysis. Triplicate counts were made for each procedure. The performance of the instrument was monitored daily by using CaliBRITE Beads (Becton Dickinson).
Measurement of OM Permeability.
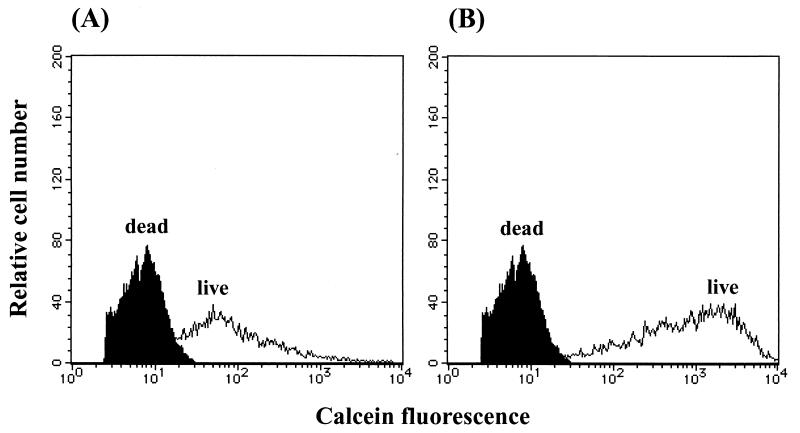
Gram-negative bacteria are generally impermeable to fluorescent vital dyes owing to the effective permeability barrier function of their outer membrane (OM) (23). It was difficult to distinguish clearly between live and dead cells of C. testosteroni TK102 with CAM after the cells were washed in PBS (Fig. 1A). EDTA has been successfully used to increase the penetration of fluorescent vital dyes through the OM of gram-negative bacteria (9, 15, 23). Although EDTA produced well-stained cells, it was found to be toxic to TK102 (data not shown). Therefore, EDTA was avoided and cells were washed in HEPES buffer, which proved to be nontoxic (data not shown) and provided clear discrimination between live and dead cells (Fig. 1B).
FIG. 1.
Histograms of live (open histogram) and ethanol-fixed (closed histogram) cells of C. testosteroni TK102 after CAM staining. Exponential-phase cells were washed in PBS (A) or HEPES buffer (B) before CAM staining.
To evaluate OM permeability, the hydrophobic fluorescent probe 1-N-phenylnaphthylamine (NPN) (Wako Pure Chemical Industries, Osaka, Japan) was used. NPN uptake was measured with fluorescence spectrophotometry by a modification of the method of Hancock and Wong (12). Samples (1 ml) of exponential-phase cells were harvested by centrifugation (2,500 × g for 5 min); washed once in PBS (pH 7.2), Tris-EDTA (pH 8.0) buffer, or HEPES (pH 7.0) buffer; and resuspended in PBS to give an optical density at 600 nm of 0.1. NPN was dissolved in acetone at a concentration of 500 μM and used at a final concentration of 10 μM. Fluorescence was measured 2 min after the addition of 10 μM NPN. Excitation and emission wavelengths for NPN were set at 350 and 420 nm, respectively. Fluorescence spectra and data were obtained with a Hitachi (Tokyo, Japan) F-3010 fluorescence spectrophotometer. NPN uptake was measured as the total increase in fluorescence. NPN fluoresces weakly in aqueous environments but strongly in hydrophobic environments (13, 16, 20). When OM permeability is increased, NPN can enter the phospholipid layer, resulting in prominent fluorescence. The NPN uptake value after the samples were washed in HEPES was twice that after the samples were washed in PBS and slightly higher than that after EDTA treatment (Table 1). The results indicate that HEPES enhanced the OM permeability of TK102 cells and may be used as an OM-permeabilizing agent for gram-negative bacterial cells.
TABLE 1.
NPN uptake of C. testosteroni TK102 after cells were washed with several buffersa
| Buffer | Mean ± SD NPN fluorescence | NPN uptake factor |
|---|---|---|
| Control (NPN only) | 0 | |
| PBS | 143 ± 10 | 1 |
| Tris-EDTA | 261 ± 16 | 1.8 |
| HEPES | 300 ± 19 | 2.1 |
Fluorescence was measured 2 min after the addition of 10 μM NPN to cells resuspended in PBS (pH 7.2). Fluorescence results are expressed in arbitrary units. Background fluorescence in the presence of NPN only (56 arbitrary units) was subtracted. The NPN uptake factor represents the ratio of each fluorescence value to the value obtained with PBS.
Assessment of cell viability by FCM.
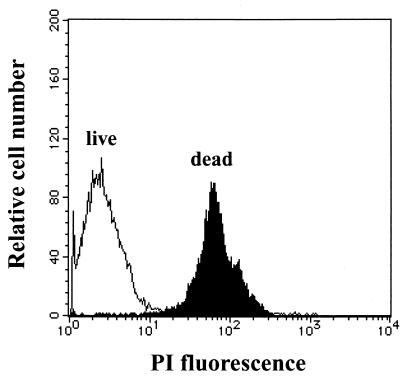
Figure 1B shows overlays of fluorescence histograms of live and ethanol-fixed (dead) cells after staining with CAM. The calcein fluorescence intensity of live cells was greater than that of dead cells. Figure 2 shows overlays of fluorescence histograms of live and dead cells after staining with PI. The PI fluorescence intensity of dead cells was greater than that of live cells. These results indicate that CAM stained live cells, whereas PI stained dead cells.
FIG. 2.
Histograms of ethanol-fixed (closed histogram) and live (open histogram) cells of C. testosteroni TK102 after PI staining.
The ability of CAM to detect live bacterial cells has been reported to be limited (9, 17, 28). Longer incubation times (60 min) and higher concentrations of the dye than those required to stain eukaryotes were required to stain prokaryotes. In this study, however, 5 μg of CAM/ml could stain 95% of TK102 cells after 30 min of incubation (Fig. 1B). To confirm the generality of our CAM staining method, it was applied to other gram-negative bacteria, i.e., Pseudomonas putida PpY101, Pseudomonas aeruginosa PAO1, and Escherichia coli MV1184. About 83% of P. putida PpY101 cells and 80% of P. aeruginosa PAO1 cells were stained with CAM (data not shown). However, only 35% of E. coli MV1184 cells were stained with CAM (data not shown). These results suggest that CAM can be used as an indicator to detect live bacteria, although CAM cannot be used to detect live cells of all gram-negative bacteria. The choice of the dye used would depend on the bacterial strain under study because variations in the ability of other fluorescent vital dyes (e.g., rhodamine 123) to detect live bacteria have also been reported (14, 15).
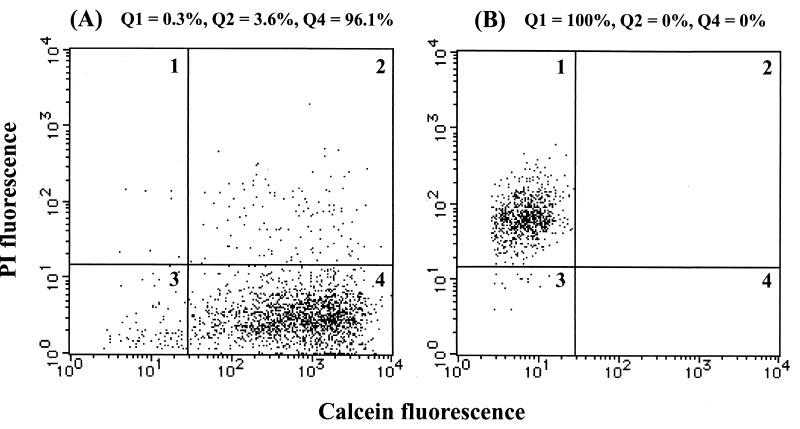
When double staining with CAM and PI was performed, three physiological states were detected (Fig. 3). Live cells were detected in quadrant 4 (Q4) (calcein positive, PI negative), whereas dead cells were detected in Q1 (calcein negative, PI positive). The cells in Q2 (calcein positive, PI positive) represented cells with permeabilized cytoplasmic membranes, i.e., permeabilized cells, because PI is excluded by cells with intact cytoplasmic membranes but enters cells through damaged and permeabilized cytoplasmic membranes (26, 27). It was reported that PI-stained cells were not viable after a single cell sorting (25), indicating that PI-stained cells were dead. It was also reported that green fluorescence was retained in dead cells when fluorogenic esters were used to assess cell viability; this effect was postulated to be due to the presence of residual esterase activity (4, 5). These results suggest that the permeabilized cells in Q2 may have been dead cells with residual esterase activity which resulted in calcein fluorescence. The percentage of each population was determined as [i/(Q1 + Q2 + Q4)] × 100, where i is Q1, Q2, or Q4. Nonfluorescent debris in Q3 (calcein negative, PI negative) was excluded (Fig. 3).
FIG. 3.
Dual-parameter histograms of exponential-phase (A) and ethanol-fixed (B) cells stained with CAM and PI. About 96% of exponential-phase cells were in Q4 (live cells) (A), and 100% of ethanol-fixed cells were in Q1 (dead cells) (B). Signals in Q2 were stained with both CAM and PI (permeabilized cells). Nonfluorescent debris (signals in Q3) was excluded.
To evaluate the reliability of this quadrant assessment, suspensions of live and ethanol-fixed cells (dead cells) were mixed in various proportions, stained with CAM and PI, and analyzed by FCM (Table 2). The proportion of dead cells measured by FCM directly correlated with the proportion of dead cells in the sample (y = 0.9872 x + 0.18; R2 = 0.9971). In addition, the proportion of live cells measured by FCM inversely correlated with the proportion of dead cells in the sample (y = −0.9776 x + 98.36; R2 = 0.9962). The proportion of permeabilized cells was consistently less than 2%. These results indicate that the double-staining method with CAM and PI can distinguish clearly and correctly among live, dead, and permeabilized cells.
TABLE 2.
FCM measurement of the percentages of live, dead, and permeabilized cells of C. testosteroni TK102 in suspensions containing live and ethanol-fixed cells in various proportions in triplicate experiments
| Ethanol-fixed cells added (%) | % Cells (mean ± SD)
|
||
|---|---|---|---|
| Live | Dead | Permeabilized | |
| 0 | 96.7 ± 1.5 | 1.4 ± 1.1 | 1.9 ± 1.8 |
| 25 | 72.8 ± 2.9 | 25.3 ± 3.4 | 1.9 ± 1.2 |
| 50 | 52.4 ± 3.7 | 45.8 ± 4.2 | 1.8 ± 0.5 |
| 75 | 23.4 ± 0.1 | 75.1 ± 0.4 | 1.5 ± 0.3 |
| 100 | 0 ± 0 | 100 ± 0 | 0 ± 0 |
Microscopic observations.
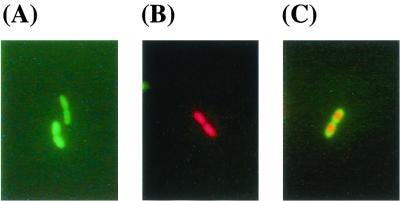
A mixed-cell suspension (live and ethanol-fixed cells in a ratio of 1:1) was stained with CAM and PI and observed by fluorescence microscopy to confirm the three physiological states. Aliquots (5 μl) of stained bacterial suspensions were placed on glass slides under coverslips and observed with a Nikon (Tokyo, Japan) Optiphot-2 inverted epifluorescence microscope fitted with a 100-W mercury arc lamp, a Nikon dual (F-T) filter (fluorescein isothiocyanate [FITC] filter, excitation at 480 to 510 nm [for CAM and PI] and emission at 515 to 555 nm [for CAM]; Texas red filter, excitation at 560 to 580 nm and emission at 600 to 700 nm [for PI]), and a ×100 oil immersion objective lens. Photographs were obtained with a Nikon Coolpix950 digital camera. The digital image was further processed by using Photoshop 5.5 (Adobe). The proportions of live, dead, and permeabilized cells determined by fluorescence microscopy were similar to those determined by FCM (data not shown). Live cells fluoresced green (Fig. 4A), whereas dead cells fluoresced red (Fig. 4B). The centers of permeabilized cells fluoresced red, whereas the outer edges of the cells fluoresced green (Fig. 4C). When permeabilized cells were observed by fluorescence microscopy, however, the green fluorescence was quenched in a few seconds because calcein is sensitive to light (Handbook of Fluorescent Probes and Research Chemicals, 6th ed. Molecular Probes, 1996), and the cells turned red. Because FCM detects cells in a fast-flowing fluid stream that passes through a focused light beam at rates of 100 to 1,000 cells per second (7), FCM is more suitable than fluorescence microscopy for accurately detecting rare and unstable populations, such as the permeabilized cells in this study.
FIG. 4.
Fluorescence micrographs of C. testosteroni TK102 after staining with CAM and PI. Live (A), dead (B), and permeabilized cells (C) fluoresced green, red, and both green and red, respectively.
In summary, FCM in combination with CAM and PI staining allowed rapid and accurate identification of three physiological states (i.e., live, dead, and permeabilized cells). To our knowledge, this is the first assessment of bacterial viability by FCM with CAM and PI. This technique has significant potential in the rapid assessment of cell viability in widespread areas of microbiology, including environmental microbiology, food technology, and the pharmaceutical and medical industries.
Acknowledgments
We thank Y. Ohtsuka and Y. Katayama (Tokyo University of Agriculture and Technology, Tokyo, Japan) for the use of their fluorescence spectrophotometer. We are very grateful to G. Mukerjee-Dhar (Railway Technical Research Institute) for valuable discussions and critical review of the manuscript.
REFERENCES
- 1.Ahmed, M., and D. D. Focht. 1973. Degradation of polychlorinated biphenyls by two species of Achromobacter. Can. J. Microbiol. 19:47-52. [DOI] [PubMed] [Google Scholar]
- 2.Auty, M. A. E., G. E. Gardiner, S. J. McBrearty, E. O. O'Sullivan, D. M. Mulvihill, J. K. Collins, G. F. Fitzgerald, C. Stanton, and R. P. Ross. 2001. Direct in situ viability assessment of bacteria in probiotic dairy products using viability staining in conjunction with confocal sanning laser microscopy. Appl. Environ. Microbiol. 67:420-425. [DOI] [PMC free article] [PubMed] [Google Scholar]
- 3.Bedard, D. L., M. L. Haberl, R. J. May, and M. J. Brennan. 1987. Evidence for novel mechanisms of polychlorinated biphenyl metabolism in Alcaligenes eutrophus H850. Appl. Environ. Microbiol. 53:1103-1112. [DOI] [PMC free article] [PubMed] [Google Scholar]
- 4.Breeuwer, P., J. L. Drocourt, F. M. Rombouts, and T. Abee. 1994. Energy-dependent, carrier-mediated extrusion of carboxyfluorescein from Saccharomyces cerevisiae allows rapid assessment of cell viability by flow cytometry. Appl. Environ. Microbiol. 60:1467-1472. [DOI] [PMC free article] [PubMed] [Google Scholar]
- 5.Catala, P., N. Parthuisot, L. Bernard, J. Baudart, K. Lemarchand, and P. Lebaron. 1999. Effectiveness of CSE to counterstain particles and dead bacterial cells with permeabilised membranes: application to viability assessment in waters. FEMS Microbiol. Lett. 178:219-226. [DOI] [PubMed] [Google Scholar]
- 6.Comas, J., and J. Vives-Rego. 1997. Assessment of the effects of gramicidin, formaldehyde, and surfactants on Escherichia coli by flow cytometry using nucleic acid and membrane potential dyes. Cytometry 29:59-64. [DOI] [PubMed] [Google Scholar]
- 7.Davey, H. M., and D. B. Kell. 1996. Flow cytometry and cell sorting of heterogeneous microbial populations: the importance of single-cell analyses. Microbiol. Rev. 60:641-696. [DOI] [PMC free article] [PubMed] [Google Scholar]
- 8.Diaper, J. P., K. Tither, and C. Edwards. 1992. Rapid assessment of bacterial viability by flow cytometry. Appl. Microbiol. Biotechnol. 38:268-272. [DOI] [PubMed] [Google Scholar]
- 9.Diaper, J. P., and C. Edwards. 1994. The use of fluorogenic esters to detect viable bacteria by flow cytometry. J. Appl. Bacteriol. 77:221-228. [Google Scholar]
- 10.Furukawa, K., N. Tomizawa, and A. Kamibayashi. 1979. Effect of chlorine substitution on the bacterial metabolism of various polychlorinated biphenyls. Appl. Environ. Microbiol. 38:301-310. [DOI] [PMC free article] [PubMed] [Google Scholar]
- 11.Gunasekera, T. S., P. V. Attfield, and D. A. Veal. 2000. A flow cytometric method for rapid detection and enumeration of total bacteria in milk. Appl. Environ. Microbiol. 66:1228-1232. [DOI] [PMC free article] [PubMed] [Google Scholar]
- 12.Hancock, R. E. W., and P. G. W. Wong. 1984. Compounds which increase the permeability of the Pseudomonas aeruginosa outer membrane. Antimicrob. Agents Chemother. 26:48-52. [DOI] [PMC free article] [PubMed] [Google Scholar]
- 13.Helander, I. M., and T. Mattila-Sandholm. 2000. Fluorometric assessment of gram-negative bacterial permeabilization. J. Appl. Microbiol. 88:213-219. [DOI] [PubMed] [Google Scholar]
- 14.Jacobsen, C. N., J. Rasmussen, and M. Jakobsen. 1997. Viability staining and flow cytometric detection of Listeria monocytogenes. J. Microbiol. Methods 28:35-43. [Google Scholar]
- 15.Jepras, R. I., J. Carter, S. C. Pearson, F. E. Paul, and M. J. Wilkinson. 1995. Development of a robust flow cytometric assay for determining numbers of viable bacteria. Appl. Environ. Microbiol. 61:2696-2701. [DOI] [PMC free article] [PubMed] [Google Scholar]
- 16.Joux, F., P. Lebaron, and M. Troussellier. 1997. Changes in cellular states of the marine bacterium Deleya aquamarina under starvation conditions. Appl. Environ. Microbiol. 63:2686-2694. [DOI] [PMC free article] [PubMed] [Google Scholar]
- 17.Kaneshiro, E. S., M. A. Wyder, Y. P. Wu, and M. T. Cushion. 1993. Reliability of calcein acetoxy methyl ester and ethidium homodimer or propidium iodide for viability assessment of microbes. J. Microbiol. Methods 17:1-16. [Google Scholar]
- 18.Kimbara, K., T. Hashimoto, M. Fukuda, T. Koana, M. Takagi, M. Oishi, and K. Yano. 1989. Cloning and sequencing of two tandem genes involved in the degradation of 2,3-dihydroxybiphenyl to benzoic acid in the polychlorinated biphenyl-degrading soil bacterium Pseudomonas sp. strain KKS102. J. Bacteriol. 171:2740-2747. [DOI] [PMC free article] [PubMed] [Google Scholar]
- 19.Lebaron, P., P. Catala, and N. Parthuisot. 1998. Effectiveness of SYTOX green stain for bacterial viability assessment. Appl. Environ. Microbiol. 64:2697-2700. [DOI] [PMC free article] [PubMed] [Google Scholar]
- 20.Loh, B., C. Grant, and R. E. W. Hancock. 1984. Use of the fluorescent probe 1-N-phenylnaphthylamine to study the interactions of aminoglycoside antibiotics with the outer membrane of Pseudomonas aeruginosa. Antimicrob. Agents Chemother. 26:546-551. [DOI] [PMC free article] [PubMed] [Google Scholar]
- 21.López-Amorós, R., J. Comas, and J. Vives-Rego. 1995. Flow cytometric assessment of Escherichia coli and Salmonella typhimurium starvation survival in seawater using rhodamine 123, propidium iodide, and oxonol. Appl. Environ. Microbiol. 61:2521-2526. [DOI] [PMC free article] [PubMed] [Google Scholar]
- 22.López-Amorós, R., S. Castel, J. Comas-Riu, and J. Vives-Rego. 1997. Assessment of E. coli and Salmonella viability and starvation by confocal laser microscopy and flow cytomery using rhodamine 123, DiBAC4(3), propidium iodide, and CTC. Cytometry 29:298-305. [DOI] [PubMed] [Google Scholar]
- 23.Matsuyama, T. 1984. Staining of living bacteria with rhodamine 123. FEMS Microbiol. Lett. 21:153-157. [Google Scholar]
- 24.Nebe-von Caron, G., and R. A. Badley. 1995. Viability assessment of bacteria in mixed populations using flow cytometry. J. Microsc. 179:55-66. [Google Scholar]
- 25.Nebe-von Caron, G., P. Stephens, and R. A. Badley. 1998. Assessment of bacterial viability status by flow cytometry and single sorting. J. Appl. Microbiol. 84:988-998. [DOI] [PubMed] [Google Scholar]
- 26.Pinder, A. C., P. W. Purdy, S. A. G. Poulter, and D. C. Clark. 1990. Validation of flow cytometry for rapid enumeration of bacterial concentrations in pure culture. J. Appl. Bacteriol. 69:92-100. [DOI] [PubMed] [Google Scholar]
- 27.Pore, R. S. 1994. Antibiotic susceptibility testing by flow-cytometry. J. Antimicrob. Chemother. 34:613-627. [DOI] [PubMed] [Google Scholar]
- 28.Porter, J., C. Edwards, and R. W. Pickup. 1995. Rapid assessment of physiological status in Escherichia coli using fluorescent probes. J. Appl. Bacteriol. 79:399-408. [DOI] [PubMed] [Google Scholar]
- 29.Shimura, M., T. Koana, M. Fukuda, and K. Kimbara. 1996. Complete degradation of polychlorinated biphenyls by a combined method of ultraviolet and biological treatments. J. Ferment. Bioeng. 81:573-576. [Google Scholar]
- 30.Shimura, M., T. Hayakawa, G. Mukerjee-Dhar, M. Fukuda, and K. Kimbara. 1998. Characterization of polychlorinated biphenyl degradation in a fermentor by Comamonas testosteroni strain TK102. Jpn. J. Water Treat. Biol. 34:57-65. [Google Scholar]
- 31.Suller, M. T. E., and D. Lloyd. 1999. Fluorescence monitoring of antibiotic-induced bacterial damage using flow cytometry. Cytometry 35:235-241. [DOI] [PubMed] [Google Scholar]
- 32.Ueckert, J., P. Breeuwer, T. Abee, P. Stephens, G. Nebe-von Caron, and P. F. ter Steeg. 1995. Flow cytometry applications in physiological study and detection of foodborne microorganisms. Int. J. Food Microbiol. 28:317-326. [DOI] [PubMed] [Google Scholar]


