

Abstract
Purpose:
In the present study, we investigated the potential of QSM to assess the physiological state of cortical tissue in the middle cerebral artery occlusion canine model of a cerebral ischemia.
Methods:
Experiments were performed in 8 anesthetized canines. Gradient echo, perfusion, and DWI data of brains at normal and ischemic states were acquired. In the postprocessed susceptibility and quantitative cerebral blood flow maps, changes in values within the middle cerebral artery-fed cortical territories were quantified both on the ischemic and normal contralateral hemisphere side.
Results:
QSM values in critically ischemic tissue were significantly different from contralateral values—namely, susceptibility increase was observed in the cases in which cerebral perfusion was maintained above the threshold of neuronal death. Furthermore, the data indicates presence of a significant correlation between the changes in susceptibility values, cerebral perfusion, and the infarct volume and pial collateral scores. Additionally, our data suggests that difference in cortical susceptibility is prospectively indicative of the infarct growth rate.
Conclusion:
In an experimental permanent middle cerebral artery occlusion model, QSM was shown to correlate with the functional parameters characterizing viability of ischemic tissue, thus warranting further research on its ability to provide complementary information during acute stroke MRI examinations in humans.
Keywords: cerebral ischemia, hypoxia, Magnetic Resonance Imaging (MRI), Quantitative susceptibility mapping (QSM), Stroke
1 |. INTRODUCTION
MRI is a powerful tool in the diagnosis, assessment, and management of patients with ischemic stroke that can help assess hemodynamic function and the severity of tissue damage.1,2 Imaging during acute ischemic stroke aims to confirm the cause of ischemia and identify tissue at risk for infarction. Using DWI and perfusion imaging (ie, dynamic susceptibility contrast perfusion or arterial spin labelling), MRI can define tissue that has succumb to cytotoxic edema as well as hemodynamically unstable tissue that may or may not be at risk for tissue death.3 Although DWI is closely reflective of tissue damage, estimates of perfusion do not accurately reflect tissue at imminent risk.4,5 Furthermore, traditionally used diffusion-perfusion mismatch might overestimate the extent of tissue at risk due to oligemia.6 Therefore, the availability of an additional MRI marker of metabolic activity that is independent of assumption in blood flow could be used to identify functioning but hypoperfused (ie, above the perfusion threshold for neuronal cell death7,8) and severely ischemic tissues and potently improve the clinical definition of the ischemic penumbra.
Recently, magnetic susceptibility imaging has been receiving increased attention as a source of the functional MR contrast due to its direct relation to deoxyhemoglobin concentration,9 a marker of oxygen metabolism. For example, it has been shown that T2*-weighted and SWI can be used to detect cerebral microbleeds,10,11 hemorrhages12,13 and areas of hypoperfusion.6,14
As an extension to the above-mentioned techniques, QSM has been introduced.9,15–19 QSM is a postprocessing technique that quantifies local tissue magnetic properties through the solution of the field-to-source problem. Previously, QSM has been utilized in multiple studies of pathological conditions involving iron,20–27 calcifications,21,23,28 and myelin.22,29,30 Furthermore, there is a growing body of research on QSM applicability in cerebral ischemia involving preclinical models and patients.31–34 It is well known that the magnetic susceptibility of blood increases as the oxyhemoglobin is converted to deoxyhemoglobin (Δχ ≈ 0.27ppm).35,36 It stands to reason that QSM can serve as an imaging marker to identify metabolically active brain parenchyma, and when compared to the associated area of cytotoxic edema, define the true ischemic penumbra.
In the present study, we investigated the potential of QSM to assess the physiological state of cortical tissue in the canine brain after the onset of a middle cerebral artery (MCA) occlusion (MCAO). We hypothesize that QSM can detect the local changes in magnetic susceptibility as oxyhemoglobin is converted to de-oxyhemoglobin in critically ischemic regions of the brain that result from acute restriction of cerebral perfusion. Therefore, QSM may serve as an independent biomarker of underperfused but metabolically active brain, that is, the so-called “ischemic penumbra,” which is the therapeutic target of thrombolytic therapies.37,38 To this effect, gradient echo (GRE), perfusion, and DWI MRI images of brains at normal and ischemic states was acquired. In the postprocessed susceptibility and quantitative cerebral blood flow (qCBF) maps, changes in values within the MCA-fed cortical territories were quantified both on the ischemic and normal contralateral hemisphere side.
2 |. METHODS
QSM was evaluated against quantitative perfusion in a controlled large animal MCAO model.4,5,39 X-ray angiography was used to quantify the degree of arterial collateralization, a known cofactor of infarction in selective occlusion models.40–42
2.1 |. Animals
Eight mongrel canines (mean ± SD of weight: 26.6 ± 4.1 kg; age: 76.8 ± 6.97 months) of both genders (1 female, 7 male) were included in the study. The experimental protocol was approved by the local Institutional Animal Care and Use Committee and is reported in compliance with Animal Research: Reporting on In Vivo Experiments guidelines. The (institute blinded for review) is an Association for Assessment and Accreditation of Laboratory Animal Care International-accredited institution adhering to the following guidelines, regulations, and policies: 1) Guide for the Care and Use of Laboratory Animals (National Research Council), 2) United States Department of Agriculture Animal Welfare Act and Animal Welfare Regulations, and 3) Public Health Service Policy on Humane Care and Use of Laboratory Animals.
2.2 |. Study design
Experiments were performed on 2 consecutive days. Briefly, following induction, animals were anesthetized (5% propofol) and ventilated. Cardiac rhythm, end-tidal CO2, glucose, body temperature, hematocrit, and arterial pressure were maintained within physiologic range throughout the imaging session.
On day 1 (pre-MCAO), baseline QSM and qCBF data were acquired during normocapnia (target partial pressure of CO2 range 30-40 mmHg using room air). The images acquired at baseline physiology on day 1 served as experimental controls in each experiment for the ischemia induced on day 2.
On day 2 (post-MCAO) of the study, middle cerebral artery occlusion was induced endovascularly. Embolic occlusion coils (Medtronic Neurovascular, Boulder, Colorado and Microvention, Aliso Viejo, California) were used to occlude the M1 segment, the distal internal carotid artery, and proximal anterior cerebral artery origin. Occlusion was confirmed angiographically (OEC9800, General Electric Healthcare, Chicago, IL). Vertebral and bilateral internal carotid arteriograms confirmed occlusion of the MCA territory without involvement of other vessels. Pial collateral flow was quantified 15 min after MCA occlusion using a previously reported scale.39 Following that, the animal was transported to the MRI suite for imaging. Post-MCAO protocol was structured as follows: diffusion data were acquired serially with measurements performed throughout 6 out of the 8 experiments at approximately 60, 90, 120, and 150 min from the onset to track the growth of infarct volume. Approximately 1.5 h post-occlusion and prior to any contrast agent injection, QSM data were acquired, followed by acquisition of quantitative perfusion data.
2.3 |. MR data acquisition
All MRI measurements were performed on a 3 Telsa clinical scanner (Ingenia, Philips Healthcare, Best, Netherlands) equipped with a 15-channel receive-only head coil. Animals were placed in the head-first, prone position.
For frequency mapping and QSM reconstruction, a multi-echo 3D spoiled GRE sequence was used with the following imaging parameters: TEI = 5.2 ms, ΔTE = 6.5 ms, 8 echoes, TR = 54 ms, FA = 15°, bandwidth (BW) = 191 Hz/pixel, matrix size = 224 × 224 × 50, voxel size = 0.98 × 0.98 × 2 mm3, and scan time ~10 min. For visual assessment of cortical vein, veno-BOLD (SWI) images were acquired: TE = 24 ms, TR = 17, FA = 10° ms, BW = 192 Hz/pixel, matrix size = 336 × 336 × 200, and voxel size = 0.44 × 0.44 × 0.5 mm3. On day 2, the imaging was performed within 2 h post-occlusion, immediately prior to injection of the gadolinium-based contrast agent, which was used for the quantification of cerebral perfusion.
To quantify CBF (qCBF), a previously reported approach utilizing pre- and postcontrast T1 maps5,43–45 was applied. The T1 mapping was implemented as an inversion recovery Look-Locker EPI sequence with variable delay times, TR/TE = 8/3.5 ms, FA = 7°, BW = 2100 Hz/pixel, matrix size = 224 × 224 × 1, and voxel size = 0.98 × 0.98 × 4 mm3. Parameters for the dynamic susceptibility contrast GRE-EPI scans were: TR/TE = 315/40 ms, FA = 75°, BW = 2150 Hz/pixel, matrix size = 224 × 224 × 5, and voxel size = 0.98 × 0.98 × 6 mm3. A single-dose injection (3 mL at 2 mL/s) of gadolinium-based contrast agent (Multihance, Bracco, Princeton, NJ) was injected in a forepaw vein, followed by a saline flush (20 mL at 2 mL/s). This method has been directly compared to stable neutron microsphere deposition and found to have an error equal or less than 10% of true perfusion (mL/100 g/min) in the setting of MCAO.5
Finally, infarct volume was determined using a DWI scan. DWI was acquired using the following set of parameters: TR/TE = 2993/83 ms, FA = 90°, BW = 1790 Hz/pixel. matrix size = 128 × 128 × 50, voxel size = 1.75 × 1.75 × 2 mm3. b values = 0, 800 s/mm2, and 33 directions. With prolonged scan time, multiple diffusion directions were acquired to provide high-quality images for precise infarct volume determination, 1 of the primary endpoints of the experiments. To obtain the ADC maps, geometric mean of all diffusion directions was calculated.
2.4 |. Data processing
2.4.1 |. Reconstruction
The MRI perfusion images were postprocessed to create qCBF (in mL/100 g/min) parametric images using custom software created for MatLab v9.3 (The Mathworks, Natick, MA).5
Quantitative susceptibility mapping is a widely used technique for the determination of local magnetic fields and has been discussed widely in the literature.46–48 In the following, we present only those details germane to the current work.
QSMs were computed using the morphology-enabled dipole inversion reconstruction pipeline. In brief, a linear fitting of the GRE phase was used to estimate the total field, and 2π-wraps were eliminated using a graph-cut technique.49,50 At the next stage, the Laplacian boundary value method51 was used to calculate the local field, Bl, generated by the sources outside of the brain tissue. Finally, the morphology-enabled dipole inversion17 algorithm was used to solve the inverse field-to-source problem:
Here, M is the anatomical prior in the form of an edge mask derived from the morphological T2*w image; G is the gradient operator; W is a diagonal noise-weighting matrix; and D is the dipole kernel matrix.
2.4.2 |. Quantification of pial collateral arterial recruitment
Collateralization affects (improves) tissue perfusion. We compared both perfusion and QSM signal changes to angiographic assessment of collateral blood supply to the vascular territory distal to the occluded blood vessel. The collateral blood supply scores were measured by an interventional neuroradiologist (G.A.C., blinded for review) with 12 years of experience using an established method.39 Briefly, this method employs a 11-point scoring system that compares post-occlusion with pre-occlusion arteriographie images to assess the extent of reconstitution of the occluded MCA territory and transit time relative to jugular vein opacification. Higher score corresponds to better pial collateral recruitment and blood supply distal to an occlusion. The Bland-Altman statistic for this pial collateral scoring system between 2 observers has been reported at 22.6% (95% of scores within 1.3 points of each other) and the mean difference of 0.23 between observers.
2.4.3 |. Quantification of infarct volume
Infarct volumes were assessed by an in-house automated infarct segmentation algorithm. This method first creates a mask of the brain by selecting voxels with a coefficient of variation (ie, σ/μ) less than 20% across the diffusion gradient directions. The mask was further refined by selecting the biggest contiguous volume and dilating and eroding the mask to fill in gaps. Using the mask as the fiducial volume of the brain, infarct was then segmented based on low ADC. Level set threshold of ADC less than 0.57 × 10⁻³ mm2/s was applied to find the borders of the infarct volume. This algorithm has been compared directly to manual segmentation in 16 experiments on canine subjects and was found to have strong correlation (r2 = 0.94).52
2.4.4 |. Cortical evaluation of QSM
In order to avoid additional variations due to the tensor nature of susceptibility within the white matter, the present study was limited to tracking the changes of magnetic susceptibility within the cortical territories.
Cortical regions of interest (ROIs) corresponding to the MCA territory were manually drawn by a trained operator (N.S., blinded for review) on the magnitude images (generated through combination of all echoes using standard approach, that is, the final image where Mi is the magnitude of the ith echo, and n is the total number of acquired echoes), which are naturally coregistered to the QSM (Figure 1). The MCA territory was defined based on gyral derived from the literature,39,53–57 supplemented by the operator’s experience. Magnitude images provided the anatomic detail to manually draw the MCA territory. The ROIs corresponded to the MCA territory of both hemispheres, targeted to cover gray matter but excluded apparent blood vessels and foci degraded by susceptibility (susceptibility effects are known to degrade dynamic susceptibility contrast imaging and DTI acquisitions). To ensure scientific rigor, the operator, who was blinded to both QSM and qCBF, relied on the visible anatomical cues, such as white matter tracts and sulcal markings. Resulting ROIs were used as a reference by a second, independent operator (A.V.D., blinded for review) who segmented a set of similar ROIs on qCBF images. ROI selection was supervised by an interventional neuroradiologist with 12 years of experience in the evaluation of canine MRI (G.A.C., blinded for review). The average segmented cortical ROI volume was 1110 ± 30 mm3
FIGURE 1.

Placement of ROIs within cortical MCA territories. MCA, middle cerebral artery occlusion; RO1, region of interest
The ROIs were then applied as masks to the quantitative susceptibility and CBF maps to calculate mean values. The difference between QSM values in the ROIs placed within MCAO-affected and unaffected hemispheres (ie, were compared with the qCBF of the affected hemisphere, collateral scores, and final infarct volumes.
2.4.5 |. Statistical analysis
The hypothesis underlying the present study was that physiological changes during ischemia can result in quantifiable changes in magnetic susceptibility of the gray matter. Statistical analysis was performed using MatLab (2018b, MathWorks) routines. The data were reported as (mean ± SD). SD for the difference between 2 ROIs was estimated according to the following expression: , where and Ni are SD and number of voxels in the ROIs, respectively. Comparisons of QSM and qCBF values for each hemisphere were performed using the 2-sample t test with statistical significance defined at the 5% level. Comparison between the cortical susceptibility values in subcohorts with observed hypoperfusion and ischemia (classified through the perfusion metabolic threshold of 23 mL/100 g/min7) was performed using Wilcoxon signed-rank test, with significance level of 5%.
3 |. RESULTS
3.1 |. Experimental controls
Pre-MCAO QSM data were successfully acquired and reconstructed in 6 out of 7 experimental specimens; case 6 lacked the baseline acquisition due to a technical error in image acquisition. Similarly, qCBF was successfully reconstructed in 5 specimens, with 1 dataset omitted because of the coil malfunction during the acquisition. Pre-MCAO qCBF maps consistently demonstrated hemispheric symmetry (P > .05), with the average normocapnic qCBF value of 59.2 ± 4.7 mL/100 g/min. Likewise, symmetry was observed between cortical ROIs drawn on reconstructed QSM images (Table 1).
TABLE 1.
Summary of the experimental results
| Subject No. | (ppb) | (ppb) | (mL/100 g/min) | (mL/100 g/min) | (mL/100 g/min) | (mL/100 g/min) | 2h Infarct Volume (mm3) | Collateral Score |
|---|---|---|---|---|---|---|---|---|
| 1 | 0.0 ± 0.7 | 2.5 ± 0.6* | 59.5 ± 19.5 | 81.6 ± 15.6 | 40.9 ± 18.8* | 249.1 ± 16.4 | 6431 | 8 |
| 2 | 0.3 ± 1.0 | −0.1 ± 0.6 | 56.0 ± 4.2 | 64.7 ± 1.9 | 14.9 ± 2.8* | 154.3 ± 14.7 | 10890 | 8 |
| 3 | −0.1 ± 0.5 | −3.1 ± 0.6* | 53.2 ± 10.2 | 59.7 ± 4.1 | 16.8 ± 1.4* | 254.2 ± 10.4 | 21308 | 6 |
| 4 | 0.2 ± 1.2 | −1.9 ±0.9* | 64.8 ± 4.3 | 52.9 ± 3.8 | 7.1 ± 1.6* | 78.7 ± 19.1 | 21847 | 8 |
| 5 | −0.3 ± 0.5 | 2.6 ± 0.5* | NA | NA | 31.8 ± 14.9* | 58.3 ± 14.6 | 239 | 10 |
| 6 | NA | −1. ± 0.9* | 62.5 ± 1.7 | 70.1 ± 7.8 | 12.7 ± 4.7* | 162.5 ± 5.94 | 78380 | 7 |
| 7 | 0.5 ± 0.5 | 5.4 ± 0.8* | NA | NA | 34.5 ± 8.1* | 73.8 ± 19.0* | 172 | 11 |
| 8 | 0.3 ± 0.4 | 2.7 ± 0.5* | 56.1 ± 9.5 | 54.5 ± 9.2 | 66.6 ± 29.2* | 108.6 ± 8.4 | 2995 | 10 |
Abbreviations: MCAO, middle cerebral artery occlusion; NA, nonapplicable; ppb, parts per billion; qQCBF, quantitative cerebral blood flow.
Indicates statistically significant difference (P < .05).*
3.2 |. Tissue changes post-MCAO
Post-MCAO measurements were successfully performed in all experiments. The observed QSM asymmetry was statistically significant (P < .05) in 7 out of 8 specimens, whereas statistically significant changes in qCBF were detected in all specimens. qCBF in the cortical territory of the MCAO affected hemisphere demonstrated consistent decrease in values compared both to the day 1 values and those on the contralateral side, and 2 opposing directions of change were observed in the QSM changes. Figure 2 provides comparison of imaging results for 2 specimens demonstrating post-MCAO decrease and increase in ΔQSM, along with corresponding quantitative perfusion maps, ADC, and SWI. In general, it was observed that positive susceptibility shift was characteristic in the specimens with strong collateral blood supply and was associated with hypoperfusion and lower extent of the tissue damage. Detailed results of the day 2 measurements are shown in Table 1.
FIGURE 2.

Representative images of QSM, veno-BOLD (SWI), qCBF, and ADC maps acquired post-MCAO in 2 cases demonstrating 2 observed QSM shifts during acute ischemia. Subject A demonstrates decreased tissue susceptibility combined with the presence of asymmetrically prominent cortical veins in both veno-BOLD and QSM, aligning with the border of the ischemic territory (red dots) compared to the unaffected side (arrows). Subject B shows minor asymmetry in perfusion between affected (yellow dots) and unaffected (arrows) hemispheres and increased cortical susceptibility on the ipsilateral stroke side. MCAO. middle cerebral artery occlusion; qCBF, quantitative cerebral blood flow
Results of linear regression analysis and dependence of infarct growth on ΔQSM are shown in Figure 3.
FIGURE 3.
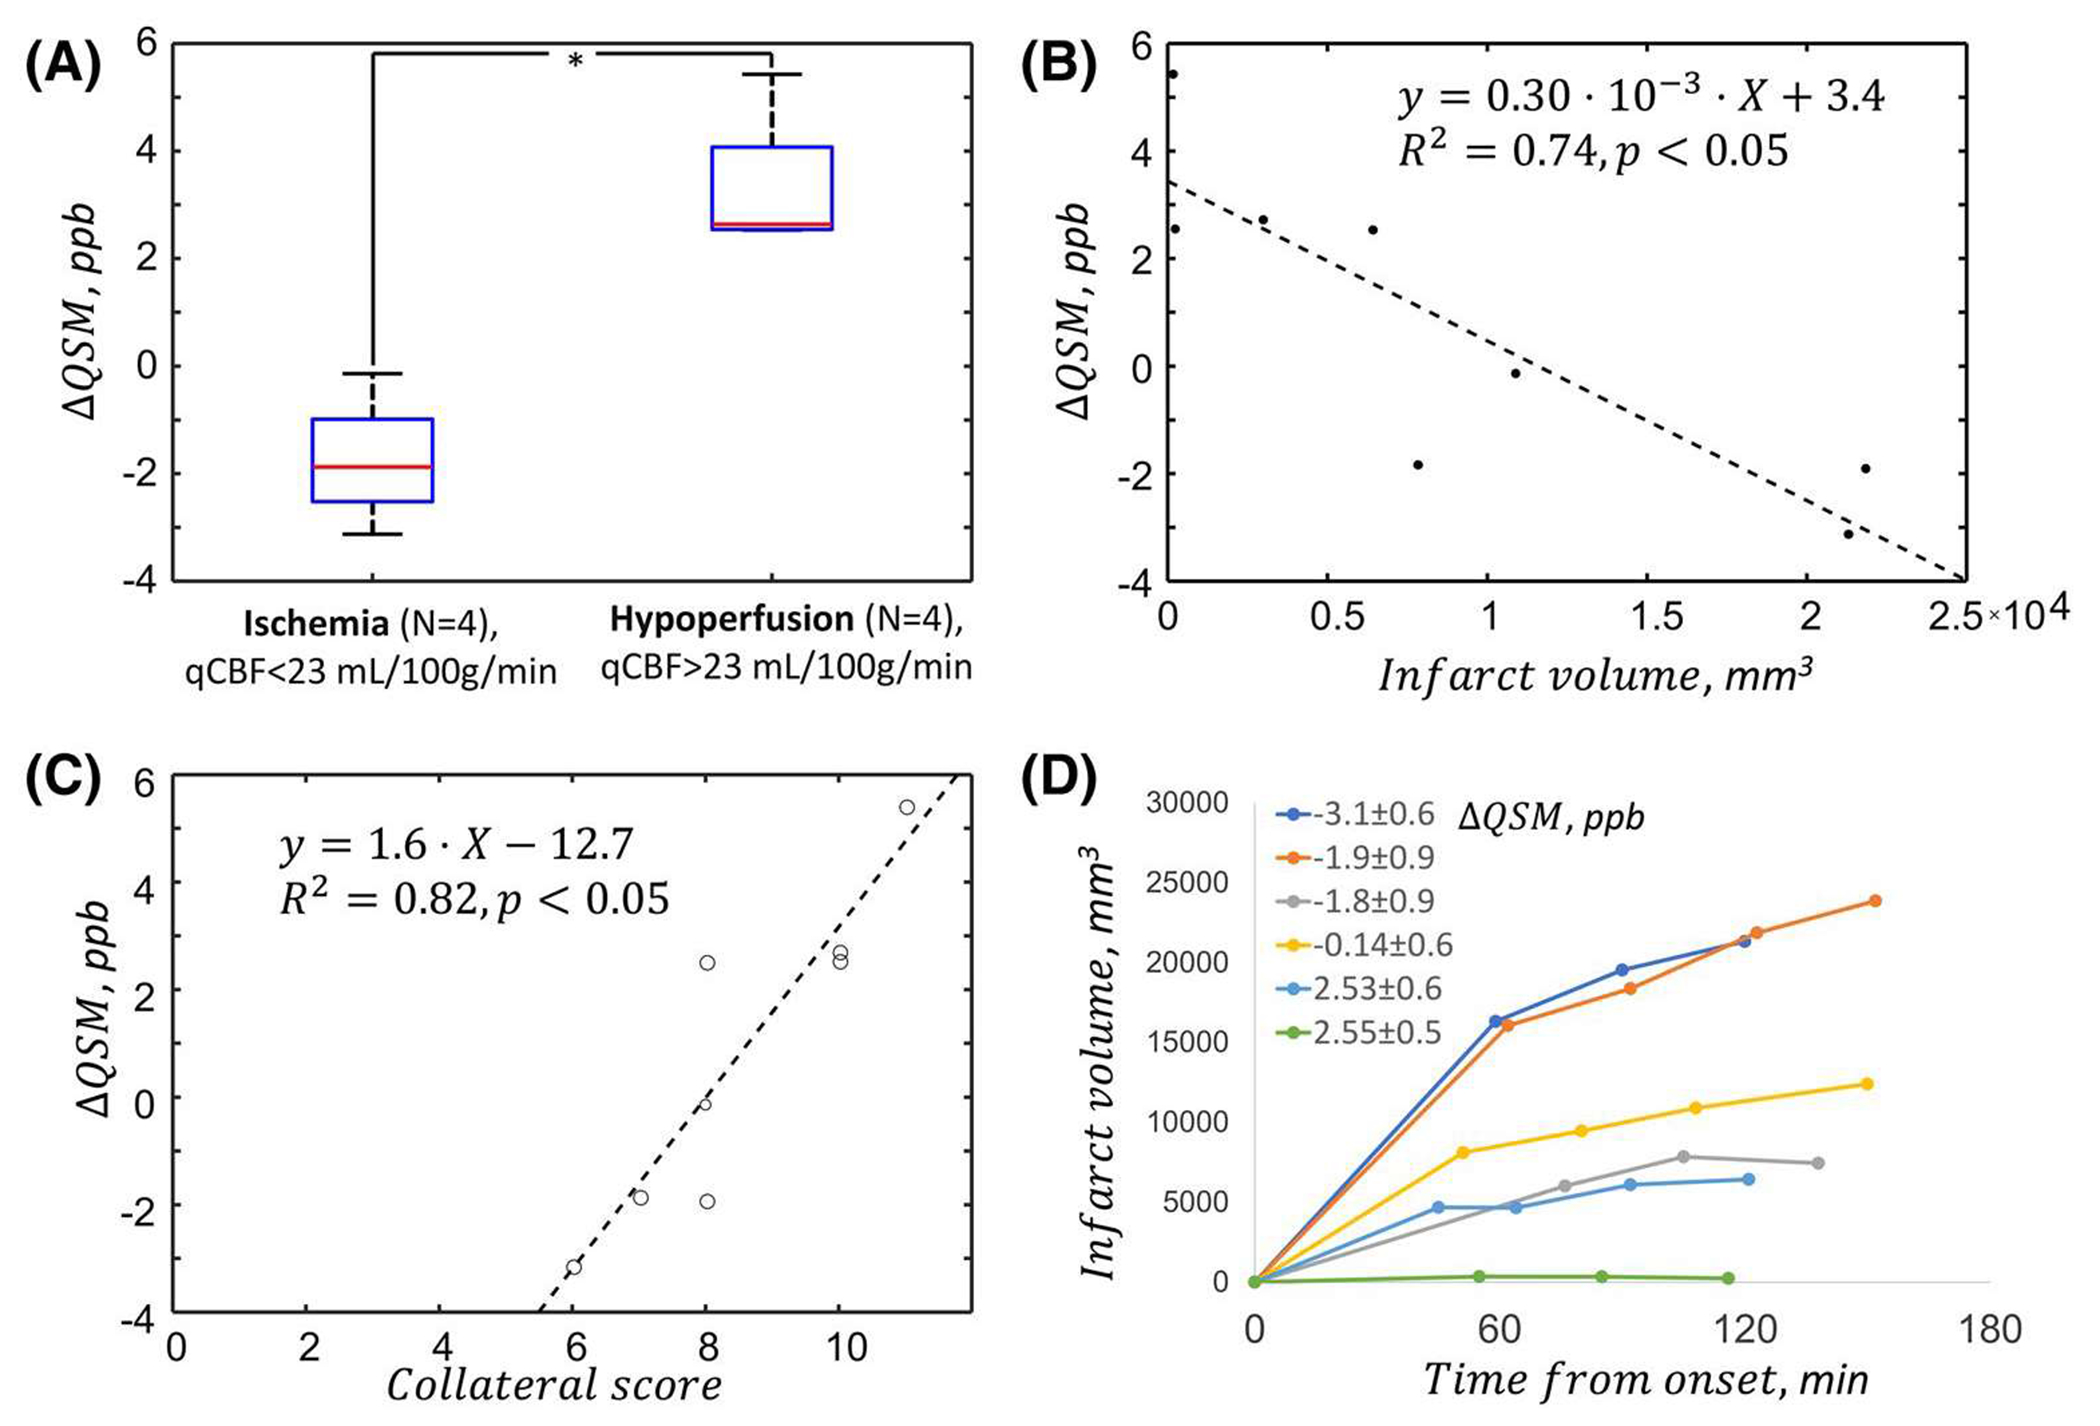
QSM in critical ischemia. Statistically significant difference in the value of ΔQSM was observed between hypoperfused and ischemic cohorts. Results of linear regression analysis of ΔQSM and collateral score and final infarct volume (B and C) show that QSM changes are associated with the degree of ischemia and residual blood flow provided through the collateral arterial network. We also find that ΔQSM, which reflects the degree of hypoxia, corresponds to the growth rate of the infarct (D)
Significant difference (P < .05) was observed between estimated ΔQSM values in specimens with ischemia and hypoperfusion (Figure 3A). The quantitative comparison between cortical averages QSM and 2-h infarct volume (as an indirect measure of the infarct growth rate) and QSM and collateral scores showed significant correlations (r2 = 0.75, and r2 = 0.53 correspondingly, P < .05).
4 |. DISCUSSION
In the present study, we found that QSM values in critically ischemic tissue are significantly different from contralateral values. Furthermore, we investigated the changes of cortical QSM and qCBF during the acute ischemic stroke. Our data indicates presence of a significant correlation between the changes in susceptibility values and the infarct volume. Noteworthy, unlike in the rest of the experiments, an increase in QSM values was detected in subjects 1, 5, 7, and 8, which maintained cerebral perfusion above previously reported thresholds for neuronal cell death (gray matter ≈23 mL/100 g/min, white matter ≈13 mL/100 g/min7,8) through pial collateral blood supply. Additionally, our data suggests that difference in cortical susceptibility is indicative of the infarct growth rate. The reported findings suggest that QSM reflects functional changes within the ischemic tissue and may potentially be utilized as a tool for the evaluation of patients with ischemic stroke. Furthermore, QSM images demonstrated the presence of prominently dilated cortical veins at the border of ischemic volume.
In the current work, we aimed to further address this gap by comparing observed changes in QSM to quantitative perfusion, collateralization, and final infarct volume. The findings appear to support the base hypothesis regarding the sensitivity of QSM to the changes arising as the result of the ischemia. Furthermore, it was observed that magnetic susceptibility of the gray matter can both increase and decrease during the stroke, which might possibly signify that evolution of tissue susceptibility is able to mark the metabolic threshold for irreversible injury. Thus, based on our data, it might be hypothesized that in the regions with higher collateralization and perfusion, in which most of the tissue is viable but at risk, increased deoxygenated hemoglobin concentrations result in a paramagnetic shift of susceptibility. Contrary to that, severely hypoperfused dying tissue does not extract oxygen, which increases oxygenated hemoglobin concentrations and drives the opposite, diamagnetic shift. The accuracy and significance of this model, however, need to be further investigated.
Numerous physiological mechanisms can be additionally included in explanation of the observed changes of tissue magnetic susceptibility. Notably, an important factor in the regulation of the cerebral blood circulation is partial pressure of CO2. It is known that hypercarbia induces strong vasodilation and thus is expected to affect cerebral blood volume. Thus, increase in QSM can also be driven by increased capacitance of veins that cannot be resolved relative to brain tissue with the current imaging resolution. We suspect that observed inter- and intrasubject variability of partial pressure of CO2 during the MRI studies could be a factor behind the non-monotonous relationship between the infarct growth rate and observed susceptibility difference. As a result, the lack of a detailed analysis incorporating this information is a limitation of the present work. In future studies, correction factors may need to be incorporated based on cerebral blood volume and expected venous drainage routes.
The analyses in this work were carried out on a small number of specimens enrolled in an ongoing research. The dataset contains QSM data acquired at only 1 time point for both days, leaving aside the possibility to track the dynamics of the reported changes. Additionally, in order to incorporate the GRE acquisition into an extensive imaging protocol, imaging resolution for QSM was set to the relatively coarse values. Future work should address these shortcomings. In the present experimental cohort, post-occlusion increase of perfusion has been observed on the unaffected contralateral side of the brain. Although the physiological underpinnings of this change are not clear, they were strongly associated with the gradual growth of the arterial pressure in the specimens during the experimental procedure. These observed changes seem to be reflecting of the previous findings,58 although additional studies are required for explanation. Finally, direct comparison to a reference standard, such as PET hypoxia imaging, is a necessary step for completeness of understanding of the involved pathophysiology.
5 |. CONCLUSION
QSM is able to provide information about the functional state of an ischemic tissue, which makes it a promising component for the assessment of patients with stroke. In this work, we present proof of concept results in a preclinical model; therefore, the present study cannot be viewed as conclusive, and its findings should be regarded as hypothesis-generating only. Nevertheless, it warrants further validation of the obtained results and indicates the need for technical development of QSM for increased sensitivity to changes induced by ischemia.
Funding information
National Institute of Neurological Disorders and Stroke, Grant/Award Number: R01NS09390805
REFERENCES
- 1.Gonzalez RG. Clinical MRI of acute ischemic stroke. J Magn Reson Imaging. 2012;36:259–271. [DOI] [PMC free article] [PubMed] [Google Scholar]
- 2.Macintosh BJ, Graham SJ. Magnetic resonance imaging to visualize stroke and characterize stroke recovery: A review. Front Neurol. 2013:4:60. [DOI] [PMC free article] [PubMed] [Google Scholar]
- 3.Rosen BR, Belliveau JW, Vevea JM, Brady TJ. Perfusion imaging with NMR contrast agents. Magn Reson Med. 1990:14:249–265. [DOI] [PubMed] [Google Scholar]
- 4.Christoforidis GA, Vakil P, Ansari SA, Dehkordi FH, Carroll TJ. Impact of pial collaterals on infarct growth rate in experimental acute ischemic stroke. AJNR Am J Neuroradiol. 2017;38:270–275. [DOI] [PMC free article] [PubMed] [Google Scholar]
- 5.Jeong YI, Christoforidis GA, Saadat N, et al. Absolute quantitative MR perfusion and comparison against stable-isotope microspheres. Magn Reson Med. 2019;81:3567–3577. [DOI] [PMC free article] [PubMed] [Google Scholar]
- 6.Kloska SP, Wintermark M, Engelhorn T, Fiebach JB. Acute stroke magnetic resonance imaging: Current status and future perspective. Neuroradiology. 2010;52:189–201. [DOI] [PMC free article] [PubMed] [Google Scholar]
- 7.Bristow MS, Simon JE, Brown RA, et al. MR perfusion and diffusion in acute ischemic stroke: Human gray and white matter have different thresholds for infarction. J Cereb Blood Flow Metab. 2005;25:1280–1287. [DOI] [PubMed] [Google Scholar]
- 8.Shah MK, Shin W, Parikh VS, et al. Quantitative cerebral MR perfusion imaging: Preliminary results in stroke. J Magn Reson Imaging. 2010;32:796–802. [DOI] [PMC free article] [PubMed] [Google Scholar]
- 9.Wang Y, Liu T. Quantitative susceptibility mapping (QSM): Decoding MRI data for a tissue magnetic biomarker. Magn Reson Med. 2015;73:82–101. [DOI] [PMC free article] [PubMed] [Google Scholar]
- 10.Greenberg SM, Vernooij MW, Cordonnier C, et al. Cerebral microbleeds: A guide to detection and interpretation. Lancet Neurol. 2009;8:165–174. [DOI] [PMC free article] [PubMed] [Google Scholar]
- 11.Ayaz M Boikov AS, Haacke EM, Kido DK, Kirsch WM. Imaging cerebral microbleeds using susceptibility weighted imaging: One step toward detecting vascular dementia. J Magn Reson Imaging. 2010;31:142–148. [DOI] [PMC free article] [PubMed] [Google Scholar]
- 12.Lin DD, Filippi CG, Steever AB, Zimmerman RD. Detection of intracranial hemorrhage: Comparison between gradient-echo images and b(0) images obtained from diffusion-weighted echo-planar sequences. AJNR Am J Neuroradiol. 2001;22:1275–1281. [PMC free article] [PubMed] [Google Scholar]
- 13.Mittal S, Wu Z, Neelavalli J, Haacke EM. Susceptibility-weighted imaging: Technical aspects and clinical applications, part 2. AJNR Am J Neuroradiol. 2009:30:232–252. [DOI] [PMC free article] [PubMed] [Google Scholar]
- 14.Luo YU, Gong Z, Zhou Y, et al. Increased susceptibility of asymmetrically prominent cortical veins correlates with misery perfusion in patients with occlusion of the middle cerebral artery. Eur Radiol. 2017;27:2381–2390. [DOI] [PubMed] [Google Scholar]
- 15.Liu T, Wisnieff C, Lou M, Chen W, Spincemaille P, Wang Y. Nonlinear formulation of the magnetic field to source relationship for robust quantitative susceptibility mapping. Magn Reson Med. 2013;69:467–476. [DOI] [PubMed] [Google Scholar]
- 16.Schweser F, Deistung A, Reichenbach JR. Foundations of MRI phase imaging and processing for Quantitative Susceptibility Mapping (QSM). Z Med Phys. 2016;26:6–34. [DOI] [PubMed] [Google Scholar]
- 17.Liu J, Liu T, de Rochefort L, et al. Morphology enabled dipole inversion for quantitative susceptibility mapping using structural consistency between the magnitude image and the susceptibility map. Neuroimage. 2012;59:2560–2568. [DOI] [PMC free article] [PubMed] [Google Scholar]
- 18.Haacke EM, Liu S, Buch S, Zheng W, Wu D, Ye Y. Quantitative susceptibility mapping: Current status and future directions. Magn Reson Imaging. 2015:33:1–25. [DOI] [PubMed] [Google Scholar]
- 19.Eskreis-Winkler S, Zhang Y, Zhang J, et al. The clinical utility of QSM: Disease diagnosis, medical management, and surgical planning. NMR Biomed. 2017;30 e3668. 10.1002/nbm.3668. [DOI] [PubMed] [Google Scholar]
- 20.van Bergen JMG, Li X, Hua J, et al. Colocalization of cerebral iron with amyloid beta in mild cognitive impairment. Sci Rep. 2016:6:35514. [DOI] [PMC free article] [PubMed] [Google Scholar]
- 21.Chen W, Zhu W, Ilhami Kovanlikaya, et al. Intracranial calcifications and hemorrhages: Characterization with quantitative susceptibility mapping. Radiology. 2014;270:496–505. [DOI] [PMC free article] [PubMed] [Google Scholar]
- 22.Wisnieff C, Ramanan S, Olesik J, Gauthier S, Wang Y, Pitt D. Quantitative susceptibility mapping (QSM) of white matter multiple sclerosis lesions: Interpreting positive susceptibility and the presence of iron. Magn Reson Med. 2015;74:564–570. [DOI] [PMC free article] [PubMed] [Google Scholar]
- 23.Deistung A, Schweser F, Wiestler B, et al. Quantitative susceptibility mapping differentiates between blood depositions and calcifications in patients with glioblastoma. PLoS One. 2013;8:e57924. [DOI] [PMC free article] [PubMed] [Google Scholar]
- 24.Klohs J, Deistung A, Schweser F, et al. Detection of cerebral microbleeds with quantitative susceptibility mapping in the ArcAbeta mouse model of cerebral amyloidosis. J Cereb Blood Flow Metab. 2011;31:2282–2292. [DOI] [PMC free article] [PubMed] [Google Scholar]
- 25.Liu T, Surapaneni K, Lou M, Cheng L, Spincemaille P, Wang Y. Cerebral microbleeds: Burden assessment by using quantitative susceptibility mapping. Radiology. 2012;262:269–278. [DOI] [PMC free article] [PubMed] [Google Scholar]
- 26.Sun H, Klahr AC, Kate M, et al. Quantitative susceptibility mapping for following intracranial hemorrhage. Radiology. 2018;288:830–839. [DOI] [PubMed] [Google Scholar]
- 27.De A, Sun H, Emery DJ, Butcher KS, Wilman AH. Rapid quantitative susceptibility mapping of intracerebral hemorrhage. J Magn Reson Imaging. 2020;51:712–718. [DOI] [PubMed] [Google Scholar]
- 28.Straub S, Laun FB, Emmerich J, et al. Potential of quantitative susceptibility mapping for detection of prostatic calcifications. J Magn Reson Imaging. 2017;45:889–898. [DOI] [PubMed] [Google Scholar]
- 29.Chen W, Gauthier SA, Gupta A, et al. Quantitative susceptibility mapping of multiple sclerosis lesions at various ages. Radiology. 2014;271:183–192. [DOI] [PMC free article] [PubMed] [Google Scholar]
- 30.Weber AM, Pukropski A, Kames C, et al. Pathological insights from quantitative susceptibility mapping and diffusion tensor imaging in ice hockey players pre and post-concussion. Front Neurol. 2018:9:575. [DOI] [PMC free article] [PubMed] [Google Scholar]
- 31.Fan AP, Khalil AA, Fiebach JB, et al. Elevated brain oxygen extraction fraction measured by MRI susceptibility relates to perfusion status in acute ischemic stroke. J Cereb Blood Flow Metab. 2020:40:539–551. [DOI] [PMC free article] [PubMed] [Google Scholar]
- 32.Vaas M, Deistung A, Reichenbach JR, Keller A, Kipar A, Klohs J. Vascular and tissue changes of magnetic susceptibility in the mouse brain after transient cerebral ischemia. Transl Stroke Res. 2018;9:426–435. [DOI] [PMC free article] [PubMed] [Google Scholar]
- 33.Hsieh MC, Tsai CY, Liao MC, Yang JL, Su CH, Chen JH. Quantitative susceptibility mapping-based microscopy of magnetic resonance venography (QSM-mMRV) for in vivo morphologically and functionally assessing cerebromicrovasculature in rat stroke model. PLoS One. 2016;11:e0149602. [DOI] [PMC free article] [PubMed] [Google Scholar]
- 34.Uwano I, Kudo K, Sato R, et al. Noninvasive assessment of oxygen extraction fraction in chronic ischemia using quantitative susceptibility mapping at 7 Tesla. Stroke. 2017;48:2136–2141. [DOI] [PubMed] [Google Scholar]
- 35.Jain V, Abdulmalik O, Propert KJ, Wehrli FW. Investigating the magnetic susceptibility properties of fresh human blood for non-invasive oxygen saturation quantification. Magn Reson Med. 2012;68:863–867. [DOI] [PMC free article] [PubMed] [Google Scholar]
- 36.Spees WM, Yablonskiy DA, Oswood MC, Ackerman JJ. Water proton MR properties of human blood at 1.5 Tesla: Magnetic susceptibility, T(1), T(2). T*(2), and non-Lorentzian signal behavior. Magn Reson Med. 2001:45:533–542. [DOI] [PubMed] [Google Scholar]
- 37.Liu S, Levine SR, Winn HR. Targeting ischemic penumbra: Part I—From pathophysiology to therapeutic strategy. J Exp Stroke Transl Med. 2010:3:47–55. [DOI] [PMC free article] [PubMed] [Google Scholar]
- 38.Paciaroni M, Caso V, Agnelli G. The concept of ischemic penumbra in acute stroke and therapeutic opportunities. Eur Neurol. 2009:61:321–330. [DOI] [PubMed] [Google Scholar]
- 39.Christoforidis GA, Rink C, Kontzialis MS, et al. An endovascular canine middle cerebral artery occlusion model for the study of leptomeningeal collateral recruitment. Invest Radiol. 2011:46:34–40. [DOI] [PMC free article] [PubMed] [Google Scholar]
- 40.Bang OY, Saver JL, Buck BH, et al. Impact of collateral flow on tissue fate in acute ischaemic stroke. J Neurol Neurosurg Psychiatry. 2008;79:625–629. [DOI] [PMC free article] [PubMed] [Google Scholar]
- 41.Nicoli F, Lafaye de Micheaux P, Girard N. Perfusion-weighted imaging-derived collateral flow index is a predictor of MCA M1 recanalization after i.v. thrombolysis. AJNR Am J Neuroradiol. 2013;34:107–114. [DOI] [PMC free article] [PubMed] [Google Scholar]
- 42.Christoforidis GA, Mohammad Y, Kehagias D, Avutu B, Slivka AP. Angiographic assessment of pial collaterals as a prognostic indicator following intra-arterial thrombolysis for acute ischemic stroke. AJNR Am J Neuroradiol. 2005;26:1789–1797. [PMC free article] [PubMed] [Google Scholar]
- 43.Carroll TJ, Horowitz S, Shin W, et al. Quantification of cerebral perfusion using the “bookend technique”: An evaluation in CNS tumors. Magn Reson Imaging. 2008;26:1352–1359. [DOI] [PMC free article] [PubMed] [Google Scholar]
- 44.Sakaie KE, Shin W, Curtin KR, McCarthy RM, Cashen TA, Carroll TJ. Method for improving the accuracy of quantitative cerebral perfusion imaging. J Magn Reson Imaging. 2005. ;21:512–519. [DOI] [PubMed] [Google Scholar]
- 45.Shin W, Horowitz S, Ragin A, Chen Y, Walker M, Carroll TJ. Quantitative cerebral perfusion using dynamic susceptibility contrast MRI: Evaluation of reproducibility and age- and gender-dependence with fully automatic image postprocessing algorithm. Magn Reson Med. 2007;58:1232–1241. [DOI] [PubMed] [Google Scholar]
- 46.de Rochefort L, Liu T, Kressler B, et al. Quantitative susceptibility map reconstruction from MR phase data using Bayesian regularization: Validation and application to brain imaging. Magn Reson Med. 2010;63:194–206. [DOI] [PubMed] [Google Scholar]
- 47.Liu T, Xu W, Spincemaille P, Avestimehr AS, Wang Y. Accuracy of the morphology enabled dipole inversion (MEDI) algorithm for quantitative susceptibility mapping in MRI. IEEE Trans Med Imaging. 2012;31:816–824. [DOI] [PMC free article] [PubMed] [Google Scholar]
- 48.Deistung A, Schweser F, Reichenbach JR. Overview of quantitative susceptibility mapping. NMR Biomed. 2017;30. 10.1002/nbm.3569. [DOI] [PubMed] [Google Scholar]
- 49.Bioucas-Dias JM, Valadao G. Phase unwrapping via graph cuts. IEEE Trans Image Process. 2007;16:698–709. [DOI] [PubMed] [Google Scholar]
- 50.Dong J, Liu T, Chen F, et al. Simultaneous phase unwrapping and removal of chemical shift (SPURS) using graph cuts: Application in quantitative susceptibility mapping. IEEE Trans Med Imaging. 2015;34:531–540. [DOI] [PubMed] [Google Scholar]
- 51.Zhou D, Liu T, Spincemaille P, Wang Y. Background field removal by solving the Laplacian boundary value problem. NMR Biomed. 2014;27:312–319. [DOI] [PubMed] [Google Scholar]
- 52.Jeong YICG, Saadat N, Kawaji K, Cantrell CG, Roth S. Niekrasz Carroll TJ. Automatic measurement of infarct volume and prediction by pial collaterals in experimental acute ischemic stroke. In Proceedings of the 27th Annual Meeting of ISMRM, Montréal, Québec, Canada, 2019. Abstract 7163. [Google Scholar]
- 53.Kang B-T, Lee J-H, Jung D-I, et al. Canine model of ischemic stroke with permanent middle cerebral artery occlusion: Clinical and histopathological findings. J Vet Sci. 2007;8:369–376. [DOI] [PMC free article] [PubMed] [Google Scholar]
- 54.Evans HE, DeLahunta A. Miller’s Anatomy of the Dog. 4th ed. St. Louis. MO: Elsevier; 2013: xix, 850 pages. [Google Scholar]
- 55.Garosi L, McConnell JF, Platt SR, et al. Clinical and topographic magnetic resonance characteristics of suspected brain infarction in 40 dogs. J Vet Intern Med. 2006:20:311–321. [DOI] [PubMed] [Google Scholar]
- 56.Giannuzzi AP, De Simone A, Ricciardi M, Gernone F. Presumptive ischemic brain infarction in a dog with Evans’ syndrome. Case Rep Vet Med. 2014;2014:456e524. [Google Scholar]
- 57.Vandevelde M, Higgins RJ, Oevermann A. Veterinary Neuropathology: Essentials of Theory and Practice. Chichester, UK: Wiley-Blackwell; 2012. [Google Scholar]
- 58.Robinson TG, James M, Youde J, Panerai R, Potter J. Cardiac baroreceptor sensitivity is impaired after acute stroke. Stroke. 1997;28:1671–1676. [DOI] [PubMed] [Google Scholar]