Abstract
Fluorescence in situ hybridization (FISH) with horseradish peroxidase (HRP)-labeled oligonucleotide probes and tyramide signal amplification, also known as catalyzed reporter deposition (CARD), is currently not generally applicable to heterotrophic bacteria in marine samples. Penetration of the HRP molecule into bacterial cells requires permeabilization procedures that cause high and most probably species-selective cell loss. Here we present an improved protocol for CARD-FISH of marine planktonic and benthic microbial assemblages. After concentration of samples onto membrane filters and subsequent embedding of filters in low-gelling-point agarose, no decrease in bacterial cell numbers was observed during 90 min of lysozyme incubation (10 mg ml−1 at 37°C). The detection rates of coastal North Sea bacterioplankton by CARD-FISH with a general bacterial probe (EUB338-HRP) were significantly higher (mean, 94% of total cell counts; range, 85 to 100%) than that with a monolabeled probe (EUB338-mono; mean, 48%; range, 19 to 66%). Virtually no unspecific staining was observed after CARD-FISH with an antisense EUB338-HRP. Members of the marine SAR86 clade were undetectable by FISH with a monolabeled probe; however, a substantial population was visualized by CARD-FISH (mean, 7%; range, 3 to 13%). Detection rates of EUB338-HRP in Wadden Sea sediments (mean, 81%; range, 53 to 100%) were almost twice as high as the detection rates of EUB338-mono (mean, 44%; range, 25 to 71%). The enhanced fluorescence intensities and signal-to-background ratios make CARD-FISH superior to FISH with directly labeled oligonucleotides for the staining of bacteria with low rRNA content in the marine environment.
Fluorescence in situ hybridization (FISH) of bacteria was first described more than a decade ago (2, 11) and was hailed as a breakthrough for microbial ecology. However, researchers initially encountered difficulties in applying the method to environmental samples other than from highly eutrophic systems. Most bacteria in aquatic habitats are small, slow growing, or starving (31), and the signal intensities of hybridized bacterioplankton cells were frequently below the detection limits or lost in high background fluorescence. During the last few years numerous efforts have been made to increase the sensitivity of FISH, including the use of brighter fluorochromes (1, 19), image-intensified video microscopy (17), chloramphenicol treatment to increase the rRNA content of the growing bacterial fraction (35), hybridization with more than one fluorescently labeled oligonucleotide probe (27, 29), helper oligonucleotide probes (15, 21), multiply labeled polyribonucleotide probes (10, 25, 36), and signal amplification with reporter enzymes (27, 40).
The tyramide signal amplification (TSA), also known as catalyzed reporter deposition (CARD) was introduced more than a decade ago (5) for immunoblotting and immunosorbent assays using horseradish peroxidase (HRP) and haptenized tyramines. CARD is based on the deposition of a large number of labeled tyramine molecules by peroxidase activity. Tyramines are phenolic compounds, and HRP can catalyze dimerization of such compounds when they are present in high concentrations, probably by the generation of free radicals (49). If applied at lower concentrations, such as in the signal amplification reaction, the probability of dimerization is reduced, whereas the binding of the highly reactive intermediates to electron-rich moieties of proteins, such as tyrosine, at or near the site of the peroxidase binding site is favored. In this way, if fluorochrome-labeled tyramides are used, numerous fluorescent molecules can be introduced at the hybridization site in situ. This results in greatly enhanced FISH sensitivity compared to probes with a single fluorochrome. CARD in combination with nucleotide probes and/or antibodies is routinely used in histology and cytochemistry to localize specific nucleic acid sequences (DNA and RNA) in microscopic preparations of tissues, cells, and chromosomes and allows the detection of rare and even single-copy-number targets (mRNAs and genes) (6). To date, a wide variety of research and diagnostic applications have been described, making this technique an integral part of studies of gene mapping, gene expression, RNA processing and transport, the three-dimensional organization of the nucleus, tumor genetics, microbial infections, and prenatal diagnosis (43).
Unfortunately, this signal amplification technique is currently not applicable to heterotrophic bacteria in environmental samples (40). The critical step of this approach is the diffusion of large molecules such as enzymes, antibodies, or (strept)avidin into whole fixed cells (4). It is usually necessary to include a very carefully controlled permeabilization step prior to enzymatic signal amplification, balancing permeability with cellular integrity (41). Since cell wall composition varies greatly among prokaryotes, such procedures usually compromise the universal applicability of this approach in mixed microbial communities (40).
In this study, we modified preparation and permeabilization procedures, as well as staining protocols for FISH with HRP-labeled oligonucleotide probes and CARD, for the quantification of planktonic and benthic marine bacteria. This led to a significant improvement in detection rates compared to our current protocol for FISH with monolabeled probes (37).
MATERIALS AND METHODS
Sample collection and preparation.
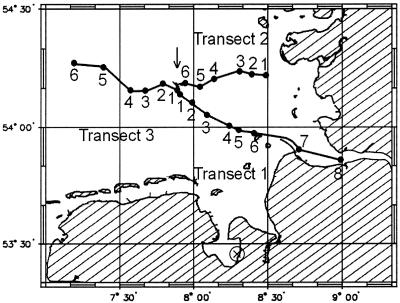
Bacterioplankton samples originated from a cruise on the RV Uthörn between 1 and 3 October 1999. On three consecutive days, samples were collected from horizontal transects between the island of Helgoland and the estuaries of the rivers Elbe and Eider, respectively (days 1 and 2) and from Helgoland into open North Sea waters (day 3) (Fig. 1). Samples were fixed for 1 h in particle-free formaldehyde solution (final concentration, 2% [vol/vol]) and were prefiltered through cellulose nitrate membrane filters (pore size, 3 μm; Sartorius, Göttingen, Germany). For FISH, 10-ml portions were filtered onto white polycarbonate membrane filters (type GTTP; pore size, 0.2 μm; size, 47 mm; Millipore, Eschborn, Germany), washed with 5 ml of distilled water, and stored at −20°C until further processing. Additional subsamples (2 ml) were placed in reaction vials and stored at −20°C for flow cytometric determination of total cell counts.
FIG. 1.
Map of the German Bight of the North Sea indicating the sampling locations along the three transects (numbers) and the site of sediment sampling (⊗). The arrow points to the location of the island of Helgoland.
Sediment samples were collected on 20 February 2001 from a near-shore intertidal mud flat at Dangast, located in the Jadebusen Bay of the German Wadden Sea. Sediment cores were sliced into 0.5-cm sections and fixed in 4% (vol/vol) formaldehyde solution. Subsamples were diluted, sonicated, and filtered onto white membrane filters (type GTTP; pore size, 0.2 μm; size, 25 mm; Millipore) as described previously (37).
Total cell counts.
Total picoplankton cell numbers in the <3-μm water fraction were determined flow cytometrically as described previously (12). For quantification of potential cell loss during lysozyme treatment (see below), plankton samples were filtered onto polycarbonate filters (type GTTP; diameter, 25 mm; pore size, 0.2 μm; Millipore) by using a gentle vacuum and cellulose nitrate support filters (pore size, 0.45 μm; Sartorius) to optimize the distribution of cells on the filters. Filters were subsequently washed twice with 5 ml of ultrapure water (MQ; Millipore). Next, the filters were (i) either embedded in agarose (see below) or left unembedded; (ii) treated with lysozyme for 0, 40, or 90 min; and (iii) hybridized with the HRP-labeled probe EUB338 (2) as described below. All preparations were done in triplicate.
FISH with Cy3-labeled oligonucleotide probes.
Sections of filters were hybridized with the probes EUB338, NON338 (3), ROS537 (14), and SAR86-1249 (13) as described previously (19). Oligonucleotides labeled with the cyanin dye Cy3 were purchased from ThermoHybaid (Interactiva Division, Ulm, Germany).
Sample prozessing for hybridization with HRP-labeled probes.
A detailed protocol of all steps of sample processing for CARD-FISH is given in Table 1. To avoid cell loss during cell wall permeabilization, filters were dipped in low-gelling-point agarose (0.2% [wt/vol] in MQ [MetaPhor Bioproducts, Rockland, Maine]), dried face up on glass slides at 35°C, and subsequently dehydrated in 96% (vol/vol) ethanol for 1 min. To inhibit endogenous peroxidases, samples from Wadden Sea sediment were treated overnight with 0.1% (wt/vol) active diethyl pyrocarbonate (Fluka, Taufkirchen, Germany) in phosphate-buffered saline (PBS; 145 mM NaCl, 1.4 mM NaH2PO4, 8 mM Na2HPO4 [pH 7.4]) at 37°C. For cell wall permeabilization, filters were incubated in a lysozyme solution (10 mg ml−1 in 0.05 M EDTA, 0.1 M Tris-HCl [pH 7.5]; Fluka) at 37°C for at least 30 min. The sections were washed with MQ, dehydrated with 96% ethanol, dried at room temperature, and subsequently stored in petri dishes at −20°C until further processing.
TABLE 1.
Summary of steps for FISH and CARD of marine bacteria
| Stage | Step no. | Descriptiona |
|---|---|---|
| Embedding | 1 | Prepare subsamples on membrane filters (37). |
| 2 | Dip filters in 0.2% low-gelling-point agarose; place filters face up onto glass slides and air dry at 35°C. | |
| 3 | Dehydrate filters in 96% ethanol (1 min, RT). | |
| 4 | Air dry filters.b | |
| Permeabilization and inactivation of peroxidases | 5 6 7 | Incubate in lysozyme (37°C, >30 min). Sediment samples: incubate them in 0.1% active diethyl pyrocarbonate in PBS (37°C, overnight). Wash filters twice in MQ (1 min, RT). |
| 8 | Wash filters in 96% ethanol (1 min, RT). | |
| 9 | Air dry filters.b | |
| Hybridization | 10 | Cut filters into sections. |
| 11 | Place sections in reaction vial (0.5 ml, 10 to 20 sections per vial). | |
| 12 | Mix 400 μl of hybridization buffer and 4 μl of probe working solution, and add to filter sections. | |
| 13 | Incubate filters at 35°C for at least 2 h. | |
| 14 | Wash filters in prewarmed washing buffer (10 min, 37°C); do not air dry filter sections after washing them. | |
| Tyramide signal amplification | 15 16 | Remove excess liquid with blotting paper but do not let the filters run dry. Incubate filters in 1× PBS amended with 0.05% of Triton X-100 (50 ml, RT, 15 min, mild agitation). |
| 17 | Dab filters on blotting paper but do not let them run dry. | |
| 18 | Incubate filters in substrate mix (1 part Cy3-tyramide, 10 parts of amplification diluent) (RT, 10 min, in the dark). | |
| 19 | Dab filter on blotting paper. | |
| 20 | Wash filter for 15 min as described in step 16. | |
| 21 | Wash filter in 10 ml of MQ (RT, 1 min). | |
| 22 | Wash filter in 10 ml of 96% ethanol (RT, 1 min). | |
| 23 | Air dry preparations.b | |
| 24 | Counterstain filters with DAPI.b |
RT, room temperature.
Preparations may be stored at −20°C for several days to weeks without an apparent loss in signal.
FISH with HRP-labeled oligonucleotide probes.
For FISH with the probes EUB338, NON338, ROS537, and SAR86-1249 labeled with HRP, 10 to 20 filter sections were placed in a 0.5-ml reaction vial. Then, 400 μl of hybridization buffer (0.9 M NaCl, 20 mM Tris-HCl [pH 7.5], 10% dextran sulfate [wt/vol], 0.02% [wt/vol] sodium dodecyl sulfate [SDS], 55% [vol/vol] formamide [Fluka], 1% [wt/vol] Blocking Reagent [Boehringer, Mannheim, Germany], 0.5 mg of salmon sperm DNA [Boehringer] ml−1, 0.5 mg of Escherichia coli tRNA [Boehringer]ml−1) and 4 μl of HRP probe working solution (50 ng μl−1; ThermoHybaid) were pipetted onto the filter sections. The reaction vial was incubated at 35°C for 2 h, and the filter sections were removed from the hybridization mixture and incubated in 50 ml of prewarmed washing buffer (3 mM NaCl, 5 mM EDTA [pH 8.0], 20 mM Tris-HCl [pH 7.5], 0.01% [wt/vol] SDS) at 37°C for 10 min. A formamide concentration of 55% was used for all probes. The hybridization buffer was prepared as follows: dextran sulfate, NaCl, SDS, and Tris-HCl were mixed, brought into solution at 60°C, and subsequently cooled on ice. Formamide, Blocking Reagent, salmon sperm DNA, and E. coli tRNA were then added. The hybridization buffer was then stored at −20°C for up to 3 months without any apparent effects on FISH detection rates.
In situ detection of HRP-conjugated oligonucleotide probes.
To equilibrate the probe-delivered HRP, sections were placed in 10 ml of 1× PBS amended with 0.05% of Triton X-100 for 15 min at room temperature. To remove excess buffer, the filter sections were dabbed onto blotting paper and immediately transferred to a substrate mix containing 1 part of tyramide-Cy3 and 10 parts of amplification buffer (TSAdirect; NEN Life Science Products, Boston, Mass.) and incubated for 10 min at room temperature in the dark. Filter sections were then briefly placed on blotting paper to remove excess tyramide-Cy3 and washed at room temperature in the dark in 10 ml of 1× PBS amended with 0.05% of Triton X-100, MQ, and 96% ethanol, respectively. To decrease background fluorescence, sections were subsequently washed in MQ and 96% ethanol for 1 min. Afterward, filter sections were air dried and stored at −20°C until further processing (within 2 days).
In order to test whether a higher substrate concentration would increase detectability, a concentration series of tyramide-Cy3 was performed at the following dilutions (parts of tyramide-Cy3:parts of amplification buffer): 1:200, 1:100, 1:50, 1:20, and 1:10.
Microscopic evaluation.
Filter sections were covered in mountant (5.5 parts of Citifluor [Citifluor, Ltd., London, United Kingdom], 1 part of VectaShield [Vector Laboratories, Burlingame, Calif.], and 0.5 parts of 1× PBS amended with DAPI [4′,6′-diamidino-2-phenylindole] at a final concentration of 1 μg ml−1]) and evaluated on a Zeiss Axioplan microscope (Carl Zeiss, Jena, Germany), equipped with an HBO 100-W Hg vapor lamp, appropiate filter sets for Cy3 and DAPI fluorescence (20), and a 100× Plan Apochromat objective. Between 600 and 800 DAPI-stained objects were counted per sample.
Statistical evaluation.
Statistical evaluation was carried out with the software STATISTICA (v.5.0; StatSoft, Tulsa, Okla.). We tested whether the percentage of DAPI counts detected by probe EUB338 and CARD-FISH were different from those detected with monolabeled EUB338 in plankton and sediment samples. The Wilcoxon matched pair test was used as a nonparametric alternative to the Student's t test for dependent samples.
RESULTS
Optimization of sample pretreatment, hybridization, and substrate reaction for CARD-FISH.
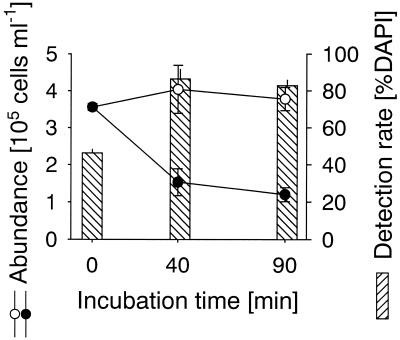
Initial experiments for method development were carried out with an HRP-labeled oligonucleotide probe targeting Bacteria (EUB338) and surface bacterioplankton samples from the North Sea. To optimize the permeabilization of bacterial cell walls, different chemicals and enzymes, such as SDS, formamide, Triton X-100, acetone, proteinase K, and lysozyme, were examined. The latter showed the best results with respect to detection rate and was therefore used for CARD-FISH. In order to quantify potential cell loss, a lysozyme incubation time series was performed. We could not detect significant cell loss (DAPI total counts) in agarose-embedded samples even after 90 min of lysozyme treatment (Fig. 2). In contrast, a strong decline in cell numbers was observed in samples that were not embedded. After 90 min of lysozyme incubation, two-thirds of the cells were lost, i.e., had detached from the filters or were disrupted beyond DAPI detectability. Samples that were not treated with lysozyme showed lower detection rates and hybridization signals after CARD-FISH. Detection rates of a EUB338-HRP with CARD increased from (46±2)% of DAPI-stained cells in the unpermeabilized samples to (86±5)% after 40 min of permeabilization (Fig. 2).
FIG. 2.
Lines and symbols indicate the abundances of bacterioplankton cells on membrane filters during incubation with lysozyme (10 mg ml−1 at 37°C) with or without embedding in low-gelling-point agarose. Bars indicate the percent FISH detection rates with an HRP-labeled probe and CARD in embedded samples. The error bars indicate either standard deviations (abundances) or total ranges (percentages) of triplicates. Symbols: ▧, EUB338-HRP; ○, agarose embedding (DAPI); •, not embedded (DAPI).
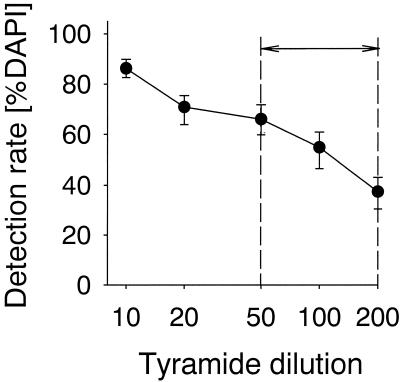
At the probe concentrations recommended by many FISH protocols (2 to 5 ng μl−1) (19), we observed numerous unspecific fluorescent deposits after CARD-FISH. In order to decrease background, we lowered the probe concentration 10-fold (48). This resulted in the elimination of nonspecific deposits of Cy3-tyramide without decreasing the signal intensities or detection rates (data not shown). We also varied the tyramide concentration in the substrate mix for TSA (Fig. 3). At the tyramide dilutions recommended by the manufacturer (1:50 to 1:200), we could detect only 37 to 66% of the DAPI-stained cells (Fig. 3). After we increased the tyramide concentration to 1:10 and 1:20, the abundances of probe-positive cells increased to 86 and 71% of the DAPI-stained cells, respectively, without a substantial increase in background fluorescence. Tyramide concentrations higher than 1:10 resulted in a high background fluorescence (data not shown). A prolonged hybridization period also positively influenced the detection rates (Table 2), yet hybridization periods longer than 2 h did not further raise detection rates (data not shown). For subsequent quantification of North Sea bacterioplankton and Wadden Sea bacteriobenthos by CARD-FISH, we used the optimal set of conditions as determined in our earlier experiments (see also Table 1).
FIG. 3.
FISH detection rates with HRP-labeled probes and CARD at increasing dilution of tyramide substrate in plankton samples. The numbers on the x axis indicate parts of amplification diluent added to one part of tyramide-Cy3. The arrow indicates the range of tyramide concentrations recommended by the manufacturer. The error bars show the ranges of triplicate experiments.
TABLE 2.
Detection rates of bacterioplankton by FISH with HRP-labeled probes and CARD after 1.5 and 2.0 h of hybridization, respectively, and by FISH with Cy3-monolabeled probesa
| Probe (hybridization period [h]) | Label | Detection rate (% DAPI)
|
|
|---|---|---|---|
| Mean | Range | ||
| EUB338 (1.5) | HRP | 81.3 | 55.0-99.6 |
| EUB338 (2.0) | HRP | 93.8 | 84.9-100.0 |
| EUB338 | Cy3 | 47.8 | 19.4-66.2 |
| ROS537 | HRP | 4.7 | 1.9-7.2 |
| ROS537 | Cy3 | 4.6 | 2.4-7.1 |
| SAR86 | HRP | 7.4 | 2.9-13.2 |
| SAR86 | Cy3 | NDb | |
| NON338 | HRP | ND | |
EUB338, most bacteria; SAR86-1249, members of the SAR86 clade; ROS537, members of the Roseobacter clade; NON338, EUB338 antisense probe.
ND, not detectable (<1 positive cell in 10 microscopic fields).
We also tested whether our setup allowed specific discrimination of microbes with a one-base mismatch at the probe target site. We hybridized a pure culture of a Pseudoalteromonas sp. strain (γ-proteobacteria) with the oligonucleotide probes Bet42a (β-proteobacteria) and Gam42a (γ-proteobacteria) (3). No nonspecific FISH staining of the strain by probe Bet42a was observed (data not shown).
Quantification of cells in environmental samples.
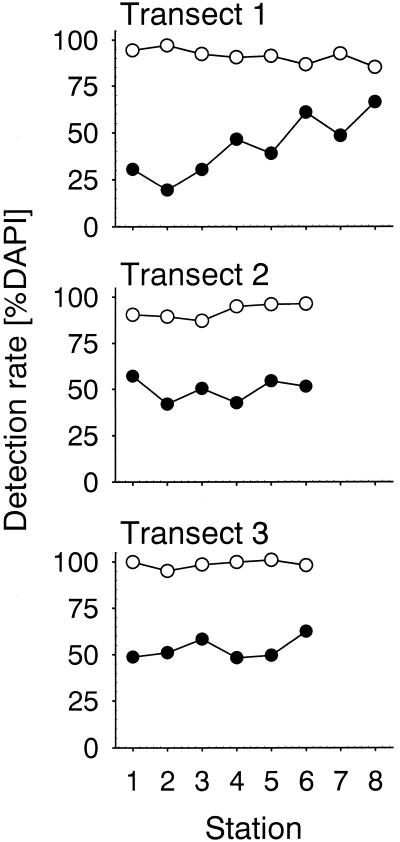
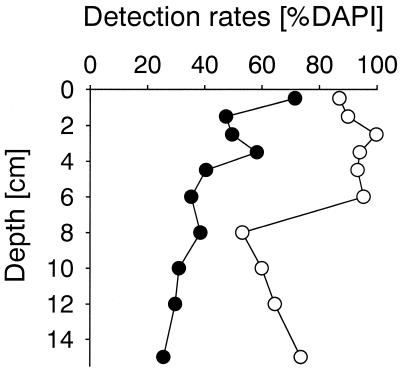
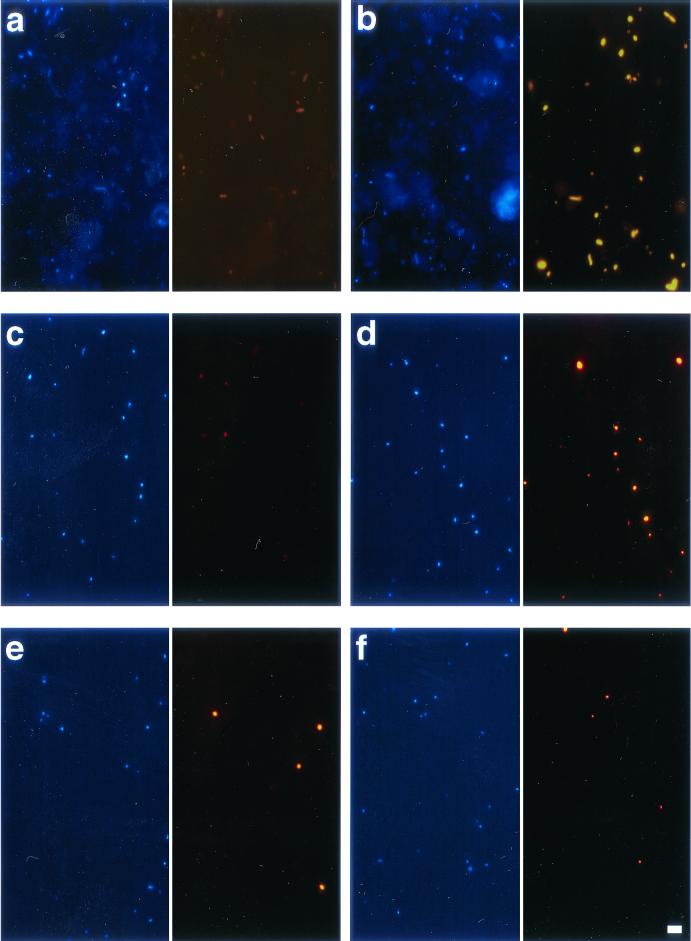
The densities of heterotrophic picoplankton in 3-μm prefiltered water along the three transects ranged between 1.7 × 10⁵ and 9.9 × 10⁵ cells ml−1, and abundances were highest in samples that were closest to the coast (Table 3). In all of these samples, bacterial cells detectable by FISH with EUB338-HRP accounted for most (mean, 94%; range, 85 to 100%) of the DAPI-stained cells (Fig. 4). The detection rates with monolabeled EUB338-Cy3 were significantly lower (mean, 48%; range, 19 to 66%; n = 20; P < 0.001) (Fig. 4). A highly significant difference in detection rates was also observed in Wadden Sea sediment samples from February 2001 (n = 10, P < 0.01) (Fig. 5). In the permanently mixed upper sediment layers (0 to 6 cm), cell densities determined with EUB338-HRP (mean, 93%; range, 87 to 100%) were almost twice as high as cell densities determined by EUB338-Cy3 (mean, 51%; range, 35 to 72%). In the deeper layers the detection rates obtained with both EUB338-HRP (mean, 63%; range, 53 to 74%) and EUB338-Cy3 (mean, 31%; range, 26 to 39%) were lower than those in the upper layers. In samples from both the water column and the sediment, the fluorescence intensities of single cells and the signal-to-background ratios were much greater with HRP-labeled probes than with monolabeled probes (Fig. 6). Consequently, the discrimination between probe-positive and probe-negative cells was much easier with HRP-labeled probes, and therefore quantification was much faster than with singly labeled probes.
TABLE 3.
Cell numbers of heterotrophic picoplankton in 3-μm prefiltered surface water from the German Bight obtained along three transects in October 1999
| Station | Abundance (105 cells ml−1) in transect:
|
||
|---|---|---|---|
| 1 | 2 | 3 | |
| 1 | 4.5 | 6.5 | 2.8 |
| 2 | 4.2 | 6.3 | 1.7 |
| 3 | 2.5 | 5.1 | 2.4 |
| 4 | 6.0 | 3.2 | 2.6 |
| 5 | 6.2 | 3.2 | 2.5 |
| 6 | 6.0 | 2.1 | 2.3 |
| 7 | 9.9 | ||
| 8 | 5.6 | ||
FIG. 4.
Comparison of detection rates by FISH with a Cy3-monolabeled general bacterial probe (EUB338) and CARD-FISH with an HRP-labeled probe along three transects in North Sea surface water samples obtained in October 1999. Symbols: ○, EUB338-HRP, •, EUB338-mono.
FIG. 5.
Comparison of detection rates by FISH with a Cy3-monolabeled general bacterial probe (EUB338) and CARD-FISH with an HRP-labeled probe in Wadden Sea sediment samples obtained in February 2001. Symbols: ○, EUB338-HRP, •, EUB338-mono.
FIG. 6.
Photomicrographs of FISH-stained marine bacteria. Each double panel depicts DAPI staining in blue (left) and probe staining in red (right). Exposure times for images of FISH staining with Cy3-monolabeled probes (FISH-mono) were 10 times those for CARD-FISH staining. (a to d) FISH with the general bacterial probe EUB338: sediment, FISH-mono (a); sediment, CARD-FISH (b); plankton, FISH-mono (c); plankton, CARD-FISH (d). (e) Plankton, CARD-FISH with ROS537, specific for members of the Roseobacter lineage. (f) Plankton, CARD-FISH with SAR86-1249, specific for members of the SAR86 clade. Scale bar, 10 μm.
For the determination of the nonspecific binding of HRP-labeled probes and nonspecific substrate precipitation by endogenous peroxidases and/or pseudoperoxidase activities, all samples were also hybridized with an antisense EUB338, NON338-HRP. We found no probe-positive cells in the transect samples (20 samples, 10 microscopic fields inspected per sample) and four probe-positive cells in all of the sediment samples (10 samples, 10 microscopic fields inspected per sample).
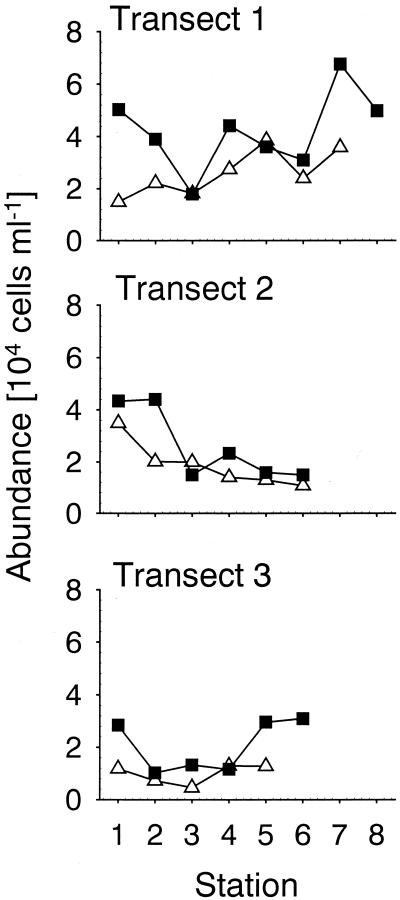
In samples from the transect the detection rates of members of the Roseobacter group with either CARD-FISH or a Cy3-monolabeled probe were statistically indistinguishable (n = 20, P = 0.84) (Table 2), and both techniques stained a morphologically homogeneous cell population of 0.5 × 10⁵ to 3.9 × 10⁵ cells ml−1 (Fig. 6 and 7). The highest Roseobacter abundances were found nearest to the coast, and this group closely followed the patterns of total cell numbers (Spearman rank correlation, n = 20, r = 0.89, P < 0.001) (Fig. 7 and Table 2). By using a Cy3-monolabeled probe specific for members of the SAR86 clade (13), we could not detect any stained cells. In contrast, the relative abundances of up to 13% of the DAPI counts could be observed after CARD-FISH with an HRP-labeled probe, and SAR86 exhibited a pronounced fluctuation in cell numbers across the three transects (Fig. 7 and Table 2). Cells detected with probe SAR86-1249-HRP were morphologically uniform (Fig. 6)
FIG. 7.
Abundances of members of the SAR86 (probe SAR86-1249) and Roseobacter (probe ROS537) clades, with specific HRP-labeled probes and CARD-FISH along three transects in surface water samples from the North Sea obtained in October 1999. Symbols: ▵, ROS537-HRP; ▪, SAR86-1249-HRP.
We also tested our protocol on samples from Monterey Bay, Calif. (depth profile, 0 to 200 m). At a depth below 50 m, the densities of positive cells after CARD-FISH were comparable to those from hybridizations with a multiply labeled polyribonucleotide probe targeted to Bacteria (10, 36), whereas only a few cells were detectable with Cy3-monolabeled probes (data not shown).
DISCUSSION
In this study, we modified and extended existing protocols by using HRP-labeled oligonucleotides and CARD for the identification of single prokaryotic cells. The combination of several small but significant modifications (Table 1) allowed a substantial increase of FISH sensitivity in marine bacterioplankton and bacteriobenthos compared to that observed in previous reports (27, 40). The attachment of cells onto polycarbonate filters with freshly prepared low-gelling-point agarose was found to be crucial for preventing cell loss during a permeabilization step that was required for high FISH detection rates (Fig. 2). Lowering the probe concentration 10-fold helped to eliminate high background fluorescence without loss of signal intensity of the specifically stained cells, and increasing the tyramide concentration also resulted in significantly increased detection (Fig. 3). Negative controls without probe or with probe NON338-HRP consistently yielded very few or no fluorescently labeled cells. A potential future improvement of the method might aim at lowering the required tyramide concentration, e.g., by increasing the temperature during signal amplification (A. Pernthaler, unpublished data).
By using our CARD-FISH protocol, we were able to detect the majority of DAPI-stained cells in plankton samples, suggesting that the permeabilization procedure is sufficient for most bacteria in North Sea surface waters and for surface Wadden Sea sediments. However, the protocol was not specifically tested for either archaea, planctomyces, or gram-positive bacteria, which may be present in the marine environment (9, 13, 16, 25, 38), and our permeabilization strategy might not be adequate for the detection of these groups (47). Our results are consistent with previously reported low abundances of marine archaea in coastal surface waters during autumn, as determined by other techniques (33, 36), and currently there is no evidence that Actinobacteria occur in high densities in the marine plankton. The comparatively low CARD-FISH detection rates in the permanently stratified, deeper layers of Wadden Sea sediments (Fig. 5) might be due to the presence of inadequately permeabilized Archaea or Actinobacteria or to other groups that are not targeted by the bacterial probe EUB338, such as Planctomycetales or Veruccomicrobiales (8). Alternatively, higher relative abundances of dead or empty cells (23) might also be present in deeper sediment layers.
It has been shown in pure cultures that FISH reliably detects subpopulations with higher rRNA contents but may miss nongrowing or starving cells (12, 34). Since only a fraction of bacteria in the marine pelagic environment is growing (18, 26, 28), FISH counts with monolabeled probes may not show the true abundances of particular target organisms in oligotrophic environments (36). In fact, whole populations of particular taxa, such as members of the ubiquitous marine SAR86 clade (32), may remain completely undetected by FISH with directly Cy3-labeled probes (Table 2). SAR86 has been shown to be abundant in different marine surface waters (7, 22, 44). Members of this lineage could be detected in coastal North Sea surface plankton during summer, when FISH detection rates with monolabeled probes exceeded 70%, but not in the spring, autumn, or winter samples (13). In contrast, a substantial population was readily visualized and quantified by CARD-FISH even in October (Fig. 6 and 7). Microbes belonging to SAR86 are apparently not reliably detected with monolabeled fluorescent probes. This conclusion is also supported by the complete absence of SAR86 in only some of the stations along a coastal transect in the Pacific Ocean (7).
The application of single monolabeled oligonucleotide FISH probes in the marine environment is, therefore, probably limited to surface waters and to particular productive regions, seasons, or sediments (30, 36, 42). In addition, it is sometimes hardly predictable if bacterial populations are detected only partially or quantitatively by this FISH approach. For example, members of the Roseobacter lineage could be adequately quantified both by singly labeled probes and by CARD-FISH (Fig. 7 and Table 2) even in plankton samples in which the general FISH detection rates were <50% of those for the DAPI-stained objects (Fig. 4).
Recently, multilabeled polyribonucleotide probes (10, 25, 36) have been introduced to overcome this limitation, and other techniques for the quantification of population sizes, such as the 5′-nuclease assay (45), are also unaffected by low bacterial activity. In many instances our protocol might provide a technically less demanding alternative to the above approaches. CARD-FISH could furthermore be attractive to researchers because an increasing number of well-tested oligonucleotide probes are available for different marine environments (13, 39, 50) and the design of new probes is relatively simple (37). In addition, there are well-established protocols for the conjugation of tyramine with fluorescent dyes at a fraction of the costs of the commercial products (24).
The potential of the CARD approach is not limited only to the staining of rRNAs. If whole fixed cells are made accessible for enzymes and/or antibodies, a wide range of methods routinely used in histology and cytology could also be applied in environmental microbiology, such as detection of mRNAs (47). Many mRNA species are present in abundances ranging from 1 to 1,000 copies per cell and therefore are not detectable for most nonradioactive in situ assays. Various CARD-FISH methods for the detection of mRNA in single cells might be developed, depending on the sample and the target copy number. For example, it is feasible to hybridize not only with oligonucleotide probes directly labeled with HRP but also with digoxigenin-labeled polynucleotide probes followed by an antibody reaction which delivers the HRP (6, 46, 47). Furthermore, tyramides with different types of haptens (both fluorescent and nonfluorescent) could be used for the signal amplification step. Haptens could be involved in another anti-hapten antibody reaction, and antibodies can again be labeled with HRP for a second (and a third) layer of CARD, allowing an increase in sensitivity of up to 1,000-fold (43). However, one should keep in mind that the size of the HRP alone is ca. 40,000 Da, and the size of this complex increases when it is linked to other molecules such as oligonucleotides or antibodies. This may again compromise diffusion through cell walls and membranes and may require major adaptations of permeabilization procedures (47).
In summary, we developed and explored a novel FISH protocol based on CARD and FISH with HRP-labeled oligonucleotides. This approach permits the detection of small marine bacteria with low ribosome content that are not or only barely detectable with monolabeled probes.
Acknowledgments
We thank M. Mussmann for providing sediment samples, G. Gerdts for organizing the North Sea cruise and help during sampling, and the crew of the RV Uthörn. V. T. Tempranillo is acknowledged for fruitful discussions.
This work was supported by the German Ministry of Education and Research (BMBF 01 LC0021/TP4) and by the Max Planck Society.
REFERENCES
- 1.Alfreider, A., J. Pernthaler, R. Amann, B. Sattler, F.-O. Glöckner, A. Wille, and R. Psenner. 1996. Community analysis of the bacterial assemblages in the winter cover and pelagic layers of a high mountain lake by in situ hybridization. Appl. Environ. Microbiol. 62:2138-2144. [DOI] [PMC free article] [PubMed] [Google Scholar]
- 2.Amann, R. I., L. Krumholz, and D. A. Stahl. 1990. Fluorescent-oligonucleotide probing of whole cells for determinative, phylogenetic, and environmental studies in microbiology. J. Bacteriol. 172:762-770. [DOI] [PMC free article] [PubMed] [Google Scholar]
- 3.Amann, R. I., W. Ludwig, and K. H. Schleifer. 1995. Phylogenetic identification and in situ detection of individual microbial cells without cultivation. Microbiol. Rev. 59:143-169. [DOI] [PMC free article] [PubMed] [Google Scholar]
- 4.Amann, R. I., B. Zarda, D. A. Stahl, and K. H. Schleifer. 1992. Identification of individual prokaryotic cells by using enzyme-labeled, rRNA-targeted oligonucleotide probes. Appl. Environ. Microbiol. 58:3007-3011. [DOI] [PMC free article] [PubMed] [Google Scholar]
- 5.Bobrow, M. N., T. D. Harris, K. J. Shaughnessy, and G. J. Litt. 1989. Catalyzed reporter deposition, a novel method of signal amplification: application to immunoassays. J. Immunol. Methods 125:279-285. [DOI] [PubMed] [Google Scholar]
- 6.Braissant, O., and W. Wahli. 1998. A simplified in situ hybridization protocol using non-radioactively labeled probes to detect abundant and rare mRNAs on tissue sections. Biochemica 1:10-16. [Google Scholar]
- 7.Cottrell, M. T., and D. L. Kirchman. 2000. Community composition of marine bacterioplankton determined by 16S rRNA gene clone libraries and fluorescence in situ hybridization. Appl. Environ. Microbiol. 66:5116-5122. [DOI] [PMC free article] [PubMed] [Google Scholar]
- 8.Daims, H., A. Bruhl, R. Amann, K. H. Schleifer, and M. Wagner. 1999. The domain-specific probe EUB338 is insufficient for the detection of all Bacteria: development and evaluation of a more comprehensive probe set. Syst. Appl. Microbiol. 22:434-444. [DOI] [PubMed] [Google Scholar]
- 9.DeLong, E. F. 1992. Archaea in coastal marine environments. Proc. Natl. Acad. Sci. USA 89:5685-5689. [DOI] [PMC free article] [PubMed] [Google Scholar]
- 10.DeLong, E. F., L. T. Taylor, T. L. Marsh, and C. M. Preston. 1999. Visualization and enumeration of marine planktonic archaea and bacteria by using polyribonucleotide probes and fluorescent in situ hybridization. Appl. Environ. Microbiol. 65:5554-5563. [DOI] [PMC free article] [PubMed] [Google Scholar]
- 11.DeLong, E. F., G. S. Wickham, and N. R. Pace. 1989. Phylogenetic strains: ribosomal RNA-based probes for the identification of single cells. Science 243:1360-1363. [DOI] [PubMed] [Google Scholar]
- 12.Eilers, H., J. Pernthaler, and R. Amann. 2000. Succession of pelagic marine bacteria during enrichment: a close look at cultivation-induced shifts. Appl. Environ. Microbiol. 66:4634-4640. [DOI] [PMC free article] [PubMed] [Google Scholar]
- 13.Eilers, H., J. Pernthaler, F. O. Glöckner, and R. Amann. 2000. Culturability and in situ abundance of pelagic bacteria from the North Sea. Appl. Environ. Microbiol. 66:3044-3051. [DOI] [PMC free article] [PubMed] [Google Scholar]
- 14.Eilers, H., J. Pernthaler, J. Peplies, F. O. Glöckner, G. Gerdts, and R. Amann. 2001. Isolation of novel pelagic bacteria from the German Bight and their seasonal contribution to surface picoplankton. Appl. Environ. Microbiol. 67:5134-5142. [DOI] [PMC free article] [PubMed] [Google Scholar]
- 15.Fuchs, B. M., F. O. Glockner, J. Wulf, and R. Amann. 2000. Unlabeled helper oligonucleotides increase the in situ accessibility to 16S rRNA of fluorescently labeled oligonucleotide probes. Appl. Environ. Microbiol. 66:3603-3607. [DOI] [PMC free article] [PubMed] [Google Scholar]
- 16.Fuhrman, J. A., K. McCallum, and A. A. Davis. 1992. Novel major archaebacterial group from marine plankton. Nature 356:148-149. [DOI] [PubMed] [Google Scholar]
- 17.Fuhrman, J. A., and C. C. Ouverney. 1998. Marine microbial diversity studied via 16S rRNA sequences: cloning results from coastal waters and counting of native Archaea with fluorescent single cell probes. Aquat. Ecol. 32:3-15. [Google Scholar]
- 18.Gasol, J. M., P. A. delGiorgio, R. Massana, and C. M. Duarte. 1995. Active versus inactive bacteria: size-dependence in a coastal marine plankton community. Mar. Ecol. Prog. Ser. 128:91-97. [Google Scholar]
- 19.Glöckner, F. O., R. Amann, A. Alfreider, J. Pernthaler, R. Psenner, K. Trebesius, and K.-H. Schleifer. 1996. An in situ hybridization protocol for detection and identification of planktonic bacteria. Syst. Appl. Microbiol. 19:403-406. [Google Scholar]
- 20.Glöckner, F. O., B. M. Fuchs, and R. Amann. 1999. Bacterioplankton compositions of lakes and oceans: a first comparison based on fluorescence in situ hybridization. Appl. Environ. Microbiol. 65:3721-3726. [DOI] [PMC free article] [PubMed] [Google Scholar]
- 21.Glöckner, F.-O., E. Zaichikov, N. Belkova, L. Denissova, J. Pernthaler, A. Pernthaler, and R. Amann. 2000. Comparative 16S rRNA analysis of lake bacterioplankton reveals globally distributed phylogenetic clusters including an abundant group of Actinobacteria. Appl. Environ. Microbiol. 66:5053-5065. [DOI] [PMC free article] [PubMed] [Google Scholar]
- 22.Gonzalez, J. M., R. Simo, R. Massana, J. S. Covert, E. O. Casamayor, C. Pedros-Alio, and M. A. Moran. 2000. Bacterial community structure associated with a dimethylsulfoniopropionate-producing North Atlantic algal bloom. Appl. Environ. Microbiol. 66:4237-4246. [DOI] [PMC free article] [PubMed] [Google Scholar]
- 23.Heissenberger, A., G. G. Leoppard, and G. J. Herndl. 1996. Relationship between the intracellular integrity and the morphology of the capsular envelope in attached and free-living marine bacteria. Appl. Environ. Microbiol. 62:4521-4528. [DOI] [PMC free article] [PubMed] [Google Scholar]
- 24.Hopman, A. H. N., F. C. S. Ramaeker, and E. J. M. Speel. 1998. Rapid synthesis of biotin-, digoxigenin-, trinitrophenyl-, and fluorochrome-labeled tyramides and their application for in situ hybridization using CARD amplification. J. Histochem. Cytochem. 46:771-777. [DOI] [PubMed] [Google Scholar]
- 25.Karner, M., E. F. DeLong, and D. M. Karl. 2001. Archaeal dominance in the mesopelagic zone of the Pacific Ocean. Nature 409:507-509. [DOI] [PubMed] [Google Scholar]
- 26.Karner, M., and J. A. Fuhrman. 1997. Determination of active marine bacterioplankton: a comparison of universal 16S rRNA probes, autoradiography, and nucleoid staining. Appl. Environ. Microbiol. 63:1208-1213. [DOI] [PMC free article] [PubMed] [Google Scholar]
- 27.Lebaron, P., P. Catala, C. Fajon, F. Joux, J. Baudart, and L. Bernard. 1997. A new sensitive, whole-cell hybridization technique for detection of bacteria involving a biotinylated oligonucleotide probe targeting rRNA and tyramide signal amplification. Appl. Environ. Microbiol. 63:3274-3278. [DOI] [PMC free article] [PubMed] [Google Scholar]
- 28.Lebaron, P., P. Servais, H. Agogue, C. Courties, and F. Joux. 2001. Does the high nucleic acid content of individual bacterial cells allow us to discriminate between active cells and inactive cells in aquatic systems? Appl. Environ. Microbiol. 67:1775-1782. [DOI] [PMC free article] [PubMed] [Google Scholar]
- 29.Lee, S. H., C. Malone, and P. F. Kemp. 1993. Use of multiple 16s ribosomal-rRNA-targeted fluorescent-probes to increase signal strength and measure cellular rRNA from natural planktonic bacteria. Mar. Ecol. Prog. Ser. 101:193-201. [Google Scholar]
- 30.Llobet-Brossa, E., R. Rossellò-Mora, and R. Amann. 1998. Microbial community composition of Wadden Sea sediments as revealed by fluorescence in situ hybridization. Appl. Environ. Microbiol. 64:2691-2696. [DOI] [PMC free article] [PubMed] [Google Scholar]
- 31.Morita, R. Y. 1997. Bacteria in oligotrophic environments: starvation-survival lifestyle, vol. 1. Chapman & Hall, New York, N.Y.
- 32.Mullins, T. D., T. B. Britschgi, R. L. Krest, and S. J. Giovannoni. 1995. Genetic comparisons reveal the same unknown bacterial lineages in Atlantic and Pacific bacterioplankton communities. Limnol. Oceanogr. 40:148-158. [Google Scholar]
- 33.Murray, A. E., A. Blakis, R. Massana, S. Strawzewski, U. Passow, A. Alldredge, and E. F. DeLong. 1999. A time series assessment of planktonic archaeal variability in the Santa Barbara Channel. Aquat. Microb. Ecol. 20:129-145. [Google Scholar]
- 34.Oda, Y., S. J. Slagman, W. G. Meijer, L. J. Forney, and J. C. Gottschal. 2000. Influence of growth rate and starvation on fluorescent in situ hybridization of Rhodopseudomonas palustris. FEMS Microbiol. Ecol. 32:205-213. [DOI] [PubMed] [Google Scholar]
- 35.Ouverney, C. C., and J. A. Fuhrman. 1997. Increase in fluorescence intensity of 16S rRNA in situ hybridization in natural samples treated with chloramphenicol. Appl. Environ. Microbiol. 63:2735-2740. [DOI] [PMC free article] [PubMed] [Google Scholar]
- 36.Pernthaler, A., C. M. Preston, J. Pernthaler, E. F. DeLong, and R. Amann. 2002. A comparison of fluorescently labeled oligonucleotide and polynucleotide probes for the detection of pelagic marine bacteria and archaea. Appl. Environ. Microbiol. 68:661-667. [DOI] [PMC free article] [PubMed] [Google Scholar]
- 37.Pernthaler, J., F. O. Glöckner, W. Schönhuber, and R. Amann. 2001. Fluorescence in situ hybridization (FISH) with rRNA-targeted oligonucleotide probes. Methods Microbiol. 30:207-226. [Google Scholar]
- 38.Rappe, M. S., D. A. Gordon, K. L. Vergin, and S. J. Giovannoni. 1999. Phylogeny of actinobacteria small subunit (SSU) rRNA gene clones recovered from marine bacterioplankton. Syst. Appl. Microbiol. 22:106-112. [Google Scholar]
- 39.Ravenschlag, K., K. Sahm, and R. Amann. 2001. Quantitative molecular analysis of the microbial community in marine Arctic sediments (Svalbard). Appl. Environ. Microbiol. 67:387-395. [DOI] [PMC free article] [PubMed] [Google Scholar]
- 40.Schönhuber, W., B. Fuchs, S. Juretschko, and R. Amann. 1997. Improved sensitivity of whole-cell hybridization by the combination of horseradish peroxidase-labeled oligonucleotides and tyramide signal amplification. Appl. Environ. Microbiol. 63:3268-3273. [DOI] [PMC free article] [PubMed] [Google Scholar]
- 41.Schönhuber, W., B. Zarda, S. Eix, R. Rippka, M. Herdman, W. Ludwig, and R. Amann. 1999. In situ identification of cyanobacteria with horseradish peroxidase-labeled, rRNA-targeted oligonucleotide probes. Appl. Environ. Microbiol. 65:1259-1267. [DOI] [PMC free article] [PubMed] [Google Scholar]
- 42.Simon, M., F. O. Glöckner, and R. Amann. 1999. Different community structure and temperature optima of heterotrophic picoplankton in various regions of the Southern Ocean. Aquat. Microb. Ecol. 18:275-284. [Google Scholar]
- 43.Speel, E. J. M., A. H. N. Hopman, and P. Komminoth. 1999. Amplification methods to increase the sensitivity of in situ hybridization: play CARD(s). J. Histochem. Cytochem. 47:281-288. [DOI] [PubMed] [Google Scholar]
- 44.Suzuki, M. T., C. M. Preston, F. P. Chavez, and E. F. DeLong. 2001. Quantitative mapping of bacterioplankton populations in seawater: field tests across an upwelling plume in Monterey Bay. Aquat. Microb. Ecol. 24:117-127. [Google Scholar]
- 45.Suzuki, M. T., L. T. Taylor, and E. F. DeLong. 2000. Quantitative analysis of small-subunit rRNA genes in mixed microbial populations via 5′-nuclease assays. Appl. Environ. Microbiol. 66:4605-4614. [DOI] [PMC free article] [PubMed] [Google Scholar]
- 46.van de Corput, M. P. C., R. W. Dirks, R. P. M. van Gijlswijk, F. M. van de Rijke, and A. K. Raap. 1998. Fluorescence in situ hybridization using horseradish peroxidase-labeled oligodeoxynucleotides and tyramide signal amplification for sensitive DNA and mRNA detection. Histochem. Cell Biol. 110:431-437. [DOI] [PubMed] [Google Scholar]
- 47.Wagner, M., M. Schmid, S. Juretschko, K. H. Trebesius, A. Bubert, W. Goebel, and K. H. Schleifer. 1998. In situ detection of a virulence factor mRNA and 16S rRNA in Listeria monocytogenes. FEMS Microbiol. Lett. 160:159-168. [DOI] [PubMed] [Google Scholar]
- 48.Yang, H., I. B. Wanner, S. D. Roper, and N. Chaudhari. 1999. An optimized method for in situ hybridization with signal amplification that allows the detection of rare mRNAs. J. Histochem. Cytochem. 47:431-445. [DOI] [PubMed] [Google Scholar]
- 49.Zaitsu, K., and Y. Ohkura. 1980. New fluorogenic substrates for horseradish peroxidase: rapid and sensitive assays for hydrogen-peroxide and the peroxidase. Anal. Biochem. 109:109-113. [DOI] [PubMed] [Google Scholar]
- 50.Zubkov, M. V., B. M. Fuchs, S. D. Archer, R. P. Kiene, R. Amann, and P. A. Burkill. 2001. Linking the composition of bacterioplankton to rapid turnover of dissolved dimethylsulfoniopropionate in an algal bloom in the North Sea. Environ. Microbiol. 3:304-311. [DOI] [PubMed] [Google Scholar]


