

SUMMARY
Nearly all mitochondrial proteins are translated on cytosolic ribosomes. How these proteins are subsequently delivered to mitochondria remains poorly understood. Using selective ribosome profiling, we show that nearly 20% of mitochondrial proteins can be imported cotranslationally in human cells. Cotranslational import requires an N-terminal presequence on the nascent protein and contributes to localized translation at the mitochondrial surface. This pathway does not favor membrane proteins but instead prioritizes large, multi-domain, topologically complex proteins, whose import efficiency is enhanced when targeted cotranslationally. In contrast to the early onset of cotranslational protein targeting to the endoplasmic reticulum (ER), the presequence on mitochondrial proteins is inhibited from initiating targeting early during translation until a large globular domain emerges from the ribosome. Our findings reveal a multi-layered protein sorting strategy that controls the timing and specificity of mitochondrial protein targeting.
In brief
Selective ribosome profiling reveals that nearly 20% of mitochondrial proteins in human cells are imported during translation on cytosolic ribosomes. Cotranslational import requires an N-terminal presequence but is delayed until a large domain emerges and prioritizes large multi-domain proteins. This multi-layered sorting mechanism enables cells to balance the import demands for the mitochondrial proteome with diverse biophysical properties.
Graphical Abstract

INTRODUCTION
Mitochondria play a critical role in various cellular processes, including ATP synthesis, calcium homeostasis, and lipid metabolism.1 Fundamental to these roles is the proper localization of mitochondrial proteins. Approximately 99% of mitochondrial proteins are encoded by the nuclear genome, synthesized in the cytosol, and must be imported into this organelle, necessitating diverse and sophisticated protein targeting and translocation mechanisms.2,3 Almost all mitochondrial proteins initiate import at the translocase of the outer membrane (TOM) complex and are subsequently sorted into distinct mitochondrial subcompartments via different pathways.4–6 In contrast to the well-studied protein translocation machineries in mitochondria, cytosolic events that deliver mitochondrial proteins to the TOM complex remain poorly understood.3,7 While the classic view is that protein targeting to mitochondria occurs post-translationally, the presence of mitochondrially localized mRNA,8–11 ribosomes,12 and translation13,14 suggests that targeting may also occur cotranslationally. However, it is unclear whether mitochondria-localized translation is driven by cotranslational protein targeting or mRNA localization, and the timing, physiological roles, and underlying principles of cotranslational import remain to be elucidated. To address these questions, we used selective ribosome profiling15 (SeRP) to directly investigate cotranslational import into mitochondria in human cells at the proteome-wide scale and near-codon resolution.
RESULTS
The presequence directs cotranslational protein targeting to mitochondria
To unambiguously identify the proteins that undergo cotranslational import into mitochondria and exclude those that are translated on the mitochondrial surface but imported post-translationally, we reasoned that only the former would produce ribosome-nascent chain complexes (RNCs) that physically interact with the TOM complex. Such interaction was supported by the co-sedimentation of TOM40 and TOM22, subunits of the core TOM complex,16,17 as well as the TOM20 receptor with the ribosome (Figure S1A). In contrast, no ribosome association was observed with TOM70, a receptor on the outer mitochondrial membrane (OMM) that dynamically associates with the core TOM complex, nor with MTCH2, a translocase for tail-anchored proteins on the OMM18 (Figure S1A). Thus, isolating TOM-RNC complexes after nuclease treatment will allow us to capture the nascent proteins undergoing cotranslational import into mitochondria (Figure 1A).
Figure 1. SeRP of the TOM complex reveals cotranslationally imported mitochondrial proteins.
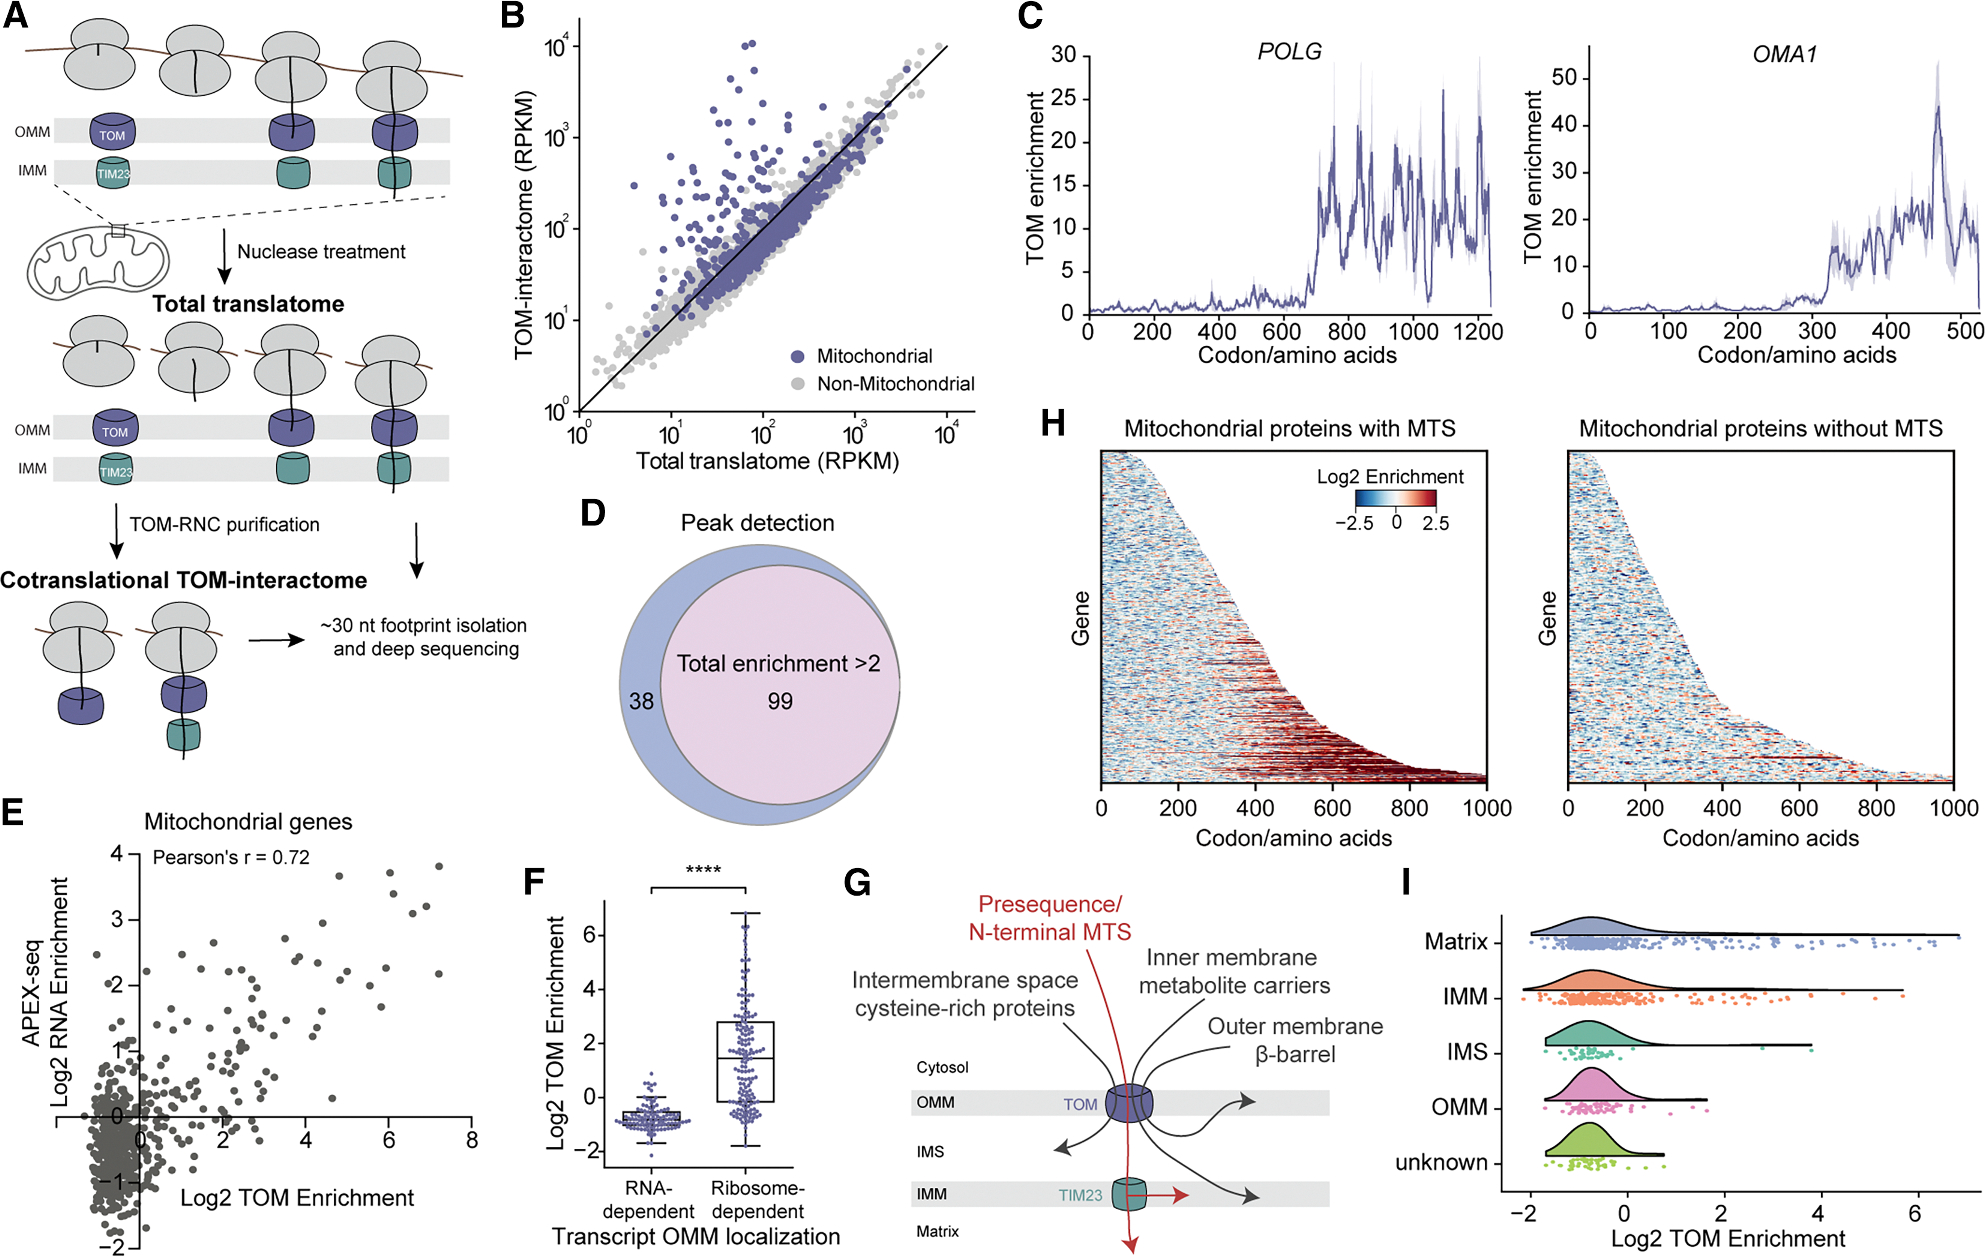
(A) Schematic of SeRP of the TOM complex.
(B) Comparison of the translatome and TOM-interactome footprint density of confidently detected genes. RPKM, reads per kilobase per million reads.
(C) Representative TOM interaction profiles of mitochondrial proteins. Solid lines show the mean, and shades show the range of data from two biological replicates. POLG, DNA polymerase subunit gamma-1; OMA1, metalloendopeptidase OMA1.
(D) Venn diagrams showing the overlap of cotranslational TOM-interactome detected by the two methods.
(E) Correlation between gene-level TOM enrichment from this study and the RNA enrichment from APEX-seq study10 for all mitochondrial genes.
(F) Comparison of the TOM enrichment between mitochondrial genes whose mRNAs are localized to mitochondria in an RNA- or ribosome-dependent manner. ****, p < 0.0001.
(G) Scheme showing the four major pathways for protein import through the TOM complex.
(H) Codon-resolution heatmap of log2 TOM enrichment for all detected mitochondrial proteins. Proteins are categorized by the presence of presequence and sorted by length.
(I) Raincloud plot of the distribution of TOM enrichment for proteins in different mitochondrial subcompartments.
To this end, we fused chromosomal TOM22 to a C-terminal TwinStrep tag16, which is located in the mitochondrial intermembrane space (IMS) and did not interfere with the expression and function of TOM22 (Figure S1B). Initial purification without the translation elongation inhibitor, cycloheximide (CHX), yielded small amounts of TOM-RNC complexes, consistent with previous observations.12 Cells were therefore treated with CHX for 2 min prior to harvest to prevent ribosome run-off.19 Ribosomal proteins and all subunits of the core TOM complex were specifically enriched after purification from cells harboring TOM22-TwinStrep (Figures S1C and S1D). TIM23, a subunit of the translocase of the inner mitochondrial membrane (IMM), also co-purified with TOM22 in the ribosome-bound fraction but not in the lysate (Figure S1D). As formation of the TOM-TIM23 supercomplex is dependent on a translocating polypeptide,20 these observations suggest that at least a fraction of the nascent proteins was captured during translocation across both the TOM and TIM23 complexes. Ribosome-protected mRNA fragments (i.e., ribosome footprints) from total ribosome population and TOM-bound RNCs were then extracted and sequenced, generating information on the translatome and cotranslational TOM-interactome (Figures 1A and S1E).
Gene-level analysis showed that a subset of mitochondrial proteins was specifically enriched in the cotranslational TOM-interactome, whereas few non-mitochondrial proteins showed an enrichment (Figure 1B; Table S1). For individual mitochondrial genes, TOM enrichment rose sharply at specific codons and remained steady until the end of the coding sequence (Figure 1C), suggesting that import initiates at a certain point during translation, followed by committed and continuous translocation through the TOM complex.
To identify all the cotranslationally imported proteins, we developed a peak detection algorithm with stringent criteria to scan for regions with at least 7 codons above a threshold of 2.5-fold TOM enrichment. This method detected all mitochondrial proteins with greater than 2-fold gene-level enrichment, confirming its robustness (Figure 1D) and captured 38 additional proteins that display reproducibly strong TOM interactions shortly before translation termination (Figure S1F). Our analysis revealed that, out of the 746 mitochondrial proteins confidently identified in our dataset, 137 (18.4%) can be targeted cotranslationally (Figure 1D; Table S2), which we thereafter refer to as cotranslational TOM substrates. While a fraction of these substrates may also be imported post-translationally, our data provide definitive evidence that a cotranslational import pathway exists for mitochondrial proteins in vivo.
We next examined the relationship between cotranslational import and mRNA localization on mitochondria. A strong correlation was observed between the enrichment of proteins in our cotranslational TOM-interactome and the enrichment of mRNAs localized at the OMM detected by APEX-seq10 (Figure 1E). The proteins encoded by mRNAs that associate with mitochondria in a translation-dependent manner were specifically enriched in our dataset (Figures 1F and S1G), suggesting that cotranslational targeting and import mediate the mitochondrial localization of these mRNAs. BCOR, a nuclear transcriptional corepressor,21 was the only non-mitochondrial protein that exhibited persistent TOM association (Figure S1H). This was also confirmed by the translation-dependent localization of BCOR mRNA on the mitochondrial surface,10 suggesting a potential dual localization of BCOR.
Functional characterization of cotranslational TOM substrates revealed their diverse and critical roles within mitochondria. Enriched functional classes include protein degradation pathways, tRNA synthetases, ABC transporters, and various metabolic processes (Figures S1I and S1J). Proteins involved in the maintenance and expression of the mitochondrial genome are also overrepresented (Figure S1I). DAP3-binding cell death enhancer 1 (DELE1) and serine/threonine-protein kinase (PINK1), whose import deficiency activates the integrated stress response and mitophagy, respectively,22–24 were also cotranslational TOM substrates (Figure S1K), suggesting a role of cotranslational import in mitochondrial quality control. In contrast, components of mitochondrial ribosomes and oxidative phosphorylation (OXPHOS) complex, whose assembly requires coordinated cytosolic and mitochondrial translation, were encoded by mRNAs that associate with the OMM independently of translation10 and were rarely cotranslationally imported (Figure S1I).
We next explored the targeting signals that direct cotranslational import. The TOM complex mediates the import of four major classes of mitochondrial proteins. Approximately 60% of these proteins contain a cleavable N-terminal mitochondrial targeting sequence (MTS, also termed presequence) and are subsequently translocated across or inserted into the IMM by the TIM23 complex (Figure 1G, red). Additional pathways mediate the folding and insertion of mitochondrial proteins without a cleavable MTS, including carrier proteins on the IMM, β-barrel proteins on the OMM, and cysteine-rich proteins in the IMS5 (Figure 1G, grays). Virtually all the cotranslational TOM substrates contain an N-terminal MTS (Figures 1H and S1L; Table S2). Among these, the majority (90 out of 137) reside in the mitochondrial matrix and comprise 25.5% of the matrix proteome (Figure 1I). Of the 41 cotranslational TOM substrates that are annotated as IMM proteins (Figure 1I), over half lack a transmembrane domain (TMD) and are matrix-localized subunits of protein complexes on the IMM (Table S2). The remainder of IMM proteins and the two IMS proteins that exhibit TOM enrichment (Figure 1I) also harbor an N-terminal MTS. The hydrophobic stop-transfer signals on these proteins mediate their release from TIM23 into the IMM or IMS.5 Only one OMM protein, glycerol-3-phosphate acyltransferase 1 (GPAM), showed significant TOM enrichment (Figure S1M). The GPAM mRNA was also found to localize to mitochondria in a translation-dependent manner.10 Notably, GPAM does not contain a cleavable MTS, but has an N-terminal loop-helix region that serves as a mitochondrial targeting signal.25
Taken together, SeRP of the TOM complex reveals that nearly 20% of the mitochondrial proteome use a cotranslational import pathway, which is directed by the N-terminal MTS.
Large, multi-domain mitochondrial proteins use cotranslational import
The majority of mitochondrial proteins are imported post-translationally, raising questions about what necessitates the evolution of a cotranslational mode of import for a specific subset of mitochondrial proteins. Previously, the enrichment of IMM proteins in mitochondrially localized translation in yeast led to the hypothesis that the toxicity associated with the cytosolic exposure of TMDs necessitates cotranslational import.13 However, matrix proteins, rather than IMM proteins, were strongly enriched in the cotranslational TOM-interactome in human cells (Figure 1I). Among the 240 annotated human IMM proteins, 119 contain predicted TMDs (Table S2), and cotranslational targeting did not exhibit a preference for TMD-containing proteins (Figure 2A). In addition, most of the metabolite transporters, which are the most aggregation-prone multipass membrane proteins on the IMM, were not imported cotranslationally (Figures 2B and S1N). The only exceptions are the ABC transporters, which contain an N-terminal MTS (Figures 2B and S1N). For the 17 TMD-containing IMM proteins that cotranslationally engaged TOM, the onset of their import did not correlate with the emergence of the first TMD or the number of TMDs exposed (Figure S1O). Thus, protecting TMDs from aggregation in the cytosol is not the primary function of cotranslational protein targeting to mitochondria in human cells.
Figure 2. Role of cotranslational mitochondrial protein targeting.

(A) TOM enrichment of IMM proteins with and without TMDs. ns, not significant (p > 0.05).
(B) Codon-resolution heatmap of log2 TOM enrichment for four families of metabolite carrier proteins (mitochondrial pyruvate carrier [MPC], sideroflexin, SLC25A, and mitochondrial ABCB transporters).
(C) Two-dimensional histogram of mitochondrial proteins binned by log2 TOM enrichment and protein length.
(D) Receiver operator characteristic (ROC) curves from a supervised random-forest classifier that predicts whether a mitochondrial protein utilizes a co- or post-translational targeting pathway. The presence of an N-terminal MTS and protein length were used as the parameters to train the model. The solid line shows the mean performance, and the shaded area shows the range of data from 10-fold cross-validation.
(E) Absolute contact order analysis of all mitochondrial proteins. ****, p < 0.0001.
(F) The fraction of cotranslational TOM substrates among mitochondrial proteins, grouped by the number of domains identified in each protein.
(G) Left, TOM interaction profile of NDUFS2 (NADH dehydrogenase [ubiquinone] iron-sulfur protein 2), a mitochondrial matrix protein. The solid line shows the mean values, and the shaded area shows the range of data from two biological replicates. Right, in vitro mitochondrial import of NDUFS2 and OMP25 (synaptojanin-2-binding protein). 35S-methionine-labeled precursor proteins were translated in rabbit reticulocyte lysate, and purified human mitochondria were added either immediately after translation initiation (co-) or after 40 min of translation followed by CHX addition to stop protein synthesis (post-). Import is assessed by proteinase K (PK) protection and analyzed by SDS-PAGE and autoradiography.
We therefore searched for alternative biophysical features of mitochondrial proteins that correlate with cotranslational targeting. We first noted that all the cotranslational TOM substrates are relatively large, with a protein size exceeding 350 amino acids (aa; Figures 1H and 2C). Indeed, a logistic regression model based solely on the presence of an N-terminal MTS and protein length demonstrated remarkable accuracy in predicting whether a mitochondrial protein cotranslationally engages the TOM complex (Figure 2D), highlighting that a large protein size is a key feature of cotranslationally targeted mitochondrial proteins.
A larger protein size tends to increase the complexity of protein topology, leading to challenges in both folding and unfolding.26,27 To investigate if biophysical features associated with protein folding contributed to cotranslational mitochondrial targeting, we calculated the absolute contact order (ACO) scores for all mitochondrial proteins (Figure 2E). ACO measures the total sequence distance between residues forming native contacts in the folded protein, providing insights into protein topological complexity. Larger ACO values are associated with slower protein folding rates and a greater peak force required for protein unfolding.28,29 We found that cotranslational TOM substrates displayed significantly higher ACO scores compared with post-translationally targeted mitochondrial proteins (Figure 2E) or with a set of randomly sampled cytosolic proteins with the same size distribution (Figure S1P). Thus, cotranslational import prioritizes mitochondrial proteins with a complex topology. In support of this notion, multi-domain proteins, which are more prone to misfolding and resistant to unfolding due to interdomain interactions,30 dominated cotranslational TOM substrates (Figures 2F and S1Q). These observations suggest that the challenges in the folding/unfolding of large and topologically complex mitochondrial proteins necessitate a cotranslational mechanism for their import.
We next assessed the requirement for cotranslational import using an in vitro import assay (Figures 2G and S1R). Two matrix-localized cotranslational TOM substrates, NADH dehydrogenase (ubiquinone) iron-sulfur protein 2 (NDUFS2) and TRAP1 (heat shock protein 75 kDa, mitochondrial), and two post-translationally targeted mitochondrial tail-anchored proteins, OMP25 and VHP-RHOT2,18 were translated in rabbit reticulocyte lysate. Import into purified human mitochondria was carried out either cotranslationally, by adding mitochondria during translation, or post-translationally, by using cycloheximide to stop protein synthesis before the addition of mitochondria. We observed a significantly higher import efficiency for NDUFS2 and TRAP1 when import occurred cotranslationally than post-translationally, whereas OMP25 and VHP-RHOT2 showed no difference (Figures 2G and S1R). Import was also measured for dihydrolipoyllysine-residue acetyltransferase component of pyruvate dehydrogenase complex (DLAT) domains I + II + III and DLAT domains I + IV, which have identical MTS and similar lengths but differ in the arrangement of protein domains that resulted in the cotranslational TOM association of the latter but not the former (Figure 4E). Only DLAT domains I + IV exhibited higher import efficiency when imported cotranslationally (Figure S1R). These findings suggest that a cotranslational mode of targeting enhances the import efficiency of cotranslational TOM substrates.
Figure 4. Cotranslational mitochondrial import initiates upon the exposure of a complex globular protein fold.

(A) Comparison of the TOM interaction profile of WT COQ3 and COQ3-repeat, which contains a tandem repeat of residues 94–138 (a helix-turn-helix motif, labeled as α) in WT COQ3. The schemes above depict the presequence as open bars and mature protein regions as solid bars. Proteins are aligned to the start codon (left) or by consensus sequence (right).
(B) Comparison of the TOM interaction profile of COQ8A and COQ8B. The schemes above depict the unstructured protein regions as open bars and the conserved structured regions as solid bars. Proteins are aligned to the start codon (left) or to the N terminus of their conserved regions (right).
(C) Proteins are grouped by shared domains and aligned to the onset of TOM interaction, with the shared domain in each group in orange, additional domains that have initiated translation at the onset of import in yellow, and the remainder of the protein in gray. Residues to the left of the purple shaded area, which indicates the ~35 aa in the ribosome exit tunnel, are exposed at the onset of TOM interaction.
(D) TOM enrichment profiles (left) and AlphaFold-predicted structures (right) of representative proteins from each group in C (marked by “*”). The exposed regions at the onset of TOM engagement are in orange and the onset of TOM interaction is marked by a blue arrow in the structural models. The unstructured MTS was not shown for clarity. FPGS, folylpolyglutamate synthase; ETFDH, electron transfer flavoprotein-ubiquinone oxidoreductase; ALDH5A1, succinate-semialdehyde dehydrogenase.
(E and F) TOM enrichment profiles of DLAT (E) and domain-reordered DLAT (F). The unstructured protein regions and domains I–IV of DLAT are color-indicated in the schemes and AlphaFold-predicted structural model above. DLAT: dihydrolipoyllysine-residue acetyltransferase component of pyruvate dehydrogenase complex.
(G) Cotranslational engagement of MDH2-fusion proteins with the TOM complex analyzed by qPCR. The indicated protein fragments were inserted between the MTS and mature domain of MDH2. AlphaFold-predicted structures of the inserted fragments are shown below. MDH2, malate dehydrogenase. Data are shown as mean ± standard error, with n = 3. ns, p > 0.05; ***, p < 0.001.
(H) Comparison of the TOM interaction profiles of WT MDH2 and MDH2 inserted with ALDH5A1 domain I. Proteins are aligned by consensus amino acid sequence.
In A, B, D–F, and H, solid lines show the mean values, and shaded areas show the range of data from two biological replicates.
(I) Model of cotranslational protein import into mitochondria. Gray shades depict inhibitory interactions that shield the N-terminal MTS at early stages of translation. These interactions are removed at a later stage, either via protein release from the ribosome (upper pathway) or upon the emergence of a large protein domain (lower pathway), to initiate mitochondrial protein import.
See also Figures S3 and S4 and Table S3.
Protein import into mitochondria initiates late during translation
To understand how specific mitochondrial proteins are selected for cotranslational import and how their translocation is coupled to translation, we analyzed the timing of protein targeting to mitochondria. The metagene profile showed that, on average, engagement with the TOM complex began when the nascent protein was ~350 aa in length (Figure 3A). For individual proteins, the onset of mitochondrial import varied, ranging from ~200 to ~800 aa, and peaked at a nascent chain length of ~400 aa (Figures 3B, 1C, and 1H). As the N-terminal MTS is 10–100 aa long, this observation indicates that import does not begin immediately upon exposure of the MTS but rather occurs late during translation.
Figure 3. Cotranslational protein targeting to mitochondria occurs late and independently of NAC.

(A) Metagene total translatome and TOM-interactome profiles of all mitochondrial genes aligned to the start codon.
(B) Distribution of the onset of TOM interaction during translation.
(C) Scheme depicting the incompatibility of co-co interaction with protein import into mitochondria.
(D) Venn diagrams showing the overlap of cotranslational TOM substrates with mitochondrial proteins displaying co-co interactions.
(E) TOM interaction and co-co interaction (measured by the disome/monosome ratio) profiles of representative cotranslational TOM substrates. ABCB7, iron-sulfur clusters transporter ABCB7; ELAC2, zinc phosphodiesterase ELAC protein 2.
(F) Metagene TOM enrichment and co-co interaction profiles of all cotranslational TOM substrates, aligned to the onset of TOM interaction peaks.
(G) Western blot showing the depletion of NACα (upper) and NACβ (lower) in NACα-AID and NACβ-AID cell lines, respectively, upon auxin addition.
(H) Correlation of gene-level TOM enrichment for all mitochondrial genes without and with a 4.5-h auxin treatment in NACβ-AID cells.
(I) Representative TOM interaction profile of a mitochondrial gene before and after auxin addition (4.5 h) in NACβ-AID cells. METTL17, ribosome assembly protein METTL17.
(J) Heatmap of log2 TOM enrichment at each codon for cotranslational TOM substrates after a 4.5-h auxin treatment in NACβ-AID cells. Proteins are aligned to the onset of TOM interaction in WT cells and sorted by the distance from the onset to the stop codon.
In A, E, F, and I, solid lines show the mean, and shaded areas show the 95% confidence interval (A and F) or the range of data from two biological replicates (E and I).
See also Figure S2.
To exclude the possibility that only long nascent chains stably associate with the import machinery and survived the affinity purification, we performed SeRP in the presence of a cell-permeable crosslinker, DSP (dithiobis(succinimidyl propionate)). Analysis of TOM40 crosslinking products confirmed the stabilization of TOM-RNC interactions by DSP (Figure S2A). However, the timing of cotranslational import was not altered (Figures S2B–S2E). In addition, previous studies successfully isolated TOM-TIM23-precursor complexes using model substrates, Jac1-sfGFP (super-folder GFP) and b2(167)Δ19-DHFR, in which the sfGFP and DHFR moieties remain on the cytosolic side of the TOM complex,20,31–33 indicating that an ~160-aa-long nascent chain is sufficient to stably engage both translocases. Structural models further showed that ~50 aa are sufficient to span both mitochondrial membranes.20,31–33 These observations suggest that the late initiation of mitochondrial import was not due to the loss of transient early interactions between translating ribosomes and the TOM complex. Instead, this result suggests that the MTS, though sufficient to direct proteins to mitochondria, is unable to engage the TOM complex early during translation, which explains why small MTS-containing proteins are imported post-translationally.
Additional support for the late onset of mitochondrial import was obtained by analysis of the published selective disome profiling (DiSP) data (Figure 3C), which captured ribosomes that associate via interaction between nascent proteins (termed co-co interactions) in human cells.34 We found widespread co-co interactions for nascent mitochondrial proteins in the DiSP dataset (Figures S2F and S2G). Nearly all cotranslational TOM substrates exhibited co-co interactions (Figure 3D), which began at a nascent chain length of ~150 aa (Figure S2H). Notably, co-co interaction decreased immediately before the onset of TOM engagement. This pattern was observed on individual cotranslational TOM substrates (Figure 3E) and in a metagene analysis (Figure 3F). In contrast, co-co interaction persisted until the end of translation for post-translationally targeted proteins (Figure S2I). Considering that the association of a nascent mitochondrial protein with other RNCs is incompatible with its passage through the TOM and TIM23 complexes, which requires a largely unfolded polypeptide (Figure 3C), the observed co-co interactions likely reflect transient contacts of nascent mitochondrial proteins in the cytosol that must be dissolved prior to their import. The chronological alignment of the two independent datasets further indicates that our data accurately captured the timing of cotranslational mitochondrial protein import.
These findings prompted us to examine a prevalent hypothesis, that nascent polypeptide-associated complex (NAC) mediates cotranslational protein targeting to mitochondria (Figure S2J). NAC is an abundant ribosome-associated factor conserved across eukaryotic organisms35 and plays a key role in preventing the mistargeting of mitochondrial proteins to the endoplasmic reticulum (ER).36–38 In yeast, NAC facilitates the recruitment of RNCs to mitochondria via interaction with Om14 on the OMM surface.39 However, Om14 lacks a homolog in higher eukaryotes. In addition, NAC binds ribosomes early during translation, before the nascent protein reaches 20 aa in length,40 in contrast to the late onset of mitochondrial protein import. These observations argue against a direct involvement of NAC in this process.
To test the role of NAC in protein import into mitochondria, we monitored the targeting process after NAC depletion. Since NAC is essential in higher eukaryotic organisms and involved in numerous protein biogenesis events, we employed the auxin-inducible degron (AID) system41 to rapidly degrade NAC and thus minimize pleiotropic responses as well as cellular adaption. We engineered two cell lines for the acute depletion of the NACα or NACβ subunit in the NAC heterodimer.38,42 Auxin addition resulted in the nearly complete depletion of NACα and NACβ within 1.5 and 4.5 h, respectively (Figure 3G), comparable to those observed after over 72 h of knockdown in previous studies.36,40,43
We first used a split GFP-based reporter system44 to assess the effect of NAC depletion on mitochondrial protein import. C-terminally GFP11-tagged TRAP1, a cotranslational TOM substrate, was co-expressed with matrix-targeted GFP1–10. Successful import of TRAP1-GFP11 generated fluorescence signals in mitochondria via GFP complementation (Figure S2K), whereas TRAP1-GFP11 without an MTS did not (Figure S2L). The depletion of neither NACα nor NACβ altered the fluorescence signal of TRAP1-GFP11 (Figure S2K), indicating that its import into mitochondria is not strictly dependent on NAC.
To more broadly examine the role of NAC in cotranslational protein targeting, we carried out SeRP of the TOM complex after acute depletion of NACβ, which mediates ribosome association of the NAC complex.37 In agreement with the results from the reporter assay, acute depletion of NACβ did not significantly alter the cotranslational TOM-interactome, in either gene-level enrichment or the timing of import (Figures 3H–3J and S2M). Thus, NAC is not required for timely cotranslational protein targeting to the TOM complex in human cells.
A second signal in the mature region of mitochondrial proteins is required to initiate cotranslational import
We next asked what dictates the late onset of protein import into mitochondria. The following models were considered: (1) slow kinetics of targeting; targeting is initiated after the emergence of the N-terminal MTS but takes ~60 s to complete, during which ~300 aa of the nascent chain has been translated given a translation elongation rate of ~5 aa/second45; (2) the targeting machinery becomes activated only after a sufficient length of the nascent protein has been synthesized; and, (3) targeting initiates only when a specific molecular signal in the mature region of the nascent protein emerges from the ribosome and relieves the earlier inhibition of MTS.
We first probed the kinetics of protein targeting to mitochondria by examining the effects of prolonged CHX treatment. Decoupling targeting from translation elongation using CHX provides more time for RNCs to be targeted to the TOM complex, which will lead to an earlier onset of cotranslational import if model (1) is true. However, prolonged CHX treatment did not alter the substrate pool in the cotranslational TOM-interactome nor the timing of their TOM engagement (Figures S3A–S3C). This argues against model (1) and suggests that RNCs do not become targeting-competent until late during translation. In further support of this notion, no significant change in translation elongation rate was observed prior to the onset of TOM engagement (Figure S3D), suggesting that translation slowdown is not a general strategy used by mitochondrial proteins to initiate cotranslational targeting.
To further distinguish between the different models, we investigated how altering the length of the N-terminal unstructured sequence in a cotranslational TOM substrate impacts the timing of its mitochondrial targeting. The mitochondrial import of ubiquinone biosynthesis O-methyltransferase (COQ3) initiated when 281 aa had been translated (Figure 4A). Introducing a tandem repeat of a 44-aa sequence after its N-terminal MTS delayed import by ~50 aa (Figures 4A and S3E). The protein sequence exposed at the ribosome tunnel exit at the onset of TOM engagement was the same for both proteins (Figure 4A). This result contradicts models (1) and (2), which predict that TOM engagement will initiate at the same nascent chain length during translation. Instead, it supports model (3), whereby a second signal must emerge from the ribosome to initiate the import of a nascent mitochondrial protein.
We further tested this model by comparing the timing of import among mitochondrial paralogs. COQ8A and COQ8B share conserved core regions that adopt similar structures but evolved divergent N-terminal unstructured regions that differ ~120 aa in length (Figures S3F and S3G). The onset of cotranslational TOM engagement for the two proteins differed by ~120 aa when aligned to their N-terminus (Figure 4B). However, aligning the two proteins based on their homologous sequences revealed that the import of both proteins initiated when the same region in the conserved structured core emerged from the ribosome (Figure 4B). Taken together, these results indicate that cotranslational targeting to mitochondria is not simply determined by time or nascent chain length, but rather, is a multi-layered process that requires the emergence of both the MTS and a second molecular signal in the mature region of the nascent protein.
Cotranslational mitochondrial import initiates upon the emergence of a large globular domain
To identify the molecular features in the mature region that are responsible for initiating import into mitochondria, we first analyzed the properties of exposed amino acids at the onset of TOM engagement (Figures S3H–S3M). This analysis did not reveal sequence-level features that emerge prior to import, such as a conserved sequence motif (Figure S3H) or clusters of charged or hydrophobic residues (Figures S3I and S3J). Secondary structure propensities also showed no notable changes before the onset of import (Figures S3K and S3L). While internal MTS (iMTS) in the mature region of the protein is important for the targeting of some mitochondrial proteins lacking a presequence,46,47 the sequences exposed at the onset of import did not exhibit iMTS-like properties (Figure S3M). These findings suggest that the signal to initiate mitochondrial import does not reside in the primary protein sequence or secondary structures.
We then asked whether the initiation signal is associated with tertiary structural features. We reasoned that proteins that share a conserved domain would display similar structural features during their synthesis and may thus exhibit similar timing of import. Therefore, we classified cotranslational TOM substrates based on shared protein domains that have been translated prior to TOM engagement (Figure S4A; Table S3). P-loop like, Rossmann-like, ALDH-like domains and TIM barrel folds are most prevalent among the domains detected in this analysis (Figure S4A). By aligning proteins harboring the same domains to the onset of their import, we found that import generally began near or after the complete emergence of these domains from the ribosome (Figures 4C, 4D, and S4B). This pattern was conserved across cotranslational TOM substrates despite the diversity of the protein domains exposed (Figures 4C and S4B). Thus, the initiation of mitochondrial import correlated with the emergence of a large globular protein domain.
Consistent with this hypothesis, mitochondrial proteins with a long but completely unstructured N-terminus showed delayed onset of cotranslational import, as observed in COQ8A compared with its paralog, COQ8B (Figures 4B and S3F). Similarly, YME1L1, which contains a 260-aa-long unstructured N-terminal sequence, displayed stable cotranslational TOM engagement only after approximately 600 aa had been translated (Figure S4C). The exposure of a small N-terminal domain with fewer than ~150 aa during translation is also insufficient to initiate import (Figures S4D and S4E). Instead, the cotranslational import of these proteins occurred after the subsequent translation of a large domain, or the emergence of multiple small domains that contact one another to form a large globular structure (Figures 4E, S4D, and S4F). A salient example is DLAT, which contains three independently folding and non-interacting small N-terminal domains (I–III) spanning nearly 400 aa, followed by a large C-terminal domain IV of ~220 aa (Figure 4E). The TOM engagement of DLAT did not begin until ~600 aa had been synthesized, at which point domain IV had almost completely emerged from the ribosome (Figure 4E).
To test whether the emergence of a large globular domain is causal to the initiation of mitochondrial import, we generated a domain-reordered DLAT in which its large domain IV is N-terminal to domains II and III (Figure 4F). Notably, the import of domain-reordered DLAT initiated ~150 aa earlier than wild-type (WT) DLAT, when most of domain IV had emerged from the ribosome (Figure 4F). To exclude the possibility that this selective enrichment was due to a stronger interaction of DLAT domain IV with the TOM complex, we compared the intrinsic binding affinity of the TOM complex for polypeptides containing DLAT domains I + II + III versus DLAT domains I + IV (Figure S4G). To this end, both DLAT variants were fused to a C-terminal sfGFP, which stalls the fusion proteins at the TOM complex when expressed in the cell.20 Both fusion proteins co-purified with the TOM complex at comparable levels (Figure S4G), indicating no difference in their ability to engage the TOM complex post-translationally, in contrast to the selective TOM engagement of RNC exposing DLAT domains I + IV in ribosome profiling data. These results strongly suggest that MTS-bearing nascent proteins are prevented from engaging with targeting and translocation machineries early in translation. This inhibition is lifted once a sufficiently large globular domain, such as DLAT domain IV, emerges from the ribosome.
Finally, to test whether a large N-terminal globular domain drives cotranslational import in a transferable manner, we asked if introduction of such domains changes the targeting mode of a post-translationally imported protein. Three different protein fragments of the same size were inserted between the MTS and mature domain of malate dehydrogenase 2 (MDH2), a post-translational substrate. We then analyzed the cotranslational TOM engagement of the fusion proteins by quantifying the intact mRNAs from TOM-bound RNCs using RT-qPCR (Figure 4G). The insertion of DLAT domains II + III, which contains two small domains connected by a flexible linker (Figure 4E), did not induce the cotranslational import of MDH2. In contrast, the insertion of DLAT domain IV or ALDH5A1 (succinate-semialdehyde dehydrogenase) domain I, both large globular domains in cotranslational TOM substrates that emerge prior to import (Figures 4D and 4F), led to the cotranslational TOM engagement of MDH2 (Figure 4G). Consistent with our earlier findings, SeRP results showed that the cotranslational targeting of the ALDH5A1 domain I-MDH2 fusion protein began specifically upon the emergence of the inserted ALDH5A1 domain I (Figure 4H). Together, these data show that a large protein domain provides a transferable signal to initiate cotranslational targeting to mitochondria.
DISCUSSION
In this work, SeRP of the TOM complex bridges mRNA localization and mitochondrial protein import, provides direct evidence for cotranslational protein import into mitochondria, defines the timing and specificity of this process, and reveals its intimate link to cotranslational protein folding and unfolding. Our proteome-wide dataset also provides a rich resource to study the role of cotranslational mitochondrial targeting in other important cellular processes, such as stress response.
Cotranslational protein targeting to the ER by signal recognition particle (SRP), a conserved pathway used by numerous proteins destined for the endomembrane system, has shaped many concepts about the roles and mechanism of the cotranslational mode of targeting. Unexpectedly, our results show that cotranslational protein targeting to mitochondria is fundamentally different. First, the preponderance of integral membrane proteins among SRP substrates led to the notion that the cotranslational mechanism serves to prevent hydrophobic TMDs from aggregation in the cytosol,48 a model that was also proposed for cotranslational protein targeting to mitochondria in yeast.13 However, no such correlation was found in human cells for mitochondrial proteins that cotranslationally engage the TOM complex, nor for mRNAs that localize to the mitochondrial surface in a translation-dependent manner.10 Instead, cotranslational TOM substrates are characterized by a large size, the presence of multiple domains, and high ACO values. These biophysical features are associated with a higher tendency to form kinetically trapped structures, native or nonnative. We therefore propose that cotranslational import prevents the irreversible folding and/or misfolding of large mitochondrial proteins in the cytosol, which would pose a strong energetic barrier for their import and clog the TOM/TIM23 translocases (Figure 4I).
Second, despite being predominantly used by proteins with a presequence, cotranslational targeting does not initiate immediately upon the emergence of the N-terminal MTS, and instead begins after 200–400 additional amino acids of the nascent mitochondrial protein have been synthesized. This is distinct from SRP, which engages the nascent chain as soon as an ER targeting signal emerges from the ribosome and completes targeting before the translation of an additional 60 aa.49 Although the late onset of mitochondrial targeting is unexpected, this timing is supported by independent data showing widespread cotranslational assembly of mitochondrial proteins, which resolved prior to the initiation of import (Figures 3C–3F). Furthermore, the late initiation of cotranslational mitochondrial import is consistent with the long-standing observation that the majority of MTS-containing proteins are targeted post-translationally, even though their N-terminal MTS emerged early in translation. Collectively, these results suggest the presence of a “delay” mechanism in which the MTS is temporarily prevented from engaging the TOM complex at early stages of translation (Figure 4I). Such a mechanism occurs in bacteria, where the chaperone trigger factor binds early during the translation of many secretory proteins and delays their export by the SecB/A targeting machinery.15,50 It is plausible that the MTS is shielded by a ribosome-associated protein analogous to trigger factor50 early during translation and thus unable to initiate targeting. Alternatively, mitochondrial proteins may expose unsatisfied contact surfaces early in translation, which renders them susceptible to intermolecular interactions, such as co-co interactions34 (Figures 3C–3F), that shield the MTS and prevent targeting. Delayed targeting supports the hypothesis that cotranslational mitochondrial import, which is rate-limited by translation elongation, needs to be minimized to reduce ribosome occupancy on the TOM complex.3 As multiple ubiquitin ligases in the cytosol recognize the MTS to initiate degradation of mislocalized mitochondrial proteins,51 temporary shielding of the MTS during translation could also help protect nascent mitochondrial proteins from quality control machineries.
Molecular events at later stages must overcome the earlier inhibitory interactions to initiate import into mitochondria. For small single-domain proteins, their release from the ribosome may remove the ribosome-associated inhibitory contacts and expose the MTS to allow for the initiation of post-translational import (Figure 4I). However, for large multi-domain proteins, whose post-translational import could clog the translocase, the initiation signal must emerge before complete translation (Figure 4I). Our data suggest that the exposure of a large globular domain provides this signal (Figure 4I). In the simplest model, the emergence of a domain shifts the energetics to favor intradomain interactions, which outcompete the earlier intermolecular inhibitory interactions and expose the MTS for recognition by targeting and import machineries. Alternatively, or in addition, an emerged protein domain exposes unsatisfied contacts due to the lack of interdomain interactions that could be recognized by molecular chaperones.52 The binding of these chaperones on the nascent chain could stabilize the interaction of their co-chaperones with the MTS,53 which outcompetes the earlier repressive associations and allows targeting to be initiated. This multi-layered mechanism, involving the early inhibition of MTS-driven targeting followed by dis-inhibition at later stages (Figure 4I), minimizes the use of cotranslational import while ensuring the successful import of large proteins that are prone to form kinetically trapped structures. This provides an elegant mechanism to maintain the balance between preventing irreversible folding/misfolding in the cytosol and accommodating the capacity of import machineries.
Limitations of the study
Our work identified mitochondrial proteins that could utilize and potentially benefit from cotranslational targeting in human cells. What population of these proteins is targeted cotranslationally remains unclear. Additionally, our results were obtained in HEK293T cells under standard cell culture conditions; the use of a cotranslational targeting pathway may vary depending on the cell type or metabolic state. Finally, association of the RNCs with the TOM complex likely initiate via stable interactions between the nascent chains and the TOM/TIM complex. Whether and when ribosomes form a stable junction with the TOM complex during import requires further investigation.
RESOURCE AVAILABILITY
Lead contact
Further information and requests for resources and reagents should be directed to and will be fulfilled by the lead contact, Shu-ou Shan (sshan@caltech.edu).
Materials availability
Materials generated in this study will be available upon reasonable request.
Data and code availability
All sequencing data generated in this study are available at GEO under accession numberGEO: GSE255657. Co-co interaction data is publicly available at GEO under accession number GEO: GSE151959. Additional datasets and predictions are provided in the supplemental information.
Custom code is available at Zenodo: https://doi.org/10.5281/zenodo.16712750.
Any additional information required to reanalyze the data reported in this paper is available from the lead contact upon request.
STAR★METHODS
EXPERIMENTAL MODEL AND STUDY PARTICIPANT DETAILS
Human cell lines
HEK293-T cells were cultured in high glucose DMEM media supplemented with GlutaMAX™ and pyruvate (Gibco) + 10% fetal bovine serum (Gibco). Cells were grown at 37°C and passaged regularly using Trypsin-EDTA for dissociation.
METHOD DETAILS
Cell line generation
TOM22-TwinStrep cell line
The sequence encoding a TEV cleavage site followed by TwinStrep tag was inserted upstream of the stop codon of endogenous TOMM22 via CRISPR/Cas9-mediated homology-directed repair (HDR) according to.55 Briefly, the repair template was designed as a single-stranded DNA oligonucleotide (ssODN) with ~45 nt homology arms at each side of insertion (Table S5) and purchased from IDT. Cells were transfected with pCas9-sgRNA plasmid (derived from PX459, Addgene) expressing the sgRNA targeting TOMM22 (ATAACAATCTAGATCTTTCCAGG), and the ssODN repair template using lipofectamine 3000 (Thermo Fisher). Cells were grown for 24 hrs and treated with puromycin for 48 hrs to select for successfully transfected clones. Single-cell clones were isolated by limiting dilution. Successful edits were verified by the sequencing of PCR (fwd GCACCTGAGTTGACCAACAGTT, rev CTCCCCACCAGGTTTAGATAGATC) products and western blotting.
NACα/β rapid depletion cell lines
Cell lines harboring the AtAFB2-miniIAA7 system were generated using the CRISPR/Cas-9 system following the protocol in.41 Briefly, the auxin receptor F-box protein, AtAFB2, was first integrated into TOMM22-TwinStrep cells at the AAVS1 safe harbor locus via CRISPR/Cas9-mediated HDR. Cells were co-transfected with pCas9-sgAAVS1–1(129726, Addgene) and pSH-EFIRES-B-AtAFB2-mCherry (129718, Addgene) using lipofectamine 3000 (Thermo Fisher). Cells were grown for 24 hrs and treated with puromycin and blasticidin to select for successfully transfected clones. Single-cell clones were isolated by limiting dilution, and successful edits were validated based on imaging of mCherry fluorescence.
To generate the NACα-AID cell line, the sequence of the degron, miniIAA7, was cloned from pSH-EFIRES-B-Seipin-miniIAA7-mEGFP (129719, Addgene). The sequence encoding GFP11-miniIAA7-GS linker was inserted at the N-terminus of NACA at its endogenous locus via CRISPR/Cas9-mediated HDR. The repair template was designed as a plasmid with ~700 nt homology arms at each side of the insertion (Table S5). AtAFB2 integrated cells were co-transfected with pCas9-sgRNA plasmid (derived from PX459, Addgene) expressing sgRNA targeting NACA (GCTTCGCCGGGCATTTCTGAAGG) and the repair template using lipofectamine 3000 (Thermo Fisher). On the following day, cells were transfected with pcDNA5-GFP1–10 plasmid (a gift from Rebecca Voorhees) expressing GFP1–10. GFP+ and mCherry+ cells were selected by FACS after 24 hours. Single clones were grown, and the successful edits were verified by the sequencing of PCR (fwd GCCCTCCTCGGAGTTTTTAAGAATA, rev AGGGACAGGAATTGCCCTTAA) products and western blotting.
The NACβ-AID cell line was made similarly as described above. A GS linker-miniIAA7-GFP11 sequence was inserted at residue 176 of endogenous BTF3 via CRISPR/Cas9-mediated HDR. AtAFB2 integrated cells were co-transfected with pCas9-sgRNA plasmid (derived from PX459, Addgene) expressing sgRNA targeting BTF3 (TTTCCTTTCATAGCTGTGGATGG) and the repair template (Table S5) using lipofectamine 3000 (Thermo Fisher). Single clones were selected by FACS, and successful edits were validated by the sequencing of PCR (fwd TGTGGGTTTTACCTGCACTCT, rev CCCTCTTCCCTGGGTAGTTTT) products and western blotting.
COQ3-repeat cell line
The sequence encoding the COQ3-repeat was integrated into the genome of TOMM22-TwinStrep cells via the PiggyBac transposon system.67 The COQ3-repeat gene was generated by insertion of a tandem repeat of residues 94–137 in WT COQ3. It was then codon-changed to distinguish from WT COQ3 (Table S5) and cloned into a PiggyBac vector (a gift from Shasha Chong), which co-expresses a puromycin resistance gene. Cells were co-transfected with PiggyBac-COQ3-repeat plasmid and SuperPiggyBac transposase plasmid using lipofectamine 3000 (Thermo Fisher). Cells were grown for 24 hrs and treated with puromycin for 48 hrs to select for successfully transfected clones. After 48 hrs of recovery, cells were treated again with puromycin for 7 days to select for cells with successful gene integration.
Other cell lines
The DLAT-domain reordered gene, ALDH5A1 domainI-MDH2 gene, DLAT domains II+III-MDH2 gene, DLAT domain IV-MDH2 gene, DLAT domains I+II+II-sfGFP gene and DLAT domains I+IV gene (Table S5) were cloned into the PiggyBac vector and integrated into the genome of TOMM22-TwinStrep cells as described above.
Selective ribosome profiling of TOM complex
Cells were grown on 150 mm dishes to ~90% confluency. 8 dishes of cells were treated with 100 μg/ml cycloheximide for 2 min at 37 °C. The media was removed, and all subsequent steps were performed on ice using ice-cold solutions. Cells were detached by pipetting 10 ml of 1x PBS supplemented with 100 μg/ml cycloheximide and 10 mM MgCl2 per two dishes and centrifuged at 2000 ×g for 3 min at 4 °C. Pelleted cells were lysed in 7.2 mL Lysis Buffer (50 mM Tris pH 7.4, 100 mM NaCl, 10 mM Mg(OAc)2, 1% digitonin, 100 μg/mL cycloheximide, 25 U/ml Turbo DNase (Invitrogen), 1x protease inhibitors (Complete EDTA-free, Roche)) and incubated on ice for 10 min. Cell lysate was triturated five times through a 26-G needle and clarified by centrifugation at 14, 000 rpm for 5 min at 4 °C. To test the effects of cycloheximide treatment, cells were treated with 100 μg/ml cycloheximide for 15 min at 37 °C before harvesting. Cells were then harvested and lysed as described above.
For DSP crosslinked samples, cells were grown on 150 mm dishes to ~90% confluency and treated with 100 μg/ml cycloheximide for 2 min at 37 °C. The media was removed, and cells were washed once using 1x PBS supplemented with 100 μg/ml cycloheximide and 10 mM MgCl2. 10 mL crosslinking buffer (1x PBS, 100 μg/ml cycloheximide, 10 mM MgCl2, 250 μM DSP) was added per dish and incubated for 5 min at room temperature. To quench the reaction, 50 mM Tris pH 7.4 was added and incubated for 5 min. All subsequent steps were performed on ice using ice-cold solutions. Crosslinking buffer was removed, and 900 μL Lysis Buffer was added to each dish. Cells were detached by scraping, and the cell lysate was collected and incubated on ice for 10 min. Subsequent steps were the same for crosslinked and uncrosslinked samples.
RNA concentration in the lysate was measured by Qubit HS RNA assay, and polysomes were digested with 150 U RNase1 (Ambion) / 40 μg RNA for 30 min at 4 °C with constant rotation. Digestion was stopped by 100 U/mL SUPERase*In RNase Inhibitor (Ambion) and chilling on ice. Monosomes were purified by centrifugation through Sucrose Cushion (1 M sucrose, 50 mM Tris pH 7.4, 100 mM NaCl, 10 mM Mg(OAc)2, 0.1% digitonin, 100 μg/mL cycloheximide) in a TLA100.3 rotor at 100,000 rpm for 60 min at 4 °C. Pellets were washed once and resuspended in 1.2 mL Wash Buffer (50 mM Tris pH 7.4, 100 mM NaCl, 10 mM Mg(OAc)2, 0.01% digitonin, 100 μg/mL cycloheximide). 10 μg of total RNA were removed from resuspended monosomes for ribosome profiling of the total translatome. 1.6 mL MagStrep “type3” XT beads (5% suspension, IBA Lifesciences, pre-washed for 3 times in Wash Buffer) was added to the remainder of the sample, and the suspension was rotated for 45 min at 4 °C. Beads were washed 4 ×5 min at 4 °C in Wash Buffer. During each wash, beads were transferred to a new low adhesion tube. After the fourth wash, beads and the total monosome sample were incubated with 400 μL Trizol reagent (Thermo) for 10 min at room temperature. The supernatant was used for subsequent RNA extraction using the Direct-zol kit (Zymo) according to manufacturer’s instructions.
Ribosome profiling libraries were prepared as described in 50 with an additional rRNA depletion step and sequenced on a Nextseq 2000. rRNA depletion was performed on the linker-ligated RNA footprints using the riboPOOL Ribo-Seq (human) kit (Galen) according to the manufacturer’s instructions.
qPCR quantification
The RNC-TOM complexes were isolated as described above, except that the RNase treatment was omitted. Intact mRNAs were purified from the total and TOM-bound ribosomes. 500 ng mRNA was reverse transcribed into cDNA using PrimeScript RT Reagent Kit (Takara) according to manufacturer’s instructions. cDNA was diluted 200-fold, and 0.5 uL of diluted cDNA was mixed with 500 nM each of forward and reverse primers, 5 μL 2x PowerUP SYBR Green Master Mix, and nuclease-free water to prepare a 10 μL qPCR reaction. The qPCR assays were performed on CFX 96-Real Time PCR Detection System.
Data analysis
Processing of sequencing data
Raw sequencing data was processed as described in 34. Briefly, 3’ adaptor sequences were trimmed from sequencing reads with Cutadapt v4.156 using the following command:
cutadapt –cores=0 -q20 -m24 -M42 –discard-untrimmed -O6 –no-indels -a adaptor_sequence -o outfile.fastq.gz infile.fastq.gz 1> Cutadapt_report.txt
Unique molecular identifiers (UMIs, two random 5’ nucleotides and five random 3’ nucleotides) were trimmed from each read using a Julia script (Script1) from.34 This generates an output fastq file containing the 7-nucleotide UMI information in the read name. The UMI-trimmed reads were mapped to the human ribosomal RNA sequences with Bowtie2 v2.4.557 using the following command: bowtie2 -p 32 -t -x rRNA_index -q infile.fastq.gz -p 16 –un outfile.fastq.gz -S /dev/null > Bowtie2.report.txt
Reads that did not align to ribosomal RNA sequences were mapped to human reference genome (GRCh38p13 downloaded from NCBI) with STAR 2.7.10a58 using the following command:
STAR –runThreadN 32 –genomeDir indexed_genome –readFilesIn infile.fastq.gz –outFilterMultimapNmax 1 –outFilterType BySJout –alignIntronMin 5 –outFileNamePrefix Prefix –outReadsUnmapped Fastx –outSAMtype BAM SortedByCoordinate –outSA-Mattributes All XS –quantMode GeneCounts –twopassMode Basic
For each gene, the transcript with the longest coding sequence was selected, and ribosome density was assigned to the p-site of each read using a Julia script (Script2) from.34 This generates an HDF5 file containing the 1-based indexing of nucleotide position within the CDS of each gene and the detected p-site reads at this position. Nucleotide reads at each codon were summed and used for all additional analyses via custom python scripts.
Single gene enrichment profiles
For each gene, the Reads Per Million (RPM)-normalized reads at each codon was computed for both the total translatome and TOM-interactome. The RPM-normalized reads were smoothed with a 15-residue sliding window, and a pseudocount of 0.05 RPM was added to both the total translatome and TOM-interactome for the enrichment calculation. TOM enrichment at each codon was calculated as the ratio of RPM-normalized reads in the TOM-interactome over that in the total translatome. The analysis of DiSP data34 was performed similarly by calculating the ratio of RPM-normalized reads in the disome over that in the monosome. For the analysis in Figure 3D, two cotranslational TOM substrates (MMUT, PRORP) were not detected in the co-co interaction dataset and were therefore excluded from the comparison.
Gene-level enrichment
The raw reads at each codon were summed over the entire coding sequence for each gene and normalized for gene size and sequencing depth to generate the Reads Per Kilobase per Million (RPKM)-normalized reads. This calculation was performed only for genes with greater than 50 raw reads in both the total translatome and TOM-interactome datasets. Gene-level TOM enrichment was calculated as the ratio of RPKM-normalized reads from the TOM-interactome to that from the total translatome. To account for potential contamination from affinity purification, we additionally conducted selective ribosome profiling using wildtype (untagged TOM22) HEK293-T cells (Table S1). Only genes with gene-level enrichment less than 2-fold in the control experiments were included in the data analysis (Figure 1B).
Peak detection
We defined the TOM binding peaks as the regions that met the following criteria: (1) TOM enrichment at each codon > = 2.5-fold for at least 7 consecutive codons; (2) The overlap of the peaks from two replicates > = 7 codons. The start of the first detected binding peak in each gene was defined as the onset of TOM binding. Only genes whose coverage is higher than 0.25 reads/codon in the total translatome or TOM-interactome in both replicates were used. For a few mitochondrial proteins, the longest coding sequence that was used previously in the sequencing reads alignment was not their major isoform annotated in MitoCarta 3.0.68 The onset of peaks on these proteins were manually curated to match their position on the major isoform.
Metagene profiles
Only genes whose coverage is higher than 0.25 reads/codon in the total translatome or TOM-interactome were used in all metagene analyses. For metagene analyses of the total translatome and TOM-interactome, the raw reads at each codon were first smoothed over a 15-residue sliding window, then divided by the average reads per codon of the respective gene to normalize for gene expression level. For metagene analyses of TOM enrichment and co-co interaction (disome/monosome enrichment), the enrichment scores at individual codons were calculated as described above. All genes that passed the filtering or subsets of genes (e.g. cotranslational TOM substrates) were aligned to the start codon or to the onset of TOM interaction as indicated. Metagene profiles were generated by calculating the position-wise arithmetic mean of expression-normalized reads or enrichment scores and the bootstrapped 95% confidence interval (CI).
Gene categorization
Mitochondrial genes and their mitochondrial subcompartments were annotated according to MitoCarta 3.0.68 ER genes were annotated according to Uniprot.69
Gene ontology analysis
Gene ontology analysis was performed on cotranslational TOM substrates using the Functional annotation clustering algorithm from DAVID Bioinformatics Resources59 with all detected mitochondrial proteins as the background. The analysis was performed with the default settings and ‘Reactome pathway’ was used as the annotation category. GO-terms were ranked by p-value.
Sequence feature analysis
WebLogo representation of the last 90 amino acids that have been translated at the onset of TOM engagement was performed using WebLogo3.60 The alpha-helix and beta-sheet propensity scores were calculated using NetSurfP-3.0 at each amino acid position.61 The iMTS-L propensity score was calculated using iMLP at each amino acid position.62 The charge and hydrophobicity of each amino acid was averaged over a 7 amino acids rolling window. All sequences were aligned to the onset of TOM interaction for metagene analysis. The position-wise arithmetic mean of charge, hydrophobicity, alpha-helix, beta-sheet and iMTS-L propensity scores from all sequences and bootstrapped 95% CI were calculated.
Mitochondrial targeting sequence (MTS) and domain predictions
The MTS of mitochondrial proteins was predicted by Mitofates63 and TargetP 2.066 unless it has been experimentally verified. Proteins that were predicted to have an N-terminal MTS by either method were considered to be MTS-containing. TMDs were predicted by DeepTMHMM65 unless it has been experimentally verified and deposited in Uniprot.69 DomainMapper70 was used to identify and annotate the protein domains in all mitochondrial proteins.
In silico protein structure prediction
The structure of COQ3-repeat was predicted using ColabFold,64 a Google Colab-based implementation of AlphaFold,71 using default settings. The structure alignment was performed using Pymol.
Contact order calculation
The predicted structures of all mitochondrial proteins were downloaded from AlphaFold Protein Structure Database72 (https://alphafold.ebi.ac.uk/). The absolute contact order for each protein is calculated based on the structure, as previously described.28
Logistic regression classifier
The features selected for classification were the length of the protein and the binary ‘MTS?’ indicator. The dataset was partitioned into training and test sets, with 20% of the data reserved for testing. A logistic regression classifier was used for model training. To evaluate the model’s performance and generalizability, 10-fold stratified cross-validation was employed on the training data. In each fold, the model was trained on the training subset and predictive probabilities were obtained for the validation subset. These probabilities were used to compute the Receiver Operating Characteristic (ROC) curve, and the Area Under the Curve (AUC) was calculated as a metric of model performance.
Western blotting
For in vivo ribosome binding analysis, cells were lysed in Lysis Buffer (50 mM Tris pH 7.4, 100 mM NaCl, 10 mM Mg(OAc)2, 1% digitonin, 100μg/mL cycloheximide, 25 U/ml Turbo DNase (Invitrogen), 1x protease inhibitors (Complete EDTA-free, Roche)), and the lysate was clarified by centrifugation at 14,000 rpm for 5 min at 4°C. Ribosomes were pelleted by centrifugation through Sucrose Cushion (1 M sucrose, 50 mM Tris pH 7.4, 100 mM NaCl, 10 mM Mg(OAc)2, 0.1% digitonin, 100 μg/mL cycloheximide) in a TLA100.3 rotor at 100,000 rpm for 60 min at 4°C. Total lysate, supernatant, and resuspended pellet were analyzed by SDS-PAGE and immunoblotting.
For TOM22-TwinStrep affinity purification, the cleared lysate or resuspended ribosomes were used as the input and the purification was performed as described above. After the final wash, beads were incubated with 1x SDS loading buffer and boiled for 5 min. The input and elution samples were analyzed by SDS-PAGE and immunoblotting.
For analysis of NACα/β depletion, indole-3-acetic acid sodium (IAA, Santa Cruz, sc-215171) was prepared as a 10 mg/ml stock solution in H2O. Cells were treated with 100 μg/mL IAA or water for the indicated time, collected and lysed in WB lysis buffer (50 mM Tris pH 7.4, 100 mM NaCl, 10 mM Mg(OAc)2, 1% NP-40, 1 mM DTT, 25 U/ml Turbo DNase (Invitrogen), 1x protease inhibitor (Complete EDTA-free, Roche)). The lysate was clarified by centrifugation at 14,000 rpm for 5 min at 4°C and analyzed by SDS-PAGE and immunoblotting.
Mitochondrial isolation
Mitochondria were isolated from HEK293T cells according to.18 HEK293T cells were pelleted by centrifugation at 300 × g for 5 min. Cells were washed by resuspending in homogenization buffer containing 210 mM D-mannitol, 70 mM sucrose, 5 mM HEPES pH 7.4, 1 mM PMSF, and 2 mg/mL BSA and pelleting by centrifugation at 500 × g for 5 min. Pellets were resuspended in homogenization buffer and incubated on ice for 5 min. Cells were then lysed with 25 strokes in a glass Dounce homogenizer with a tight-fitting pestle. Lysed cells were centrifuged at 1300 × g for 5 min to remove nuclei and unbroken cells, then the supernatant was transferred to a clean tube. This step was repeated twice to obtain nuclei-free homogenate. Mitochondria were then pelleted by centrifugation at 11,000 × g for 10 min. Mitochondria were washed twice by resuspending in isolation buffer containing 210 mM D-mannitol, 70 mM sucrose, 5 mM HEPES pH 7.4, 10 mM EDTA and pelleting by centrifugation at 11,000 × g for 10 min. The final mitochondrial pellet was resuspended with 10μl isolation buffer without EDTA. To quantify mitochondrial samples, the protein concentration was measured using a Bradford assay.
In vitro mitochondrial import
In vitro translations were carried out in rabbit reticulocyte lysate (RRL) according to.73 Constructs for in vitro translation reactions were based on the pSP64 vector (Promega, USA). Templates for transcription were generated by PCR, with primers annealing to sequences upstream of the SP6 promoter and downstream of the stop codon. Transcription was performed at 37°C for 1.5 h with SP6 polymerase and a final concentration of 40 mM HEPES pH 7.6, 6 mM MgCl2, 2 mM spermidine, 10 mM DTT, 1 x NTPs (0.5 mM each), 0.5 mM Cap analog 7-methyl diguanosine triphosphate. The transcription reaction mixture was then directly used in a translation reaction. Each 50 μL translation contained 28.5 μL 1x T2 mix composed of the rabbit reticulocyte lysate, amino acids, and an energy mix, 10 μL transcription reaction, 50 μCi [35S]-Methionine, 4 μM cold Methionine, 250 mM sucrose, 0.1 μg/μL tRNA.
For cotranslational mitochondrial import, 5 μg of purified human mitochondria was added to a 7 μL translation reaction 1 min after initiation of translation at 32°C, and the reaction was further incubated at 32°C for 40 min. For post-translational import, the translation reaction was incubated at 32°C for 40 min, followed by treatment with 100 μg/mL cycloheximide for 5 min to stop protein synthesis. 5 μg of purified mitochondria was then added into a 7 μL translation reaction, and the mixture was further incubated at 32°C for 40 min. The reactions were analyzed by SDS-PAGE and autoradiography. Protease digestion was performed by adding 0.25 mg/mL proteinase K and incubating on ice for 30 min, followed by quenching with 5 mM PMSF.
Fluorescence microscopy imaging
NACα and NACβ rapid depletion cells were plated onto 35mm glass bottom dishes (MatTek) and treated with 100 μg/mL IAA or water for 4.5 hrs. Cells were then transfected with plasmids encoding mitochondrial matrix-targeted GFP1–10 and TRAP1-GFP11 with or without an MTS using lipofectamine 3000 (Thermo Fisher). After 16 hrs, cells were imaged on a Leica Stellaris 8 FALCON laser scanning confocal microscope.
QUANTIFICATION AND STATISTICAL ANALYSIS
All analyses were performed in python. Statistical significance was determined using independent-samples t-test. The p-values are indicated in figure legends.
Supplementary Material
SUPPLEMENTAL INFORMATION
Supplemental information can be found online at https://doi.org/10.1016/j.cell.2025.07.021.
KEY RESOURCES TABLE.
| REAGENT or RESOURCE | SOURCE | IDENTIFIER |
|---|---|---|
|
| ||
| Antibodies | ||
|
| ||
| TOM40 | Santa Cruz | RRID: AB_10847086 |
| TOM20 | Santa Cruz | RRID: AB_628381 |
| TOM22 | Santa Cruz | RRID: AB_1130526 |
| TOM70 | Proteintech | RRID: AB_2303727 |
| Tim23 | Santa Cruz | RRID: AB_2923126 |
| MTCH2 | Abcam | RRID: AB_10863500 |
| RPS6 | Cell Signaling | RRID: AB_2238583 |
| RPL10 | Abcepta | RRID: AB_3712188 |
| GAPDH | Thermo Fisher | RRID: AB_10977387 |
| GFP | Abcam | RRID: AB_2313768 |
| NACα | Thermo Fisher | RRID: AB_2901137 |
| NACβ | Abcam | RRID: AB_2783867 |
| IRDye 680RD Goat anti-Mouse IgG | LiCOr | RRID: AB_10956588 |
| IRDye 800CW Goat anti-Rabbit IgG | LiCOr | RRID: AB_621843 |
|
| ||
| Chemicals, peptides, and recombinant proteins | ||
|
| ||
| DMEM, high glucose, GlutaMAX Supplement, pyruvate | Thermo Fisher | 10569010 |
| Fetal bovine serum | Thermo Fisher | 26140079 |
| Lipofectamine 3000 | Thermo | L3000001 |
| Trypsin-EDTA (0.25%), phenol red | Thermo Fisher | 25200056 |
| Cycloheximide | Sigma | C1988-1G |
| Blasticidin | sigma | 15205-25MG |
| Puromycin | sigma | P8833-10MG |
| TURBO DNase | Invitrogen | AM2238 |
| RNase I | Invitrogen | AM2294 |
| SUPERase-In RNase Inhibitor | Invitrogen | AM2696 |
| Magstrep type3 | IBA | 2-4090-010 |
| TRIzol | Thermo Fisher | 15596026 |
| SYBR gold | Thermo Fisher | S11494 |
| GlycoBlue Coprecipitant | Thermo Fisher | AM9515 |
| microRNA marker | NEB | N2102S |
| T4 Polynucleotide Kinase | NEB | M0201S |
| T4 RNA Ligase 2, truncated K227Q | NEB | M0351L |
| Rec J Exonuclease | epicentre | RJ411250 |
| 5’ Deadenylase | NEB | M0331S |
| 5’ DNA Adenylation Kit | NEB | E2610S |
| Superscript™ III Reverse Transcriptase | Invitrogen | 18080044 |
| Human Ribo-Seq 12 rxn Probes | Galen molecular | dp-R012-000042 |
| Pierce Streptavidin Magnetic Beads | Thermo Fisher | 88816 |
| CircLigase™ ssDNA Ligase | Epicentre | CL4115K |
| Phusion Polymerase HF | NEB | M0530S |
| Digitonin | Sigma | D141-500MG |
| Bovine Serum Albumin (BSA), Fraction V, Protease Free | Goldbio | A-420-500 |
| Indole-3-acetic acid sodium salt | Sigma | I5148-2G |
| 35S Methionine | Perkin - Elmer | NEG009A005MC |
| Pierce™ Premium Grade DSP | Thermo Fisher | PG82081 |
| cOmplete™, EDTA-free Protease Inhibitor Cocktail | Sigma | 11873580001 |
| m7G(5’)ppp(5’)G RNA Cap Structure Analog | NEB | S1404S |
| Proteinase K, recombinant | Sigma | 3115879001 |
|
| ||
| Critical commercial assays | ||
|
| ||
| Direct-zol RNA Microprep | Zymo | R2060 |
| Oligo Clean & Concentrator | Zymo | D4060 |
| Megascript SP6 kit | Thermo Fisher | AM1330 |
| Qubit™ RNA HS Assay Kit | Thermo Fisher | Q32852 |
| Qubit™ 1X dsDNA High Sensitivity (HS) and Broad Range (BR) Assay Kits | Thermo Fisher | Q33230 |
|
| ||
| Deposited data | ||
|
| ||
| Raw sequencing data | This paper | GEO: GSE255657 |
| Co-co interaction data | Bertolini et al.34 | GEO: GSE151959 |
| Code for ribosome profiling data analysis | This paper | Zenodo: https://doi.org/10.5281/zenodo.16712750 |
| APEX-seq data | Fazal et al.10 | PMID: 31230715 |
|
| ||
| Experimental models: Cell lines | ||
|
| ||
| HEK293T | ATCC | CRL-3216 |
|
| ||
| Oligonucleotides | ||
|
| ||
| 5’-/5Phos/NNNNNATCGTAGATCGGAAGAGCACACGTCTGAA/3ddC/ | McGlincy et al.54 | NI-810 |
| 5’-/5Phos/NNNNNAGCTAAGATCGGAAGAGCACACGTCTGAA/3ddC/ | McGlincy et al.54 | NI-811 |
| 5’-/5Phos/NNNNNCGTAAAGATCGGAAGAGCACACGTCTGAA/3ddC/ | McGlincy et al.54 | NI-812 |
| 5’-/5Phos/NNNNNCTAGAAGATCGGAAGAGCACACGTCTGAA/3ddC/ | McGlincy et al.54 | NI-813 |
| 5’-/5Phos/NNAGATCGGAAGAGCGTCGTGTAGGGAAAGAG/iSp18/GTGACTGGAGTTCAGACGTGTGCTC | McGlincy et al.54 | NI-802 |
| 5’-AATGATACGGCGACCACCGAGATCTACACTCTTTCCCTACACGACGCTC | McGlincy et al.54 | NI-NI-798 |
|
| ||
| Recombinant DNA | ||
|
| ||
| pSpCas9(BB)-2A-GFP (PX458) | Ran et al.55 | Addgene 48138 |
| pCas9-sgAAVS1-1 | Li et al.41 | Addgene129726 |
| pSH-EFIRES-B-AtAFB2-mCherry | Li et al.41 | Addgene129718 |
| pSP64 | Voorhees lab | N/A |
| pPB-EF1A | Chong lab | N/A |
| Repair template sequences | This paper | Table S5 |
| Gene mutant sequences | This paper | Table S5 |
| Software and algorithms | ||
| Cutadapt v4.1 | Martin, M.56 | RRID:SCR_011841 |
| Bowtie2 v2.4.5 | Langmead et al.57 | RRID:SCR_016368 |
| STAR 2.7.10a | Dobin et al.58 | RRID:SCR_004463 |
| DAVID Bioinformatics Resources | Sherman et al.59 | RRID:SCR_001881 |
| WebLogo 3.0 | Crooks et al.60 | RRID:SCR_010236 |
| NetSurfP | Høie et al.61 | RRID:SCR_018781 |
| iMLP | Schneider et al.62 | N/A |
| Mitofates | Fukasawa et al.63 | N/A |
| ColabFold | Mirdita et al.64 | RRID:SCR_025453 |
| DeepTMHMM | Hallgren et al.65 | RRID:SCR_025039 |
| TargetP 2.0 | Almagro Armenteros et al.66 | RRID:SCR_019022 |
Highlights.
Selective ribosome profiling reveals the cotranslational interactome of the TOM complex
Cotranslational import prioritizes large mitochondrial proteins with complex topology
An N-terminal presequence is necessary but insufficient for import during translation
Emergence of a large globular domain allows the initiation of cotranslational import
ACKNOWLEDGMENTS
We thank B. Bukau, G. Kramer, D. Chan, and M. Gunnigmann for helpful discussions and advice on data analysis and interpretation; A. Guna and R. Voorhees for sharing the mitochondrial split-GFP system plasmids; Q. Han for help with microscopy experiments; Caltech Flow Cytometry and Cell Sorting Facility for support with FACS experiments; Millard and Muriel Jacobs Genetics and Genomics Laboratory at Caltech for support with sequencing; and members of the Shan lab for comments on the manuscript. This work was supported by the National Institutes of Health grant R35 GM136321 to S.-o.S. and the Howard Hughes Medical Institute through a Freeman Hrabowski Scholar grant to Rebecca Voorhees. E.D.L. acknowledges support from the European Research Council (ERC) under the European Union’s Horizon 2020 research and innovation program (grant agreement no. 819318), by the Human Frontiers Science Program Organization (ref. RGP0016/2022), and by the Israel Science Foundation (grant no. 1452/18).
Footnotes
DECLARATION OF INTERESTS
Authors declare no competing interests.
REFERENCES
- 1.Pfanner N, Warscheid B, and Wiedemann N (2019). Mitochondrial proteins: from biogenesis to functional networks. Nat. Rev. Mol. Cell Biol. 20, 267–284. 10.1038/s41580-018-0092-0. [DOI] [PMC free article] [PubMed] [Google Scholar]
- 2.Becker T, Song J, and Pfanner N (2019). Versatility of Preprotein Transfer from the Cytosol to Mitochondria. Trends Cell Biol. 29, 534–548. 10.1016/j.tcb.2019.03.007. [DOI] [PubMed] [Google Scholar]
- 3.Bykov YS, Rapaport D, Herrmann JM, and Schuldiner M (2020). Cytosolic Events in the Biogenesis of Mitochondrial Proteins. Trends Biochem. Sci. 45, 650–667. 10.1016/j.tibs.2020.04.001. [DOI] [PubMed] [Google Scholar]
- 4.Busch JD, Fielden LF, Pfanner N, and Wiedemann N (2023). Mitochondrial protein transport: Versatility of translocases and mechanisms. Mol. Cell 83, 890–910. 10.1016/j.molcel.2023.02.020. [DOI] [PubMed] [Google Scholar]
- 5.Wiedemann N, and Pfanner N (2017). Mitochondrial Machineries for Protein Import and Assembly. Annu. Rev. Biochem. 86, 685–714. 10.1146/annurev-biochem-060815-014352. [DOI] [PubMed] [Google Scholar]
- 6.Araiso Y, Imai K, and Endo T (2022). Role of the TOM Complex in Protein Import into Mitochondria: Structural Views. Annu. Rev. Biochem. 91, 679–703. 10.1146/annurev-biochem-032620-104527. [DOI] [PubMed] [Google Scholar]
- 7.Cohen B, Golani-Armon A, and Arava YS (2024). Emerging implications for ribosomes in proximity to mitochondria. Semin. Cell Dev. Biol. 154, 123–130. 10.1016/j.semcdb.2023.01.003. [DOI] [PubMed] [Google Scholar]
- 8.Tsuboi T, Viana MP, Xu F, Yu J, Chanchani R, Arceo XG, Tutucci E, Choi J, Chen YS, Singer RH, et al. (2020). Mitochondrial volume fraction and translation duration impact mitochondrial mRNA localization and protein synthesis. eLife 9, e57814. 10.7554/eLife.57814. [DOI] [PMC free article] [PubMed] [Google Scholar]
- 9.Gadir N, Haim-Vilmovsky L, Kraut-Cohen J, and Gerst JE (2011). Localization of mRNAs coding for mitochondrial proteins in the yeast Saccharomyces cerevisiae. RNA 17, 1551–1565. 10.1261/rna.2621111. [DOI] [PMC free article] [PubMed] [Google Scholar]
- 10.Fazal FM, Han S, Parker KR, Kaewsapsak P, Xu J, Boettiger AN, Chang HY, and Ting AY (2019). Atlas of Subcellular RNA Localization Revealed by APEX-Seq. Cell 178, 473–490.e26. 10.1016/j.cell.2019.05.027. [DOI] [PMC free article] [PubMed] [Google Scholar]
- 11.Marc P, Margeot A, Devaux F, Blugeon C, Corral-Debrinski M, and Jacq C (2002). Genome-wide analysis of mRNAs targeted to yeast mitochondria. EMBO Rep. 3, 159–164. 10.1093/embo-reports/kvf025. [DOI] [PMC free article] [PubMed] [Google Scholar]
- 12.Gold VA, Chroscicki P, Bragoszewski P, and Chacinska A (2017). Visualization of cytosolic ribosomes on the surface of mitochondria by electron cryo-tomography. EMBO Rep. 18, 1786–1800. 10.15252/embr.201744261. [DOI] [PMC free article] [PubMed] [Google Scholar]
- 13.Williams CC, Jan CH, and Weissman JS (2014). Targeting and plasticity of mitochondrial proteins revealed by proximity-specific ribosome profiling. Science 346, 748–751. 10.1126/science.1257522. [DOI] [PMC free article] [PubMed] [Google Scholar]
- 14.Zahedi RP, Sickmann A, Boehm AM, Winkler C, Zufall N, Schönfisch B, Guiard B, Pfanner N, and Meisinger C (2006). Proteomic Analysis of the Yeast Mitochondrial Outer Membrane Reveals Accumulation of a Subclass of Preproteins. Mol. Biol. Cell 17, 1436–1450. 10.1091/mbc.e05-08-0740. [DOI] [PMC free article] [PubMed] [Google Scholar]
- 15.Oh E, Becker AH, Sandikci A, Huber D, Chaba R, Gloge F, Nichols RJ, Typas A, Gross CA, Kramer G, et al. (2011). Selective ribosome profiling reveals the cotranslational chaperone action of trigger factor in vivo. Cell 147, 1295–1308. 10.1016/j.cell.2011.10.044. [DOI] [PMC free article] [PubMed] [Google Scholar]
- 16.Araiso Y, Tsutsumi A, Qiu J, Imai K, Shiota T, Song J, Lindau C, Wenz LS, Sakaue H, Yunoki K, et al. (2019). Structure of the mitochondrial import gate reveals distinct preprotein paths. Nature 575, 395–401. 10.1038/s41586-019-1680-7. [DOI] [PubMed] [Google Scholar]
- 17.Tucker K, and Park E (2019). Cryo-EM structure of the mitochondrial protein-import channel TOM complex at near-atomic resolution. Nat. Struct. Mol. Biol. 26, 1158–1166. 10.1038/s41594-019-0339-2. [DOI] [PMC free article] [PubMed] [Google Scholar]
- 18.Guna A, Stevens TA, Inglis AJ, Replogle JM, Esantsi TK, Muthukumar G, Shaffer KCL, Wang ML, Pogson AN, Jones JJ, et al. (2022). MTCH2 is a mitochondrial outer membrane protein insertase. Science 378, 317–322. 10.1126/science.add1856. [DOI] [PMC free article] [PubMed] [Google Scholar]
- 19.Jackson R, and Standart N (2015). The awesome power of ribosome profiling. RNA 21, 652–654. 10.1261/rna.049908.115. [DOI] [PMC free article] [PubMed] [Google Scholar]
- 20.Gomkale R, Linden A, Neumann P, Schendzielorz AB, Stoldt S, Dybkov O, Kilisch M, Schulz C, Cruz-Zaragoza LD, Schwappach B, et al. (2021). Mapping protein interactions in the active TOM-TIM23 supercomplex. Nat. Commun. 12, 5715. 10.1038/s41467-021-26016-1. [DOI] [PMC free article] [PubMed] [Google Scholar]
- 21.Surapornsawasd T, Ogawa T, and Moriyama K (2015). Identification of nuclear localization signals within the human BCOR protein. FEBS Lett. 589, 3313–3320. 10.1016/j.febslet.2015.05.046. [DOI] [PubMed] [Google Scholar]
- 22.Lee-glover L, and Shutt T (2024). Mitochondrial quality control pathways sense mitochondrial protein import. Trends Endocrinol. Metab. 35, 308–320. 10.1016/j.tem.2023.11.004. [DOI] [PubMed] [Google Scholar]
- 23.Sekine Y, Houston R, Eckl EM, Fessler E, Narendra DP, Jae LT, and Sekine S (2023). A mitochondrial iron-responsive pathway regulated by DELE1. Mol. Cell 83, 2059–2076.e6. 10.1016/j.molcel.2023.05.031. [DOI] [PMC free article] [PubMed] [Google Scholar]
- 24.Fessler E, Krumwiede L, and Jae LT (2022). DELE1 tracks perturbed protein import and processing in human mitochondria. Nat. Commun. 13, 1853. 10.1038/s41467-022-29479-y. [DOI] [PMC free article] [PubMed] [Google Scholar]
- 25.Johnson ZL, Ammirati M, Wasilko DJ, Chang JS, Noell S, Foley TL, Yoon H, Smith K, Asano S, Hales K, et al. (2023). Structural basis of the acyl-transfer mechanism of human GPAT1. Nat. Struct. Mol. Biol. 30, 22–30. 10.1038/s41594-022-00884-7. [DOI] [PubMed] [Google Scholar]
- 26.Gutin AM, Abkevich VI, and Shakhnovich EI (1996). Chain length scaling of protein folding time. Phys. Rev. Lett. 77, 5433–5436. 10.1103/PhysRevLett.77.5433. [DOI] [PubMed] [Google Scholar]
- 27.Garbuzynskiy SO, Ivankov DN, Bogatyreva NS, and Finkelstein AV (2013). Golden triangle for folding rates of globular proteins. Proc. Natl. Acad. Sci. USA 110, 147–150. 10.1073/pnas.1210180110. [DOI] [PMC free article] [PubMed] [Google Scholar]
- 28.Ivankov DN, Garbuzynskiy SO, Alm E, Plaxco KW, Baker D, and Finkelstein AV (2003). Contact order revisited: Influence of protein size on the folding rate. Protein Sci. 12, 2057–2062. 10.1110/ps.0302503. [DOI] [PMC free article] [PubMed] [Google Scholar]
- 29.Mallik S, and Kundu S (2018). Topology and Oligomerization of Mono- and Oligomeric Proteins Regulate Their Half-Lives in the Cell. Structure 26, 869–878.e3. 10.1016/j.str.2018.04.015. [DOI] [PubMed] [Google Scholar]
- 30.Han JH, Batey S, Nickson AA, Teichmann SA, and Clarke J (2007). The folding and evolution of multidomain proteins. Nat. Rev. Mol. Cell Biol. 8, 319–330. 10.1038/nrm2144. [DOI] [PubMed] [Google Scholar]
- 31.Zhou X, Yang Y, Wang G, Wang S, Sun D, Ou X, Lian Y, and Li L (2023). Molecular pathway of mitochondrial preprotein import through the TOM-TIM23 supercomplex. Nat. Struct. Mol. Biol. 30, 1996–2008. 10.1038/s41594-023-01103-7. [DOI] [PubMed] [Google Scholar]
- 32.Fielden LF, Busch JD, Merkt SG, Ganesan I, Steiert C, Hasselblatt HB, Busto JV, Wirth C, Zufall N, Jungbluth S, et al. (2023). Central role of Tim17 in mitochondrial presequence protein translocation. Nature 621, 627–634. 10.1038/s41586-023-06477-8. [DOI] [PMC free article] [PubMed] [Google Scholar]
- 33.Wang Q, Zhuang J, Huang R, Guan Z, Yan L, Hong S, Zhang L, Huang C, Liu Z, and Yin P (2024). The architecture of substrate-engaged TOM–TIM23 supercomplex reveals preprotein proximity sites for mitochondrial protein translocation. Cell Discov. 10, 19. 10.1038/s41421-023-00643-y. [DOI] [PMC free article] [PubMed] [Google Scholar]
- 34.Bertolini M, Fenzl K, Kats I, Wruck F, Tippmann F, Schmitt J, Auburger JJ, Tans S, Bukau B, and Kramer G (2021). Interactions between nascent proteins translated by adjacent ribosomes drive homomer assembly. Science 371, 57–64. 10.1126/science.abc7151. [DOI] [PMC free article] [PubMed] [Google Scholar]
- 35.Deuerling E, Gamerdinger M, and Kreft SG (2019). Chaperone interactions at the ribosome. Cold Spring Harb. Perspect. Biol. 11, a033977. 10.1101/cshperspect.a033977. [DOI] [PMC free article] [PubMed] [Google Scholar]
- 36.Gamerdinger M, Hanebuth MA, Frickey T, and Deuerling E (2015). The principle of antagonism ensures protein targeting specificity at the endoplasmic reticulum. Science 348, 201–207. 10.1126/science.aaa5335. [DOI] [PubMed] [Google Scholar]
- 37.Jomaa A, Gamerdinger M, Hsieh H-H, Wallisch A, Chandrasekaran V, Ulusoy Z, Scaiola A, Hegde RS, Shan S-O, Ban N, et al. (2022). Mechanism of signal sequence handover from NAC to SRP on ribosomes during ER-protein targeting. Science 375, 839–844. 10.1126/science.abl6459. [DOI] [PMC free article] [PubMed] [Google Scholar]
- 38.Wiedmann B, Sakai H, Davis TA, and Wiedmann M (1994). A protein complex required for signal-sequence-specific sorting and translocation. Nature 370, 434–440. 10.1038/370434a0. [DOI] [PubMed] [Google Scholar]
- 39.Lesnik C, Cohen Y, Atir-Lande A, Schuldiner M, and Arava Y (2014). OM14 is a mitochondrial receptor for cytosolic ribosomes that supports co-translational import into mitochondria. Nat. Commun. 5, 5711. 10.1038/ncomms6711. [DOI] [PMC free article] [PubMed] [Google Scholar]
- 40.Gamerdinger M, Kobayashi K, Wallisch A, Kreft SG, Sailer C, Schlömer R, Sachs N, Jomaa A, Stengel F, Ban N, et al. (2019). Early Scanning of Nascent Polypeptides inside the Ribosomal Tunnel by NAC. Mol. Cell 75, 996–1006.e8. 10.1016/j.molcel.2019.06.030. [DOI] [PubMed] [Google Scholar]
- 41.Li S, Prasanna X, Salo VT, Vattulainen I, and Ikonen E (2019). An efficient auxin-inducible degron system with low basal degradation in human cells. Nat. Methods 16, 866–869. 10.1038/s41592-019-0512-x. [DOI] [PubMed] [Google Scholar]
- 42.Powers T, and Walter P (1996). The nascent polypeptide-associated complex modulates interactions between the signal recognition particle and the ribosome. Curr. Biol. 6, 331–338. 10.1016/S0960-9822(02)00484-0. [DOI] [PubMed] [Google Scholar]
- 43.Muthukumar G, Stevens TA, Inglis AJ, Esantsi TK, Saunders RA, Schulte F, Voorhees RM, Guna A, and Weissman JS (2024). Triaging of α-helical proteins to the mitochondrial outer membrane by distinct chaperone machinery based on substrate topology. Mol. Cell 84, 1101–1119.e9. 10.1016/j.molcel.2024.01.028. [DOI] [PubMed] [Google Scholar]
- 44.Cabantous S, Terwilliger TC, and Waldo GS (2005). Protein tagging and detection with engineered self-assembling fragments of green fluorescent protein. Nat. Biotechnol. 23, 102–107. 10.1038/nbt1044. [DOI] [PubMed] [Google Scholar]
- 45.Palmiter RD (1975). Quantitation of parameters that determine the rate of ovalbumin synthesis. Cell 4, 189. 10.1016/0092-8674(75)90167-1. [DOI] [PubMed] [Google Scholar]
- 46.Backes S, Hess S, Boos F, Woellhaf MW, Gödel S, Jung M, Mühlhaus T, and Herrmann JM (2018). Tom70 enhances mitochondrial preprotein import efficiency by binding to internal targeting sequences. J. Cell Biol. 217, 1369–1382. 10.1083/jcb.201708044. [DOI] [PMC free article] [PubMed] [Google Scholar]
- 47.Bykov YS, Flohr T, Boos F, Zung N, Herrmann JM, and Schuldiner M (2022). Widespread use of unconventional targeting signals in mitochondrial ribosome proteins. EMBO J. 41, e109519. 10.15252/embj.2021109519. [DOI] [PMC free article] [PubMed] [Google Scholar]
- 48.Akopian D, Shen K, Zhang X, and Shan SO (2013). Signal Recognition Particle: An Essential Protein-Targeting Machine. Annu. Rev. Biochem. 82, 693–721. 10.1146/annurev-biochem-072711-164732. [DOI] [PMC free article] [PubMed] [Google Scholar]
- 49.Jan CH, Williams CC, and Weissman JS (2014). Principles of ER cotranslational translocation revealed by proximity-specific ribosome profiling. Science 346, 1257521. 10.1126/science.1257521. [DOI] [PMC free article] [PubMed] [Google Scholar]
- 50.Zhu Z, Wang S, and Shan S (2022). Ribosome profiling reveals multiple roles of SecA in cotranslational protein export. Nat. Commun. 13. 10.1038/s41467-022-31061-5. [DOI] [PMC free article] [PubMed] [Google Scholar]
- 51.Haakonsen DL, Heider M, Ingersoll AJ, Vodehnal K, Witus SR, Uenaka T, Wernig M, and Rapé M (2024). Stress response silencing by an E3 ligase mutated in neurodegeneration. Nature 626, 874–880. 10.1038/s41586-023-06985-7. [DOI] [PMC free article] [PubMed] [Google Scholar]
- 52.Young JC, Hoogenraad NJ, and Hartl FU (2003). Molecular Chaperones Hsp90 and Hsp70 Deliver Preproteins to the Mitochondrial Import Receptor Tom70. Cell 112, 41–50. 10.1016/S0092-8674(02)01250-3. [DOI] [PubMed] [Google Scholar]
- 53.Juszkiewicz S, Peak-Chew S-Y, and Hegde RS (2025). Mechanism of chaperone recruitment and retention on mitochondrial precursors. Mol. Biol. Cell 36, ar39. 10.1091/mbc.E25-01-0035. [DOI] [PMC free article] [PubMed] [Google Scholar]
- 54.McGlincy NJ, and Ingolia NT (2017). Transcriptome-wide measurement of translation by ribosome profiling. Methods 126, 112–129. 10.1016/j.ymeth.2017.05.028. [DOI] [PMC free article] [PubMed] [Google Scholar]
- 55.Ran FA, Hsu PD, Wright J, Agarwala V, Scott DA, and Zhang F (2013). Genome engineering using the CRISPR-Cas9 system. Nat. Protoc. 8, 2281–2308. 10.1038/nprot.2013.143. [DOI] [PMC free article] [PubMed] [Google Scholar]
- 56.Martin M (2011). Cutadapt removes adapter sequences from high-throughput sequencing reads. EMBnet J. 17, 10. 10.14806/ej.17.1.200. [DOI] [Google Scholar]
- 57.Langmead B, and Salzberg SL (2012). Fast gapped-read alignment with Bowtie 2. Nat. Methods 9, 357–359. 10.1038/nmeth.1923. [DOI] [PMC free article] [PubMed] [Google Scholar]
- 58.Dobin A, Davis CA, Schlesinger F, Drenkow J, Zaleski C, Jha S, Batut P, Chaisson M, and Gingeras TR (2013). STAR: Ultrafast universal RNA-seq aligner. Bioinformatics 29, 15–21. 10.1093/bioinformatics/bts635. [DOI] [PMC free article] [PubMed] [Google Scholar]
- 59.Sherman BT, Hao M, Qiu J, Jiao X, Baseler MW, Lane HC, Imamichi T, and Chang W (2022). DAVID: a web server for functional enrichment analysis and functional annotation of gene lists (2021 update). Nucleic Acids Res. 50, W216–W221. 10.1093/nar/gkac194. [DOI] [PMC free article] [PubMed] [Google Scholar]
- 60.Crooks GE, Hon G, Chandonia JM, and Brenner SE (2004). WebLogo: A sequence logo generator. Genome Res. 14, 1188–1190. 10.1101/gr.849004. [DOI] [PMC free article] [PubMed] [Google Scholar]
- 61.Høie MH, Kiehl EN, Petersen B, Nielsen M, Winther O, Nielsen H, Hallgren J, and Marcatili P (2022). NetSurfP-3.0: accurate and fast prediction of protein structural features by protein language models and deep learning. Nucleic Acids Res. 50, W510–W515. 10.1093/nar/gkac439. [DOI] [PMC free article] [PubMed] [Google Scholar]
- 62.Schneider K, Zimmer D, Nielsen H, Herrmann JM, and Mühlhaus T (2021). IMLP, a predictor for internal matrix targeting-like sequences in mitochondrial proteins. Biol. Chem. 402, 937–943. 10.1515/hsz-2021-0185. [DOI] [PubMed] [Google Scholar]
- 63.Fukasawa Y, Tsuji J, Fu SC, Tomii K, Horton P, and Imai K (2015). MitoFates: Improved prediction of mitochondrial targeting sequences and their cleavage sites. Mol. Cell. Proteomics 14, 1113–1126. 10.1074/mcp.M114.043083. [DOI] [PMC free article] [PubMed] [Google Scholar]
- 64.Mirdita M, Schütze K, Moriwaki Y, Heo L, Ovchinnikov S, and Steinegger M (2022). ColabFold: making protein folding accessible to all. Nat. Methods 19, 679–682. 10.1038/s41592-022-01488-1. [DOI] [PMC free article] [PubMed] [Google Scholar]
- 65.Hallgren J, Tsirigos KD, Pedersen MD, Almagro Armenteros JJ, Marcatili P, Nielsen H, Krogh A, and Winther O DeepTMHMM predicts alpha and beta transmembrane proteins using deep neural networks. Preprint at bioRxiv. 10.1101/2022.04.08.487609. [DOI] [Google Scholar]
- 66.Almagro Armenteros JJA, Salvatore M, Emanuelsson O, Winther O, Von Heijne G, Elofsson A, and Nielsen H (2019). Detecting sequence signals in targeting peptides using deep learning. Life Sci. Alliance 2, e201900429. 10.26508/lsa.201900429. [DOI] [PMC free article] [PubMed] [Google Scholar]
- 67.Yusa K, Zhou L, Li MA, Bradley A, and Craig NL (2011). A hyperactive piggyBac transposase for mammalian applications. Proc. Natl. Acad. Sci. USA 108, 1531–1536. 10.1073/pnas.1008322108. [DOI] [PMC free article] [PubMed] [Google Scholar]
- 68.Rath S, Sharma R, Gupta R, Ast T, Chan C, Durham TJ, Goodman RP, Grabarek Z, Haas ME, Hung WHW, et al. (2021). MitoCarta3.0: An updated mitochondrial proteome now with sub-organelle localization and pathway annotations. Nucleic Acids Res. 49, D1541–D1547. 10.1093/nar/gkaa1011. [DOI] [PMC free article] [PubMed] [Google Scholar]
- 69.The UniProt Consortium (2017). UniProt: The universal protein knowledge-base. Nucleic Acids Res. 45, D158–D169. 10.1093/nar/gkw1099. [DOI] [PMC free article] [PubMed] [Google Scholar]
- 70.Manriquez-Sandoval E, and Fried SD (2022). DomainMapper: Accurate domain structure annotation including those with non-contiguous topologies. Protein Sci. 31, e4465. 10.1002/pro.4465. [DOI] [PMC free article] [PubMed] [Google Scholar]
- 71.Jumper J, Evans R, Pritzel A, Green T, Figurnov M, Ronneberger O, Tunyasuvunakool K, Bates R, Žídek A, Potapenko A, et al. (2021). Highly accurate protein structure prediction with AlphaFold. Nature 596, 583–589. 10.1038/s41586-021-03819-2. [DOI] [PMC free article] [PubMed] [Google Scholar]
- 72.Varadi M, Anyango S, Deshpande M, Nair S, Natassia C, Yordanova G, Yuan D, Stroe O, Wood G, Laydon A, et al. (2022). Alpha-Fold Protein Structure Database: Massively expanding the structural coverage of protein-sequence space with high-accuracy models. Nucleic Acids Res. 50, D439–D444. 10.1093/nar/gkab1061. [DOI] [PMC free article] [PubMed] [Google Scholar]
- 73.Sharma A, Mariappan M, Appathurai S, and Hegde RS (2010). In vitro dissection of protein translocation into the mammalian endoplasmic reticulum. Methods Mol. Biol. 619, 339–363. 10.1007/978-1-60327-412-8_20. [DOI] [PMC free article] [PubMed] [Google Scholar]
Associated Data
This section collects any data citations, data availability statements, or supplementary materials included in this article.
Supplementary Materials
Data Availability Statement
All sequencing data generated in this study are available at GEO under accession numberGEO: GSE255657. Co-co interaction data is publicly available at GEO under accession number GEO: GSE151959. Additional datasets and predictions are provided in the supplemental information.
Custom code is available at Zenodo: https://doi.org/10.5281/zenodo.16712750.
Any additional information required to reanalyze the data reported in this paper is available from the lead contact upon request.