

Abstract
This work demonstrates a batteryless, implantable blood-flow sensor with radio frequency identification (RFID) readout. This flexible sensor system was developed specifically for surgical implantation around a blood vessel, without contacting blood to reduce platelet deposition, clotting, and other complications with blood-contacting sensors. A flexible sensor and circuit architecture was adopted to enable a cuff-like form factor for surgical implantation around an artery, vein, or graft without piercing or cutting the vessel. This required the development of a flexible RFID data/power antenna using a split-double helix antenna (DHA), which could be opened and closed, unlike a solenoidal or flat spiral antenna. DHAs with diameter of 3–10 mm were fabricated and characterized on the bench, showing a typical coupling coefficient of 0.007 when placed 5 cm from a reader. Prototype implantable DHA systems were developed to wrap around vessels of 3–8 mm. A flexible pulsation sensor (FPS) was developed from a piezoresistive carbon black-polydimethylsiloxane (PDMS) nanocomposite, which enabled the measurement of vascular distension caused by blood flow. A commercial RFID chip enabled sensor readout to an external transceiver in real time with a sample rate of 12 Hz when immersed in saline test media. Validation experiments on a vascular phantom with simulated stenosis demonstrated a blood-flow rate monitoring from 200 to 400 mL/min with the capacity to distinguish flow changes as low as 10 mL/min.
Index Terms—: Blood pressure monitoring, double-helix antenna, radio frequency identification (RFID), stretchable strain sensor, wireless power transfer (WPT)
Graphical Abstract

I. Introduction
Vascular stenosis—a narrowing of the interior lumen of blood vessels—is a common vascular pathology. If left untreated, stenosis greatly increases the risk of clotting and thrombosis in vessels, leading to serious side effects requiring surgical repair or bypass. Monitoring for vascular stenosis is a common element in the postsurgical management of many surgeries, e.g., synthetic graft implantations, vessel transplants, and systemic blood-flow-related diseases. A key goal of vascular monitoring is to detect the presence and progression of stenoses in real time, allowing for surgical treatment planning and prophylactic therapies to prevent catastrophic outcomes that occur after thrombosis (complete occlusion of the vessel). However, stenoses can grow rapidly, causing hemodynamic disruptions that trigger a cascade of clotting factors, often with no detectable external symptoms. Therefore, to improve early detection of a failing vascular system—allowing for surgery planning—effective vascular monitoring tools are needed for widespread, real-time detection with minimal impact on the patient or standard of care.
Significant prior sensor development and demonstration has been pursued for monitoring stent-related pathologies such as in-stent restenosis [1]. Because stents are engineered implants, they can be pre-instrumented with sensors, antennas, and other structures before implantation. However, many vascular structures are only surgically accessed and would still benefit from sensors for detecting worsening conditions such as restenosis or endovascular leakage. Therefore, there exists a broad need for nonstent sensors, which can be independently implanted as a standalone device. The system described in this work is specifically being developed for surgical handling around vascular structures, unlike stent-based sensors that are deployed inside the vasculature [2], [3], [4].
Many vascular structures would benefit from postsurgical or chronic monitoring for thrombosis risk, i.e., vascular access grafts and fistulas [5], endovascular repairs [6], and organ and tissue transplants [7], [8], among others. Nonstent restenosis monitoring, e.g., after angioplasty, also requires frequent monitoring due to the sometimes rapid onset [9]. Current options for monitoring such structures rely almost entirely on imaging. Doppler ultrasound or angiogram imaging is the gold standard for vascular surveillance [1] but is too costly for widespread, regular use in asymptomatic individuals. Even when imaging is used, due to high cost, it is used too infrequently to provide a real-time view of the underlying trends that predict future dysfunction [5], [10], [11].
Besides the instrument cost, imaging tools are costly because they require expert clinicians to operate and interpret results. Implantable sensors, such as the Cook–Swartz probe, can qualitatively detect blood flow over short postoperative periods (typically one week) [12], but no long-term or at-home vascular monitoring sensors are in use today. Real-time detection of decreased blood flow would provide an opportunity to perform an imaging study and surgical planning for individuals at risk of thrombosis.
Previously developed devices for blood pressure monitoring include a magnetic flowmeter attached to the aortic valve [13], a wired [12], or battery-powered [14] silicon cuff that uses ultrasonic Doppler shift to detect flow and an application specific integrated circuit (ASIC)-based inductively powered silicon nanowire sensor [15]. These devices, however, are limited to the aortic valve location, require the use of a battery or wire, or need to be placed inside the graft to function. Further developments include a sensor that is partially embedded into the femoral artery [16] and a biodegradable flexible arterial-pulse sensor [17]. The first device requires the puncturing of the vessel for insertion, while the second device dissolves after some time into the body, making it unfeasible for long-term monitoring.
Here, we present an implantable sensor designed to detect changes in blood flow caused by vascular stenosis. A radio frequency identification (RFID) readout was used to enable future readout from mobile devices in an at-home setting (Fig. 1). The wireless, batteryless sensor was specifically designed in a cuff form factor to wrap around blood vessels without transection. This form factor greatly improves surgical placement on native and synthetic vessels but required the development of a split double-helix antenna (DHA). Fabrication details of the vascular sensor used—a flexible pulsation sensor (FPS)—were previously reported [18]. While our work focuses on using the FPS for vascular monitoring, the device structure is applicable to multiple organs since it operates as an implanted, metal-free strain sensor.
Fig. 1.

Endovascular repairs and vascular transplants often fail with little warning. Implanted flexible, RFID-based sensors may allow for near real-time detection of reduced blood flow, indicating a failing vascular system.
In this article, we discuss three elements for chronic implantation of an FPS for vascular monitoring: a DHA for RFID interfacing, an RFID interface supporting real-time sensor readout, and wireless feasibility demonstration on a vascular phantom. This article describes each element separately in Sections II and III.
II. Flexible RFID System for Vascular Monitoring
A. System Summary
The sensor system consisted of an RFID interface and FPS vascular sensor integrated on a polyimide flexible circuit board (Fig. 2). While the circuit board was flexible to allow surgical implantation around a vessel, the FPS element was flexible and stretchable to conform closely with the vascular anatomy. The RFID interface used a unique DHA, which was printed flat but produced magnetic windings once rolled into a cylinder. The sensor element coupled to the RFID interface consisted of an FPS. The FPS was formed from a carbon black-polydimethylsiloxane (PDMS) nanocomposite material, previously described for vascular monitoring [18]. Resistance changes in the FPS produced by vascular strain were transduced by the RFID interface IC and communicated to an external reader using a standard RFID protocol.
Fig. 2.

In this work, the flexible RFID sensor was designed to be mounted directly around a graft or vessel. An external wireless reader polled the remote sensor and transferred data to a PC for recording.
B. DHA Design and Modeling
This application targeted RFID at 13.56 MHz to reduce tissue losses after implantation. This frequency requires relatively high-Q antennas for efficient magnetic coupling for both energy transmission and load-shift-keying communication. A DHA was adapted in this application specifically because it operates like a magnetic solenoid but can be wrapped around a tubular vessel like a cuff. This allows implantation without cutting open the vessel to slide the antenna on [19]. In addition, the direction of maximum power is perpendicular to the parallel central axes of the antenna and vessel, optimizing the reader location on the skin surface instead of coaxial with blood vessels. As the DHA is only curled once during implantation, there is little risk of dynamic deformation leading to trace cracking. Trace dimensions and substrate thickness were selected to withstand a radius of curvature greater than 1.0 mm without cracking [20]. Furthermore, the DHA may be fabricated as a planar device and then curled to achieve magnetic coupling to an external reader antenna.
The DHA was defined as a series of evenly spaced sine waves, cut off at the intersection of each wave’s neighbor (Fig. 3). A via at the end of each trace allowed contact to the repeating trace on the opposite substrate side (Fig. 4). Assigning as the spacing between traces and as the diameter of the DHA, a single DHA top-layer trace as a function of horizontal location, , was defined as
| (1) |
Fig. 3.

DHA traces were generated mathematically and then imported into the PCB editor. Each DHA winding terminated in a via to allow conduction to the sequential trace on the opposite side of the substrate.
Fig. 4.
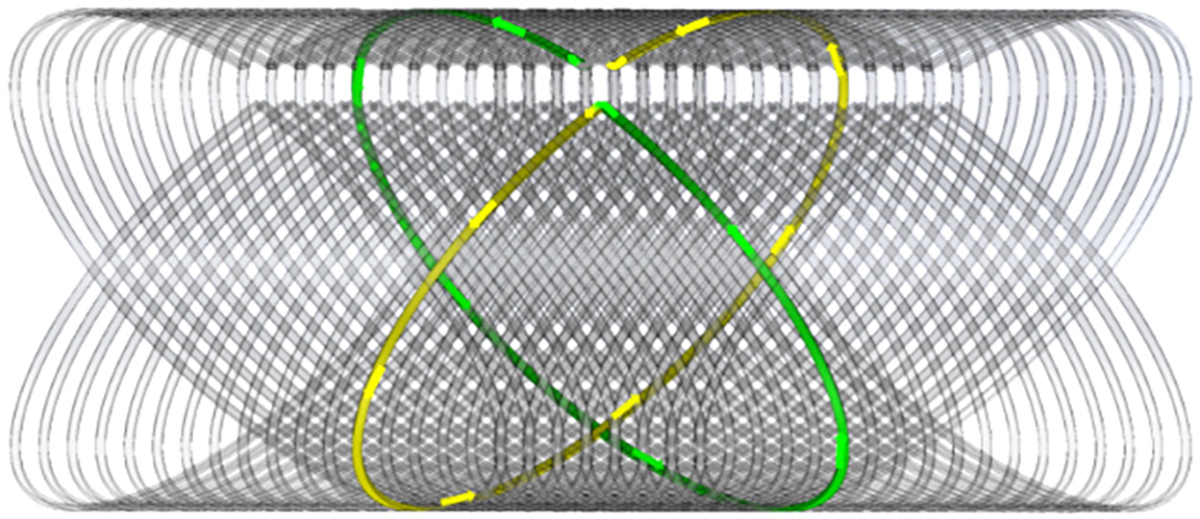
Example DHA with 25 turns. An external magnetic field generates current along the marked paths for each turn, which are in phase after the DHA is curled.
Here, we focus on developing an updated set of equations that model the DHA and DHA-transceiver system. Specifically, equations for DHA self-inductance and DHA-transceiver mutual inductance are important in optimizing the DHA for maximum power transfer given a specific size constraint. In a wireless power transfer (WPT) system, the efficiency of the system is directly proportional to the coupling coefficient [14]. Specifically, the power transfer efficiency (PTE) between a receiver (RX) and transceiver (TX) is proportional to
| (2) |
where is the operating frequency, and are the self-inductances of the two coils, and are the parasitic resistance of the two coils, and is the resistance of the load [15].
Coupling coefficient optimization is best achieved by modeling the DHA-transceiver coupling to avoid unnecessary prototype fabrication and characterization. The coupling coefficient between a DHA and an external transceiver coil (TX) is calculated as
| (3) |
where is the mutual inductance between the DHA and the transmitter, and and are the corresponding self-inductances. Each variable in this equation is calculated independently as follows.
C. DHA Self-Inductance
To simplify the model, the DHA was approximated as a series of intersecting circular loop antennas [13]. Each pair of loops was treated as a cell, and superposition was used to calculate the inductance of each cell separately, given a variable distance from each cell (winding pair) to the external transceiver.
Each cell was modeled as a pair of windings and that share the same center and bisect each other at 90° (Fig. 5). The DHA has a total of cells, each having center-to-center spacing to the nearest cell (Fig. 5).
Fig. 5.

Each cell is modeled as two perpendicular-intersecting (a) circular loops. (b) DHA side view shows cells with spacing .
The self-inductance of the DHA consisted of the independent self-inductance of each cell, added with the mutual inductance of each loop to every other loop, i.e.,
| (4) |
the self-inductance of an individual cell, , was defined. The inductance of a circular loop with radius and thickness was approximated as
| (5) |
where is the permeability of free space, is the radius of the loop, and is the thickness of the wire. The inductance of a cell was calculated as the self-inductance of each loop in addition to the mutual inductance between both loops. Since the loops are perpendicular, it was assumed that they do not share magnetic flux. Therefore, the mutual inductance between two loops that share a center and make up a cell was ignored, i.e.,
| (6) |
The inductance of the whole coil was computed as the summation of self-inductance of all cells, in addition to the summation of the mutual inductance of every loop with every other loop. Although within each cell, it was assumed that there was no mutual inductance between orthogonal windings, this assumption cannot hold between cells because each cell is separated by a nominal distance. Suppose that there are cells (and therefore individual loops). Between two cells and , the inductance of two parallel loops, and , will be equal (Fig. 6). Furthermore, perpendicular loops and will be equal. Therefore, (4) can be further simplified as
| (7) |
Fig. 6.

Cell and defined as pairs of turn symmetric about the DHA center, enabling simplification of the geometric sum for mutual inductance.
To calculate the mutual inductance between two purely laterally misaligned loops and two laterally and angularly misaligned coils , the equation for two circular misaligned loops was used. Prior work by others [21], [22] sought to approximate the mutual inductance between two misaligned loops, as a function of the following.
is the radius of the first loop.
is the radius of the misaligned loop.
is the perpendicular distance from the first loop to the parallel plane that the second loop’s center lies in.
is the angle of misalignment.
is the lateral misalignment between the loops, as described in Fig. 8.
Fig. 8.

Mutual inductance between the DHA and transmitter (reader) coil was calculated assuming a circular loop transmitter placed perpendicular to the DHA axis at a distance .
In the case of the DHA, the vertical offset and lateral misalignment between cells and were equal as the loops are orientated at 45°
| (8) |
For parallel loops (e.g., and ), the angle of misalignment, , was 0. For perpendicular loops, ( and was . The previous equations were then simplified to obtain a final calculation for self-inductance of the DHA,
| (9) |
For simplification, DHAs with odd number cells were analyzed and fabricated with integer limits on the summation.
The transceiver coil was assumed to be a circular loop with several turns of the same radius. In a similar fashion, the geometry was modeled as two misaligned loops with DHA/TX center-to-center distance and (Fig. 8). was defined as the number of turns in the transmitter coil.
The mutual inductance between the DH coil and transmitter coil was calculated as
| (10) |
The transmitter coil self-inductance was defined as
| (11) |
Using (3), (9), (10), and (11), the inductance of the DHA, inductance of the transmitter, and mutual inductance between the two were computed to estimate the coupling coefficient for antenna optimization.
D. DHA Fabrication
DHA of diameters 3–8 mm, trace edge-to-edge spacing of 15 mils, trace width 8 mil, and 25 cells (corresponding to 25 vias) were designed in SOLIDWORKS (Fig. 9) and imported into Altium printed circuit board (PCB) designer for fabrication.
Fig. 9.

Flat and wrapped render of DHA with diameter , spacing , and cell count . Red is top-level PCB traces and blue is bottom.
DHAs were fabricated on polyimide flexible circuit substrates with 100-μm substrate thickness and 18-μm trace thickness (Fig. 10). The inductance, series resistance, and quality factor of each DHA were measured at 13.56 MHz using an Agilent 4395A Impedance Analyzer (Table I). Although the quality factor peaked for diameters of 4–5 mm, an 8-mm DHA was used to fabricate prototype RFID systems because it had the largest coupling coefficient to the RFID reader.
Fig. 10.

Example DHA after fabrication and after wrapping into the final shape. DHA traces are outlined in green, tuning capacitors in purple, and aligned vias after wrapping in red.
TABLE I.
Measured DHA Values at 13.56 MHz
| DHA Diameter (mm) | 3 | 4 | 5 | 6 | 8 | 10 |
| Median Self-Inductance (μH) | 0.8 | 1.4 | 2.0 | 3.1 | 9.0 | N/Aa |
| Median Series Resistance (Ω) | 5.0 | 5.3 | 8.0 | 20 | 50 | 35a |
| Median Quality Factor | 13.6 | 22.5 | 23.4 | 13.2 | 8.9 | N/Aa |
beyond self-resonant frequency
E. Equation Validation
To verify the developed equations, DHAs with diameters of 3, 4, 5, 6, 8, and 10 mm with spacings of 15 mil were constructed and characterized. The self-inductance of each DHA coil was computed using both equations for misaligned coils’ mutual inductance (from [22] and [23]) resulting in two theoretical values, marked in red in Fig. 11. The inductance of two sets of each DHA was then measured at a relatively lower arbitrary frequency to evaluate the models without the presence of high-frequency parasitics using a Hioki IM3533.
Fig. 11.

Measured and theoretical DHA self-inductance (μH). DHAs with diameters 3, 4, and 5 were measured at 100 kHz and DHAs of diameters 6, 8, and 10 mm were measured at 5 MHz. The theoretical range from developed equations marked in red.
For DHAs of diameter 3–8 mm, the developed calculations were accurate as they were between the calculated theoretical values. For DHA of diameter 10 mm, the assumptions used to develop the equations were not as accurate, resulting in an underestimation of the true inductance by 3.7%.
In addition, the developed equations did not account for high-frequency effects (as mutual inductance equations used are independent of frequency), and as such, when measured at the operational frequency of 13.56 MHz, the self-inductance values for 8 and 10 mm DHAs were not in the expected theoretical range (Table II). Adjusting the model to account for both the skin effect and proximity effect in conjunction with the thin flat traces and 13.56-MHz operational frequency would allow for more accurate modeling.
TABLE II.
Effect of Skin and Proximity Effects on DHA Inductance
| DHA Diameter (mm) | 6 | 8 | 10 | |
| Measured Average Inductance | 5 MHz | 0.8 | 1.4 | 2.0 |
| 13.56 MHz | 5.0 | 5.3 | N/Aa | |
beyond self-resonant frequency
For the coupling coefficient validation, a circular transmitter (reader) coil of diameter 100 mm with turns was constructed. The DHAs and transmitter coils remained untuned, as the mutual inductance between two coils should not be affected by tuning or frequency based on the equations discussed. The DHA was held 1–6 cm away from the transmitter, while the system was configured to acquire values for and (Fig. 12). Then, mutual inductance values for the system were calculated as
| (12) |
Fig. 12.

Diagram showing measurement procedure of mutual inductance, with zL2 polarity flipped between measurements.
The self-inductance of the DHA and transmitter were measured for calculation of the coupling coefficient as per (3). Beyond 6 cm, the mutual inductance between the elements was too small to be measured (Fig. 13). Similarly, using the two approximation equations for mutual inductance, theoretical minimum and maximum values for the mutual inductances were computed (Fig. 14).
Fig. 13.

Measured versus calculated coupling coefficient for 4-mm DHA (top) and 5-mm DHA (bottom).
Fig. 14.

Theoretical coupling coefficient estimation for DHAs of varying diameters held a fixed distance of 3 cm from transmitter with a diameter of 100 mm and turns. As diameter increases, there is a relatively linear response in coupling coefficient at this size transmitter and DHA.
III. Flexible Pulsation Sensor
FPSs consisting of stretchable conductive elastomers can expand and contract with blood vessels, sensing blood flow, and blood pressure via vascular distension. In this work, we adopted an FPS fabrication process in which the sensing element is comprised of carbon-black nanoparticles suspended in PDMS (CB-PDMS). This nanocomposite produces a metal-free strain sensor with linear resistance–strain response [18]. Because the FPS is based on a PDMS substrate, it exhibits a large strain range, greatly exceeding the maximum strain of conventional metal sensors and exceeding the expected strain range of natural blood vessels and synthetic grafts [24].
The CB-PDMS paste used in FPS fabrication was produced as previously [18], but here, we investigated a new integration method with the flexible DHA interface (Fig. 15). To improve the strain sensor gauge factor, thinner tracks and multiple parallel tracks are typically used. However, for large aspect ratios, this requires stencils with long, thin, cantilevered segments, which tend to deflect during patterning or allow material underfill. To partially mitigate these issues, an adhesive stencil was used, which was tacky enough to stick to the PDMS substrate, preventing member deflection. In addition, the CB-PDMS was directly patterned onto gold-plated pads for circuit interfacing.
Fig. 15.

Flexible DHA integration began with (a) DHA and RFID circuitry soldered on a PI substrate. (b) Stencil was applied in addition to a thin silicone rubber backside coating. (c) CB-PDMS was patterned through the stencil and (d) entire device was encapsulated with a final, thin layer of insulating silicone.
First, the assembled DHA and RFID interface were placed on a cast PDMS layer (Dow Corning MED-4210). This layer provided water protection to the circuitry and a substrate to the FPS sensor. Next, stencils were cut out of matte vinyl using a Roland GX-24 vinyl cutter. The stencil was adhered to the cured MED-4210, with edges of the stencil on top of the pads for the FPS. An adhesive stencil was used to prevent material smear under the stencil to improve dimension tolerance on the large aspect ratio structure. Stencil dimensions were chosen to enable patterning onto 0.95 × 0.80 mm pads separated by 0.50 mm. After the adhesive stencil was applied, the CB-PDMS paste was forced through the stencil openings to define the FPS dimensions. The material was cured at 60 °C for 1 h, and then, the vinyl stencil was removed. The final encapsulation of the FPS, RFID interface, and DHA used neat MED-4210, which was applied via brush to conform to the topology of the RFID circuitry. After final encapsulation, the MED-4210 was slit between the DHA and FPS such that the two components could flex separately (Fig. 16). This feature allowed the FPS strain sensor to distend with the blood vessel, while the more rigid PI substrate maintained the DHA dimensions for accurate frequency tuning after placement.
Fig. 16.

(a) Implant is fabricated flat. (b) After encapsulation, the FPS flexes and curls separately from the substrate such that it can be wrapped directly against the vessel wall.
A. RFID Data Telemetry
Off-the-shelf components were used to demonstrate RFID sensor readout (Melexis MLX90129, using protocol ISO15693) (Fig. 17). An off-the-shelf ISO15693 module (PN5180 Card Reader) is available with preexisting software libraries and a built-in 13.56 MHz tuned antenna was used to read data from the sensor. The PN5180 module communicated to an Arduino Teensy 4.1 through serial peripheral interface (SPI), enabling serial communication to a PC over a USB port for data readout from the RFID tag.
Fig. 17.

Sensor tag IC was integrated with the DHA on a flexible polyimide substrate. The IC contained sensor analog/digital processing circuitry which was configured through the RFID interface. Passive external components were used for DHA tuning and RFID power conditioning. The FPS was bonded to the polyimide, but on a separate, stretchable silicone rubber substrate.
Code was written to connect to an individual MLX90129 and configure it with relevant sampling rate, analog to digital converter (ADC) settings, internal resistor configuration, and programmable gain amplifier (PGA) configuration. Then, a loop ran where the sensor tag was repeatedly polled to return samples as quickly as possible. With this reader, the maximum achievable sampling rate (12 Hz) was limited by the reader-tag communication delay.
IV. Experimental Results
A. Bench Model of Vascular Stenosis
All experiments were conducted using a phantom blood-flow system mimicking physiological blood flow in large caliber vessels, such as those used for hemodialysis vascular access [Fig. 18(a)]. Blood-mimicking fluid with shear-thinning properties was used to reduce peak pulsatile pressure [25]. A computer-controlled pulsatile pump system generated pulsatile flows, while pressure and flow sensors validated flow waveforms and systolic/diastolic pressures.
Fig. 18.

(a) Pulsatile pump system with graft and sensor. (b) Sensor device diagram unrolled and rolled. (c) Implant wrapped around silicone tube (artery phantom). (d) Implant underwater with FPS wrapped around ePTFE graft. The RFID reader is visible on the outside of the tank containing the submerged DHA/FPS system.
Blood vessel phantoms included a 6-mm-diameter silicone tube (to simulate pulsation of a natural artery) and a 6-mm expanded polytetrafluoroethylene (ePTFE) graft designed for vascular access (GORE-TEX stretch graft). The FPS was wrapped around each phantom to detect blood flow; silicone phantoms were tested in air, while ePTFE grafts were tested submerged in water [Fig. 18(c) and (d)].
Vascular stenosis reduces the lumen diameter of blood vessels, reducing blood-flow rate under constant systolic pressure conditions. To simulate this effect, both silicone and ePTFE vessel phantoms were sequentially narrowed using an adjustable vascular ligature clamp. Because the bench phantom was a single loop without collateral blood vessels, flow reductions also affected peak systolic pressure. To simulate physiology, therefore, the pump driving voltage was adjusted at each flow rate to maintain a constant systolic pressure of 120 mmHg.
B. Flow Rate Through Arterial Phantom
In the first experiment, the FPS and DHA were wrapped around a silicone tube of 6-mm-diameter mimicking an artery. Pulsations through the vessel stretched the FPS, and resistance changes were recorded by the RFID interface. Data were transferred from the DHA/FPS platform to a PC through the PN5180 RFID reader via a Teensy 4.1 development board and USB serial port.
Due to the limited 12-Hz update rate of the PN5180 reader, hemodynamic signals from the FPS were undersampled. As a result, peak systolic pressures were not always captured. Experimentally, raw FPS signals from the artery phantom were recorded at 1000 Hz and then decimated to the 12-Hz sample rate [Fig. 19(a)]. Aliased data, as expected, showed inconsistent peak-to-peak amplitude. The average peak amplitude over 30-s periods, however, was relatively stable (as long as the pulsatile beats per minute and aliasing frequency of 12 Hz were not harmonically related). Therefore, data obtained by RFID readout were captured over windows at least 30 s long and analyzed by boxplots to compare median values while demonstrating the likely true peak-to-peak value without the aliasing artifact.
Fig. 19.

Raw sensor data over 60-s period before extracting amplitudes. Arbitrary (uncalibrated) units are used on the y-axis. (a) Aliased sensor data caused by under sampling of RFID system. (b) Time-domain view of sensor response to changing flow rate, demonstrating monotonic response despite aliasing.
Raw recordings [Fig. 19(b)] from the sensor were processed in MATLAB R2021a to extract peak-to-peak amplitudes. Data were processed without prefiltering using the findpeaks function to extract the amplitude of each peak. Peak amplitude distributions at each flow rate were extracted from 60-s recordings. Because the sensor signal was slightly undersampled (due to the limited 12-Hz update rate of the PN5180 reader), the true sensor signal peak in each pulsatile cycle was not always captured. Therefore, we analyzed sensor data by plotting the distribution of identified peaks, median values, and variance as boxplots.
The distributions of extracted amplitudes for each flow rate showed a linear increase with flow rate (Fig. 20) over two trials. The monotonic response suggested that the wireless FPS device could detect changes in vascular flow as low as 10 mL/min.
Fig. 20.
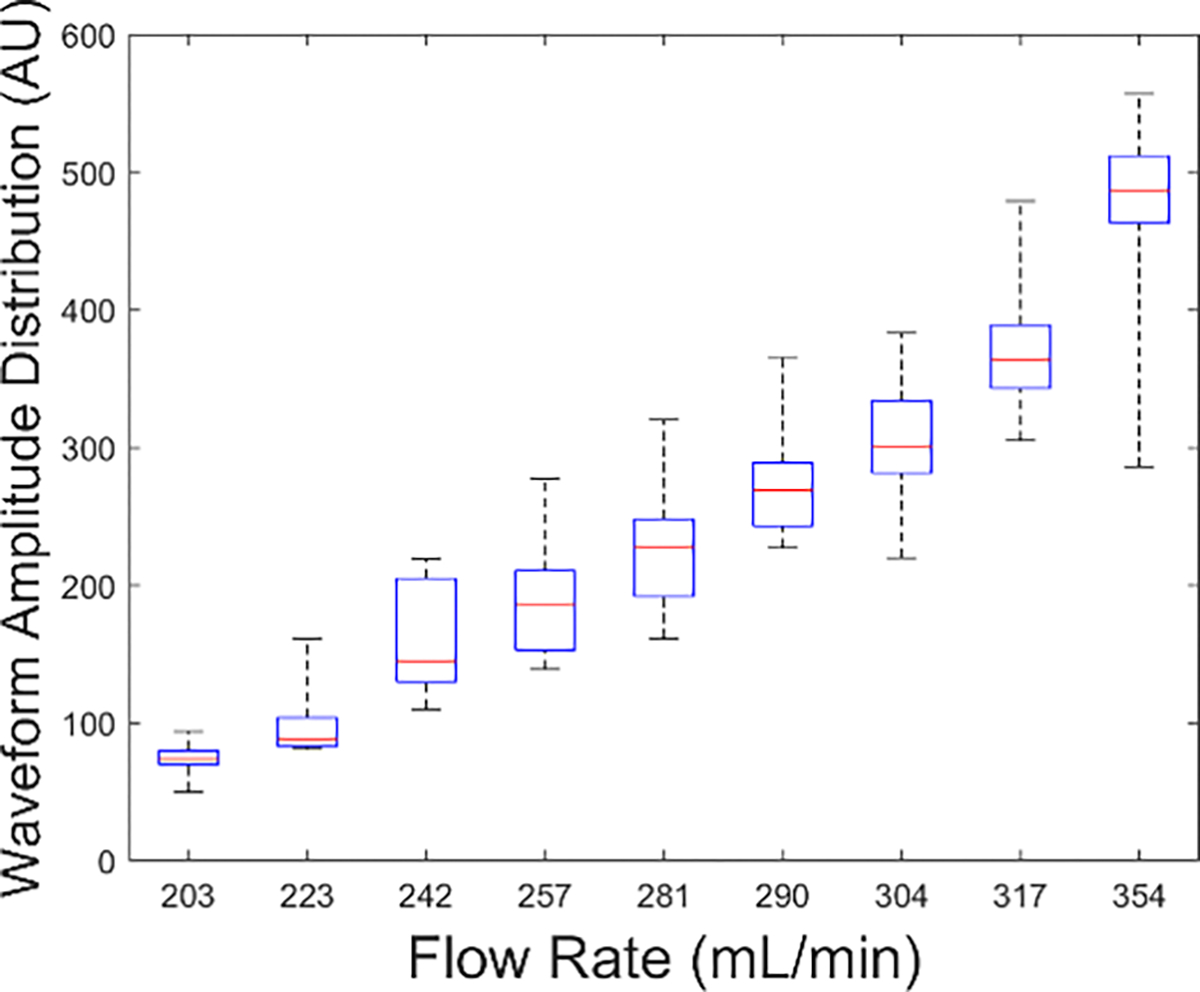
Waveform amplitude distribution as a function of flow rate showing monotonic response to flow. Flow changes as low as 10 mL/min were detected.
C. Flow Rate Through Submerged Graft
The FPS was wrapped around a graft submerged in water in a tub to simulate being implanted inside the body. The DHA and RFID interface matching circuit was adjusted to account for DHA antenna detuning after submersion. The RFID reader was placed on the outside of the tub to simulate being on the skin surface. The diaphragm pump voltage was varied linearly to simulate increasing flow through the synthetic graft.
As before, sensor amplitudes increased monotonically with flow through the system (Fig. 21). Furthermore, because the ePTFE graft material had a lower elasticity than natural blood vessels (or silicone tubes) [24], [26], the overall sensor strain was lower when mounted on ePTFE. Despite the lower sensitivity, the system demonstrated the detection of blood-flow changes of about 30 mL/min using a flexible RIFD antenna and standard readout system.
Fig. 21.

Peak amplitude distribution of submerged ePTFE graft and FPS also showed monotonic readout of flow. The sensor peak values were lower due to the lower elasticity of the ePTFE graft material.
V. Conclusion
This work demonstrated a flexible, implantable blood-flow sensor for monitoring vessels or grafts. Research focused on the design of a cylindrical, hollow DHA, which can be flexed and curled to wrap around a blood vessel or graft during implantation. Additional research focused on implementing RFID protocol ISO15693 using a Melexis MLX90129 IC for wireless sensor readout using the DHA. An FPS was directly patterned onto the polyimide electronic interface to develop a fully functional prototype wireless sensor. Using a phantom blood-flow system, further experiments showed that the sensor could detect fairly small changes in blood flow through a vessel or graft. Finally, while this prototype device was developed for vascular monitoring, the underlying technologies (DHA and FPS) may be adapted into many other flexible electronic sensor architectures.
Fig. 7.

(a) Laterally and angularly misaligned loops defined, with the radius of the first coil, the normal offset distance from the first coil, the lateral offset distance from the normal to the first coil, the angular misalignment between coils, and the radius of the second coil. (b) Offset and misalignment from cell to cell .
Acknowledgment
The contents do not represent the views of the U.S. Department of Veterans Affairs or the U.S. Government.
This work was supported by the Case Western Reserve University. The associate editor coordinating the review of this article and approving it for publication was Prof. Sheng-Shian Li.
Contributor Information
Yaneev Hacohen, Department of Electrical, Computer, and Systems Engineering, Case Western Reserve University, Cleveland, OH 44106 USA.
Steve J. A. Majerus, Department of Electrical, Computer, and Systems Engineering, Case Western Reserve University, Cleveland, OH 44106 USA; Advanced Platform Technology Center, VA Northeast Ohio Healthcare System, Cleveland, OH 44106 USA.
References
- [1].Yi Y, Wang B, and Li C, “Sensors-based monitoring and treatment approaches for in-stent restenosis,” J. Biomed. Mater. Res. B: Appl. Biomaterials, vol. 111, no. 2, pp. 490–498, Feb. 2023, doi: 10.1002/jbm.b.35164. [DOI] [PubMed] [Google Scholar]
- [2].Naccarata F and Marrocco G, “Integrated wireless RFID temperature sensor for biological aortic valve prostheses,” IEEE J. Radio Freq. Identificat., early access, Apr. 25, 2023, doi: 10.1109/JRFID.2023.3264557. [DOI] [Google Scholar]
- [3].Ang YX, Khudzari AZM, and Ali MSM, “Non-invasive treatment for coronary in-stent restenosis via wireless revascularization with nitinol active stent,” IEEE Trans. Biomed. Eng., vol. 68, no. 12, pp. 3681–3689, Dec. 2021, doi: 10.1109/TBME.2021.3082172. [DOI] [PubMed] [Google Scholar]
- [4].Kiourti A, “RFID antennas for body-area applications: From wearables to implants,” IEEE Antennas Propag. Mag., vol. 60, no. 5, pp. 14–25, Oct. 2018, doi: 10.1109/MAP.2018.2859167. [DOI] [Google Scholar]
- [5].Tessitore N and Poli A, “Pro: Vascular access surveillance in mature fistulas: Is it worthwhile?” Nephrol. Dialysis Transplantation, vol. 34, no. 7, pp. 1102–1106, Jul. 2019, doi: 10.1093/ndt/gfz003. [DOI] [PubMed] [Google Scholar]
- [6].Smith T and Quencer KB, “Best practice guidelines: Imaging surveillance after endovascular aneurysm repair,” Amer. J. Roentgenol., vol. 214, no. 5, pp. 1165–1174, May 2020, doi: 10.2214/AJR.19.22197. [DOI] [PubMed] [Google Scholar]
- [7].Hayler R, Low T, Fung K, Nichols AC, MacNeil SD, and Yoo J, “Implantable Doppler ultrasound monitoring in head and neck free flaps: Balancing the pros and cons,” Laryngoscope, vol. 131, no. 6, pp. 1–12, Jun. 2021, doi: 10.1002/lary.29247. [DOI] [PubMed] [Google Scholar]
- [8].Matsumine H, Mogami M, Fujiwara O, Hasegawa M, Ito H, and Sakurai H, “Improvement of the salvage-rate of flap after venous thrombosis with intraparenchymatous venous pressure monitoring,” Microsurgery, vol. 38, no. 5, pp. 498–503, Jul. 2018, doi: 10.1002/micr.30293. [DOI] [PubMed] [Google Scholar]
- [9].Omeh DJ and Shlofmitz E, “Restenosis,” in StatPearls. Treasure Island, FL, USA: StatPearls, 2022. [Online]. Available: http://www.ncbi.nlm.nih.gov/books/NBK545139/ [Google Scholar]
- [10].Moist L and Lok CE, “Con: Vascular access surveillance in mature fistulas: Is it worthwhile?” Nephrol. Dialysis Transplantation, vol. 34, no. 7, pp. 1106–1111, Jul. 2019, doi: 10.1093/ndt/gfz004. [DOI] [PubMed] [Google Scholar]
- [11].Arslanian J, “Monitoring and surveillance of the hemodialysis vascular access,” Nephrol. News Issues, vol. 29, no. 3, pp. 38–42, 2015. [PubMed] [Google Scholar]
- [12].Guillemaud JP, Seikaly H, Cote D, Allen H, and Harris JR, “The implantable Cook-Swartz Doppler probe for postoperative monitoring in head and neck free flap reconstruction,” Arch. Otolaryngol.-Head Neck Surg., vol. 134, no. 7, pp. 729–734, 2008, doi: 10.1001/archotol.134.7.729. [DOI] [PubMed] [Google Scholar]
- [13].Vennemann B, Obrist D, and Rösgen T, “A smartphone-enabled wireless and batteryless implantable blood flow sensor for remote monitoring of prosthetic heart valve function,” PLoS ONE, vol. 15, no. 1, Jan. 2020, Art. no. e0227372, doi: 10.1371/journal.pone.0227372. [DOI] [PMC free article] [PubMed] [Google Scholar]
- [14].Rothfuss MA et al. , “A system for simple real-time anastomotic failure detection and wireless blood flow monitoring in the lower limbs,” IEEE J. Transl. Eng. Health Med., vol. 4, pp. 1–15, 2016, doi: 10.1109/JTEHM.2016.2588504. [DOI] [PMC free article] [PubMed] [Google Scholar]
- [15].Cheong JH et al. , “An inductively powered implantable blood flow sensor microsystem for vascular grafts,” IEEE Trans. Biomed. Eng., vol. 59, no. 9, pp. 2466–2475, Sep. 2012, doi: 10.1109/TBME.2012.2203131. [DOI] [PubMed] [Google Scholar]
- [16].Fassbender H et al. , “Fully implantable blood pressure sensor for hypertonic patients,” in Proc. IEEE Sensors, Oct. 2008, pp. 1226–1229, doi: 10.1109/ICSENS.2008.4716664. [DOI] [Google Scholar]
- [17].Boutry CM et al. , “Biodegradable and flexible arterial-pulse sensor for the wireless monitoring of blood flow,” Nature Biomed. Eng., vol. 3, no. 1, pp. 47–57, Jan. 2019, doi: 10.1038/s41551-018-0336-5. [DOI] [PubMed] [Google Scholar]
- [18].Chong H, Lou J, Bogie KM, Zorman CA, and Majerus SJA, “Vascular pressure–flow measurement using CB-PDMS flexible strain sensor,” IEEE Trans. Biomed. Circuits Syst., vol. 13, no. 6, pp. 1451–1461, Dec. 2019, doi: 10.1109/TBCAS.2019.2946519. [DOI] [PMC free article] [PubMed] [Google Scholar]
- [19].Xu Q, Wireless Power Transfer for Miniature Implantable Biomedical Devices. Rijeka, Croatia: InTech, 2019, doi: 10.5772/intechopen.89120. [DOI] [Google Scholar]
- [20].Merchant HD, Minor MG, and Liu YL, “Mechanical fatigue of thin copper foil,” J. Electron. Mater., vol. 28, no. 9, pp. 998–1007, Sep. 1999, doi: 10.1007/s11664-999-0176-x. [DOI] [Google Scholar]
- [21].Zhang X, Meng H, Wei B, Wang S, and Yang Q, “Mutual inductance calculation for coils with misalignment in wireless power transfer,” J. Eng., vol. 2019, no. 16, pp. 1041–1044, Mar. 2019, doi: 10.1049/joe.2018.8670. [DOI] [Google Scholar]
- [22].Huang W and Ku H, “Analysis and optimization of wireless power transfer efficiency considering the tilt angle of a coil,” J. Electromagn. Eng. Sci., vol. 18, no. 1, pp. 13–19, Jan. 2018, doi: 10.26866/jees.2018.18.1.13. [DOI] [Google Scholar]
- [23].Yan Z et al. , “Frequency optimization of a loosely coupled underwater wireless power transfer system considering eddy current loss,” IEEE Trans. Ind. Electron., vol. 66, no. 5, pp. 3468–3476, May 2019, doi: 10.1109/TIE.2018.2851947. [DOI] [Google Scholar]
- [24].Sarkar S, Salacinski HJ, Hamilton G, and Seifalian AM, “The mechanical properties of infrainguinal vascular bypass grafts: Their role in influencing patency,” Eur. J. Vascular Endovascular Surg., vol. 31, no. 6, pp. 627–636, Jun. 2006, doi: 10.1016/j.ejvs.2006.01.006. [DOI] [PubMed] [Google Scholar]
- [25].Ramnarine KV, Nassiri DK, Hoskins PR, and Lubbers J, “Validation of a new blood-mimicking fluid for use in Doppler flow test objects,” Ultrasound Med. Biol., vol. 24, no. 3, pp. 451–459, Mar. 1998, doi: 10.1016/S0301-5629(97)00277-9. [DOI] [PubMed] [Google Scholar]
- [26].Greenwald SE and Berry CL, “Improving vascular grafts: The importance of mechanical and haemodynamic properties,” J. Pathol., vol. 190, no. 3, pp. 292–299, Feb. 2000. [DOI] [PubMed] [Google Scholar]