

Abstract
The construction of high-rise buildings in complex soft soil layers is highly prone to uneven settlement of the foundation, which in turn induces building tilting. In severe cases, it can lead to overall collapse accidents. Due to its advantages of causing less damage to the main structure and having a smaller impact on the surrounding environment, compaction grouting is widely used in the inclined high-rise buildings’ deviation correction projects. However, the construction mainly relies on engineering experience and lacks guiding research results based on numerical simulation methods. Therefore, based on the grouting repair project of a certain inclined high-rise building in Zhangzhou, Fujian Province, this study has developed a numerical simulation method for scientific prediction. The following conclusions are drawn: (1) The simulation results indicate that the building settlement’s reasons may be inadequate pile embedment depth or a large thickness of the weak soil layer, etc. And the best grouting scheme was selected based on the simulation results. (2) The monitoring data after grouting show that the settlement values of most measurement points meet the control requirements. The maximum inclination rate of the building was reduced from the original 3‰ to 0.07‰, verifying the feasibility of the scheme. (3) By comparing the simulation data with the monitoring data, the maximum settlement error after grouting is only 3.1 mm and the inclination rate of both is about 1‰. The reliability of the simulation method was verified.
Keywords: High-rise buildings, Uneven settlement, Structural correction, Grouting uplift, Damage modeling
Subject terms: Civil engineering, Stratigraphy
Introduction
With the rapid development of the economy, many high-rise buildings have been constructed. Almost every year, various buildings tilt during construction or use. Some of the most famous ones include the Leaning Tower of Pisa, the Huqiu Tower in Suzhou and the Transcona grain elevator in Canada1–3. The majority of building tilting is caused by the foundation settlement, including inadequate deformation management of shallow foundations, incorrect survey and design, issues with construction quality, natural calamities and construction of surrounding buildings4–9. Corrective techniques must be applied to restore the safety and normal functioning of inclined buildings. The process of correcting the inclination will have an effect on the stress of the foundation and superstructure. Thus, the correction and reinforcement design ought to combine the building’s tilt cause and proceed with a safety assessment of the upper structure, demonstrating the solution’s feasibility to ensure the safety of the building.
The pile foundation system consists of piles and their connected pile caps. The upper load is transferred from the pier to the pile foundation and then to the surrounding soil through the interaction between the pile and the soil. The combined action of pile shaft friction and end-bearing resistance provides structural support for the superstructure10,11. Li et al.13 employed a three-dimensional finite difference model to investigate ground loss induced by shield tunneling adjacent to existing pile foundations. It indirectly demonstrates the load-bearing mechanism of pile foundations. Pham et al.14 used analytical and numerical models to investigate how pile foundation-supported embankments responded to both minor and major deformations. Soomro et al.15 studied the settlement mechanism of pile foundation embankments affected by tunnel excavation. It can be found that the existing research mostly focuses on the study of ground and underground loads borne by pile foundations and the settlement of buildings caused by surrounding construction. There is a lack of research on the uneven settlement of pile foundations in buildings.
Building deflection correction technology has been developed at home and abroad but has not formed a complete theoretical system so far. The corrective methods used vary depending on the structural form of the inclined building and the geological conditions. The principal approaches for structural rectification include forced descent correction and jacking correction. The forced descent correction technique forces the building to subsidence by changing the original stress of the foundation. It is suitable for structures with short spans, adequate rigidity and foundations comprising clay, silty soil, collapsible loess, or loose fill materials. A hybrid risk analysis approach was presented by Bu et al.16 to analyze the hazards associated with forced descent correction instances. Xiao et al.17 proposed a theoretical computation technique for forced descent correction’s pre-settlement. For high-rise truncated piles forced descent correction in soft soil, Yang et al.18 offered an informatization correction method with synchronized analysis, design, construction and monitoring feedback. Wang et al.19 presented the design and construction of large tonnage anchor static piles for forced settlement correction. The jacking correction methodology involves three critical operational phases: (1) separating the building’s foundation from its superstructure at a predetermined location, (2) establishing multiple load-bearing support points within the separation zone and (3) systematically operating these jacks. The building undergoes controlled planar rotation about a defined axis (or pivot point), thereby correcting its inclination. This method is applicable to the rectification project of houses with relatively light weight. A multi-point simultaneous lifting jacking control system was proposed by Guo et al.20 for ancient buildings that have weak integrity and large jacking distances. To improve the promotion and demonstration of such monitoring procedures, Li et al.21 devised a structural health monitoring system for jacking operations on large historical buildings. Zhou et al.22 carried out finite element simulation and real-time monitoring for the whole lifting of a steel-structured gallery, providing a reference for similar projects. Forced descent correction is generally less expensive and simpler to implement than jacking correction. However, when forced landing correction is not suitable, jacking up correction can be adopted. Building deflection correction is a dynamic construction procedure that requires constant attention to the dynamics of the building. However, the jacking correction construction period is lengthy, disrupting the existing building structure and the forced descent correction construction affects the surrounding life and production operations due to its vast coverage. In 1969, Graf23 was the first to use compacted grouting to correct buildings’ deviation and outlined the basic framework. It is pointed out that compaction grouting is mainly used to improve the properties of foundation soil and reinforce soil mass. Chepurnova24 described the application of jet grouting in foundation reinforcement projects using real engineering experience and presented pertinent construction viewpoints. Cui et al.25 carried out a study on the nondestructive controllable grouting technique for residential building uplift. Through this method, the risk of excessive jacking or secondary settlement that arose in typical grout reinforcement methods can be avoided. Ni et al.26 demonstrated the crack grouting technique for the jacking procedure of a building located on a cohesive sand layer. Compaction grouting involves injecting high-density slurry into the foundation to form localized grout bulbs near the injection points. These bulbs generate controlled uplift forces that increase proportionally with grouting pressure. By strategically arranging grouting holes and precisely regulating injection pressure and volume at each location, the structure can be uniformly lifted to achieve the desired realignment. Abelev et al.27 investigated the impact of “geosynthetic” grouting and sand filling on the stabilization of the foundation of structures under construction. Akyol28 demonstrated the grout effect of the employ of strip foundations of reinforced concrete building; research shows that the foundation is greatly increased. The method of grouting reinforcement for correction causes little harm to the main structure, little impact on nearby residents (who can live and work as usual), flexible operation, high safety, economy, non-pollution and environmental friendliness. Therefore, the compaction grouting is increasingly applied in the research of correcting the inclination of high-rise buildings. However, there are still deficiencies in the relevant research results.
At present, the research on compaction grouting in the correction of high-rise buildings mainly relies on relevant experience. Zuo Jinxin29 proposed a prediction method and simplified calculation formula for surface uplift displacement caused by compaction grouting through extensive theoretical analysis. And the influence of the changes in grouting point depth, soil density and moisture content on the ground uplift effect has been studied. Zhang et al.30 introduced the engineering case of grouting control for the deformation of the existing tunnels. And the safety of the tunnel structure was evaluated through on-site monitoring data. Dai et al.31 suggested a theoretical displacement calculation model for compact grouting technology in building repair. Guo et al.32 validated the efficacy of grouting reinforcement in ensuring structural safety within subsidence zones through comprehensive borehole investigation analysis. Ji et al.33 provided insightful guidance on averting grouting quality problems by proposing a three-stage management technique to increase casing grouting density. Most of the existing achievements are based on theoretical and laboratory experiments to explore the lifting effect of compaction grouting. There is a lack of efficient numerical simulation methods and guiding research results.
To sum up, the existing research still has the following problems: (1) Most of the existing research focuses on the reinforcement of the under-construction buildings’ foundations and the correction of the inclination of low-rise buildings. There are relatively few studies on the tilting repair caused by uneven settlement of pile foundations in high-rise buildings. (2) The research on the high-rise buildings deviation correction mostly adopts the methods of forced descent correction and jacking correction. However, high-rise buildings are mostly located in densely populated areas and these methods have a significant impact on the surrounding environment. The compaction grouting technology is more suitable for the correction of such projects. In the existing research, the application of compaction grouting in the restoration of inclined buildings largely relies on practical experience and empiricism. The numerical simulation is utilized to study the compacted grouting’s uplift effect. It can provide a visual simulation method and scientifically predict the repair effect of inclined buildings. And it has some guiding significance for the actual grouting engineering construction.
This article is based on the 16# building in Fujian Zhangzhou Junlin Huafu. The building has experienced obvious settlement and inclination, both of which have exceeded the control limits stipulated in the code. Moreover, obvious cracks have been found in the basement and grouting reinforcement measures are urgently needed. Based on the analysis of the causes of building settlement and inclination, a numerical simulation method for scientifically predicting the compaction grouting effect was proposed. And a targeted deviation correction scheme was designed. The best scheme was selected through numerical simulation. Based on the measured data after correction, the feasibility of the simulation method and the correction scheme was verified. This article can provide theoretical support and a reference case for similar grouting deviation correction projects.
Project overview
Project profile
The Fujian Zhangzhou Junlin Huafu 16# building is a residential structure that has 23 stories above ground and one floor below. It is approximately 43.0 m long, 18.8 m wide and 70.2 m high. The basement floor is 5 m high, while the ground floor is 3 m high. The wall is a shear wall structure and the building foundation is a pile-cap foundation with a cap thickness of 1.5 m. The pre-stressed high-strength C80 concrete pipe piles are utilized beneath the pile cap. The design diameter is 500 millimeters and the effective design length is 11 to 30 m. The architectural engineering drawings and on-site pictures are shown in Figs. 1 and 2. The bearing stratum of piles is fully weathered granite or granular, strongly weathered granite. The characteristics of pile foundation materials are shown in Table 1.
Fig. 1.

Engineering drawings of the building: (a) Engineering plan; (b) Engineering elevations.
Fig. 2.
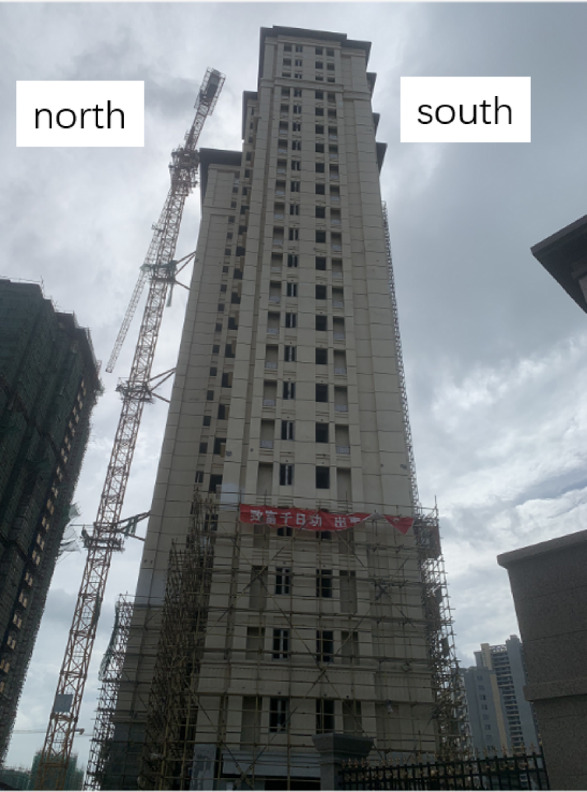
Physical photograph of the building.
Table 1.
Characteristics of pile foundation materials.
| Pile foundation | Pile body strength grade | The bearing stratum at the pile end | Characteristic value of vertical compressive bearing capacity of a single pile (kN) | The ultimate vertical compressive bearing capacity of a single pile (kN) |
|---|---|---|---|---|
| Pre-stressed concrete pipe piles | C80 | Granular strongly weathered granite | 2300 | 4600 |
The average pile length in the building’s west is 12.6 m and fails to enter the medium sand layer. On the other hand, the average pile length in the eastern half of the building is 14.3 m. The pile ends enter the medium sand layer but do not enter fully weathered granite or granular strongly weathered granite.
Engineering geological conditions
The geotechnical investigation identified a stratigraphic profile. From top to bottom, it is comprised of miscellaneous fill, fine sand, silty soil, medium sand, fully weathered granite, granular strongly weathered granite and moderately weathered granite. Differences between the supplemental and original survey findings uncover that the preliminary survey was not comprehensive, which is also a factor in building settlement.
The engineering geology section is depicted in Fig. 3.
Fig. 3.

Engineering geologic profile.
Based on surveys and indoor tests, the characteristic values of the foundation soil’s bearing capacity  and compression modulus
  for each geotechnical soil layer are presented in Table 2.
Table 2.
Eigenvalues of bearing capacity and compression modulus of soils.
| Geotechnical names |
 (kPa) (kPa) |
ES1−2 (MPa) | Characteristics of soil mass |
|---|---|---|---|
| Miscellaneous fill | 80 | 3.5 | Poor density, insufficient consolidation, slightly damp |
| Fine sand | 150 | 5.5 | Good particle gradation, poor sorting performance |
| Silty clay | 60 | 2.6 | High toughness and compressibility, low mechanical strength |
| Medium sand | 200 | 6.0 | Good particle gradation, poor sorting performance |
| Fully weathered granite | 350 | 40 | Extremely soft rock, the basic quality grade of the rock mass is Class V |
| Granular strongly weathered granite | 500 | 60 | Extremely soft rock, loose structure |
| Medium weathered granite | 2000 | Can be considered an incompressible layer | Low compressibility, high mechanical strength |
The groundwater regime at the site primarily consists of submerged water in miscellaneous fill and fine sand layers, confined water in medium sand, pore-fissure water in fully/strongly weathered granite and micro-confined water in moderately weathered granite.
Field monitoring program
Layout of measurement points
On-site tilt and settlement monitoring points were set up. 16 settlement monitoring points were built up on the site during the lifting phase and surveillance was carried out once every day. The layout of these measurement points is depicted in Fig. 4. The theodolite projection technique was used to monitor tilt, which calculates the displacement of the top observation point in relation to the bottom one; the tilt was derived based on the building’s height.
Fig. 4.

Engineering geologic profile.
Criteria for deformation control
In accordance with the Code for Measurement of Building Deformation (JGJ8-2016)34 a building is deemed to have stabilized if its settlement rate during the last 100 days is between 0.01 mm/d and 0.04 mm/d. However, the exact maximum settlement rate for a certain observation project should be determined by combining the local foundation soil’s compression properties.
The 16# building at Junlin Huafu is 70.2 m high, as stated in the Technical Procedures for Tilt Correction of Buildings (JGJ270-2012)35. The criterion for the building’s tilt correction can be expressed as follows:
 |
1 |
where,  denotes the design control value for the horizontal deflection at the building’s top;
  represents the height of the building from the ground level outside. Equation (1) calculation show that the building satisfies the correction requirements when the tilt is smaller than 175.5 mm.
The walls of the building are made of C40 concrete from the basement to the fourth story above ground, C35 concrete from floors five through nine and C30 concrete from floors ten to roof level. For floor slabs, C30 concrete is utilized from the basement to the tenth floor above ground, whereas C25 concrete is utilized from the eleventh floor to the roof. Cracks were formed in the basement wall on the basement level. Tensile stress for C30 concrete is regulated to a maximum of 2.01 N/mm² in compliance with the Concrete Structure Design Standard (GB/T50107-2010)36.
Analysis of site monitoring results
(1) Building settlement.
The most significant cumulative settlements were 100 mm and 106 mm, occurring at measuring points F1 and F4 on the southwest side of the building, respectively, according to settlement observations made between January 6, 2021 and July 18, 2021. The settlement was 57 mm at point F8, while 55 mm was recorded at point F16. In contrast, the northeast side experienced lesser settlements of 11 mm and 26 mm, with points F9 and F13, respectively. Further observations between July 18 and September 7 revealed a relatively stable settlement with cumulative changes ranging from 1 mm to 3 mm.
(2) Building inclination.
A horizontal displacement of approximately 228 mm towards the south with a tilt of 3‰ occurred at the building’s summit on July 16, 2021. It exceeded the permissible limit of 2.5‰, according to the Technical Regulations for Correcting Tilting of Buildings (JGJ270-2012)35.
(3) Cracks at the junction of the basement.
No visible cracks were observed in the main structure above the ± 0.000 elevation. However, there were visible cracks at the junctions on the basement level. A portion of these fissures were regularly oriented 45° towards the south, as depicted in Fig. 5.
Fig. 5.
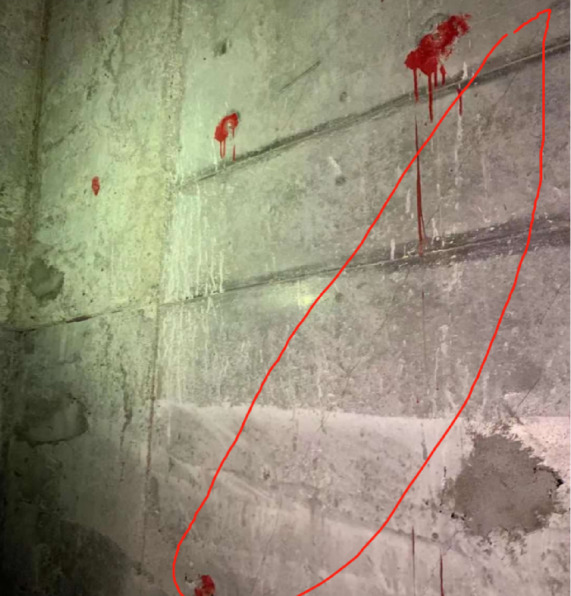
Cracks in the basement wall.
Aiming at the current situation of settlement, inclination and buildings’ structural cracks, 11 groups of numerical simulation working conditions were designed. Through numerical simulation, the causes of building settlement and inclination were analyzed and the best deviation correction scheme was obtained. The design of the simulated working conditions is shown in Table 3.
Table 3.
Numerical simulation working conditions.
| Simulated working condition | ||
|---|---|---|
| Buildings’ initial deformation | Case 1: The initial condition of the building | |
| Reasons for building settlement and inclination | Pile length | Case 2 − 1 |
| Case 2–2 | ||
| Weak soil layer | Case 3 − 1 | |
| Case 3 − 2 | ||
| Correction plan | Grouting scope | Case 4 − 1 |
| Case 4 − 2 | ||
| Case 4 − 3 | ||
| Soil strength | Case 5 − 1 | |
| Case 5 − 2 | ||
| Case 5 − 3 | ||
Numerical simulation analysis of building settlement
Numerical modeling
As shown in Fig. 6, a numerical model of the building and soil layer utilizing PLAXIS 3D finite element analysis software is established. According to the geological survey data, a numerical model measuring 150 m in the east-west direction and 110 m in the north-south direction was established. And incorporating six soil layers with a total thickness of 40 m to eliminate potential boundary effects. The building, pile cap and grouting reinforcement area are densely meshed. For simulation, the top surface employs a free boundary and the bottom surface employs a fixed boundary, while displacement boundaries restrict horizontal movement on the sides. Interface elements are introduced between the soil and the building to simulate their interaction. Referring to relevant literature, the strength of the interface material in this project is set to 0.67 times that of the adjacent soil37–41. The model consists of 501,979 nodes and 221,412 zones.
Fig. 6.

Finite element model.
In the numerical simulations, we apply the hardening soil model with small-strain stiffness (HSS) to simulate the elastic-plastic behavior of soil, which is a double hardening effective stress model that incorporates the Mohr-Coulomb yield criterion. The HSS model can reasonably consider the nonlinear variation characteristics of the modulus in the elastic (small strain) stage. It may also take into account the compressive hardness and shear expansion characteristics of soft soil and distinguish the loading and unloading stiffness. Therefore, during the foundation grouting deviation correction procedure, it is more consistent with the intricate variation features within the soil37,39–42. Consequently, HSS is chosen as the constitutive model of the soil in this simulation. Soil parameters derived from indoor tests are employed, as detailed in Table 4. A linear elastic non-porous model is used at the pile cap and shear walls. Based on the engineering investigation report, stiffness values are assigned at 3 × 10⁷ kN/m2. For the simulation of pile foundations, there are generally two methods: one is using volumetric elements and the other is using beam elements. Among them, the volume element method will make the numerical model very complex, which is prone to causing mesh distortion and leading to calculation errors. In addition, the axial force of the volumetric element cannot be directly extracted, so the axial force after its indirect conversion may also have errors. The beam method can not only greatly simplify the model and directly obtain the axial force but also effectively handle the interaction relationship between the pile and the surrounding soil40,43. Therefore, the beam method is widely adopted at present to simulate the pile foundation. The unique embedded pile element of PLAXIS 3D is composed of the beam element and the embedded interface element. The element simulates the pile and soil interaction through special interface elements. And the behavior of the interface is described by the elastic and plastic model. The interface element couples the pile’s local skin friction with the strength parameters of the surrounding soil layer and the interface strength reduction coefficient. Table 5 displays the pile foundation’s specifications37,39.
Table 4.
Physical and mechanical parameters of soils.
| Soil layer | Soil thickness /(m) |

/(kN·m−3) |

/MPa |

/MPa |

/MPa |

/MPa |

/10−3 |
|---|---|---|---|---|---|---|---|
| Miscellaneous fill | 3 | 18 | 3.5 | 3.5 | 10.5 | 35 | 0.4 |
| Fine sand | 6 | 20 | 5.5 | 5.5 | 16.5 | 55 | 0.4 |
| Silty clay | 10.5 | 20 | 2.6 | 2.6 | 7.8 | 26 | 0.4 |
| Medium sand | 1.5 | 21 | 6.0 | 6.0 | 18 | 60 | 0.4 |
| Fully weathered granite | 5 | 21 | 40 | 40 | 120 | 400 | 0.4 |
| Granular strongly weathered granite | 14 | 20 | 60 | 60 | 180 | 600 | 0.4 |
Note:  represents the natural element weight of the soil;
  is the reference stiffness modulus at the reference confining pressure
  , where
  = 100 kPa;
  is the tangent compression modulus at the reference confinement;
  indicates the unloaded and reloaded modulus at the reference confinement;
  is the initial small-strain shear modulus; and
  represents the strain level at which the secant modulus,
  , decreases to 70% of 70%
 .
.
Table 5.
Pile foundation model parameters.
| Parameters | Pile |
|---|---|
| Elastic modulus/(kN/m2) | 3.6 × 10⁷ |
| Ultimate lateral friction at the top of the pile/(kN/m) | 200 |
| Ultimate lateral friction at the bottom of the pile/(kN/m) | 500 |
| Ultimate reaction force at the bottom of the pile/(kN) | 1 × 10⁴ |
Based on Table 2, to accurately analyze the causes of building settlement and inclination, Cases 2 and 3 are shown in Table 6.
Table 6.
Designed to simulate working conditions.
| Factors contributing to building settlement and tilting | Simulated working conditions |
|---|---|
| Case 1: The initial condition of the building | |
| Pile length | Case 2 − 1: All piles are 12.6 m in length |
| Case 2–2: All piles are 14.3 m in length | |
| Weak soil layer | Case 3 − 1: The topsoil consists of fine sand. |
| Case 3 − 2: The topsoil consists of medium sand |
Case 1
The model activates six soil layers, deactivates the soil element beneath the basement and activates the platform pile foundation and the building structure to simulate the deformation and forces experienced by the structure. Figure 7 provides a visual representation of the simulation for Case 1.
Fig. 7.
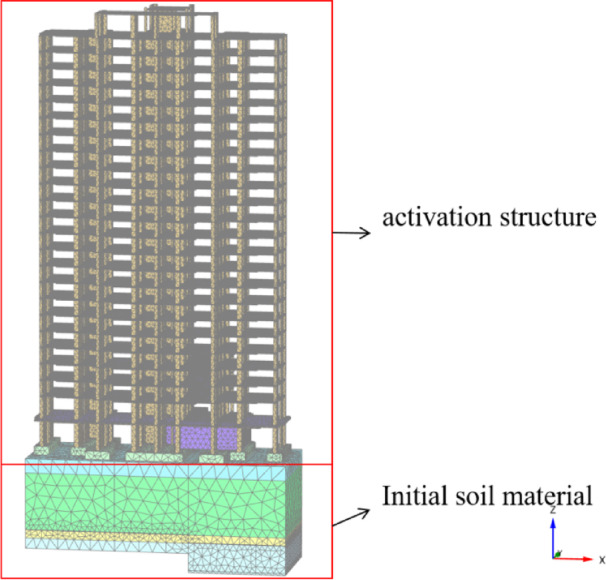
Numerical simulation Case 1.
In Case 2, the simulated pile foundation lengths are changed according to the stratum of weathered rock within the model. In Case 2 − 1, all piles were designed with the minimum original length of 12.6 m, ensuring that no pile end touches the fully weathered rock layer. In Case 2–2, all piles adopted the maximum original length of 14.3 m, ensuring that the pile ends reached the top of the completely worn rock stratum. Figure 8 depicts the simulated behavior in Case 2 − 1 and Case 2–2.
Fig. 8.

Numerical simulation Case 2.
The presence of weak strata in the foundation’s upper portion can significantly impair its bearing capacity. So, the top soil type is adjusted in the simulation. In Case 3 − 1, fine sand replaces the top miscellaneous fill, while in Case 3 − 2, medium sand replaces it. Figure 9 presents the visual overview of the simulations for Case 3 − 1 and Case 3 − 2.
Fig. 9.

Numerical simulation Case 3.
Numerical simulation results
The deformation pattern for buildings in Case 1 is shown in Fig. 10. Figure 10a and b present the simulated vertical and horizontal displacements at deformation monitoring points in case 1, respectively. Figure 10c shows the comparison between the simulated values and the measured values of the typical vertical monitoring points. According to the figure, the settlement on the southwest side is greater than that on the northeast side and the building leans toward the south. The comparative analysis of the monitoring data and the numerical simulation results shows that the settlement amount of the measurement point F4 on the south side of the building is the largest, while that of the measurement point F13 on the northeast side is the smallest. This distribution characteristic is completely consistent with the simulation results and the relative error of the maximum settlement is only 0.5%. In terms of horizontal deformation, the measured value of the southward displacement of the building roof slab is 228 mm and the simulation result is 238.7 mm. The difference between the two is only 10.7 mm and the relative error is 4.7%, verifying the reliability of the model. It is worth noting that the simulated settlement values of the measurement points F9 and F13 deviate from the measured values by approximately 15%, which is mainly due to the unreasonable surface loading at this location or inaccurate geological survey. In addition, this area has a special underground structure system: A complex force-bearing system is composed of the pile foundation and the rigid connection formed between the shear wall and the basement wall. Then the earth pressure is to be transmitted through the path of the pile foundation, basement wall, shear wall and floor slab. The model simplification carried out to reduce the loss of computing power has also led to certain errors. Despite these minor differences, the model performed exceptionally well in terms of the overall settlement trend, settlement extreme values and horizontal deformation, which demonstrates high accuracy.
Fig. 10.
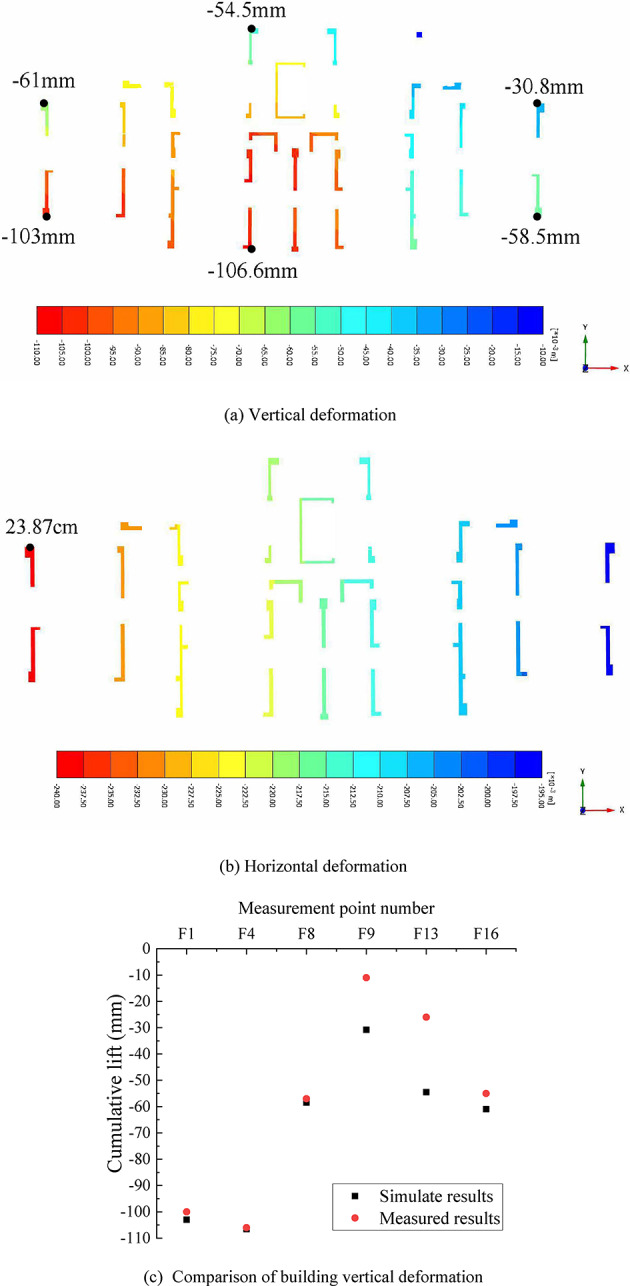
Building deformation cloud map in Case 1.
Figure 11 depicts the stress distribution within the building’s basement in Case 1. Peak tensile stresses on the side walls are 6.41 N/mm2, which exceeded the specified concrete tensile strength requirement, causing wall damage. This result is consistent with the noticeable fissures in the basement walls during field visits, supporting the model’s accuracy.
Fig. 11.

Building Basement Stress Comparison.
The whole deformation cloud diagram of the building is shown in Fig. 12, which shows the building’s settlement and tilt from northeast to southwest. The piles’ shallow penetration into the rock layer may lead to the uneven settlement; on the other hand, the thicker upper weak stratum and the weakened foundation may exacerbate the settlement discrepancy. As the basement structure bears a portion of the load from the uneven settlement, the higher tensile stresses result in basement concrete wall damage.
Fig. 12.

Overall building deformation cloud map in Case 1.
A comparison result of the vertical deformation at critical measurement points between Case 1, Case 2 − 1 and Case 2–2 is shown in Fig. 13. In Case 2 − 1, the original longer pile foundation on the east side was replaced with a shorter 12.6 m pile foundation on the west side. With the reduction in the eastern piles’ embedment depth into bedrock, the monitoring value from eastern points F8 and F9’s settlement increases significantly. A maximum increase of 70% of the initial settlement values is achieved and the building’s maximum horizontal displacement increases to 239.8 mm. Conversely, in Case 2–2, the short pile measuring 12.6 m on the west side of the foundation is extended to 14.3 m, at which point the pile end touches the weathered rock layer. The western building’s settlement experiences a significant decrease, while the settlement trend on the eastern side is not readily apparent. The maximum settlement of the building decreases from 106.6 mm at point F4 to 60.8 mm at point F1 and the horizontal displacement of the building toward the south decreases from 238.7 mm to 159.7 mm.
Fig. 13.

Comparison of building deformation with different pile lengths.
Figure 14 presents the stress distribution within the building’s basement for Case 2. 5.82 N/mm2 is the maximum tensile stress in Case 2 − 1, which is less than Case 1. The uneven settlement decreases with the increase of the settlement on the west side caused by the decrease of pile foundation depth. Consequently, the tensile stress of the underground structure caused by the uneven early settlement has decreased. Conversely, in Case 2–2, the foundation’s bearing capacity increased as the pile length increased. As a result, the basement’s tensile stress decreased, reaching a maximum of 3.66 N/mm2.
Fig. 14.

Stress cloud map in the basement of the building in Case 2.
Figure 15 presents a comparison of vertical deformation at critical measurement points for Case 1, Case 3 − 1 and Case 3 − 2. In Case 3 − 1, fine sand of slightly higher load-bearing capacity replaced the upper miscellaneous fill. In the meantime, a medium sand with a greater load-bearing capacity is utilized in Case 3 − 2. It can be seen in the figure that the settlement and inclination of each measurement point caused a decrease due to the enhancement of the weak upper foundation.
Fig. 15.

Comparison of deformation of buildings with different weak foundations.
Figure 16 depicts the stress distribution within the building’s basement for Case 3. The maximum tensile stress in Case 3 − 1 has a value of 2.07 kN/m², while for Case 3 − 2 it is 2.06 N/mm². As the foundation bearing capacity increases, the maximum tensile stresses gradually decrease.
Fig. 16.

Stress cloud map in the basement of the building in Case 3.
The numerical simulations’ findings indicate that while the depth of the pile into the rock has little effect on horizontal deformation. But it has a significant impact on the building’s settlement. The foundation strength has a similar influence on horizontal and vertical deformation, with variations ranging from 10 to 20%. Furthermore, the basement maximum tensile stress decreases as the foundation increases. Therefore, it can be concluded that the building tilt is related to the fragility of the upper foundation layer and the insufficient depth of the pile foundation within the rock.
Analysis of causes of building settlement and tilting
By integrating the geotechnical investigation report with the numerical simulation, the potential causes of the building’s settlement and tilt are as follows.
(1) The pile end is not embedded in the rock mass, or the depth of insertion into the rock is insufficient.
(2) According to the geotechnical investigation report, boulders are encountered within the residual soil layer. And spheroidally weathered cores are present in the fully/strongly weathered granite stratum. During pile driving operations, these obstructions (boulders or spheroidal weathering bodies) may prevent further penetration. Although the bearing capacity requirement of a single pile has been met, there is still a weak layer beneath it. Under the long-term load pressure on the upper part of the building, it will still lead to uneven settlement.
(3) The upper soft soil layer exhibits significant thickness, high compressibility and low bearing capacity. In the event of poor pile foundation quality, this weak stratum cannot provide supplementary load-bearing support, potentially leading to differential settlement.
(4) The completely weathered and fragmented, strongly weathered rock layers deep in the foundation exhibit heterogeneity. It causes the force on the foundation to be uneven.
(5) The moderately weathered granite bedrock has an irregular interface elevation. That may induce lateral displacement of pile foundations under superstructure loading. Consequently, the pile foundations’ vertical bearing capacity has reduced.
(6) The foundation soils contain granite residual soils and completely/strongly weathered granite layers. These residual soils and weathered rocks are prone to softening and disintegration upon water immersion, leading to significant strength reduction and poor stability.
Therefore, it is necessary to reinforce the soil around the pile and the pile end’s bearing stratum. Correct the building’s deviation to keep the inclination within the allowable range of the code.
Design of building lifting and correction program
Building lifting and tilting objectives
According to the monitoring data, the building has had a maximum tilt of 228 mm, a maximum settlement of 106 mm and a tilt rate of roughly 3‰. The objective is to limit the maximum tilt rate after lifting to 2‰ and prevent further settlement, based on the assumption that will ensure the safety and stability of the building’s superstructure.
Design solutions for building lift and tilt correction
(1) Division of construction work zoning.
The structure is divided into three operating zones for rehabilitation based on the structural features of the building as well as the observed deformation. Zone 1 includes the 16 − 1 to 16 − 4 axis and has four pile caps. Zone 2 consists of six pile caps and is defined by the 16 − 6 to 16 − 10 axis. Finally, Zone 3 extends from the 16 − 11 to the 16 − 14 axis. The operating zone partition is depicted in Fig. 17.
Fig. 17.

Division of construction work area.
The overall construction process is as follows: Soil around the piles should be reinforced initially, followed by a deep-seated compaction lifting of the soil layer. The treatment area’s reinforcement range extends 3.0 m beyond the building foundation’s external contour line.
Soil reinforcement around the pile is started with the building’s periphery and progresses to the center foundation, construction beginning from operation area 1. A cyclic lifting was adopted from areas with higher settlement values to those with lower settlement values in the deep-seated compaction lifting. The maximum height for each lifting cycle is 20 mm. Based on the building’s settling circumstances, the south side of zones 1 and 2 first applied cyclic lifting. At this moment, the F8 and F16 are the lifting height control points. The cycle uplift is carried out in the first, second and third areas when the total lifting at points F1 and F4 reaches about 4.0 cm and it is roughly level with points F8 and F16. At this time, monitoring points 2 and 4 are selected to serve as lifting control points. The building’s overall elevation is relatively flat with points F9 and F13, when the cumulative maximum lifting at points F1 and F4 is approximately 8.0 cm and the cumulative lifting at points F8 and F16 is 3 cm. Ultimately, to achieve the structure’s overall corrective aims, local fine-tuning is carried out on the greatest horizontal displacement at the top of the building in line with the actual site conditions.
(2) Arrangement of holes.
Arrange the reinforcement holes and lifting holes in accordance with the actual conditions on site. The layout of the grouting holes is displayed in Fig. 18.
Fig. 18.

Layout of grouting holes (element: mm).
Reinforcement holes are classified as either indoor or outdoor depending on the foundation form and the structure of the building. Most of the outdoor boreholes are positioned on the northern and southern facades of the structure, aligned with the shear wall locations. These boreholes are spaced 1.2–2.0 m from the exterior walls. And they are drilled at approximately 7-degree angles. The indoor holes are arranged symmetrically along both sides of the cap based on the position of the cap; the number of these varies according to the size of the platforms. Usually, 1.2 to 1.8 m away from the shear walls, these holes are drilled vertically. Hole positions and depths must be tailored to the site’s specific conditions, circumventing the shear walls, pile caps and pipe piles.
A main tilt towards the south is revealed by analyzing the building’s tilt and settlement data. The existing reinforcing holes are utilized for lifting activities on the more settled side, namely the south side. The density of hole location on the lifting side may be suitably increased, depending on the site conditions, to guarantee the lifting rate.
(3) Scope of reinforcement.
The scope of this reinforcement for the 16# residential buildings spans a total of fifteen piles, with a building plan area of about 1134.9 m2. The design reinforcement scope is presented in Table 7.
Table 7.
Design reference values for soil reinforcement scope.
| Reinforcement scope | Reinforcement depth |
|---|---|
| Scope 1 | 16.5 m below the base of foundation bearing |
| Scope 2 | 16.5 m below the bottom of the foundation bearing for zones 1 and 2 and 20.0 m for zone 3 |
| Scope 3 | 16.5 m below the bottom of the foundation bearing in Zone 1 and 20.0 m for zones 2 and 3 |
(4) Soil reinforcement strength.
The compression modulus of soil may show an enhancement of 1.2 to 5 times post-reinforcement in response to different soil properties. Based on engineering expertise, design the post-reinforcement compression modulus values to guarantee conformity to design guidelines, as indicated in Table 8.
Table 8.
The post-reinforcement soil compression modulus reference value.
| Soil number | Fine sand | Silty soil | Medium sand | Fully weathered granite | Strongly weathered granite | |
|---|---|---|---|---|---|---|
| Pre-reinforcement compressive modulus (MPa) | 5.5 | 2.6 | 6.0 | 40 | 60 | |
| Post-reinforcement compressive modulus (MPa) | Reinforcement modulus 1 | 16.5 | 6.5 | 18 | 50 | 75 |
| Reinforcement modulus 2 | 33 | 13 | 36 | 60 | 90 | |
| Reinforcement modulus 3 | 50 | 20 | 54 | 70 | 105 | |
Feasibility analysis of design options
Numerical simulation scheme
The control variable method is employed to assess the effect of reinforcement schemes, with the simulated conditions detailed in Table 9.
Table 9.
Design reference values for soil reinforcement depth.
| Numerical simulation of operational conditions | Reinforcement scope | Strength of soil reinforcement |
|---|---|---|
| Case 4 − 1 | Scope 1 | Reinforcement modulus 2 |
| Case 4 − 2 | Scope 2 | |
| Case 4 − 3 | Scope 3 | |
| Case 5 − 1 | Scope 2 | Reinforcement modulus 1 |
| Case 5 − 2 | Reinforcement modulus 2 | |
| Case 5 − 3 | Reinforcement modulus 3 |
Numerical simulation results
A comparison of the deformation at typical building measurement places post-grouting is shown in Fig. 19, comparing different reinforcing extents. As the figure shows, the settlement at these measurement points decreases as the range of reinforcement increases. In Case 4 − 3, monitoring points F4 and F13 exhibited upward displacements relative to ground level. Considering economic benefits, Cases 4 − 1 and 4 − 2 represent more optimal solutions. For Case 4, the horizontal deformation of the building is reduced, all meeting the requirement of 175.5 mm in the code. Notably, the maximum horizontal distortion of Case 4 − 1 is 125.9 mm, which is relatively close to the extreme value of the specification limit. It indicates that Cases 4 − 2 and 4 − 3 have better corrective effects. To sum up, the maximum settlement point of Case 4 − 2 decreased from 106 mm to 22.6 mm. The horizontal deformation decreased from 228 mm to 89 mm and the tilt rate decreased to 1‰. As a result, Case 4 − 2 is advised for the construction deformation correction.
Fig. 19.

Case 4 Comparison of building deformation.
The basement stress distribution of the Case 4 building is shown in Fig. 20, where the highest tensile stress values for Case 4 − 1, Case 4 − 2 and Case 4 − 3 are 1.89 N/mm2, 1.19 N/mm2 and 1.09 N/mm2, respectively. Three different reinforcement scopes all match the required tensile stress specifications. As the reinforcing range expands, a noticeable decline in peak tensile stress is seen. A 37% decrease in the maximum tensile stress is observed when the reinforcing range is increased from Case 4 − 1 to Case 4 − 2. In the change from Case 4 − 2 to Case 4 − 3, the tensile stress decreases by only 10%, making this decrease less noticeable. After a thorough analysis, the reinforcing scope in Case 4 − 2 is more appropriate.
Fig. 20.

Case 4 Stress cloud in the basement of the building.
As a result of soil strengthening via reinforcement, Fig. 21 shows that both the settling and horizontal deformation at each measurement site decreased significantly. To be more precise, these deformations were decreased by 30% in Case 5 − 1 and by 80% in Case 5 − 2. In Case 3, an upward displacement with respect to the ground elevation was produced at the measurement point due to the overstrength of the soil body. While all three methods comply with code requirements, Case 5 − 2’s solution proves more advantageous when considering both grouting effectiveness and construction complexity.
Fig. 21.

Case 5 Comparison of building deformation.
Figure 22 illustrates the basement stress distribution of the Case 4 building. According to Fig. 20, the maximum tensile stress in the basement reaches 1.19 N/mm2 for Case 5 − 2. With the higher soil strength, the basement’s maximum tensile stress shows a decrease at first and then an increase. As the soil strength progressively improves, the subgrade pressure is redistributed to the basement structure, consequently inducing elevated tensile stresses. Notably, the maximum tensile stresses generated under all three scenarios remain compliant with the stipulated code requirements.
Fig. 22.

Case 5 Stress cloud in the basement of the building.
Post-grouting implementation, both vertical settlement and horizontal deformation at monitoring points were effectively reduced, along with improved differential settlement control. Concrete wall tensile stresses were maintained within allowable limits. The simulation results of various grouting ranges demonstrate that Case 4 − 2 yields optimal performance. When the grouting range continues to increase, the tilt correction effect is not obvious. The simulation of different soil strengths post-grouting shows that the building deformation in Case 5 − 1 is only reduced by 30%; Case 5 − 2 is reduced by 80%, whereas Case 5 − 3 produces large-scale upward displacement. Notably, Case 5 − 2 showed lower maximum tensile stress in basement structures. Based on comprehensive evaluation, the Case 4 − 2 grouting solution is recommended for optimal building rectification.
Evaluation of the effect of Building lifting and correction
Lifting and corrective action program for this project
Program of implementation
In the above numerical simulation results, Case 4 − 2 is selected to dictate the scope for the project’s reinforcing scope and the parameters for the soil’s compression modulus. The reinforcement depths are 16.5 m below pile caps for Areas 1 and 2. And it has a minimum 1.0-meter penetration into the granular strongly weathered granite layer ⑧a. Area 3 has 20.0 m of reinforcement depths. And it also has a minimum 1.0-meter penetration into layer ⑧a. The basement is reinforced to extend 5500 mm below the pile end. Figure 23 shows a schematic of the grouting reinforcement scope.
Fig. 23.
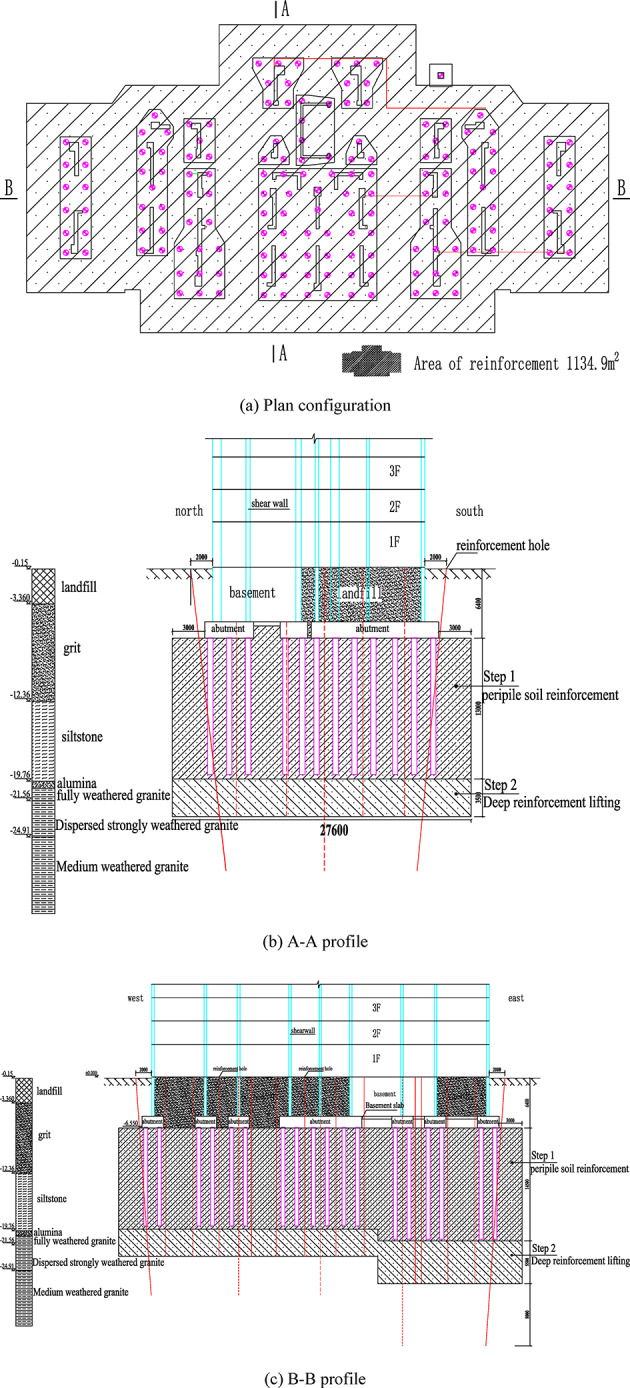
Schematic diagram of the scope of grouting reinforcement.
Construction method
(1) Step 1: Soil Around Pile Reinforcement. Initial reinforcement focuses on soil surrounding piles beneath caps. Enhanced soil rigidity and density through this process improve load-bearing capacity and protect the pile foundation. Shallow reinforcement employs progressive layering for foundation stabilization, reducing settlement rates.
(2) Step 2: Deep Regressive Lifting. Following step 1, drilling continues into strongly weathered granite (minimum 1.0 m penetration). The retreat grouting technique is implemented, with 0.3–0.5 m staged lifting between grouting cycles. This process compacts foundation soils while generating controlled uplift forces for uniform building elevation.
Technical parameters
The technical parameters of the grouting reinforcement are shown in Table 10.
Table 10.
Technical parameters of grouting reinforcement.
| Categorization | Sports event | Parameters |
|---|---|---|
| Drilled hole | Diameter of hole | 42 mm |
| Pitch of hole | The outdoor holes are around 1.2 to 2.0 m from the outer wall and aligned with the shear walls on the axis. Indoor holes are placed along the periphery of the platform pile foundation, with densification in areas with more settlement. The configuration is subject to change dependent on conditions faced on-site | |
| Depth of hole | Zones 1 and 2 have a drilling depth of 22.9 m, whereas Zone 3 is 26.4 m, extending 1.0 m into the discontinuous weathered granite; these dimensions are subject to modification based on actual field conditions | |
| Grouting | Slurry ratio | Adjust the actual situation on site |
| Stresses | Lifting pressure about 0.3 ~ 3.0 MPa (adjusted according to the actual situation of the site) | |
| Slurry setting speed | About 10 s ~ 90 s | |
| Slurry spreading radius | The diffusion radius of the slurry is not less than 2.5 m | |
| Slurry Entry Rate | Slurry feed rate not less than 25% |
To assure the project’s success and fulfill the goals of strengthening the foundation and correcting its settlement and tilt, a special composite slurry containing high-alumina iron is used. Upon solidification, this slurry forms a structure with high compressive strength and excellent impermeability, significantly increasing the foundation’s load-bearing capability.
Analysis of numerical simulation results post-grouting lift
Numerical simulation scheme of grouting uplift
This section details the simulation methods used for Case 4 − 2. The grouting project is one where grouting and consolidation are carried out simultaneously and continuously. Both the pressure filtering impact and the consolidation effect should be considered during the procedure. The real-time sequence effect is not taken into account in the grouting simulation that uses volume strain. However, current studies show that it is difficult to determine the true consolidation effect and filtration pressure effect of a certain grouting. The finite element model also cannot directly consider the filtration pressure effect. Secondly, it will be difficult to establish the model and the calculation cost will be too high if each hole is simulated one by one. Therefore, the overall idea is adopted to simulate this grouting project. Zheng et al.37 proposed using 70% of the actual grouting volume as the input parameter in simulations. It can comprehensively consider both consolidation effects and pressure filtration phenomena and provides more accurate results. Therefore, when the text refers to this research conclusion for simulation, 70% the actual grouting volume is taken as the grouting volume input.
Case−2
is a simulation model of engineering grouting, evolved from Case 1. The simulated behavior of Case 4 − 2 is shown in Fig. 24. Soil qualities are strengthened in specific grouting regions, then applied uniform or varying body strain in these places to simulate the grouting process. There are a lot of grouting holes in the construction process. The grouting scheme specifies a design injection volume of 0.169 m³ per meter of soil element, which translates to a volumetric strain of 16.9%. Therefore, the volume strain of the simulated input is 11.83%37,44,45. The soil in the treated area is described as a non-porous elastomer post-grouting. The soil parameters post-grouting reinforcement are illustrated in Table 11.
Fig. 24.

Numerical simulation Case 4 − 2.
Table 11.
Physical and mechanical parameters of the reinforced soil.
| Ground level |

/MPa |
v |

/MPa |

/MPa |
|---|---|---|---|---|
| Fine sand | 33 | 0.2 | 13.75 | 36.67 |
| Silty clay | 13 | 0.2 | 5.417 | 14.44 |
| Medium sand | 36 | 0.2 | 15 | 40 |
| Fully weathered granite | 60 | 0.2 | 25 | 66.67 |
| Granular strongly weathered granite | 60 | 0.2 | 45 | 90 |
Numerical simulation results of grout lifting
The primary grouting targets include the silty soil layers around the piles and the medium sand or fully weathered granite strata at the pile end. The slurry spreads throughout the soil layer, replacing and discharging the pore water. That could bond the soil particles into consolidated soil, increasing the foundation soil’s strength and compressive modulus. Filling and compacting the foundation soil layer leads to volumetric expansion of the soil. The goal of lifting the building is achieved with the uplifting force, leading the expansion pressure. The post-grouting settlement deformation and tilt of the building are illustrated in Fig. 25. Grouting construction initially commenced on the south side of areas One and Two; consequently, the noticeable uplift was first experienced at the southwest side. Areas One, Two and Three are lifted in order when the settlement on the southwest was significantly adjusted. The southwest settlement is still slightly larger than the northeast post-grouting. But a gentler overall deformation of the building is produced, as the uneven settlement has lessened. At this time, the maximum settlement was 22.6 mm, found in the F4 measurement point, with a lifting amount reaching 79%. And the minimum was 6.3 mm, found in the F9. The southward horizontal displacement at the building’s top has reduced to 89 mm, meeting the design control requirements. The tilt rate has reduced to within the limit value required by the specification and the maximum horizontal displacement is still located in the southwest of the building.
Fig. 25.

Building deformation cloud in Case 4 − 2.
Figure 20(b) shows the stress cloud of the basement wall after Case 4 − 2’s simulated grouting lift. The basement wall’s tensile stress is greatly decreased post-grouting, with the structural side walls experiencing the highest tensile stress. The building’s overall deformation becomes more uniform and the bearing capacity of the foundation is improved. The maximum tensile stress on the basement level has lowered from 6.41 N/mm2 to 1.19 N/mm2 and the concrete wall’s tensile stress is within the permitted limits for the tensile strength criterion.
In conclusion, the deformation control effect of the building structure post-grouting uplift is remarkable: The vertical differential settlement has decreased from 95.6 mm before reinforcement to 16.3 mm, a reduction of 83% and the uneven settlement of the structure has effectively improved. The maximum tensile stress of the basement wall was reduced to 1.19 N/mm² after reinforcement, which was lower than the standard value of the tensile strength of concrete, ensuring the safety of the structure. These data fully demonstrate the remarkable effectiveness of grouting uplift technology in controlling building deformation and improving the structural stress state. The results of this calculation can serve as theoretical support for engineering practice.
Analysis and evaluation of measured data post-grouting lift
Analysis of measured data post-grouting lift
The settlement and tilt of the building have been being monitored after the implementation of the grouting program in Sect. 3.2 at the site. Until November 11, 2021, the building had shown upward displacement to varying degrees. Practical measured uplift data at each monitoring point is depicted in Fig. 26.
Fig. 26.

Cumulative uplift plot of monitoring points post-grouting.
Figure 26(a) illustrates that the upward displacement of the building varies in degrees. And the upward displacement on the southwest side is greater than on the northeast side. This phenomenon corresponds to the trend of settlement before the grouting. In areas with significant settlement, the building elevation is relatively large. The cumulative upward displacement of F4 was 80.3 mm, accounting for approximately 80% of the settlement. In the area where there was previously a small settlement, the grouting range is small and the corresponding upward displacement is also small. The cumulative uplift of F9 was 7.47 mm, accounting for approximately 68% of the settlement. Post-grouting monitoring results confirm substantial settlement mitigation, with most measurement points meeting control standards. Figure 26(b) reveals the uplift of points F1 and F4 has become stable after the 13th grouting cycle. The F8 and F16 measurement points began to show obvious uplift from the third grouting and tended to stabilize after the 12th grouting. The initial settlement at points F9 and F13 has not been executed in the early stages due to the minor settlement and their uplift is comparatively gradual. It can be seen from this figure that each point’s lifting trend corresponds to the grouting implementation plan and the building is lifted successively from the southwest to the northeast.
Figure 27 presents a comparison between measure points’ vertical deformation with pre-grouting over a 100-day period and deformation with post-grouting over the same period. It can be revealed that the maximum settling rate after 100 days is 0.02 mm/d at measure point F4, which has met the completion acceptance criteria outlined in the Code for Measurement of Building Deformation (JGJ8-2016)34.
Fig. 27.

Comparative analysis of building vertical deformation before and after 100 days of grouting.
Figure 27 shows the typical measurement points’ vertical deformation before and after 100 days of grouting. Except for point F1, the other three measurement points all produced slight settlements and the settlement rates were all within the specification limit of 0.02 mm/d. A tiny upward displacement occurs at point F1; the reason might be that the slight expansion of some slurry at this point in the later stage offset part of the settlement, which is within the controllable normal range.
Until November 11, 2021, the east-west direction of the building had been corrected vertically. The north-south direction has a 5 mm tilt towards the south and the tilt rate is 0.07‰, which has met the design control standard. The tilt has satisfied the completion acceptance requirements of the Code for Measurement of Building Deformation (JGJ8-2016)34.
Comparison between simulated and measured post-grouting lift
A comparative of simulated and measured grouting lift increments is presented in Fig. 28. It can be seen from the figure that the numerical simulation and the measured uplift trends are the same. And the maximum upward displacement was both generated at the F1. The simulated upward displacement is 84.7 mm, which differs from the measured upward displacement by 0.21 mm and the relative error is only 0.2%. However, in the measurement point area from F9 to F13, there is a difference between the simulation and the measured results. Among them, the difference at the measurement point F12 is the most significant, reaching 26.77 mm. The reasons include the following two aspects: on the one hand, the local surface loads and geological measurement errors mentioned in Sect. 2.5.2. And on the other hand, to avoid excessive calculation time, the model adopts overall grouting reinforcement to simulate the segmented grouting process used in actual engineering. Moreover, numerous uncertainties inherent in field construction, including challenges in quality control and precipitation effects, may also contribute to the measured discrepancies. Although there are local differences in the upward displacement of each measurement point, the final settlement results’ simulated value (5.2 mm) at the F12 measurement point only differs from the measured value (4.63 mm) by 0.57 mm. The simulation results demonstrate close alignment with the field measurements.
Fig. 28.

Comparison chart of grouting lift increments.
The final settlements of each measure point can be calculated according to the accumulative uplift of the building after post-grouting reinforcement. The contrast between simulation and practical data is detailed in Table 12. It can be seen from the table that the simulated and measured settlement trends before and after grouting have not changed and the overall settlement on the southwest side is greater than that on the northeast side. The measured maximum sedimentation value was reduced to 25.7 mm, the simulated maximum sedimentation value was reduced to 22.6 mm and the error was only 3.1 mm. The measured value of differential settlement of buildings decreased by 76%, the simulated value decreased by 83% and the error was only 7%. The measured tilt rate and the simulated tilt rate were both reduced to about 1‰ and the simulation results showed that the tensile stress of the basement structure did not exceed the ultimate tensile stress. The comparison results verified the effectiveness of the volumetric strain method in the process of simulating compaction grouting reinforcement. The numerical simulation method can effectively reflect the grouting reinforcement’s effect and reliably predict the correction effect post-grouting. It provides a prediction tool for similar projects.
Table 12.
Statistical table of settlement values at main monitoring points.
| Settlement value (mm) | F1 | F4 | F8 | F9 | F13 | F16 | |
|---|---|---|---|---|---|---|---|
| Pre-grouting reinforcement | −100 | −106 | −57 | −11 | −26 | −55 | |
| Post-grouting reinforcement | Field measurement | −15.09 | −25.7 | −17.34 | −3.53 | −14.51 | −2.47 |
| Numerical simulation | −20.3 | −22.6 | −9.3 | −6.3 | −15.3 | −6.3 | |
Conclusion
This paper takes the building inclination and settlement phenomenon of the 16# building in Fujian Zhangzhou Junlin Huafu as the research background. Combined with the engineering investigation report and numerical simulation, the reasons for the building inclination and settlement are analyzed. A numerical simulation method for scientifically predicting the effect of compaction grouting was proposed. And the reliability of the numerical simulation method was verified through on-site monitoring data. This study can provide a reference for similar building correction schemes. The main research results are as follows:
(1) The maximum cumulative settlement of the building in this project is 106 mm and the inclination rate has exceeded the specification requirement of 2.5‰. Cracks have occurred at the junction of the basement. To correct the building’s deviation, the grouting reinforcement of the soil surrounding the pile and the bearing stratum at the pile end is required. To correct the building’s deviation, the grouting reinforcement of the soil surrounding the pile and the bearing stratum at the pile end is required.
(2) To scientifically predict the effect of compaction grouting, the volumetric strain method for simulated grouting was proposed. Based on the settlement and inclination conditions of the simulated grouting scheme, the optimal grouting reinforcement scheme is determined. The building’s greatest settlement dropped from 106.6 mm to 37.5 mm following the simulated grouting uplift. The building’s maximum horizontal displacement at the top dropped from 238.7 mm to 89 mm and the tilt rate dropped from the initial 3‰ to 1‰. The vertical differential settlement dropped from 95.6 mm prior to reinforcement to 16.3 mm, an 83% decrease.
(3) The deviation correction scheme successively and cyclically lifts from the southwest side with greater settlement to the northeast side with smaller settlement. The grout permeates the soil layer while it is being grouted. The foundation soil’s filling and compaction caused the soil’s volume to expand. Under the action of expansion pressure, a lifting force is formed to meet the building’s inclination correction requirements.
(4) The building’s cumulative maximum lifting was measured to be 84.91 mm after the implementation of grouting uplift. The settlement values at each monitoring point all met the control requirements. The inclination rate of the building was reduced to 0.07‰. The deviation correction work of the building was successfully completed. Furthermore, the accuracy of the grouting numerical prediction method was confirmed by the good agreement between the measured and simulation findings. This paper can provide simulation scheme support and construction reference cases for similar grouting projects.
Acknowledgements
This research did not receive any specific grant from funding agencies in the public, commercial, or not-for-profit sectors.
Author contributions
C.X.D (first author, corresponding author): writing—original draft, software, formal analysis, writing—review & editing, visualization, methodology, resources, data curation.
Data availability
All data in this study are available from the corresponding author on reasonable request.
Declarations
Competing interests
The authors declare no competing interests.
Footnotes
Publisher’s note
Springer Nature remains neutral with regard to jurisdictional claims in published maps and institutional affiliations.
References
- 1.Ding, Z., Wei, X., Zhang, X. & Yin, X. Analysis of the field monitoring data on soil movements and adjacent Building settlement due to shield tunnelling. Eng. Comput.36, 1219–1237. 10.1108/Ec-07-2018-0314 (2019). [Google Scholar]
- 2.Hwang, T., Kang, S. & Kim, J. Optimization of the Building integrated photovoltaic system in office Buildings—Focus on the orientation, inclined angle and installed area. Energ. Build.46, 92–104. 10.1016/j.enbuild.2011.10.041 (2012). [Google Scholar]
- 3.Zhang, X., Qu, H., Xu, Y., Zhang, L. & Z, Z. Investigating the damage to masonry buildings during shield tunneling: A case study in Hohhot metro. Eng. Fail. Anal. 160. 10.1016/j.engfailanal.2024.108147 (2024).
- 4.Tu, S. et al. Seepage effect on progressive failure of shield tunnel face in granular soils by coupled continuum-discrete method. Comput. Geotech. 166. 10.1016/j.compgeo.2023.106009 (2024).
- 5.Zhang, D., Fang, Q., Hou, Y., Li, P. & Wong, L. Protection of buildings against damages as a result of adjacent Large-Span tunneling in shallowly buried soft ground. J. Geotech. Geoenviron. 139, 903–913. 10.1061/(Asce)Gt.1943-5606.0000823 (2013). [Google Scholar]
- 6.Dong, Z. et al. Grouting-induced ground heave and Building damage in tunnel construction: A case study of Shenzhen metro. Undergr. Space. 7, 1175–1191. 10.1016/j.undsp.2022.04.002 (2022). [Google Scholar]
- 7.Jin, Z. et al. Stability analysis for excavation in frictional soils based on upper bound method. Comput. Geotech.165, 105916. 10.1016/j.compgeo.2023.105916 (2024). [Google Scholar]
- 8.Tu, S., Li, W., Zhang, C. & Chen, W. Effect of inclined layered soils on face stability in shield tunneling based on limit analysis. Tunn. Undergr. Sp Tech. 131. 10.1016/J.TUST.2022.104773 (2023).
- 9.Zhang, C., Zhang, X. & Fang, Q. Behaviors of existing twin subway tunnels due to new subway station excavation below in close vicinity. Tunn. Undergr. Sp Tech.81, 121–128. 10.1016/j.tust.2018.07.020 (2018). [Google Scholar]
- 10.Wang, R. et al. Dynamic response of single pile induced by the vibration of tunnel boring machine in hard rock strata. Sci. Rep.15, 11658. 10.1038/s41598-025-95833-x (2025). [DOI] [PMC free article] [PubMed] [Google Scholar]
- 12.Sarfarazi, V. et al. 2D discrete element analysis of the footing above excavated circle in soil. Sci. Rep.14, 21399. 10.1038/s41598-024-72220-6 (2024). [DOI] [PMC free article] [PubMed] [Google Scholar]
- 13.Zhou, X. et al. Mechanical characteristics and calculation method of static pressure pile installation for PHC pipe piles in sandy soil foundation with pebble interlayer. Sci. Rep.15, 13756. 10.1038/s41598-025-98127-4 (2025). [DOI] [PMC free article] [PubMed] [Google Scholar]
- 13.Li, Y., Wu, Z. & Zhang, W. Numerical analysis of mechanical response in Bridge and pile foundations due to shield cutting of residual piles. Sci. Rep.15, 13249. 10.1038/s41598-025-96865-z (2025). [DOI] [PMC free article] [PubMed] [Google Scholar]
- 14.Pham, T. A., Tabaroei, A., Daniel, D. & Han, J. Critical state mechanics-based arching model for pile-supported embankments. Geotext. Geomembranes. 53, 909–937. 10.1016/j.geotexmem.2025.03.002 (2025). [Google Scholar]
- 15.Soomro, M., Xiong, S., Cui, Z., Zhao, C. & Mangi, N. Piled-supported embankment responses to tunnelling in soft ground: an investigation of settlement and load transfer mechanisms. Tunn. Undergr. Space Technol.156, 106241. 10.1016/j.tust.2024.106241 (2025). [Google Scholar]
- 16.Bu, L. & Yue, H. Quality risk perception of rectification and reinforcement in a high-rise building under uncertainty. Buildings-Basel. 14. (2024). 10.3390/buildings14030774
- 17.Xiao, J., Sun, J., Jiang, Z., Wang, Q. & Guo, D. Building rectification by underexcavation and practical design method. J. Perform. Constr. Fac. 36. 10.1061/(asce)cf.1943-5509.0001774 (2022).
- 18.Yang, X., Zhu, W., Wang, Q., Zhang, L. & Zhou, H. Research on key technology for inclination rectification of cutting pile below a high-rise Building in soft soil area. China Civ. Eng. J.56, 136–145. 10.15951/j.tmgcxb.22040342 (2023). (in Chinese). [Google Scholar]
- 19.Wang, J., Li, F., Li, F., Yang, Y. & Sheng, X. Design and engineering practice of large tonnage anchor static pressure pile in rectification and reinforcement of high-rise buildings. Build. Sci.39, 155–161. 10.13614/j.cnki.11-1962/tu.2023.09.019 (2023). (in Chinese). [Google Scholar]
- 20.Guo, T., Wu, E., Li, A., Wei, L. & Li, X. Integral lifting and seismic isolation retrofit of great hall of Nanjing museum. J. Perform. Constr. Fac.26, 558–566. 10.1061/(asce)cf.1943-5509.0000273 (2012). [Google Scholar]
- 21.Li, X. et al. Structural health monitoring of a historic Building during uplifting process: system design and data analysis. Struct. Health Monit.22, 3165–3188. 10.1177/14759217221135351 (2023). [Google Scholar]
- 22.Zhou, C., Li, X., Sun, J., Xie, B. & Wu, Y. Lift monitoring and analysis of multi-storey corridors in buildings. Automat Constr. 106. 10.1016/j.autcon.2019.102902 (2019).
- 23.Graf, E. D. Compaction grouting technique and observations. J. Soil Mech. Found. Div.5, 1151–1158. 10.1061/JSFEAQ.0001321 (1969). [Google Scholar]
- 24.Chepurnova, A. Assessing the influence of jet-grouting underpinning on the nearby buildings. J. Rock. Mech. Geotech.6, 105–112. 10.1016/j.jrmge.2014.01.005 (2014). [Google Scholar]
- 25.Cui, X. Nondestructive controllable grouting: A novel mthod to correct deviation of building foundation. Adv. Civ. Eng. 1–11. (2023). 10.1155/2023/1835403 (2023).
- 26.Ni, J. & Cheng, W. Using fracture grouting to lift structures in clayey sand. J. Zhejiang Univ-SC A. 11, 879–886. 10.1631/jzus.A0900748 (2010). [Google Scholar]
- 27.Abelev, M., Averin, I. & Korableva, U. Experimental investigations of the effectiveness of the geocomposite method of soil grouting in the beds of buildings on backfill bands. Soil. Mech. Found. Eng+. 52, 84–87. 10.1007/s11204-015-9310-3 (2015). [Google Scholar]
- 28.Akyol, E. Strengthening foundations of seismically weak buildings on sandy soils in denizli, Turkey. Environ. Earth Sci.66, 1415–1421. 10.1007/s12665-011-1352-x (2011). [Google Scholar]
- 29.Zuo, J. Study on grouting uplifting law and control method of surrounding rock on urban shallow tunnel. Master’s thesis (Shandong University, 2018). (in Chinese).
- 30.Zhang, D., Liu, Z., Wang, R. & Zhang, D. Influence of grouting on rehabilitation of an over-deformed operatingshield tunnel lining in soft clay. Acta Geotech.14, 1227–1247. 10.1007/s11440-018-0696-8 (2018). [Google Scholar]
- 31.Dai, X. et al. Displacement prediction of inclined existing buildings with a raft foundation restored by compaction grouting in clay. J. Build. Eng. 91. 10.1016/j.jobe.2024.109511 (2024).
- 32.Guo, W., Liu, S., Hu, B., Xu, Y. & Luo, Y. Grouting reinforcement of large Building foundation over old gob areas: A case study in Huaibei mining area. China. Adv. Civ. Eng.2018, 1–11. 10.1155/2018/8738752 (2018). [Google Scholar]
- 33.Ji, Y. et al. Factors influencing sleeve grouting quality for prefabricated building: an interpretive structural modeling approach. Adv. Civ. Eng.2021 (1-15). 10.1155/2021/5598424 (2021).
- 34.Ministry of Housing and Urban Rural Development of the People’s Republic of China. Building Deformation Measurement Specifications (JGJ 8 -2016). China Architecture & Building Press, Beijing, China. (in Chinese) (2016).
- 35.Ministry of Housing and Urban Rural Development of the People’s Republic of China. Technical Regulations for Building Tilt Correction (JGJ 270–2012). China Architecture & Building Press, Beijing, China. (in Chinese) (2012).
- 36.Ministry of Housing and Urban Rural Development of the People’s Republic of China. Design criteria for concrete structures (GB/T50107-2010). China Architecture & Building Press, Beijing, China. (in Chinese) (2010).
- 37.Zheng, G. et al. Study on passive and grouting active control of tunnel horizontal deformation caused by pit excavation. Chin. J. Geotech. Eng.41, 1181–1190. 10.11779/CJGE201907001 (2019). [Google Scholar]
- 38.Dewi, S., Liong, T. & Analysis on Laterally Loaded Group Piles by PLAXIS 3D Foundation. Com. Tech.2(2), 1023–1030. 10.21512/comtech.v2i2.2852 (2011). [Google Scholar]
- 39.Lan, N. & Chen, J. PLAXIS 3D numerical simulation study on the influence of fill soil on Bridge foundation. Highway64 (9), 199–204. 10.1016/j.protcy.2016.08.095 (2019). [Google Scholar]
- 40.BRINKGREVE R B J, K. U. M. A. R. S. W. A. M. Y. S. et al. PLAXIS 3D Manual (PLAXIS, 2017).
- 41.Schiena, F., Lusini, E., Fazio, A. & Graziani, A. A strain applied method for FEM-2D modelling of TBM tunnels in coarse-grained soils with comparative analysis of case histories. Tunn. Undergr. Space Technol.153, 106001. 10.1016/j.tust.2024.106001 (2024). [Google Scholar]
- 43.Jamil, I. et al. Analysis and Design of Piled Raft Foundation Taking into Account Interaction Factors. Adv. Civ. Eng. 1334136. (2022). 10.1155/2022/1334136 (2022).
- 42.Al-Dawoodi, A. B., Rahil, F. H. & Waheed, M. Q. Numerical Simulation of Shallow Foundation Behavior Rested on Sandy Soil.IOP Conference Series: Earth and Environmental Science. 856(1). (2021). 10.1088/1755-1315/856/1/012042
- 44.Ni, J. & Cheng, W. Monitoring and modeling Grout efficiency of lifting structure in soft clay. Int. J. Geomech.10 (6), 223–229. 10.1061/(ASC38E)GM.1943-5622.0000026 (2010). [Google Scholar]
- 45.Masini, L., Rampello, S. & Soga, K. An approach to evaluate the efficiency of compensation grouting. J. Geotech. Geoenviron. 140 (12), 04014073. 10.1061/(ASCE)GT.1943-5606.0001180 (2014). [Google Scholar]
Associated Data
This section collects any data citations, data availability statements, or supplementary materials included in this article.
Data Availability Statement
All data in this study are available from the corresponding author on reasonable request.