

Abstract
With the advancement of research in educational psychology, cognitive flexibility (CF), as a pivotal ability that enables individuals to adapt to complex environments and tackle challenges, has garnered increasing attention from scholars. For high school students, there is a lack of research regarding latent profiles of cognitive flexibility and associated risk factors. To identify latent profiles of cognitive flexibility among high school students and develop targeted interventions. From August to October 2024, 1,014 high school students in Hebi City were surveyed using a comprehensive questionnaire incorporating the Cognitive Flexibility Inventory. Latent profile analysis was employed to identify subgroups of CF among students and a binary logistic regression model was used to analyze the associated influencing factors. The optimal cut-off value for grouping was determined by calculating the receiver operating characteristic (ROC) area under curve. Results show that CF could be divided into 2 classes: class1 moderate-CF group (73.5%) and class2 high-CF group (26.5%). The results of the regression analysis indicated that male was a predictor of the high-CF group (OR = 1.414, 95% CI: 1.034–1.935). The higher aesthetic sensitivity and Proactive Personality Scale scores (OR = 1.774, 95% CI: 1.413–2.228; OR = 1.108, 95% CI: 1.080–1.137) were significantly more likely to be in the high-CF group. Additionally, students with a higher ease of excitation score (OR = 0.608, 95% CI: 0.502–0.736) were more likely to belong to the moderate-CF group. Based on the ROC, a cut-off value of 68.5 was established to identify the high-CF group, with sensitivity at 0.862 and specificity at 0.946. It is recommended that educational and mental health interventions focus on individual differences among students to comprehensively enhance cognitive flexibility and regulatory capacity.
Keywords: Cognitive flexibility, Latent profile analysis, Environmental sensitivity, High school students, Proactive personality
Subject terms: Psychology, Medical research, Risk factors
Introduction
Cognitive flexibility, also referred to as mental flexibility or set shifting, constitutes a critical component of executive function. The theory was first proposed by Spiro1. He posited that cognitive flexibility refers to an individual’s capacity to adaptively regulate their behavior in response to environmental stimuli. This includes the ability to consciously switch between different psychological tasks or strategies and adjust responses according to changing environmental demands2. Diamond regards it as the ability of an individual to shift perspectives and break through the original thinking framework when coping with changes3. Martin posits that cognitive flexibility entails the awareness of multiple potential solutions to a problem and the capacity to adapt seamlessly to situational changes4. In conclusion, cognitive flexibility relies on the flexible transfer and reorienting of attention, representing an adaptive and regulatory thought and behavioral ability5.
Cognitive flexibility constitutes a critical component of executive function and plays a pivotal role in various advanced cognitive processes, including working memory, attentional control, and inhibitory control6. A substantial body of functional magnetic resonance imaging (fMRI) research has consistently demonstrated that the Midcingulo-Insular Network (M-CIN) and the Lateral Frontoparietal Network (L-FPN) are crucial for supporting executive functions and cognitive flexibility2,7. The L-FPN is also referred to as the executive control network and includes lateral prefrontal cortices (PFCs; dorsolateral PFC, ventrolateral PFC and inferior frontal junction), the inferior parietal lobule, posterior inferior temporal lobes and portions of the midcingulate gyrus8. Among these, the PFC is identified as the most critical brain region for cognitive flexibility9. In the brains of humans and other primates, the PFC is a brain region that evolved relatively recently. This region not only matures most slowly during individual development but also exhibits complex associations with higher cognitive functions10. The high school years represent a critical period for both physical and psychological development, particularly in the realm of cognitive flexibility. During this stage, students encounter numerous challenges including academic demands, interpersonal relationships, and personal exploration. Cognitive flexibility plays a pivotal role in influencing mental well-being and social adaptation11,12. Individuals with high cognitive flexibility tend to exhibit more adaptive coping strategies, enhanced psychological resilience, increased creativity, and superior academic performance. Conversely, those with low cognitive flexibility often display characteristics such as rigid thinking, impaired decision-making abilities, and heightened emotional reactivity. When faced with stressful events, they frequently struggle to adapt their thought processes flexibly, which can lead to or exacerbate negative emotions, thereby increasing the risk of anxiety and depression8,13,14. These psychological issues can further impair cognitive flexibility, creating a vicious cycle that negatively impacts an individual’s adaptability and mental health. Cognitive flexibility can be influenced by a multitude of factors, including age, geographic location, socioeconomic status, and familial structure. Li et al.15conducted a longitudinal study examining the cognitive flexibility of students from primary school through high school, revealing that flexibility progressively improves with age and is significantly correlated with students’ academic performance as reflected in their course grades. The results of a meta-analysis comprising 23 studies (N = 35,355) demonstrated an association between CF and mathematical ability, with moderate heterogeneity and significant weighted effect size (r = 0.35; Q = 67.82; p = 0.01; I² = 57.24%)16. Additionally, in younger children, mathematics performance is more strongly associated with CF (r = 0.40; p = 0.05). Children from low-income backgrounds frequently exhibit delays in cognitive flexibility, whereas higher family income and maternal educational attainment are positively correlated with enhanced cognitive flexibility17,18. Wu et al. found that within the adolescent population, students from urban areas exhibited significantly higher levels of cognitive flexibility compared to rural counterparts19. Furthermore, a study of 303 young individuals in China revealed that only children exhibited higher cognitive flexibility compared to those with siblings, and this enhanced cognitive flexibility was associated with structural differences in the brain20.
High sensitivity is typically characterized as a personality trait where an individual exhibits heightened responsiveness to external stimuli, encompassing environmental, social, and emotional factors. This trait can be delineated into three primary dimensions: ease of excitation (EOE), low sensory threshold (LST), and aesthetic sensitivity (AES)21. High sensitivity is closely related to insight into subtle environmental changes, intense emotional responses, and profound information processing22. Such individuals are more likely to feel nervous and uncomfortable when encountering situations such as noise, social pressure or emotional changes, and are also prone to show stronger empathy and more delicate emotional experiences23,24. High sensitivity and cognitive flexibility may interact to some extent. On the one hand, highly sensitive individuals may experience increased emotional and cognitive burdens when exposed to large or sudden information stimuli, which can lead to a temporary reduction in cognitive flexibility25,26。This phenomenon may be associated with the neurophysiological characteristics of highly sensitive individuals. They exhibit more pronounced activation in specific brain regions, which predisposes them to experience heightened stress in complex situations26,27. On the other hand, highly sensitive individuals may possess a superior ability to view problems from multiple perspectives owing to their acuity towards external environmental signals, and with proper emotional regulation and support, this characteristic can facilitate enhanced cognitive flexibility28. The dual effect indicates that the cognitive flexibility of highly sensitive individuals may be substantially influenced by their emotional regulation capabilities.
Bateman and Crant29 posit that proactive personality is characterized by an individual’s inclination to take initiative in actions aimed at influencing or altering their environment. Individuals with a proactive personality are not constrained by their environment and excel at identifying opportunities to influence and improve it. This characteristic emphasizes that individuals tend to actively seek out opportunities, initiate problem-solving efforts, and resourcefully allocate available resources. People with high proactive personality are better equipped to flexibly adjust their thinking in various situations and adapt to changes30. Those with high cognitive flexibility can more rapidly acclimate to new environments, recognize and seize opportunities, thereby demonstrating more proactive behaviors31. This ability provides them with significant advantages when confronting uncertainties. Furthermore, cognitive flexibility serves as a mediator between proactive personality and creative behavior, suggesting that proactive personality can enhance students’ creative performance through improving cognitive flexibility32.
Latent profile analysis (LPA) is an individual-centered category analysis technique. It identifies homogeneous groupings or categories with similar features from multivariate data by analyzing the interactions between multiple features33,34. By grouping students with similar cognitive flexibility profiles into the same subgroup and those with differing profiles into separate categories, LPA maximizes heterogeneity between groups while minimizing heterogeneity within each group. This method enables researchers to uncover meaningful subgroups within a population, providing insights into the diverse ways individuals or dyads respond to specific variables. This study aimed to explore the characteristics of cognitive flexibility profiles among high school students in Hebi City, China through LPA. Additionally, it investigated the impact of general demographic factors, high sensitivity, and proactive personality on the latent classification of cognitive flexibility. This research seeks to provide empirical evidence and theoretical support for enhancing cognitive flexibility and promoting mental health, assist educators and mental health professionals in designing effective intervention strategies to help high school students address growth challenges and foster comprehensive development.
Materials and methods
Participants
By using convenience sampling, students from several high schools in Hebi City, China were investigated online through the Questionnaire Star platform from August to October 2024. During the testing process, quality control was ensured through the implementation of reverse-scoring questions, balanced item sequencing, and clear instructions for participants to report their responses truthfully. Invalid questionnaires were screened out based on criteria such as excessively short response times, overly patterned or consistent answers, and questionnaires with incorrect or missing responses were eliminated. A total of 1,129 questionnaires were collected. Of these, 115 were identified as invalid, resulting in 1,014 valid questionnaires, yielding an effective rate of 89.8%. There were 358 Grade 12 students (35.3%), 257 Grade 11 students (25.3%), and 399 Grade 10 students (39.4%). There were 442 male students(43.5%) and 572 female students(56.5%), with an average age of 16.4 ± 0.9 years old (14–19).
The study complies with the Declaration of Helsinki and has been approved by the Institutional Ethics Committee of Hospital of Unit 96,608 of the People’s Liberation Army (PLA)of (NO. 2024-A-004), and all participants participated voluntarily and obtained their informed consent.
Methods
Questionnaire Design: (1) Demographic and socioeconomic information, including gender, grade, age, residence, annual family income, only child or not, and a class cadre or not. (2) The Chinese version of the Cognitive Flexibility Inventory(CFI) by Wang Yang35. This scale comprises 20 items and is structured into two dimensions: cognitive controllability and selectivity. A 5-point Likert scale was employed, ranging from 1 (never) to 5 (always). Notably, items 2, 4, 7, 9, 11, and 17 were reverse-scored. Higher scores indicate greater cognitive flexibility. (3) The Chinese version of the Highly Sensitive Child Scale-21 item༈HSC-21༉by Jiang Shunyi36. This scale consists of 21 items, including 7 items of EOE, 6 items of LST, and 8 items of AES. A 7-point scoring method ranging from 1 (completely disagree) to 7 (completely agree) was used. Higher scores indicate stronger environmental sensitivity. (4) The Chinese version of the Proactive Personality Scale (PPS) translated and revised by Shang Jiayin37. The scale is based on the original PPS developed by Bateman and Crant, which comprises 11 items and measures a single dimension. It employs a 7-point Likert scoring system, where 1 represents “strongly agree” and 7 represents “strongly disagree”. A higher score on the subject reflects a higher level of proactive personality. The Cronbach’s α coefficient and McDonald’s ω coefficient were employed to assess the internal consistency reliability of the scales. In this study, the Cronbach’s α coefficient and McDonald’s ω coefficient for all three scales exceeded 0.8, demonstrating satisfactory internal consistency reliability (Table 1).
Table 1.
Internal consistency reliability analysis of the scales. CFI: cognitive flexibility inventory, HSC-21: highly sensitive child Scale-21 items, PPS: proactive personality scale, EOE: ease of excitation, LST: low sensory threshold, AES: aesthetic sensitivity.
| Scale/Scale dimension | Number of items | Cronbach’s α | McDonald’s ω |
|---|---|---|---|
| CFI | 20 | 0.865 | 0.858 |
| controllability | 7 | 0.864 | 0.874 |
| selectivity | 13 | 0.896 | 0.895 |
| HSC-21 | 21 | 0.891 | 0.892 |
| EOE | 7 | 0.810 | 0.812 |
| LST | 6 | 0.786 | 0.794 |
| AES | 8 | 0.818 | 0.795 |
| PPS | 11 | 0.831 | 0.832 |
Data collection: The process adhered strictly to scientific and standardized procedures. Leveraging the computer network platform, the assessment was organized and conducted in a group-administered format, with classes serving as the fundamental units. All primary evaluators were psychology professionals who had completed systematic and unified training, possess robust professional knowledge and extensive practical experience, thereby ensuring the standardization and professionalism of the testing process. Prior to completing the questionnaire, participants would be provided with a detailed explanation by the evaluators using a standardized set of instructions. This explanation covered the purpose of the assessment, the specific procedures for completion, and important points to note. Meanwhile, the evaluators explicitly assured that the questionnaire results would be kept strictly confidential and that their personal privacy would be fully protected. Following the test, the experimenter promptly collected the questionnaires and systematically organized them according to established protocols to ensure the integrity and accuracy of the data.
Statistical analysis
The software Mplus 7.4, AMOS 24.0 and SPSS 24.0 were adopted. Data analysis was divided into three steps: (1) Mplus 7.4 was used for LPA analysis, and the scores of each item on the CFI were used as explicit response index variables to establish a latent profile model and estimate the fit of the latent profile model for high school students’ potential risks. The statistical indicators for evaluating the goodness of fit of the model are as follows: Akaike information criterion (AIC), Bayesian information criterion (BIC), information entropy, sample-size adjusted BIC (aBIC), Bootstrap likelihood ratio test (BLRT), Lo-Mandell-Rubin likelihood ratio test (LMRT). The best class model is determined according to the principle that the model fits better if information entropy is higher and AIC, BIC, and aBIC are lower. The model classification quality indicator information entropy represents the difference between the classification accuracy and error rates of the model. Information entropy ranges from 0 to 1. Entropy > 0.8 indicates that the classification accuracy reaches 90%, and the closer to 1 indicates that the classification is more accurate38. LMRT and BLRT are utilized for model comparison, where a p-value less than 0.05 suggests that the K-class model is better than the (K-1)-class model. (2) The accuracy and cut-off value of the CFI in this study was tested by receiver operating characteristic (ROC) curve analysis. (3) Univariate analysis was conducted with demographic information as the independent variable. The Shapiro-Wilk test was used for normality testing. Skewed distribution data was presented as M (Q1, Q3), and the Mann-Whitney U test was used for intergroup comparison. Count data were described as n (%), classification data were analyzed using the chi-square test, and ordered classification data were analyzed using the Mann-Whitney U test. Variables with statistical significance (P < 0.05) in the univariate analysis were taken as independent variables and included in the binary logistic regression model for further analysis. The software AMOS 24.0 was utilized to perform a validity analysis of the scale.
Results
Measurement models
Based on the structural equation modeling approach, a multivariate normality analysis was performed on the scale data. The results indicated that the Multivariate C.R. values for the CFI, HSC-21, and PPS scales were 101.82, 116.10, and 180.32, respectively. Therefore, the scale data did not conform to the multivariate normal distribution, which led to a worse goodness-of-fit of the model39,40. Thus, the Bollen-Stine Bootstrap P correction method was employed to adjust the model. The results demonstrated that the three models exhibited satisfactory goodness-of-fit (Table 2).
Table 2.
The goodness of fit statistics for scales. CFIa: cognitive flexibility inventory, HSC-21: highly sensitive child Scale-21 items, PPS: proactive personality scale, CMIN/DF: Chi-square to degrees of freedom ratio, RMSEA: root mean square error of approximation, CFIb: comparative fit index, GFI: goodness of fit index, AGFI: adjusted goodness of fit index, TLI: Tucker-Lewis index.
| CMIN/DF | RMSEA | CFIb | GFI | AGFI | TLI | |
|---|---|---|---|---|---|---|
| CFIa | 1.45 | 0.02 | 0.99 | 0.97 | 0.96 | 0.99 |
| HSC-21 | 1.49 | 0.02 | 0.99 | 0.97 | 0.95 | 0.99 |
| PPS | 2.26 | 0.04 | 0.99 | 0.98 | 0.95 | 0.98 |
LPA model of cognitive flexibility
Based on the scores from the 20 items of the CFI, a latent class model comprising 1 to 5 classes was constructed. AIC, BIC and aBIC all decreased gradually with the increase of the number of categories. Entropy was higher than 0.9 for two to five categories. BLRT for class 2 to 5 were all less than 0.05, while the LMRT value was less than 0.05 only in class 2 and greater than 0.05 in the other classes. Consequently, after a comprehensive evaluation, the model for class2 was ultimately selected as the optimal model (Table 3). In the category model, the category’s own attribution probability [that is, the average probability that high school students (rows) in each category belong to each potential category (columns)] ranges from 95.2 to 98.3%. The attribution probability (i.e., attribution error) of other categories is between 1.7% and 4.8%, indicating that the accuracy of the two-category model adopted in this study is high, and the classification results are credible (Table 4).
Table 3.
Fitting index and class probability of latent profile analysis model of cognitive flexibility. AIC: Akaike information criteria, BIC: bayesian information criterion, aBIC: adjusted bayesian information criterion, BLRT: bootstrap likelihood ratio test, LMRT: Lo-Mandell-Rubin likelihood ratio test.
| Models | AIC | BIC | aBIC | Information entropy | LMRT p-value |
BLRT p-value |
Categorical probability |
|---|---|---|---|---|---|---|---|
| 1 | 51293.253 | 51490.119 | 51363.076 | 0 | 1 | ||
| 2 | 48091.014 | 48391.235 | 48197.494 | 0.909 | 0.0002 | < 0.001 | 0.735/0.265 |
| 3 | 46805.47 | 47209.046 | 46948.607 | 0.912 | 0.0766 | < 0.001 | 0.205/0.621/0.174 |
| 4 | 45634.209 | 46141.14 | 45814.003 | 0.926 | 0.0566 | < 0.001 | 0.195/0.583/0.082/0.140 |
| 5 | 44838.528 | 45448.813 | 45054.979 | 0.931 | 0.0727 | < 0.001 | 0.109/0.104/0.580/0.134/0.073 |
Table 4.
Average attribution probability of two latent category models of cognitive flexibility.
| Category | Attribution probability | |
|---|---|---|
| Profile 1 (n = 745) | Profile 2 (n = 269) | |
| Profile 1 | 98.3% | 1.7% |
| Profile 2 | 4.8% | 95.2% |
As shown in Table 4; Fig. 1, students in Class 1 consistently scored lower than those in Class 2 across all 20 items, with an average score of approximately 3 points per item. Consequently, this group was designated as the “moderate cognitive flexibility group (moderate-CF group) “, comprising 73.5% (n = 745) of the sample. In contrast, Class 2 exhibited consistently higher scores and was labeled the “high cognitive flexibility group (high-CF group)”, representing 26.5% (n = 269) of the participants.
Fig. 1.

Latent profile plot based on the cognitive flexibility for high school students in Hebi, China (the x-axis shows the CFI entries, while the y-axis represents the mean score for the 20 items of the CFI). The two lines show the scores of the 2 categories on 20 items of the CFI. The left side of the dotted line denotes flexible controllability entries, while the right side indicates flexible selectivity entries.
Profile demographics and related characteristics
Univariate analysis revealed that the two latent profiles were significantly influenced by several factors, including gender, class cadre status, annual family income, high sensitivity and proactive personality, all of which were statistically significant (p < 0.05). Detailed results are presented in Table 5.
Table 5.
Univariate analysis of 2 latent classes of cognitive flexibility among 1014 students in hebi, china. apearson χ2 test, bMann-Whitney U test, HSC-21: highly sensitive child scale.21 items, EOE: ease of excitation, LST: low sensory threshold, AES: aesthetic sensitivity, PPS: proactive personality scale.
| Variables | The moderate-CF group(n = 745) | The high-CF group (n = 269) |
Z/χ2 | P |
|---|---|---|---|---|
| Gender | 12.323a | <0.001 | ||
| Male | 301(40.4%) | 142(53.3%) | ||
| Female | 444(59.6%) | 127(46.7%) | ||
| Age | 16(16 ~ 17) | 16(16 ~ 17) | −0.668b | 0.504 |
| Class cadre | ||||
| Yes | 127(17.0%) | 67(24.9%) | 7.892a | 0.005 |
| No | 618(83.0%) | 202(75.1%) | ||
| Family Structure | 3.378a | 0.066 | ||
| Only child | 17(2.3%) | 12(4.5%) | ||
| Child with siblings | 728(97.7%) | 257(95.5%) | ||
| Grade | 1.612a | 0.447 | ||
| Grade10 | 257(34.5%) | 102(37.9%) | ||
| Grade11 | 195(26.2%) | 61(22.7%) | ||
| Grade12 | 293(39.3%) | 106(39.4%) | ||
| Residence | 2.273a | 0.321 | ||
| Urban area | 122(16.4%) | 55(20.4%) | ||
| Rural area | 447(64.0%) | 164(61.0%) | ||
| Town area | 146(19.6%) | 20(18.6%) | ||
| Family income | −2.621b | 0.009 | ||
| ¥0-100,000 | 631(84.7%) | 209(77.7%) | ||
| ¥100,000-200,000 | 99(13.3%) | 51(19.0%) | ||
| ¥200,000-300,000 | 11(1.5%) | 9(3.3%) | ||
| ≥¥300,000 | 4(0.5%) | 0(0%) | ||
| HSC-21 | 4.524(4.143 ~ 4.952) | 4.714(4.190 ~ 5.286) | −3.565b | <0.001 |
| EOE | 4.571(4.000 ~ 5.143) | 4.286(3.571 ~ 5.143) | −2.251b | 0.024 |
| LST | 4.833(4.167 ~ 5.333) | 5.167(4.333 ~ 5.833) | −3.913b | <0.001 |
| AES | 4.375(4.000 ~ 4.875) | 4.875(4.250 ~ 5.375) | −7.633b | <0.001 |
| PPS | 44(42 ~ 46) | 47(44 ~ 53) | −10.804b | <0.001 |
Bold values indicate statistically significant differences among the variable groups.
To further investigate the influencing factors of cognitive flexibility, binary logistic regression analysis was conducted, with the moderate CF group as the reference category. Independent variables included gender, class cadre status, family income, factor scores of the three dimensions (EOE, LST, AES) of HSC-21, and sum scores of PPS. The results, present in Table 6, indicated that men were more likely to be classified in the high-CF group (OR = 1.414, 95% CI: 1.034–1.935). The EOE score exhibited a negative correlation with cognitive flexibility (OR = 0.608, 95% CI: 0.502–0.736), suggesting that higher EOE scores were associated with a greater likelihood of being in the moderate-CF group. Conversely, both the AES scores and PPS scores showed positive correlations with cognitive flexibility (OR = 1.774, 95% CI: 1.413–2.228; OR = 1.108, 95% CI: 1.080–1.137), indicating that individuals with higher AES and PPS scores were significantly more likely to be in the high-CF group.
Table 6.
Binary logistic regression analysis of 2 latent classes of cognitive flexibility among 1014 students in hebi, china. EOE: ease of excitation, LST: low sensory threshold, AES: aesthetic sensitivity, PPS: proactive personality scale.
| Variables | β | SE | OR | 95% CI | P |
|---|---|---|---|---|---|
| Gender | |||||
| Male | 0.347 | 0.160 | 1.414 | 1.034–1.935 | 0.030 |
| Class cadre | |||||
| Yes | 0.233 | 0.192 | 1.262 | 0.867–1.837 | 0.224 |
| Family income | |||||
| ¥100,000-200,000 | 0.296 | 0.210 | 1.344 | 0.891–2.029 | 0.159 |
| ¥200,000-300,000 | 0.041 | 0.530 | 1.042 | 0.368–2.945 | 0.938 |
| ≥¥300,000 | −19.662 | 19761.015 | 0.000 | 0.000 | 0.999 |
| EOE | −0.498 | 0.098 | 0.608 | 0.502–0.736 | <0.001 |
| LST | 0.096 | 0.110 | 1.101 | 0.887–1.367 | 0.383 |
| AES | 0.573 | 0.116 | 1.774 | 1.413–2.228 | <0.001 |
| PPS | 0.103 | 0.013 | 1.108 | 1.080–1.137 | <0.001 |
Bold values indicate statistically significant differences among the variable groups.
ROC curve evaluation model
The ability of CFI to distinguish between the high-CF group and the moderate-CF group was evaluated by receiver operating characteristic (ROC) curve. The area under the curve (AUC) reached its maximum value of 0.968 (95% CI: 0.957–0.978) at a cut-off value of 68.5. At this threshold, with a sensitivity of 0.862 and a specificity of 0.946 (Fig. 2).
Fig. 2.
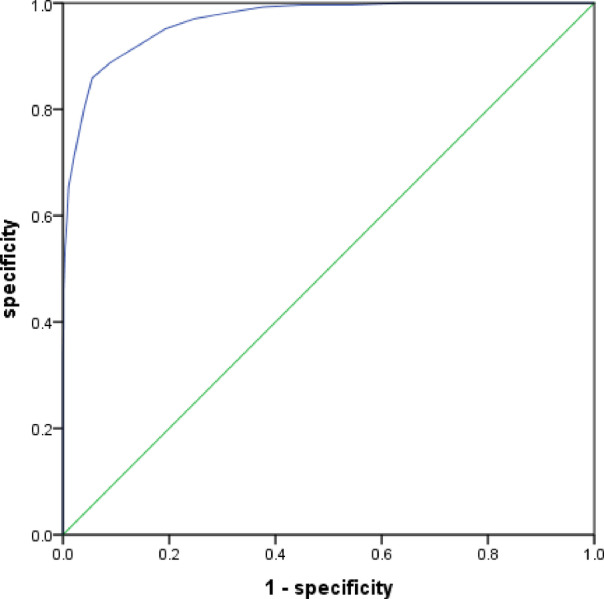
ROC curve of the CFI for differentiating the moderate-CF group.
Discussion
Our study focused on high school students in Hebi City, China and employed LPA to categorize their cognitive flexibility. In the current study, two distinct profiles of cognitive flexibility were identified: the moderate-CF group (73.5%) and the high-CF group (26.5%), which indicates significant heterogeneity in cognitive flexibility levels within this student population. Wang et al.41 examined the relationship between cognitive flexibility and emotional elasticity among Chinese college students through LPA, and categorized the students into three profiles: flexible (22.1%), moderate (68.1%) and rigid (9.8%). This study reveals that the proportion of individuals with high cognitive flexibility (26.5%) is comparable to the flexible group reported by Wang et al. (22.1%). For these students, educators can provide more challenging learning tasks and projects to stimulate their intrinsic motivation and foster critical and innovative thinking. The moderate-CF group is predominant among Chinese high school students, indicating that teachers should design teaching strategies grounded in cognitive flexibility theory or incorporate cognitive flexibility training into daily teaching practices to facilitate students’ gradual enhancement of flexibility. The teaching approach based on cognitive flexibility theory emphasizes diverse focus areas, offering varied presentation methods for the same learning content to students. This enhances students’ ability to apply knowledge and solve problems, facilitates the transition from passive to active learning, and encourages the flexible use of acquired knowledge in real-world challenges. For instance, Peng et al.42discovered in their study on nursing education in secondary vocational schools that students who adopt cognitive flexibility theory teaching method (organizing students to carry out collaborative learning, discussion and group evaluation, and taking six stages of teaching goal setting, basic scenario creation, random access learning, group cooperation, intensive practice and evaluation of learning outcomes) demonstrated superior assessment results compared to those who adopt traditional teaching method (teachers mainly teach theoretical knowledge and demonstrating experimental operations). In addition, research indicates that when children participate in sports training that demands high coordination, a rapid movement rhythm, and significant entertainment value (such as skipping rope, aerobics, and basketball), the activity of their bilateral PFC is enhanced43. This increased activity effectively stimulates brain regions associated with executive function, thereby positively influencing children’s cognitive flexibility. Game-based cognitive flexibility training has the potential to enhance cognitive flexibility throughout the growth stage, especially for children and adolescents44. Nevertheless, it is crucial to ensure far transfer of training benefits to real-life scenarios. Cognitive-behavioral therapy (CBT) empowers individuals to identify and challenge irrational thinking patterns, thereby transforming their behaviors and emotional responses45. By employing cognitive restructuring and behavioral experiments, CBT effectively dismantles rigid thought processes and replaces them with more flexible and positive ways of thinking. For members with rigid thinking, the CBT model should be adopted. The mindfulness-based cognitive therapy program can also reduce depression, anxiety, stress and increase cognitive flexibility levels among nursing students46. Considering the heavy academic pressure, numerous courses, and significant regional disparities among Chinese high school students, no research has specifically focused on teaching methods aimed at enhancing cognitive flexibility for this group. Further investigation and exploration in this area are warranted. In the study by Wang et al., it was found that 9.8% of high school students exhibited rigid thinking patterns, which may be attributed to the different scales utilized in the two studies. It highlights the need for timely identification and attention to individuals with exceptionally low cognitive flexibility. When necessary, teachers should establish communication and collaboration with parents, and implement one-on-one tutoring to help these students break through fixed thinking patterns, thereby enhancing their cognitive flexibility and academic performance as soon as possible.
This study revealed significant differences among students in various cognitive flexibility categories with respect to gender, EOE, AES, and proactive personality. The cognitive flexibility of males is higher than females, which aligns with the findings from Qi47. This phenomenon may originate from the distinct gender role socialization processes experienced by males and females. Traditional societal norms dictate that boys should cultivate traits such as independence, adventurousness, and competitiveness, which encourages them to explore new experiences and challenge themselves, thereby fostering cognitive flexibility. In contrast, girls are often socialized to exhibit gentleness in character and precision in behavior, leading them to prefer established and stable methods of accomplishing tasks. This may also be attributed to the relatively high academic pressure and increased number of stressful events during high school stage. Estrogen exacerbates the stress response via the hypothalamic-pituitary-adrenal axis. Additionally, estrogen influences orexin neurons in the lateral hypothalamus, making female cognitive flexibility more susceptible to impairment48,49. In the studies on cognitive flexibility among college students by Martin et al.31 and among adolescents by Wu et al.34no significant gender differences were observed. This may be related to the version of the scale and the characteristics of the tested populations, and suggest the influence of gender on cognitive flexibility depends on different populations as well.
Environmental sensitivity exerts a profound and enduring influence on individual development. Individuals with high sensitivity are not only more susceptible to adverse effects in high-risk environments but also more receptive to positive influences in supportive environments24,50. Hence, it is imperative to differentiate the impact of various dimensions of environmental sensitivity on cognitive flexibility. Previous research demonstrates that the three-factor model of Highly Sensitive Person Scale exhibits robust reliability, validity, and an excellent fitness51,52. This study employed the Chinese version of HSC (including three factors) to examine its impact on cognitive flexibility. The results indicated higher AES scores and lower EOE scores were associated with greater cognitive flexibility, while LST did not have a statistically significant effect on cognitive flexibility. EOE refers to the extent of an individual’s cognitive, emotional, and physiological reactions elicited in response to external stimuli. AES is more likely to mirror an individual’s heightened sensitivity to positive stimuli. Individuals with higher AES scores demonstrate superior integration of emotions and cognition, enabling them to consider problems from multiple perspectives and fostering enhanced creative thinking53. Therefore, it is recommended that high school students participate in artistic activities, practice mindfulness meditation, and engage in interdisciplinary learning to improve cognitive flexibility. Individuals characterized by high EOE may exhibit profoundly intense emotional responses when encountering stress, which can impair the capacity of cognitive regulatory and consequently lead to a reduction in cognitive flexibility54。Chinese high school students experience intense academic pressure immediately upon entering senior high school. Therefore, students with higher EOE are prone to developing negative emotions such as anxiety and depression, which can subsequently impair cognitive function. LST represents the sensory threshold for external stimuli, highlighting an individual’s susceptibility to perceiving such stimuli. Individuals with low LST may be more susceptible to stressors or subtle environmental changes, leading to increased distractibility and diminished cognitive flexibility55。However, this study did not find a significant impact of LST on cognitive flexibility. This may be attributed to the typically structured and monotonous learning environment of high school students. Prolonged exposure to a high-pressure setting could lead to an adaptation among students with varying sensory thresholds, thereby diminishing the observable effects of LST.
The scale utilized in this study differentiates EOE from LST, whereas the study conducted by Smolewska and Evans integrates LST and EOE into a single factor for analysis56,57. Although a correlation exists between two dimensions, they exhibit distinct sensitivity characteristics: LST is more closely associated with sensitivity to external stimuli, whereas EOE pertains to the emotional and behavioral responses of individuals under external pressures. Our findings further validate the applicability and validity of the three-factor model among Chinese adolescents. This distinction not only enhances understanding of the characteristics of highly sensitive individuals with greater precision, but also offers a more targeted theoretical foundation for research on cognitive flexibility.
This study revealed a positive correlation between proactive personality scores and cognitive flexibility among high school students, aligning with prior research findings30. This could be because individuals with a high proactive personality tend to adjust their strategies more frequently when facing challenges, optimize their cognitive and behavioral processes, and mobilize resources more effectively to cope with environmental changes29. Individuals with a high proactive personality tend to experience more positive emotions. In this emotional state, they are more likely to exhibit cognitive flexibility and adapt effectively to novel situations58. Furthermore, individuals who exhibit an exceptionally proactive attitude are likely to possess an enhanced sense of self-efficacy, which significantly boosts their capability to overcome challenges.
Univariate analysis revealed that students who were class cadres and had higher family income possessed a higher proportion of belonging to high-CF group. However, the logistic regression analysis indicated that these factors did not have a significant influence. This may be attributed to the impact of other variables, which could have mitigated the effects of class cadre and family income on cognitive flexibility. Students who serve as class cadres must manage a wide range of interpersonal relationships, demonstrating a heightened sense of responsibility and self-regulation. Consequently, their cognitive flexibility tends to be more pronounced59. whereas, serving as a class cadre is also influenced by individual personality traits, classroom atmosphere, and the teachers’ management style. The relationship between class cadre and cognitive flexibility merits further exploration. Children from families with higher income have access to more abundant educational resources, receive more adequate psychological support, and benefit from a more harmonious family environment19. These students tend to develop more effective coping strategies, which positively influences their cognitive flexibility60.
The diagnostic efficacy of the CFI in distinguishing the high-CF group from the moderate-CF group was assessed by ROC curve analysis. When the cutoff value was set at 68.5, the AUC reached its peak at 0.968 (95% CI: 0.957–0.978), with the sensitivity of 86.2% and the specificity of 94.6%. Students scoring below 68.5 on the CFI are classified into the moderate-CF group, whereas those scoring above 68.5 fall into the high-CF group. To date, no studies have been identified that utilize ROC curve analysis to assess the diagnostic efficacy of the CFI in differentiating between distinct cognitive flexibility groups. The results indicate educators and parents focus on children’s mental health status using this cutoff value. Upon identifying individuals with relatively low cognitive flexibility, targeted psychological interventions, including cognitive behavioral therapy or mindfulness meditation, can be implemented to enhance their emotional regulation and cognitive flexibility.
This study has several limitations. Firstly, the sample was limited to high school students in Hebi City, China, which may not be representative of the broader national high school student population. Given the significant economic, cultural, and geographical variations across different provinces and cities, there is considerable heterogeneity among high school student populations, future research should aim to conduct multi-center studies with larger sample sizes to enhance generalizability. Secondly, this study employed a cross-sectional design, which precludes the establishment of causal relationships. Future investigations should consider longitudinal designs to comprehensively understand the dynamic changes in cognitive flexibility. Lastly, this study relied on self-reported data from students, which may introduce reporting bias.
In the current study, we identified two distinct latent profiles, revealing heterogeneity in cognitive flexibility among Chinese high school students. Furthermore, our research suggests that four key factors (gender, EOE, AES, and PPS) play critical roles in cognitive flexibility of high school students. We also provide a practical tool for identifying individuals with moderate cognitive flexibility by establishing a well-defined cut-off value for the CFI.
Acknowledgements
The authors acknowledge the students who participated in the study.
Author contributions
Huapeng Guan: Conceptualization, Writing - original draft. Ruikang Hu: Date curation, Formal analysis, Investigation. Ziyue Zhang: Date curation, Software, Validation, Supervision. MengTing Shu: Project administration, Methodology. Zhen Wang: Validation, Writing - review & editing. Wen Wu: Formal analysis, Investigation, Writing - review & editing.
Funding
No.
Data availability
The datasets used and analyzed during the current study are available from the corresponding author on reasonable request.
Declarations
Competing interests
The authors declare no competing interests.
Footnotes
Publisher’s note
Springer Nature remains neutral with regard to jurisdictional claims in published maps and institutional affiliations.
Huapeng Guan, Ruikang Hu and Ziyue Zhang contributed equally to this work.
Contributor Information
Zhen Wang, Email: swzwang@126.com.
Wen Wu, Email: wuwen18301966750@163.com.
References
- 1.Spiro, R. J., Feltovich, P. J., Jacobson, M. J. & Coulson, R. L. Cognitive flexibility, constructivism, and hypertext: Random access instruction for advanced knowledge acquisition in ill-structured domains. educational technology (1992).
- 2.Dajani, D. R. & Uddin, L. Q. Demystifying cognitive flexibility: implications for clinical and developmental neuroscience. Trends Neurosci.38, 571–578 (2015). [DOI] [PMC free article] [PubMed] [Google Scholar]
- 3.Diamond, A., Executive & Functions Ann. Rev. Psychol.64, 135–168 (2013). [DOI] [PMC free article] [PubMed] [Google Scholar]
- 4.Martin, M. M. Rubin. A new measure of cognitive flexibility. Psychol. Rep.76 (2), 623–626 (1995). [Google Scholar]
- 5.Kramer, A. F., Humphrey, D. G., Larish, J. F., Logan, G. D. & Strayer, D. L. Aging and inhibition: beyond a unitary view of inhibitory processing in attention. Psychol. Aging. 9, 491–512 (1994). [PubMed] [Google Scholar]
- 6.Miyake, A. & Friedman, N. P. The nature and organization of individual differences in executive functions: four general conclusions. Curr. Dir. Psychol. Sci.21, 8–14 (2012). [DOI] [PMC free article] [PubMed] [Google Scholar]
- 7.Seeley, W. W. et al. Dissociable intrinsic connectivity networks for salience processing and executive control. J. Neuroscience: Official J. Soc. Neurosci.27, 2349–2356 (2007). [DOI] [PMC free article] [PubMed] [Google Scholar]
- 8.Uddin, L. Q. Cognitive and behavioural flexibility: neural mechanisms and clinical considerations. Nat. Rev. Neurosci.22, 167–179 (2021). [DOI] [PMC free article] [PubMed] [Google Scholar]
- 9.Kim, K. L. et al. Cognitive performance of youth with primary generalized anxiety disorder versus primary obsessive-compulsive disorder. Depress. Anxiety. 36, 130–140 (2019). [DOI] [PubMed] [Google Scholar]
- 10.Somerville, L. H. Searching for signatures of brain maturity: what are we searching for?? Neuron92, 1164–1167 (2016). [DOI] [PubMed] [Google Scholar]
- 11.Norona, J. C., Roberson, P. N. & Welsh, D. P. Rejection sensitivity and depressive symptoms: longitudinal actor-partner effects in adolescent romantic relationships. J. Adolesc.51, 6–18 (2016). [DOI] [PubMed] [Google Scholar]
- 12.Steare, T., Gutiérrez Muñoz, C., Sullivan, A. & Lewis, G. The association between academic pressure and adolescent mental health problems: A systematic review. J. Affect. Disord.339, 302–317 (2023). [DOI] [PubMed] [Google Scholar]
- 13.Zühlsdorff, K., Dalley, J. W., Robbins, T. W. & Morein-Zamir, S. Cognitive flexibility: neurobehavioral correlates of changing one’s Mind. Cereb. Cortex (New York N Y : 1991). 33, 5436–5446 (2023). [DOI] [PMC free article] [PubMed] [Google Scholar]
- 14.Almutawa, S. S. et al. The influence of cognitive flexibility on research abilities among medical students: cross-section study. BMC Med. Educ.25, 7 (2025). [DOI] [PMC free article] [PubMed] [Google Scholar]
- 15.Li, M., Shen, D. & Bai, X. A research on cognitive flexibility of students in different grades. Chinese J. Special Education, 80–86 (2007).
- 16.Santana, A. N., Roazzi, A. & Nobre, A. The relationship between cognitive flexibility and mathematical performance in children: A meta-analysis. Trends Neurosci. Educ.28, 100179 (2022). [DOI] [PubMed] [Google Scholar]
- 17.Clearfield, M. W. & Niman, L. C. SES affects infant cognitive flexibility. Infant Behav. Dev.35, 29–35 (2012). [DOI] [PubMed] [Google Scholar]
- 18.Zeytinoglu, S., Calkins, S. D. & Leerkes, E. M. Maternal emotional support but not cognitive support during problem-solving predicts increases in cognitive flexibility in early childhood. Int. J. Behav. Dev.43, 12–23 (2019). [DOI] [PMC free article] [PubMed] [Google Scholar]
- 19.Rosen, M. L. et al. Cognitive stimulation as a mechanism linking socioeconomic status with executive function: A longitudinal investigation. Child Dev.91, e762–e779 (2020). [DOI] [PMC free article] [PubMed] [Google Scholar]
- 20.Yang, J. et al. Only-child and non-only-child exhibit differences in creativity and agreeableness: evidence from behavioral and anatomical structural studies. Brain Imaging Behav.11, 493–502 (2017). [DOI] [PubMed] [Google Scholar]
- 21.Baryła-Matejczuk, M., Kata, G. & Poleszak, W. Environmental sensitivity in young adolescents: the identification of sensitivity groups in a Polish sample. PloS One. 17, e0271571 (2022). [DOI] [PMC free article] [PubMed] [Google Scholar]
- 22.Lionetti, F. & Pluess, M. The role of environmental sensitivity in the experience and processing of emotions: implications for well-being. Philos. Trans. R. Soc. Lond. B Biol. Sci.379, 20230244 (2024). [DOI] [PMC free article] [PubMed] [Google Scholar]
- 23.Aron, E. N. & Aron, A. Sensory-processing sensitivity and its relation to introversion and emotionality. J. Personal. Soc. Psychol.73, 345–368 (1997). [DOI] [PubMed] [Google Scholar]
- 24.Ellis, B. J. & Boyce, W. T. Differential susceptibility to the environment: toward an Understanding of sensitivity to developmental experiences and context. Dev. Psychopathol.23, 1–5 (2011). [DOI] [PubMed] [Google Scholar]
- 25.Boterberg, S., Warreyn, P. J. P. & Differences, I. Making sense of it all: the impact of sensory processing sensitivity on daily functioning of children. 92, 80–86 (2016).
- 26.Ochsner, K. N. & Gross, J. J. The cognitive control of emotion. Trends Cogn. Sci.9, 242–249 (2005). [DOI] [PubMed] [Google Scholar]
- 27.Acevedo, B. P. et al. The highly sensitive brain: an fMRI study of sensory processing sensitivity and response to others’ emotions. Brain Behav.4, 580–594 (2014). [DOI] [PMC free article] [PubMed] [Google Scholar]
- 28.Yano, K. & Oishi, K. Individual differences in environmental sensitivity: associations between cognitive emotion regulation and mental health. Front. Psychol.15, 1322544 (2024). [DOI] [PMC free article] [PubMed] [Google Scholar]
- 29.Bateman, T. S. C. Michael the proactive component of organizational behavior: A measure and correlates. J. Organizational Behav.14 (2), 103–118 (1993). [Google Scholar]
- 30.Crant, J. M. Proactive behavior in organizations. J. Manag.26, 435–462 (2000). [Google Scholar]
- 31.Martin, M. M. & Rubin, R. B. A NEW MEASURE OF COGNITIVE FLEXIBILITY. Psychol. Rep.76, 623–626 (2011). [Google Scholar]
- 32.Cai, Y. The role of the school innovative climate in the relationship between proactive personality and creative behavior among students from Chinese normal colleges. Humanities Social Sci. Communications11, 1–8 .
- 33.Anthony, E. K. & Robbins, D. E. A latent class analysis of resilient development among early adolescents living in public housing. Child Youth Serv. Rev.35, 82–90 (2013). [Google Scholar]
- 34.Băjenaru, L., Balog, A., Dobre, C., Drăghici, R. & Prada, G. I. Latent profile analysis for quality of life in older patients. BMC Geriatr.22, 848 (2022). [DOI] [PMC free article] [PubMed] [Google Scholar]
- 35.Wang, Y., Yang, Y., Xiao, W. & Su, Q. Validity and reliability of the Chinese version of the cognitive flexibility inventory in college students. Chin. Mental Health J.30, 58–63 (2016). [Google Scholar]
- 36.Weyn, S. et al. Improving the measurement of environmental sensitivity in children and adolescents: the highly sensitive child Scale-21 item version. Assessment29, 607–629 (2022). [DOI] [PubMed] [Google Scholar]
- 37.Shang, J. & Gan, Y. Analysis of the effects of the proactive personality on graduates career Decision-Making Self-Efficacy. Acta Scientiarum Naturalium Universitatis Pekinensis. 45, 548–554 (2009). [Google Scholar]
- 38.Lubke, G. & Muthén, B. O. J. S. E. M. A. M. J. Performance of factor mixture models as a function of model size, covariate effects, and Class-Specific parameters. 14, 26–47 (2007).
- 39.Bollen, K. & Stine, R. A. Bootstrapping Goodness-of-Fit measures in structural equation models. Sociol. Methods Res.21 (2), 205–229 (1992). [Google Scholar]
- 40.Gao, S., Mokhtarian, P. L. & Johnston, R. A. Nonnormality of data in structural equation models. Transp. Res. Rec.2082, 116–124 (2018). [Google Scholar]
- 41.Wang, Y. & Jia, N. Cognitive Flexibility and Emotional Elasticity of High School Students: APotential Profile Analysis.in The 25th National Academic Conference of Psychology. (2023).
- 42.Zhao, M. et al. Application of cognitive flexibility theory in the lab sessions of fundamentalss of nursing. China High. Med. Education, 65–67 (2019).
- 43.Xie, C., Zhou, H. & Jin, Y. Effects of physical activities on cognitive flexibility of Chinese children and adolescents: a Meta-analysis. Chin. J. School Health. 42, 7 (2021). [Google Scholar]
- 44.Johann, V. E. & Karbach, J. Effects of game-based and standard executive control training on cognitive and academic abilities in elementary school children. Dev. Sci.23, e12866 (2020). [DOI] [PubMed] [Google Scholar]
- 45.Hofmann, S. G., Asnaani, A., Vonk, I. J., Sawyer, A. T. & Fang, A. The efficacy of cognitive behavioral therapy: A review of Meta-analyses. Cogn. Therapy Res.36, 427–440 (2012). [DOI] [PMC free article] [PubMed] [Google Scholar]
- 46.Acikgoz, F. & Karaca, A. The effect of a mindfulness-based cognitive therapy program on depression, anxiety, stress, and cognitive flexibility in nursing students: A randomized clinical trial. J. Prof. Nursing: Official J. Am. Association Colleges Nurs.56, 94–103 (2025). [DOI] [PubMed] [Google Scholar]
- 47.Qi, B. & Zhang, J. Revision and preliminary application of the cognitive flexibility scale for high school students. J. BAODING Univ.26, 5 (2013). [Google Scholar]
- 48.Oyola, M. G. & Handa, R. J. Hypothalamic-pituitary-adrenal and hypothalamic-pituitary-gonadal axes: sex differences in regulation of stress responsivity. Stress (Amsterdam Netherlands). 20, 476–494 (2017). [DOI] [PMC free article] [PubMed] [Google Scholar]
- 49.Gargiulo, A. T. et al. Sex differences in cognitive flexibility are driven by the estrous cycle and stress-dependent. Front. Behav. Neurosci.16, 958301 (2022). [DOI] [PMC free article] [PubMed] [Google Scholar]
- 50.Obradović, J. & Boyce, W. T. Individual differences in behavioral, physiological, and genetic sensitivities to contexts: implications for development and adaptation. Dev. Neurosci.31, 300–308 (2009). [DOI] [PubMed] [Google Scholar]
- 51.Jiang, S., Tao, Y. & Pubuzhuoma Validity and reliability of the Chinese version of the highly sensitive children’s Scale-21 item version in middle school students. Chin. Mental Health J.37, 795–800 (2023). [Google Scholar]
- 52.Ferensztajn-Rochowiak, E. et al. Polish adaptation and validation of the standard 27-item highly sensitive person scale. Psychiatria Polska, 1–21 (2024). [DOI] [PubMed]
- 53.Jagiellowicz, J. et al. The trait of sensory processing sensitivity and neural responses to changes in visual scenes. 6, 38–47 (2011). [DOI] [PMC free article] [PubMed]
- 54.Aron, E. N., Aron, A., Jagiellowicz, J. J. P., Personality, S. P. R. & Inc, S. P. A. O. J. o. t. S. f. Sensory processing sensitivity: a review in the light of the evolution of biological responsivity. 16, 262 (2012). [DOI] [PubMed]
- 55.Greven, C. U. et al. Sensory Processing Sensitivity in the context of Environmental Sensitivity: A critical review and development of research agenda. (2019). [DOI] [PubMed]
- 56.Smolewska, K. A., Mccabe, S. B., Woody, E. Z. J. P. & Differences, I. A psychometric evaluation of the highly sensitive person scale: the components of sensory-processing sensitivity and their relation to the BIS/BAS and big five. 40, 1269–1279 (2006).
- 57.Evans, D. E., Rothbart, M. K. J. P. & Differences, I. Temperamental sensitivity: two constructs or one? 44, 108–118 (2008).
- 58.Fredrickson, B. L. The role of positive emotions in positive psychology. The broaden-and-build theory of positive emotions. Am. Psychol.56, 218–226 (2001). [DOI] [PMC free article] [PubMed] [Google Scholar]
- 59.Zheng, W., Akaliyski, P., Ma, C. & Xu, Y. Cognitive flexibility and academic performance: individual and cross-national patterns among adolescents in 57 countries. Pers. Indiv. Differ.217, 112455 (2024). [Google Scholar]
- 60.Liu, C., Chen, H., Xu, W., Dai, S. & Lin, S. The mediating role of cognitive flexibility in home-school co-education and psychological well-being among Chinese vocational college students. Front. Psychol.15, 1422845 (2024). [DOI] [PMC free article] [PubMed] [Google Scholar]
Associated Data
This section collects any data citations, data availability statements, or supplementary materials included in this article.
Data Availability Statement
The datasets used and analyzed during the current study are available from the corresponding author on reasonable request.